freight panel online system and benchmarking tool for transportation costs analysis
TRANSCRIPT

Freight Panel
Online System and Benchmarking Tool for
Transportation Costs Analysis

Index
Comparative Analysis
Interactive Analysis
2
Online System
Benchmarking Tool for Transportation Costs Analysis

3
Online System
Home
1st Step:Login with your
company's
username and
password

4
Online System
Graph Selection
2nd StepOn menu bar, click
Dynamic Graphs
(Gráficos Dinâmicos) 3rd StepClick the graph
you want to use to
select it
5
Online System
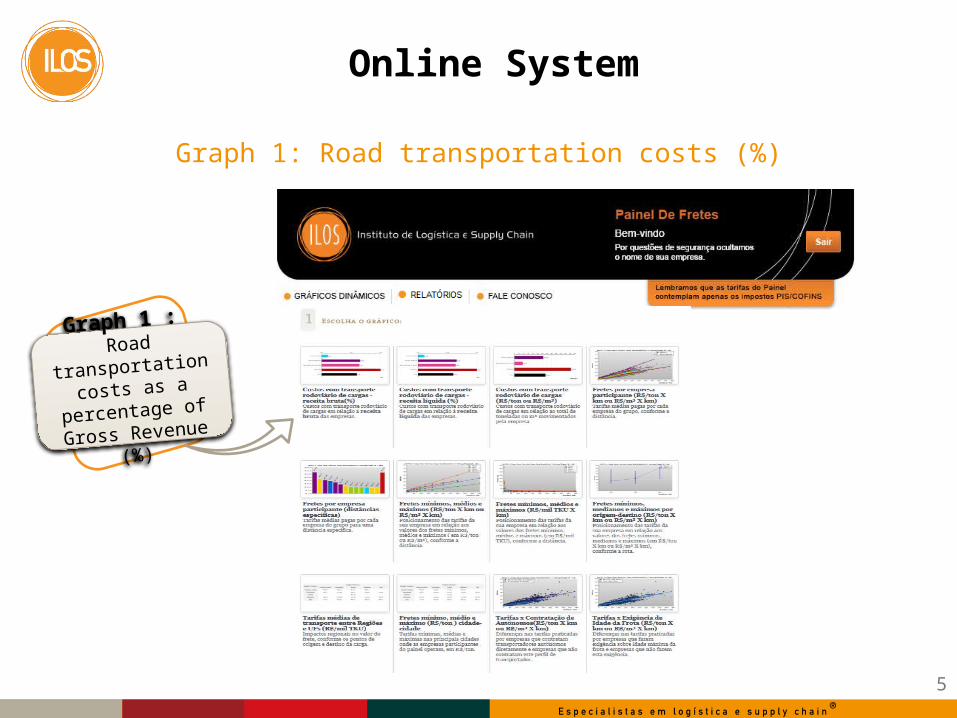
Graph 1: Road transportation costs (%)
Graph 1 : Road transportation
costs as a percentage
of Gross Revenue (%)

6
Online System
Graph 1: Road transportation costs (%)
4th Step : Select the
transportation
activity

7
Online System
Graph 1: Road transportation costs (%)
Each bar represents an
economic sector and the
red bar represents your
company
This graph shows that the transportation costs of your
company represent a smaller portion of net revenues,
compared with the average of all participating companies.
EXAMPLE

8
Online System
Graph 2 : Road transportation costs (%)
Graph 2:Road transportation
costs as a percentage
of Net Revenue (%)

9
Online System
Graph 2 : Road transportation costs (%)
4th Step : Select
the transportation
activity

10
Online System
Graph 2 : Road transportation costs (%)
Each bar represents an
economic sector and the
red bar represents your
company
According to the graph, your company’s transfer costs (per tonne) are lower than
the average of all participating companies although they are higher
than the average paid by the Cement & Other Building Materials sector and the
Personal & Home Care sector.
EXAMPLE

11
Online System
Graph 3: Road transportation costs (R$/tonne or R$/m³)
Graph 3:
Road transportation costs per
total tonnes (or m³)
transported

12
Online System
Graph 3: Road transportation costs (R$/tonne or R$/m³)
4th Step :Select the freight rate
(R$/tonne or R$/m3)
5th Step:Select the
transportation
activity

13
Online System
Graph 3: Road transportation costs (R$/tonne or R$/m³)
According to the graph, the transfer costs (per tonne) are lower than the
average of almost all economic sectors, except for the Cement & Other
Building Materials sector.
Each bar represents an
economic sector and
the red bar represents
your company
EXAMPLE

14
Online System
Graph 4: Freight rate per participating company (R$ / tonne or R$/ m³ x km)
Graph 4: Freight
rate per participating
company (R$ / tonne
or R$/ m³ x km)

15
Online System
Graph 4: Freight rate per participating company (R$ / tonne or R$/ m³ x km)
4th Step :
Select the freight
rate (R$/tonne or
R$/m3)
5th Step:Select the
transportation
activity
6th Step : Select the profile to
be compared

16
Online System
Graph 4: Freight rate per participating company (R$ / tonne or R$/ m³ x km)
After selecting the payment
method, the type of
transportation activity and the
transportation profile, select
with which sectors you want
to be compare with

17
Online System
Graph 4: Freight rate per participating company (R$ / tonne or R$/ m³ x km)
Each line represents a company. This graph shows that your company (red line) is more
competitive than some companies from Personal &
Home Care and Food & Beverages (green line) Sectors,
for example.
EXAMPLE

18
Online System
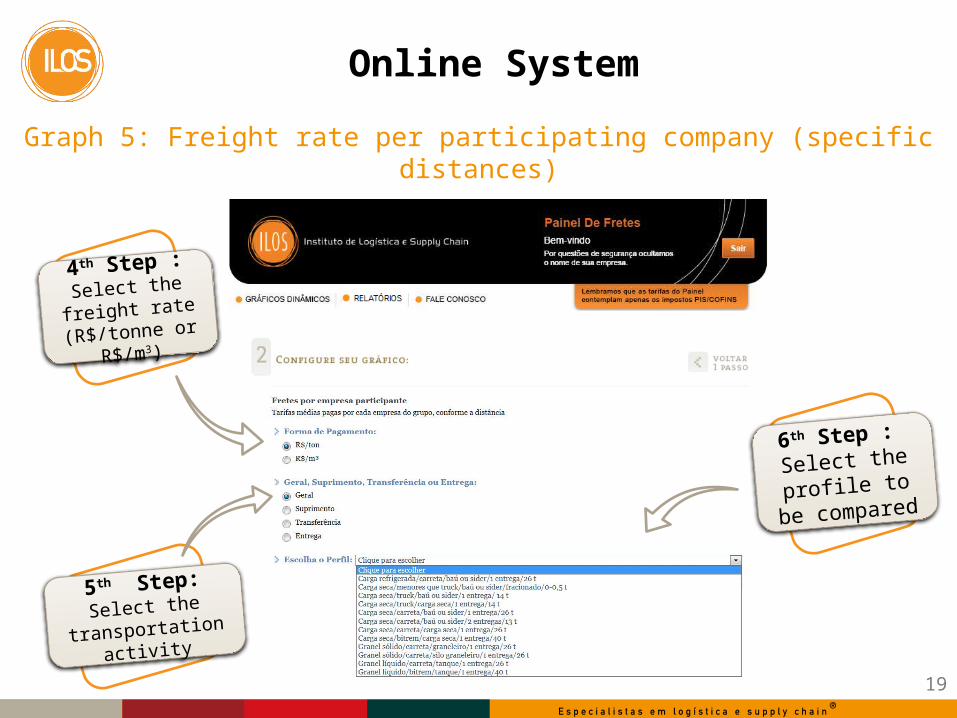
Graph 5: Freight rate per participating company (specific distances)
Graph 5:Freight rate per
participating
company (specific
distances)
19
Online System
Graph 5: Freight rate per participating company (specific distances)
4th Step :Select the freight
rate (R$/tonne or
R$/m3)
5th Step:Select the
transportation activity
6th Step :
Select the profile
to be compared

20
Online System
Graph 5: Freight rate per participating company (specific distances)
After selecting the payment
method, the transportation
activity and the
transportation profile, select
with which sectors you want
to be compare with

21
Online System
Graph 5: Freight rate per participating company (specific distances)
Each column represents a company, and your company (red bar) pays higher freight
rates than most of other participating companies, such as the ones from Personal & Home Care Sector (purple bar) in a 0-
50 km distance range.
EXAMPLE

22
Online System
Graph 6 : Minimum, average and maximum freight rate (R$ / tonne or R$ / m³ x km)
Graph 6 :
Minimum, average and
maximum freight rate
(R$ / tonne or R$ / m³ x km)

23
Online System
Graph 6 : Minimum, average and maximum freight rate (R$ / tonne or R$ / m³ x km)
4th Step :
Select the freight
rate (R$/tonne or
R$/m3 x km)
5th Step:Select the
transportation
activity
6th Step :
Select the profile to
be compared

24
Online System
Graph 6: Minimum, average and maximum freight rate (R$/tonne or R$/m³ x km)
After selecting the
payment method, the
transportation activity
and the transportation
profile, select which
sectors you want to be
compared with

25
Online System
Graph 6: Minimum, average and maximum freight rate (R$/tonne or R$/m³ x km)
XX
This chart shows that your company’s freights curve is lower than the average of
the participating companies.
The table supports the graph analysis. Columns represent the distance ranges (km), the number of routes in each range, the minimum, average and
maximum freight rates and your company’s freight rate.
EXAMPLE

26
Online System
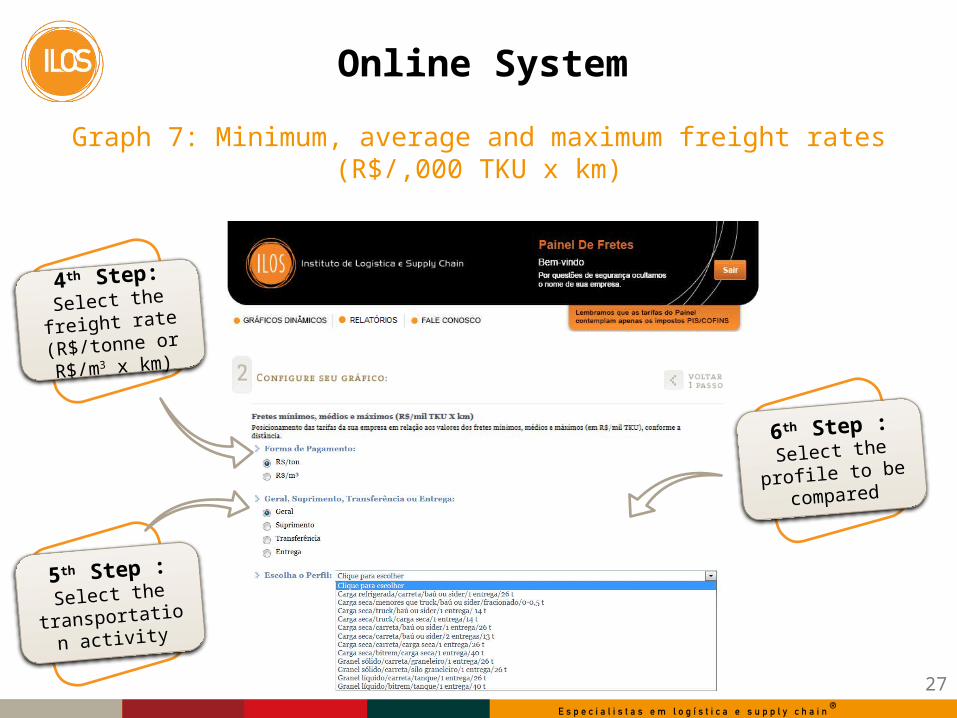
Graph 7: Minimum, average and maximum freight rates (R$/,000 TKU x km)
Graph 7:
Minimum, average and
maximum freights (R$/,000
TKU x km)
27
Online System
4th Step:Select the freight
rate (R$/tonne or
R$/m3 x km)
5th Step :Select the
transportation
activity
6th Step :Select the profile to
be compared
Graph 7: Minimum, average and maximum freight rates (R$/,000 TKU x km)

28
Online System
Gráfico 7: Minimum, average and maximum freights (R$/,000 TKU x km)
This chart shows that your company’s freights curve (R$/,000 TKU) is lower the average of
participating companies.
The table supports the graph analysis. Columns represent the distance ranges (km), the number of routes in each
range, the minimum, average and maximum freight rates and your company’s freight rate.
EXAMPLE

29
Online System
Graph 8: Minimum, average and maximum freight rates by origin-destination (R$/tonne or R$/m³ x km)
Graph 8:
Minimum, average and
maximum freights by
origin-destination (R$/tonne
or R$/m³ x km)

30
Online System
Graph 8: Minimum, average and maximum freight rates by origin-destination (R$/tonne or R$/m³ x km)
4th Step:
Select the freight
rate (R$/tonne or
R$/m3 x km)
5th Step :Select the
transportation
activity
6th Step :Select the
profile to be
compared

31
Online System
Graph 8: Minimum, average and maximum freight rates by origin-destination (R$/tonne or R$/m³ x km)
Select the type of origin-
destination comparison:
Region-Region, State-State
or State-Region
After selecting the payment
method, the transportation
activity and the transportation
profile, select with which sectors
you want to be compared with

32
Online System
Graph 8: Minimum, average and maximum freight rates by origin-destination (R$/tonne or R$/m³ x km)
This graph shows the freight rates average curve and the maximum and minimum values ,
highlighting in red the freight rates paid by your company according to the specified distances.
This table shows the values of minimum, median and maximum freight rates comparing with your company
freight rates. The lower table shows the number of occurrences in which the maximum and minimum values
were achieved by your company.
EXAMPLE
33
Online System
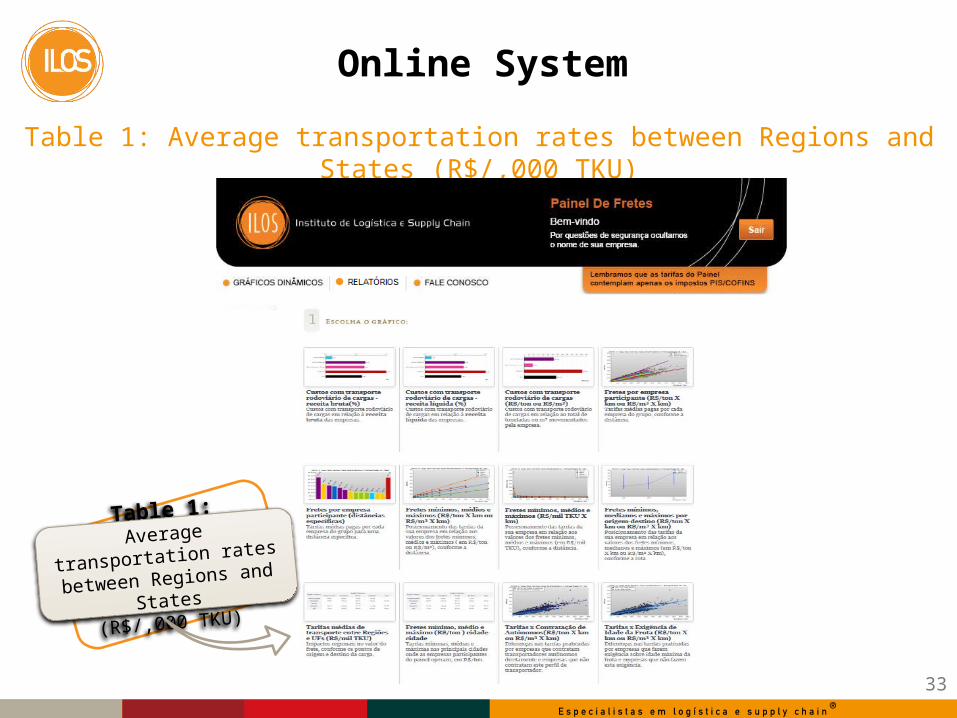
Table 1: Average transportation rates between Regions and States (R$/,000 TKU)
Table 1:
Average transportation rates
between Regions and States
(R$/,000 TKU)

34
Online System
Table 1: Average transportation rates between Regions and States (R$/,000 TKU)
5th Step :Select the
transportation
activity
4th Step :
Select the freight
rate (R$/tonne
or R$/m3 x km)
6th Step :Select the
profile to be
compared

35
Online System
Table 1: Average transportation rates between Regions and States (R$/,000 TKU)
Select the type of origin-
destination comparison: Region-
Region, State-State or State-
Region
After selecting the payment
method, the transportation
activity and the transportation
profile, select with which sectors
you want to be compared with

36
Online System
Table 1: Average transportation rates between Regions and States (R$/,000 TKU)
>
Considering the selected profile, the freight rate paid on routes
from Southeast Region to Northeast Region (average of R$ 159,66) are more expensive
than those on the opposite direction (average of R$
110,14).
EXAMPLE

37
Online System
Table 2: Minimum, average and maximum freight rates city-city (R$/tonne x km)
Table 2:
Minimum, average and
maximum freight rate
city-city
(R$/tonne x km)

38
Online System
Table 2: Minimum, average and maximum freight rate city-city (R$/tonne x km)
4th Step :Select the profile to
be compared with

39
Online System
Table 2: Minimum, average and maximum freight rate city-city (R$/tonne x km)
This table contains the values of minimum, average and
maximum freight rates between the main cities where the participating companies
operate.
EXAMPLE

40
Online System
Graph 9: Freight Rates x Hiring Self-employed drivers (R$/tonne or R$/m³ x km)
Graph 9:Freight Rates x Hiring
Self-employed drivers
(R$/tonne or R$/m³ x
km)

41
Online System
Graph 9: Freight Rates x Hiring Self-employed drivers (R$/tonne or R$/m³ x km)
5th Step :Select the
transportation
activity
4th Step :
Select the freight
rate (R$/tonne or
R$/m3 x km)
6th Step :
Select the profile
to be compared
After selecting the payment
method, the transportation
activity and the
transportation profile, select
with which sectors you want
to be compared with

42
Online System
Graph 9: Freight Rates x Hiring Self-employed drivers (R$/tonne or R$/m³ x km)
According to this chart, companies that do not hire self-employed drivers (dark
blue line), pay a higher freight rate than those who hire them (light blue line).
EXAMPLE

43
Online System
Graph 10: Freight Rates x Fleet Age Requirement (R$/tonne or R$/m 3 x km)
Graph 10:Rates x Fleet Age
Requirement
(R$/tonne or R$/m3 x
km)

44
Online System
Graph 10: Freight Rates x Fleet Age Requirement (R$/tonne or R$/m 3 x km)
5th Step :Select the
transportation
activity
4th Step :
Select the freight
rate (R$/tonne or
R$/m3 x km)
After selecting the payment method,
the transportation activity and the
transportation profile, select with
which sectors you want to be
compared with
6th Step :Select the profile
to be compared

45
Online System
Graph 10: Freight Rates x Fleet Age Requirement (R$/tonne or R$/m3 x km)
According to this chart, companies that do not require a maximum age of the
fleet (dark blue line) pay a lower freight than those that require (light blue line).
EXAMPLE

46
Online System
PDF File available to download
2nd Step :On menu bar, click
Relatórios (Report)

47
Online System
PDF File available to download
3rd Step :Generate the
desired reports
in PDF format

Index
48
Comparative Analysis
Interactive Analysis
Online System
Benchmarking Tool for Transportation Costs Analysis

49
Benchmarking Tool for Transportation Costs Analysis
Home Screen
After reading the
instructions, click
INICIAR to start
using the tool.

50
Benchmarking Tool for Transportation Costs Analysis
Main Menu
Select the
characteristics of
the route to be
evaluated.

51
Benchmarking Tool for Transportation Costs Analysis
Main Menu
The user can modify the
default values of scenarios 1
and 2 clicking on the
corresponding button.

52
Benchmarking Tool for Transportation Costs Analysis
Scenario 1
Note that cost items
may be adjusted to take
account of the
peculiarities of each
simulation.
Clicking on the blue
button Resultados
(Results), on any
screen, you can access
the graphs generated
by the tool.
In this screen, the user can change the settings of scenario
1, to build the desired comparison.
ATTENTION

53
Benchmarking Tool for Transportation Costs Analysis
Scenario 2
Note that cost items
may be adjusted to take
account of the
peculiarities of each
simulation.
Clicking on the blue
button Resultados
(Results), on any
screen, you can access
the graphs generated
by the tool.
ATENTION
As the example of scenario 1, on this screen, the user can
change the settings of scenario 2. This allows you to generate
another comparison for the route selected on Menu.
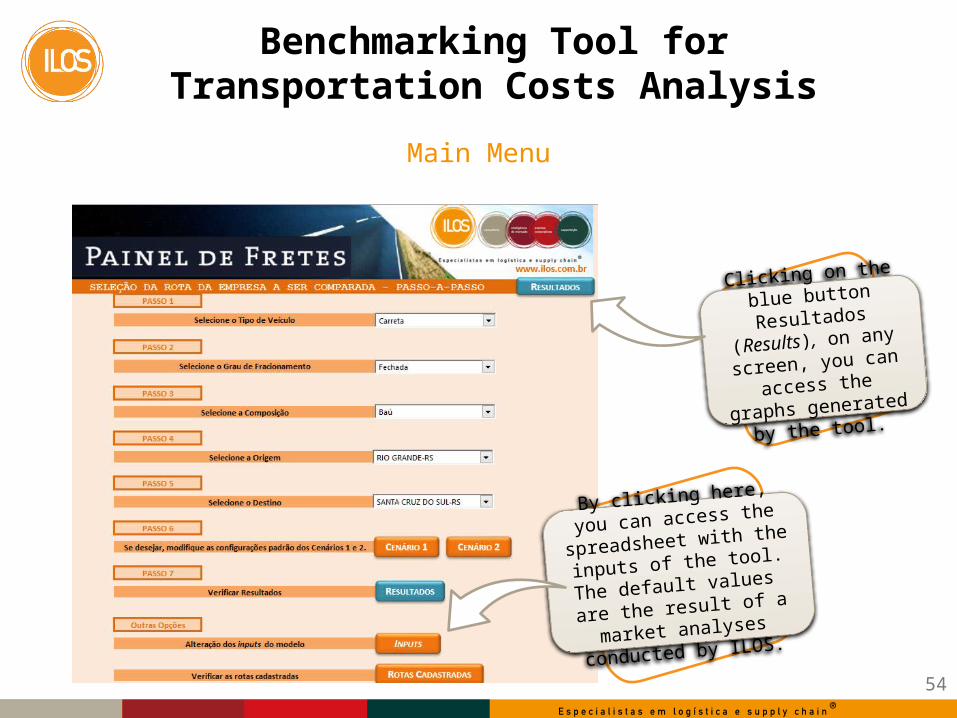
54
Benchmarking Tool for Transportation Costs Analysis
Main Menu
By clicking here, you can
access the spreadsheet with
the inputs of the tool. The
default values are the result of
a market analyses conducted
by ILOS.
Clicking on the blue
button Resultados
(Results), on any screen,
you can access the
graphs generated by the
tool.

55
Benchmarking Tool for Transportation Costs Analysis
Inputs
On this screen, the user can
check the inputs the tool is
using to simulate the
scenarios. If deemed
necessary, these can be
changed to fit the reality of
your company.
Clicking on the blue
button Resultados
(Results), on any
screen, you can access
the graphs generated
by the tool.

56
Benchmarking Tool for Transportation Costs Analysis
Main Menu
Clicking Rotas
Cadastradas you can
access the Indexed
Routes in the tool.
Clicking on the blue
button Resultados
(Results), on any
screen, you can access
the graphs generated
by the tool.

57
Benchmarking Tool for Transportation Costs Analysis
Indexed Routes
This table shows
information about the
routes of the company
registered in the tool.

58
Benchmarking Tool for Transportation Costs Analysis
Results
If necessary, the user can
return to the scenarios
configuration screens and
modify the selected
options.
Select the graphic
to be displayed.

59
Benchmarking Tool for Transportation Costs Analysis
Results: Total Costs
Graph 1: Total Costs

60
Benchmarking Tool for Transportation Costs Analysis
Results: Total Costs
This graphic shows, for example,
that scenario 1’s freight rate is R$
86,22 more expensive than the
freight rate paid by the company in
the selected route, which is not an
advantage.
Note that you can
navigate from one
graphic to another
using the drop-down
menu.

61
Benchmarking Tool for Transportation Costs Analysis
Results: The share of each cost item
Graph 2: The share of
each cost item

62
Benchmarking Tool for Transportation Costs Analysis
Results: The share of each cost item
This chart shows the share of each cost
item, whether fixed or variable, based
on scenarios 1 and 2 costs.
Note that you can
navigate from one
graphic to another
using the drop-down
menu.

63
Benchmarking Tool for Transportation Costs Analysis
Results: Time impact on costs
Graph 3: Time impact on
costs

64
Benchmarking Tool for Transportation Costs Analysis
Results: Time impact on costs
This graph shows that the transit
time is responsible for highest cost
share on
Scenarios 1 and 2.
Note that you can
navigate from one
graphic to another
using the drop-
down menu.

65
Benchmarking Tool for Transportation Costs Analysis
Results: Dedicated x Non-Dedicated Assets
Graph 4: Dedicated x Non-
Dedicated Assets

66
Benchmarking Tool for Transportation Costs Analysis
Results: Dedicated x Non-Dedicated Assets
This graph shows that, for scenario 1, the
dedicated asset benchmarking cost is
higher than the non-dedicated asset
benchmarking cost, showing that for a
100 tons cargo the dedicated asset is not
a good option.
The user must input
the cargo volume to
evaluate the viability of
a dedicated asset.

67
Benchmarking Tool for Transportation Costs Analysis
Results: R$/km
Graph 5: R$/ km

68
Benchmarking Tool for Transportation Costs Analysis
Graph – R$/km
This chart shows the
evolution of fixed and
variable costs and the
benchmarking total costs
for scenarios 1 and 2
planned by the user.
Note that you can
navigate from one
graphic to another
using the drop-down
menu.

69
Benchmarking Tool for Transportation Costs Analysis
Results: Fixed x Variable Costs
Graph 6: Fixed x Variable
Cost

70
Cost Reference Tool
Graph – Fixed x Variable Costs
Note that you can
navigate from one
graphic to another
using the drop-down
menu.
This chart shows the fixed and variable
costs share according to the user’s
scenario

Thank You! Please, contact(5521) 3445-3000
71
Market Intelligence