frequency as airlines’ means to - iata - home e-taxi conference/day 1/2017... · frequency as...
TRANSCRIPT
Frequency as airlines’ means to
accommodate growth, and
implications on e-taxiing
Terence Fan
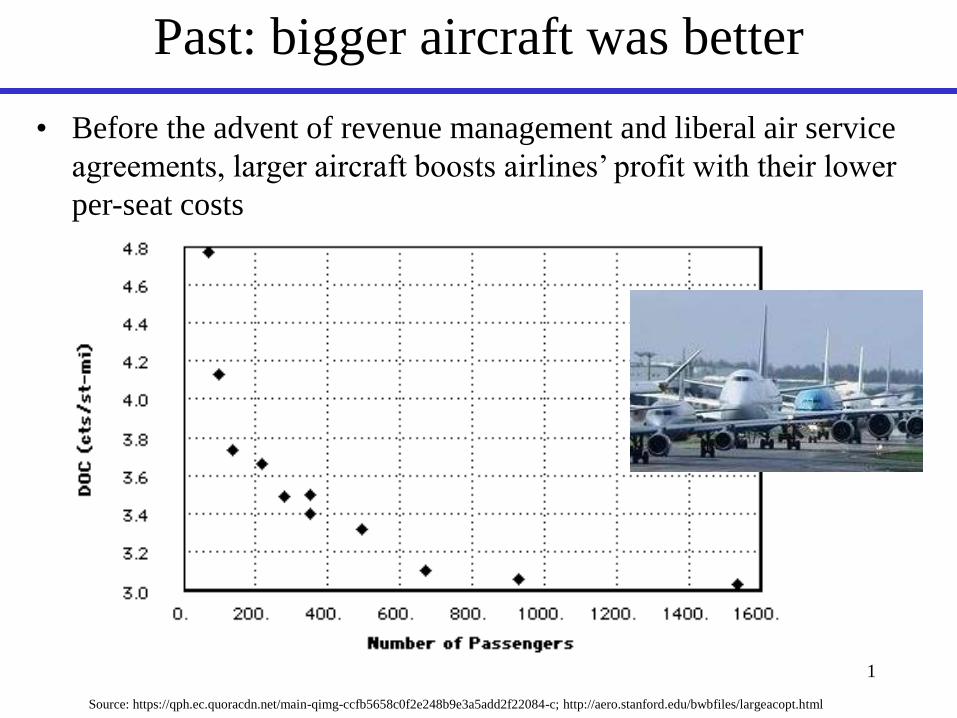
Past: bigger aircraft was better
• Before the advent of revenue management and liberal air service
agreements, larger aircraft boosts airlines’ profit with their lower
per-seat costs
1
Source: https://qph.ec.quoracdn.net/main-qimg-ccfb5658c0f2e248b9e3a5add2f22084-c; http://aero.stanford.edu/bwbfiles/largeacopt.html

Now: better revenue management…
• lets airlines price-discriminate passengers, e.g., LHR-NRT-LHR on BA:
2
Source: Fan & Leung, Journal of Revenue & Pricing Management

…lets airlines ‘right-size’ capacity
• Based on the profile of airfare obtained ($ and demand), airlines
reduce their aircraft size in the long run to capture higher-
yielding traffic, and to increase frequency to capture growth
Operating surplus per flight, USD
From Fan, Journal of Transportation Research Forum
Profit maximizes at small aircraft size with price disparity & proper fare fencing3
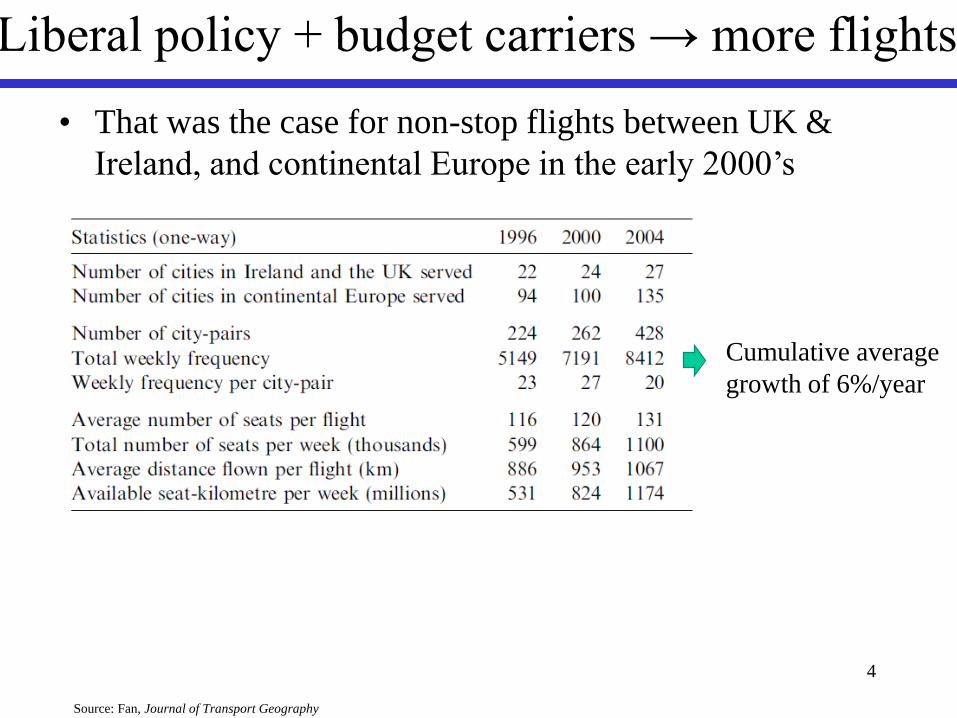
Liberal policy + budget carriers → more flights
• That was the case for non-stop flights between UK &
Ireland, and continental Europe in the early 2000’s
Cumulative average
growth of 6%/year
Source: Fan, Journal of Transport Geography
4
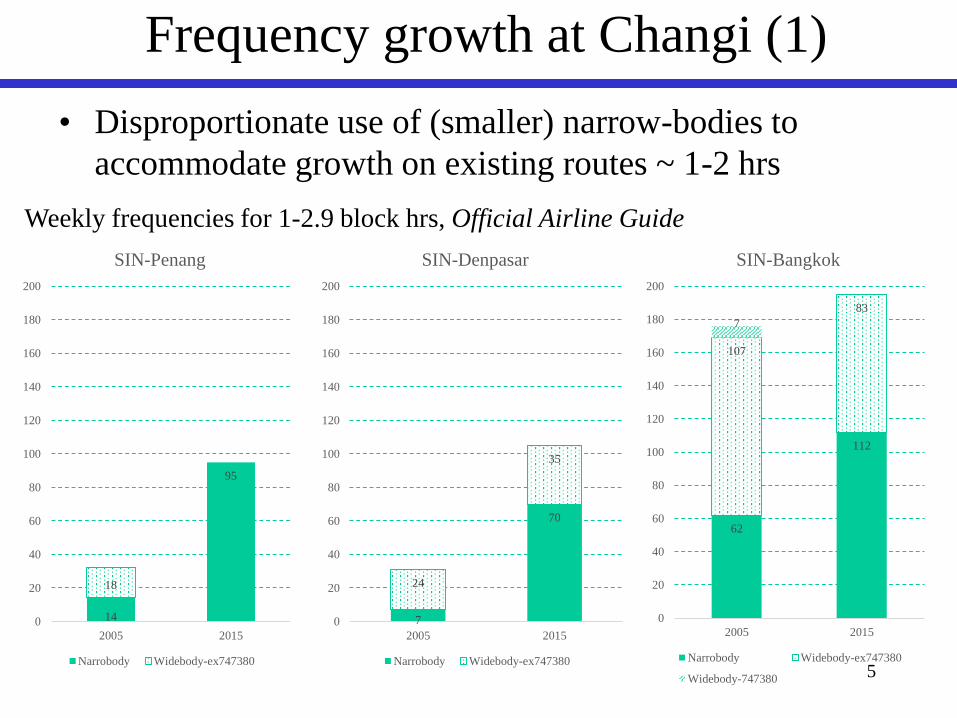
Frequency growth at Changi (1)
• Disproportionate use of (smaller) narrow-bodies to
accommodate growth on existing routes ~ 1-2 hrs
14
95
18
0
20
40
60
80
100
120
140
160
180
200
2005 2015
SIN-Penang
Narrobody Widebody-ex747380
7
70
24
35
0
20
40
60
80
100
120
140
160
180
200
2005 2015
SIN-Denpasar
Narrobody Widebody-ex747380
62
112
107
83
7
0
20
40
60
80
100
120
140
160
180
200
2005 2015
SIN-Bangkok
Narrobody Widebody-ex747380
Widebody-747380
Weekly frequencies for 1-2.9 block hrs, Official Airline Guide
5
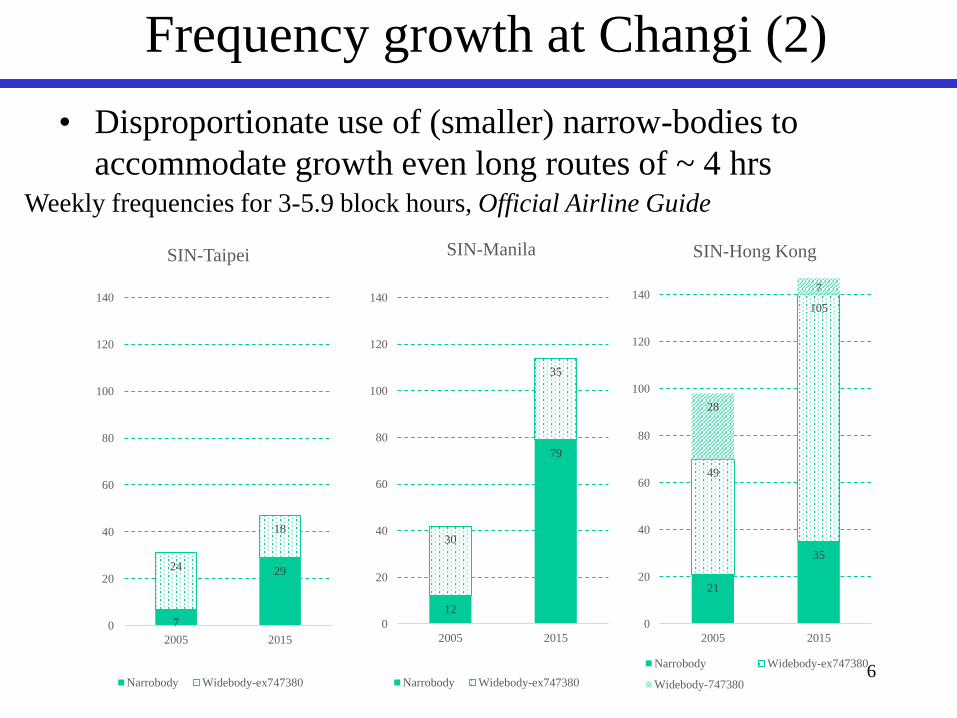
Frequency growth at Changi (2)
• Disproportionate use of (smaller) narrow-bodies to
accommodate growth even long routes of ~ 4 hrsWeekly frequencies for 3-5.9 block hours, Official Airline Guide
7
2924
18
0
20
40
60
80
100
120
140
2005 2015
SIN-Taipei
Narrobody Widebody-ex747380
12
79
30
35
0
20
40
60
80
100
120
140
2005 2015
SIN-Manila
Narrobody Widebody-ex747380
21
35
49
105
28
7
0
20
40
60
80
100
120
140
2005 2015
SIN-Hong Kong
Narrobody Widebody-ex747380
Widebody-7473806
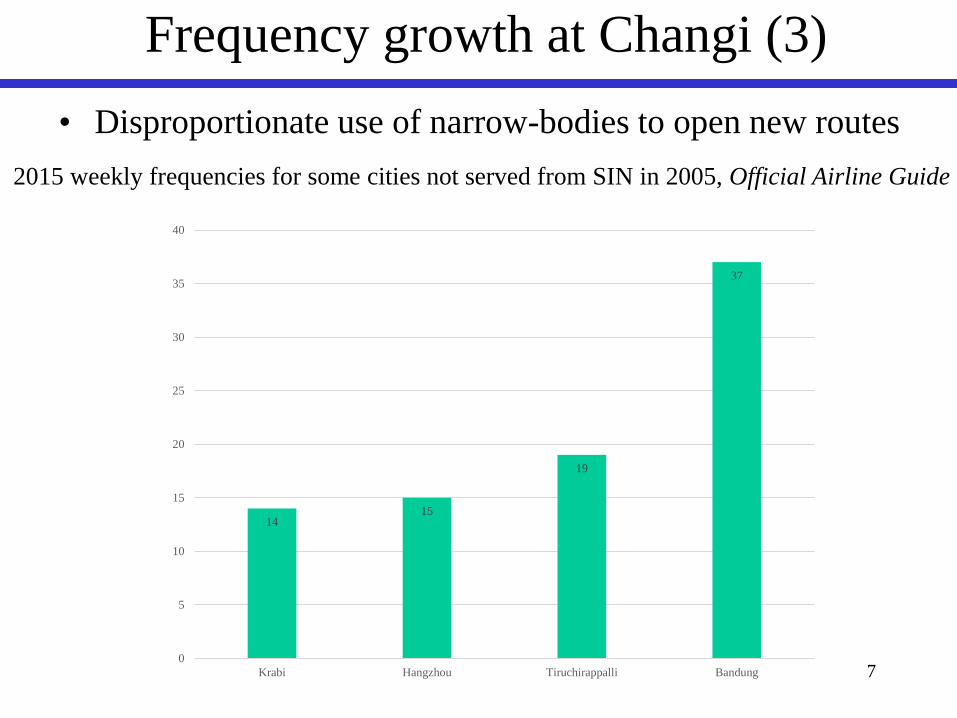
Frequency growth at Changi (3)
• Disproportionate use of narrow-bodies to open new routes
2015 weekly frequencies for some cities not served from SIN in 2005, Official Airline Guide
1415
19
37
0
5
10
15
20
25
30
35
40
Krabi Hangzhou Tiruchirappalli Bandung 7
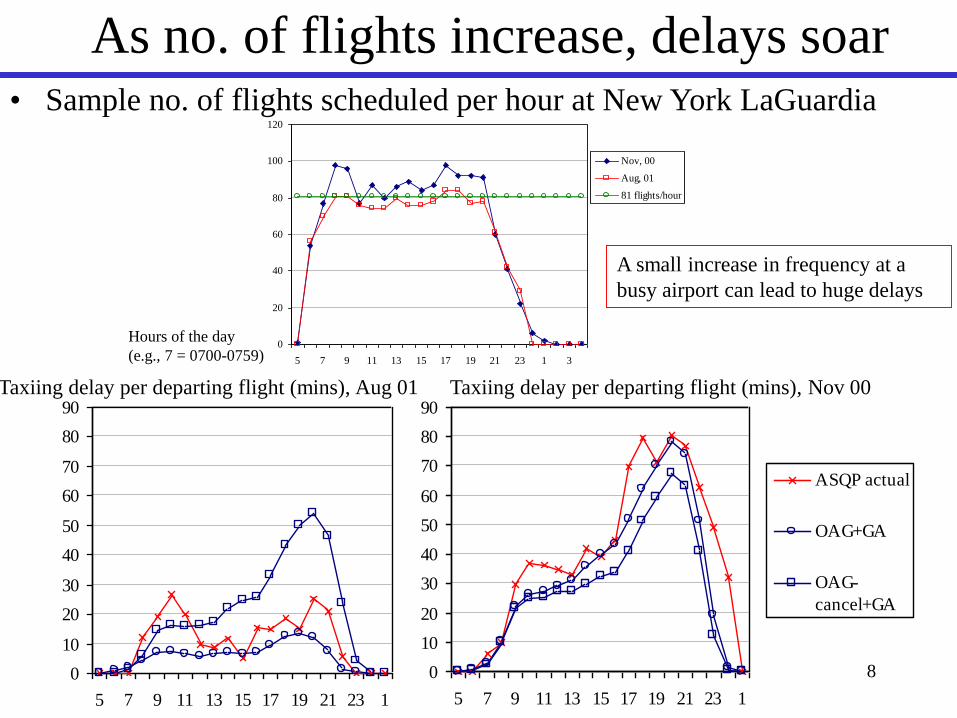
As no. of flights increase, delays soar• Sample no. of flights scheduled per hour at New York LaGuardia
Hours of the day
(e.g., 7 = 0700-0759)
8
0
20
40
60
80
100
120
5 7 9 11 13 15 17 19 21 23 1 3
Nov, 00
Aug, 01
81 flights/hour
0
10
20
30
40
50
60
70
80
90
5 7 9 11 13 15 17 19 21 23 1
ASQP actual
OAG+GA
OAG-
cancel+GA
0
10
20
30
40
50
60
70
80
90
5 7 9 11 13 15 17 19 21 23 1
ASQP actual
OAG+GA
OAG-
cancel+GA
Taxiing delay per departing flight (mins), Aug 01 Taxiing delay per departing flight (mins), Nov 00
A small increase in frequency at a
busy airport can lead to huge delays

...and simulation is realistic
• Sample flight delays at New York LaGuardia without slot control
0
10
20
30
40
50
60
70
80
90
5 7 9 11 13 15 17 19 21 23
OAG + GA
3-Nov-00
8-Nov-00
13-Nov-00
OAG + GA - Cancel
Taxi delay based on scheduled departure time (minutes/flight);
Delay ≡ (actual wheels-up time – actual pushback time) – 15 mins of standard taxiing out time
Simulated
Actual fine-
weather
days
Simulated
Hours of the day (e.g., 7 = 0700-0759)9

Situation for Asia & beyond
• Airport responses
– Stop-gap slot control*
– Longer-term capacity expansions
(more in Asia)
• Airline responses:
– Schedule creep/padding ($$$, see next)
– Potentially, more efficient taxiing
10
* See, e.g., Fan & Odoni, Journal of Air Traffic Control Quarterly for variations in practice

Schedule creep a fact of life
• Schedule creep
– Refers to the gradual increase in scheduled block times for the
same city-pairs over the years
– Route Past (year) 2015 (hr:min)
ORD (Chicago) – SFO 4:25 (’05) 4:43
ORD – LHR 7:49 (’10) 8:02
MDW (Chicago) – MSP 1:23 (’05) 1:27
LGA (NYC) – ORD 2:25 (’96) 2:55
LGA – IAH (Houston) 2:30 (’73) 4:10
– Overall, increase in block times:
• 18% worldwide in 1999-2009
• 4% to 6% worldwide in 2005-2015
11Source: http://www.chicagotribune.com/news/columnists/ct-airline-flight-times-getting-around-met-1207-20151214-column.html ;
http://www.telegraph.co.uk/travel/news/why-flight-times-are-getting-longer-fuel-flying-slower/;
http://www.businesstravelnews.com/Aviation/Schedule-Creep-Demand-Drop-Redefine-Air-Delays/12243
E-taxiing can stop
schedule creep

Schedule padding also a fact of life
• Schedule padding
– Scheduling longer-than-necessary scheduled block times,
with the potential aim of improving on-time performance
– Southwest’s example illustrates the fine line among shorter
scheduled block times, no. of aircraft required & on-time
performance
12Note: On-time defined by percent of flights arriving within 14:59 minutes of schedule
Source: https://www.dallasnews.com/business/airlines/2014/10/27/schedule-adjustments-put-southwest-airlines-on-time-performance-back-on-course
Aug 201312 months before 12 months after
Tightened schedule: removed equivalent
of 16 aeroplanes (out of 680)
80.2% on-time performance
Rank: 7th of 16 airlines
71.1% on-time performance
Rank: Tied for last
E-taxiing can help reduce schedule padding needed

• Based on the airport as a single-server, with a queue of departing and
arriving aircraft
Delay simulation principle
13
Airport
Departed or arrived aircraftQueue of departing and arriving aircraft
Legend: departing and arriving aircraft
It pays to be at the head of the queue,
and e-taxiing helps airlines get there
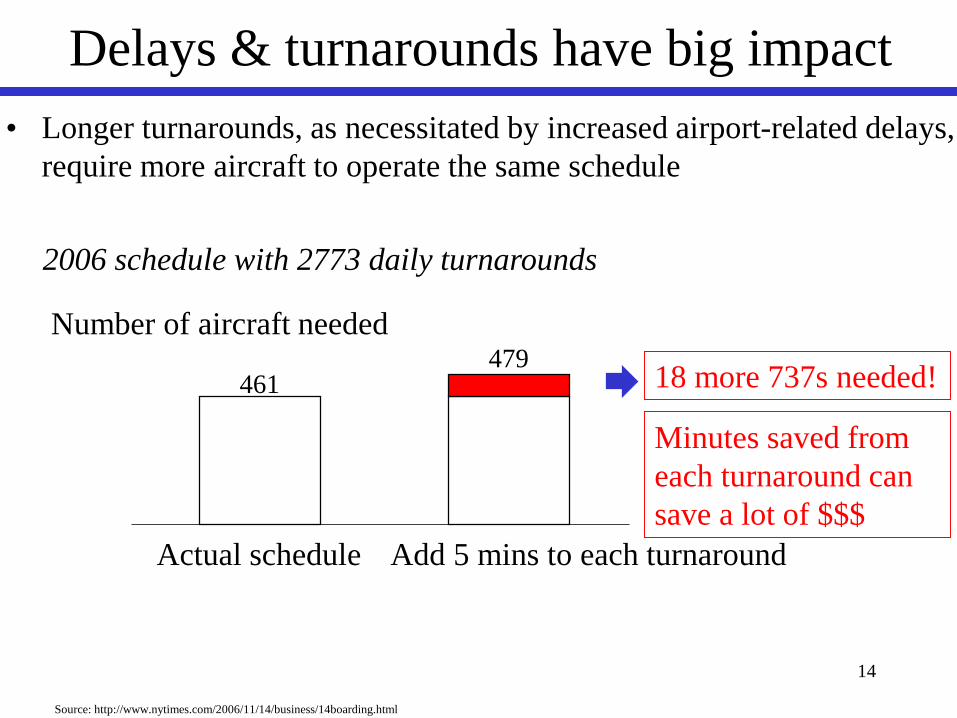
• Longer turnarounds, as necessitated by increased airport-related delays,
require more aircraft to operate the same schedule
Delays & turnarounds have big impact
14
Source: http://www.nytimes.com/2006/11/14/business/14boarding.html
2006 schedule with 2773 daily turnarounds
Actual schedule Add 5 mins to each turnaround
18 more 737s needed!
Number of aircraft needed479
461
Minutes saved from
each turnaround can
save a lot of $$$

• Longer engine start-up time contributes to longer turnaround
times – apparently a big turn-off
– PW1100G-JM engines on A320neos require longer start-up times,
from 150 seconds to 350 seconds in hot conditions (2-3 mins extra)
…same with slightly longer engine starts
15Sources: http://aviationweek.com/commercial-aviation/qatar-airways-cancels-more-a320neo-orders; http://aviationweek.com/commercial-aviation/indigo-impacted-a320neo-
startup-time-issues ; http://in.reuters.com/article/interglobe-results-idINKCN10C28Z; http://www.reuters.com/article/us-pratt-airbus-a-idUSKCN0VZ1KE
“The longer startup time required for cooling of the
PW1100G engines…is making it…difficult for IndiGo to
maintain flight schedules”
“Qatar Airways refused to take an aircraft…before … fixes
were installed to the PW1100G engines”
“The extra warm-up time creates problems for Lufthansa
because of a shortage of space to taxi at Frankfurt airport”

Taxiing takes up 19% of block hour
• Based on A320 fleet
– 12-month average till Apr 2012
– 1.8 hours/flight average gate-to-gate (‘block’) time
– 20 mins/flight spent on taxiing
– 8.9 hours/day daily utilisation
16
Source: <http://www.airbus.com/fileadmin/media_gallery/files/brochures_publications/FAST_magazine/FAST51.pdf> p.8, accessed 10 May 2017
19% of gate-to-gate time actually on taxiing!
3-min reduction in taxi time per flight translates
into a 15-min reduction in block time every day,
or ~2% reduction in scheduled crew expenses!

• While aircraft taxiing delays are difficult to obtain, short aircraft
turnaround times have been associated with increased profitability
Shorter turnarounds increase profits
17Note: Ground time of over 3 hours ignored; only narrow-bodies included; using FlightRadar24 data
Source: https://airinsight.com/2017/05/08/correlation-airline-ground-time-profits/

E-taxiing can reduce turnaround time
18
Source: Airport Cooperative Research Program Report 158: Deriving Benefits from Alternative Aircraft-Taxi Systems, Transportation Research Board,
2016, p.2, p.9, p.16, p.17
• Among various electric aircraft taxiing technologies,
– Dispatch taxiing (e.g., using existing pushback tractor)
– Semi-robotic dispatch taxiing (e.g., using a hybrid external tractor for taxiing)
– Nose-wheel-mounted electric aircraft taxiing systems
– Main landing gear electric aircraft taxiing systems
– Replacement of the APU with on-board taxi jet engine
• those without the need to attach and detach external systems can save
up to 2 minutes in push-back procedures

Plus, e-taxiing saves fuel (1)
19
Source: <http://www.airbus.com/fileadmin/media_gallery/files/brochures_publications/FAST_magazine/FAST51.pdf> p.6, p.8, accessed 10 May 2017
Up to 10% of fuel
burnt on ground

Plus, e-taxiing saves fuel (2)
20Source: <http://www.airbus.com/fileadmin/media_gallery/files/brochures_publications/FAST_magazine/FAST51.pdf>
p.9, accessed 10 May 2017
• Without the main engine thrust, e-taxiing reduces fuel burn and
associated emissions during taxiing

Conclusion
• As passenger air transport demand increases,
– capacity-related delays will soar,
– schedule padding and creep will be a fact of life
– seconds shaved off the usual taxiing process or turnarounds
matter!
– efficient e-taxiing can give one airline an important
advantage, leading to increased profits, against others
• To improve airline and airport planning:
– need better operational data for analysis
21

Summary
• Economics encourages airlines to use frequency to
accommodate growth
• In the world of increasing flight delays,
– The U.S. experience (no slot control) shows that being able
to get to head of take-off/landing queues can save a lot of
time & costs
– Experience from Asia (with slot control) shows relentless
rise in frequency, bearing some similarity to the U.S.
experience
• E-taxiing
– Better able to place an airline’s aeroplane at head of take-
off queues to save time & cost22