frequency domain analysis of linear circuits using ... and fft.pdf · frequency domain analysis of...
TRANSCRIPT
Frequency domain analysis of linear
circuits using synchronous detection
Physics 401, Fall 2013.
Eugene V. Colla
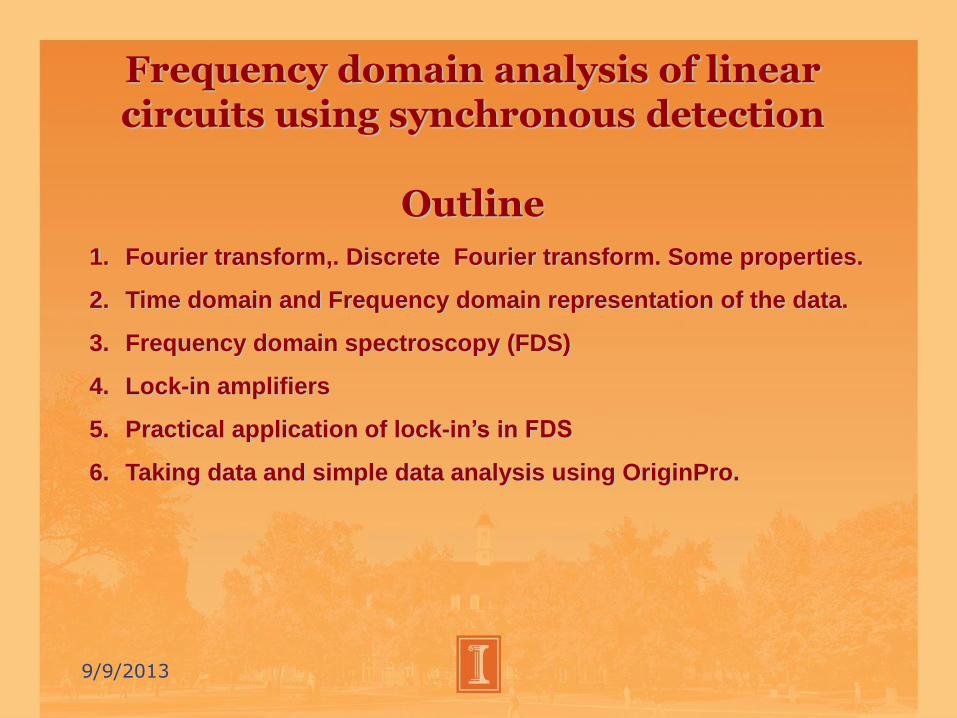
1. Fourier transform,. Discrete Fourier transform. Some properties.
2. Time domain and Frequency domain representation of the data.
3. Frequency domain spectroscopy (FDS)
4. Lock-in amplifiers
5. Practical application of lock-in’s in FDS
6. Taking data and simple data analysis using OriginPro.
Frequency domain analysis of linear circuits using synchronous detection
Outline
9/9/2013
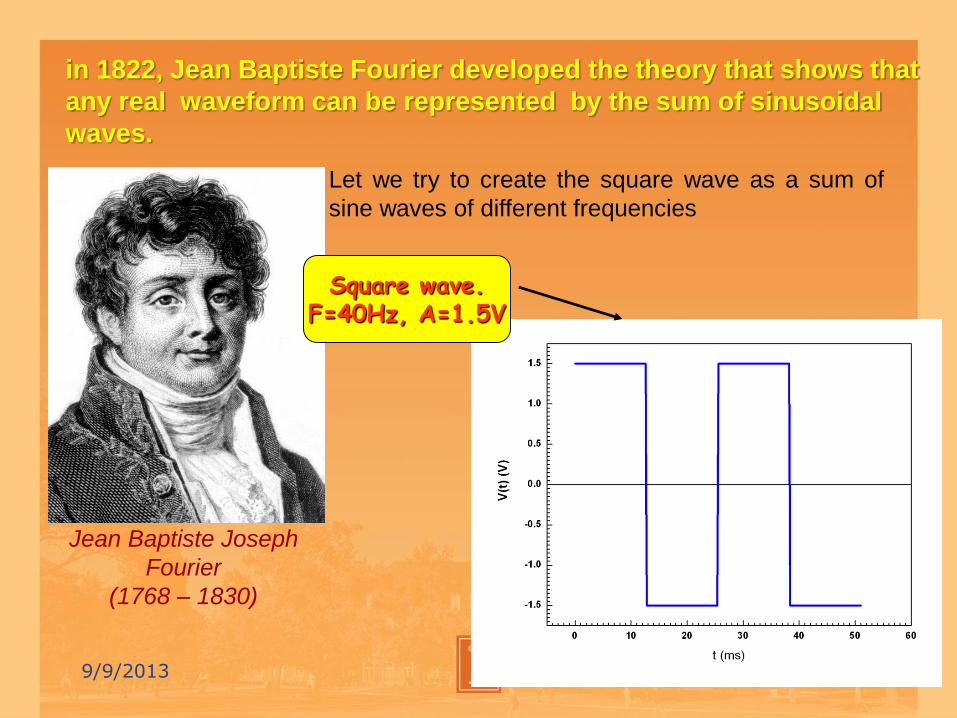
in 1822, Jean Baptiste Fourier developed the theory that shows that
any real waveform can be represented by the sum of sinusoidal
waves.
Jean Baptiste Joseph
Fourier
(1768 – 1830)
Let we try to create the square wave as a sum of
sine waves of different frequencies
Square wave.F=40Hz, A=1.5V
9/9/2013
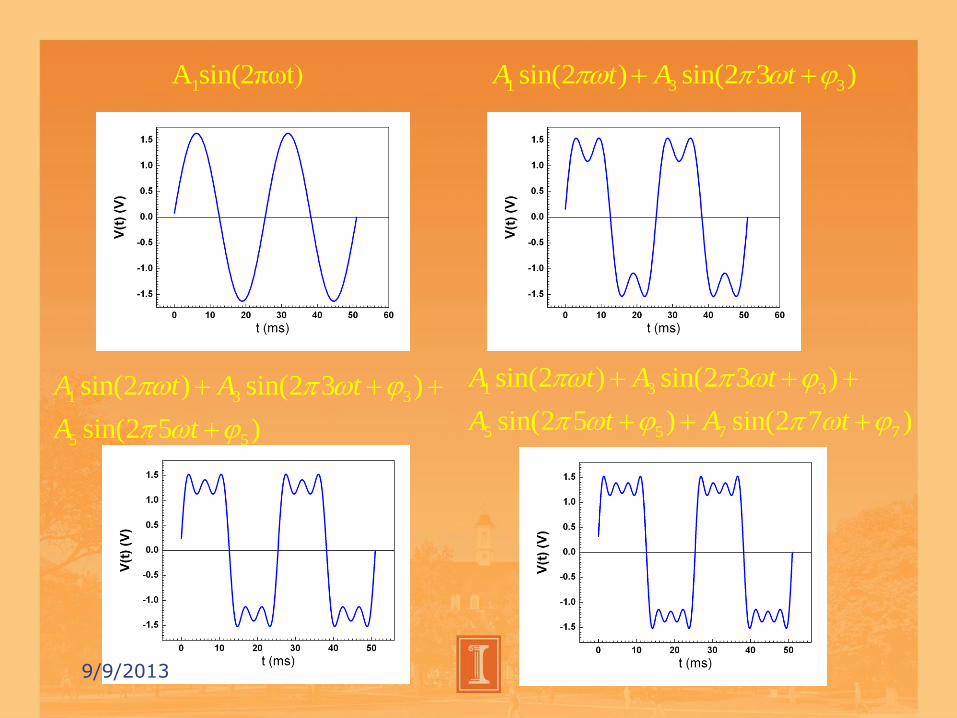
1A sin(2πωt) 1 3 3sin(2 ) sin(2 3 )A t A t
1 3 3
5 5
sin(2 ) sin(2 3 )
sin(2 5 )
A t A t
A t
1 3 3
5 5 7 7
sin(2 ) sin(2 3 )
sin(2 5 ) sin(2 7 )
A t A t
A t A t
9/9/2013
Fourier Transform
+
2πjft
-
H(f)= h(t)e dt; j= -1
+
-2πjft
-
h(t)= H(f)e df
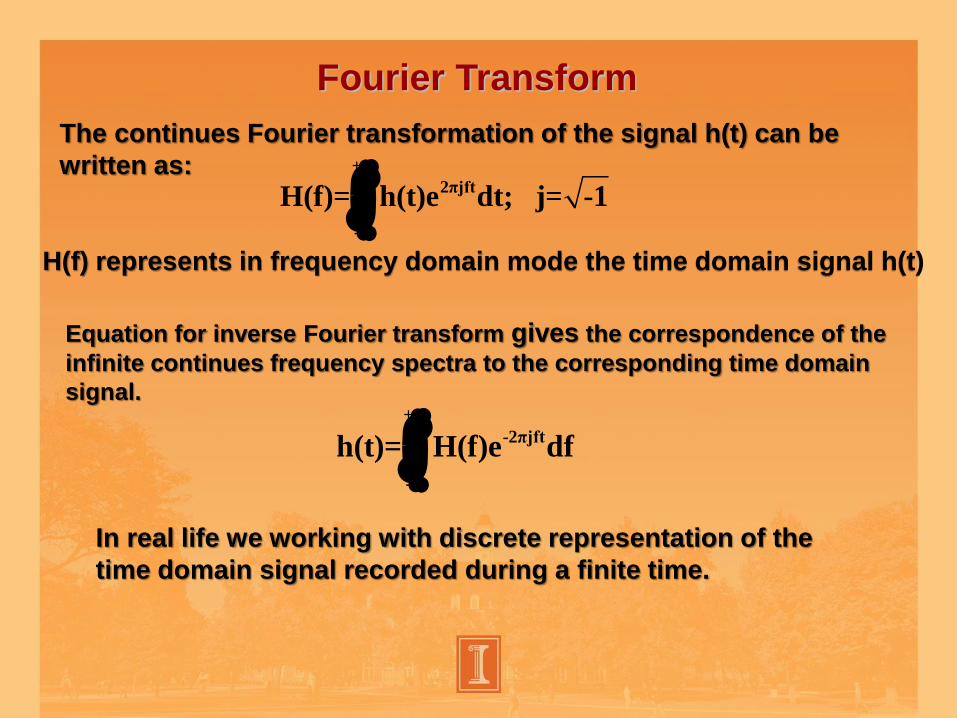
The continues Fourier transformation of the signal h(t) can be
written as:
H(f) represents in frequency domain mode the time domain signal h(t)
Equation for inverse Fourier transform gives the correspondence of the
infinite continues frequency spectra to the corresponding time domain
signal.
In real life we working with discrete representation of the
time domain signal recorded during a finite time.
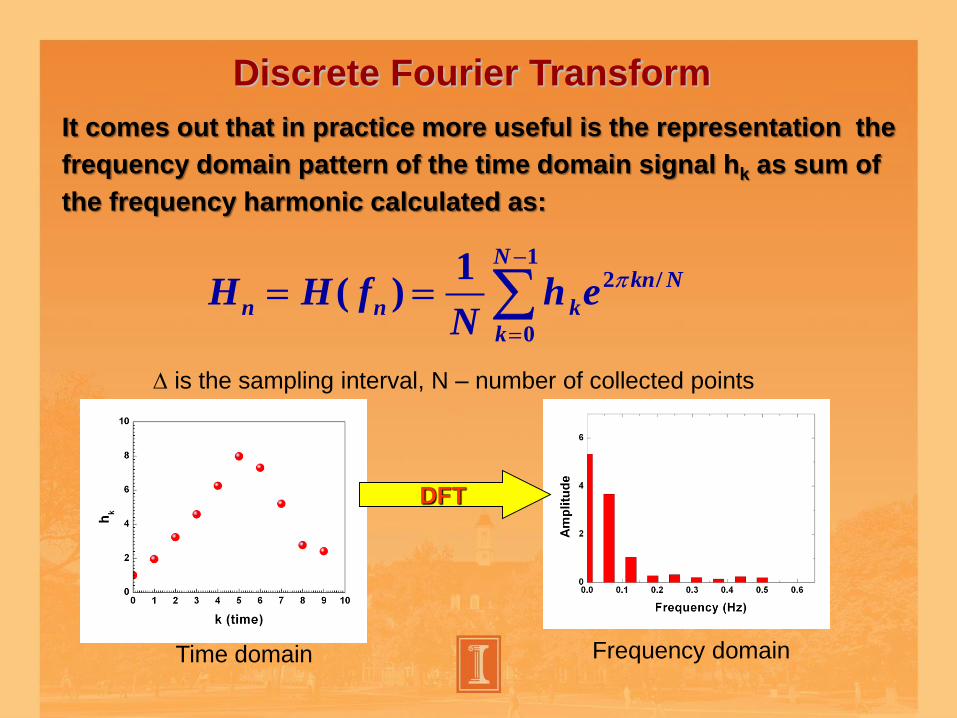
Discrete Fourier Transform
It comes out that in practice more useful is the representation the
frequency domain pattern of the time domain signal hk as sum of
the frequency harmonic calculated as:
12 /
0
1( )
Nkn N
n n k
k
H H f h eN
D is the sampling interval, N – number of collected points
DFT
Time domain Frequency domain
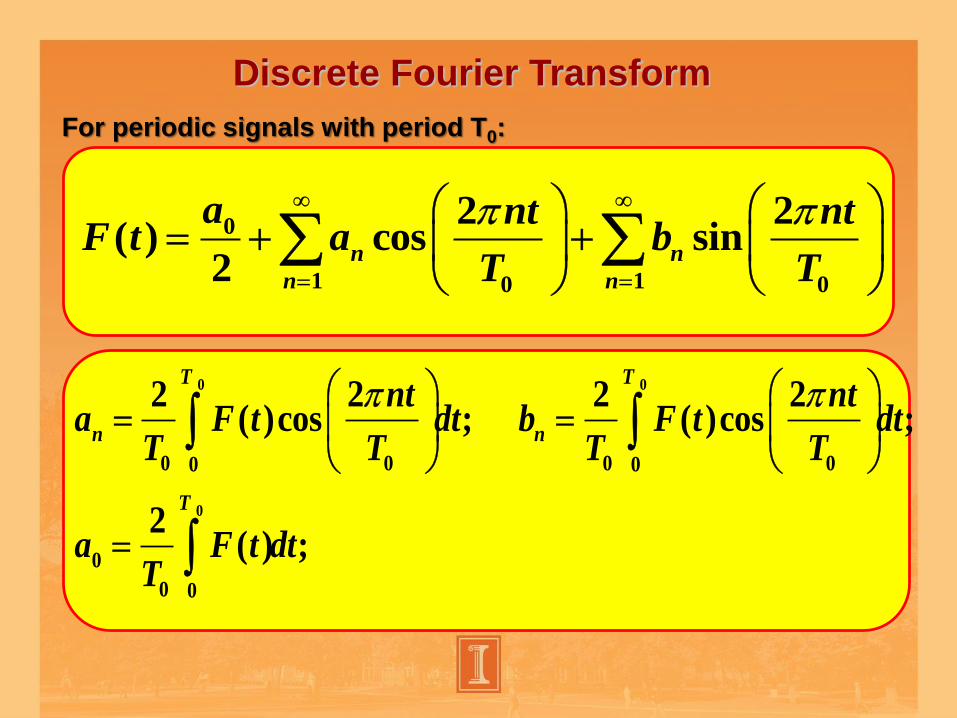
Discrete Fourier Transform
For periodic signals with period T0:
0
1 10 0
2 2( ) cos sin
2n n
n n
a nt ntF t a b
T T
0 0
0
0 0 0 00 0
0
0 0
2 2 2 2( )cos ; ( )cos ;
2( ) ;
T T
n n
T
nt nta F t dt b F t dt
T T T T
a F t dtT
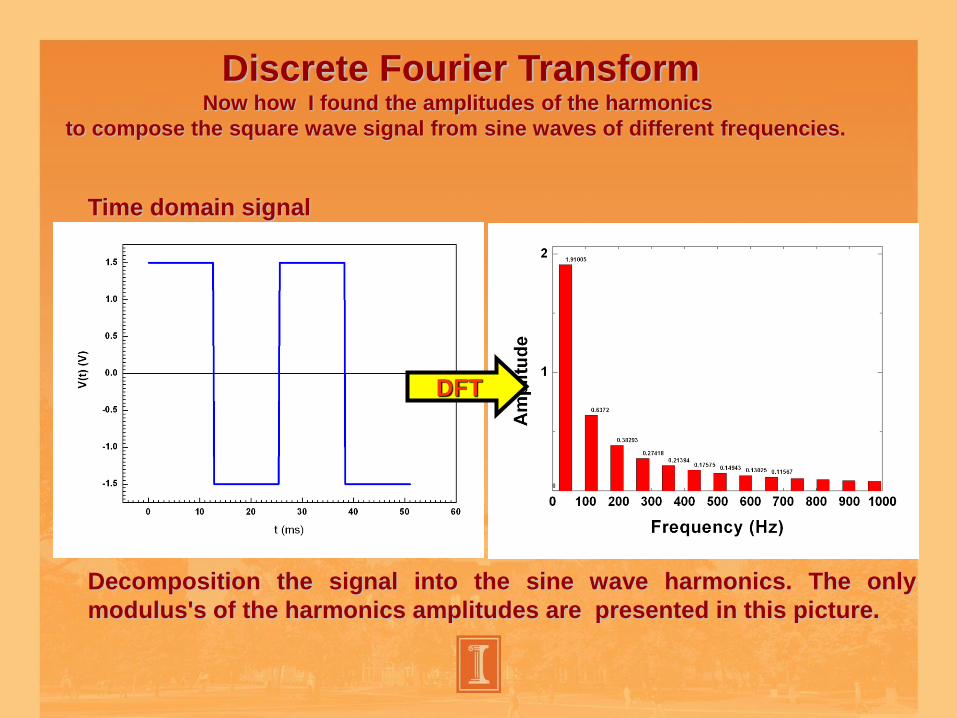
Discrete Fourier TransformNow how I found the amplitudes of the harmonics
to compose the square wave signal from sine waves of different frequencies.
DFT
Time domain signal
Decomposition the signal into the sine wave harmonics. The only
modulus's of the harmonics amplitudes are presented in this picture.
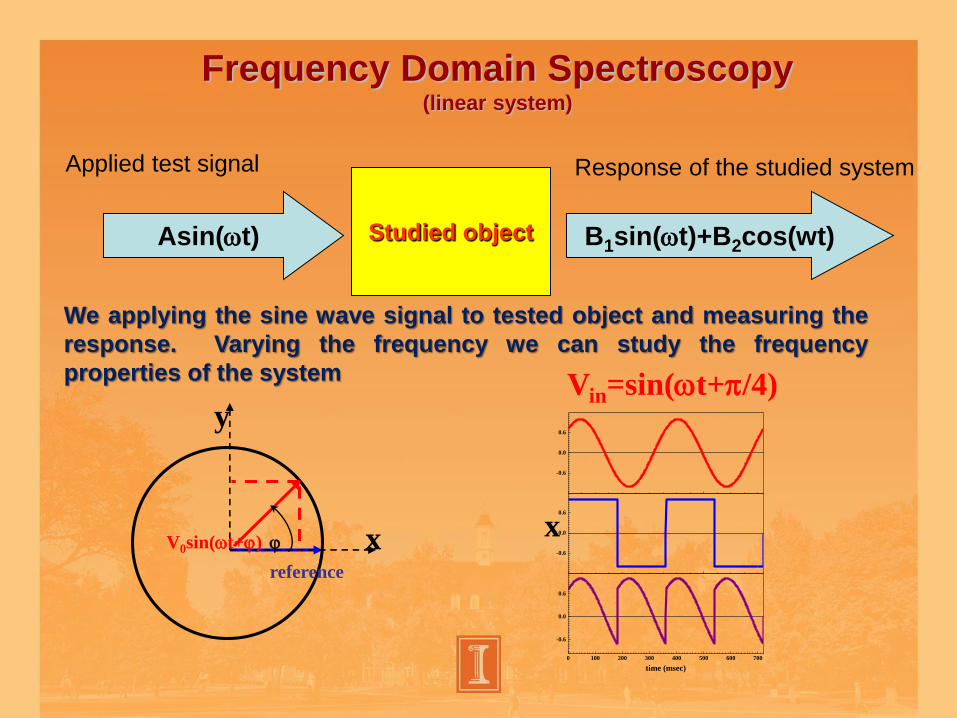
Frequency Domain Spectroscopy(linear system)
Studied objectAsin(t) B1sin(t)+B2cos(wt)
Applied test signal Response of the studied system
We applying the sine wave signal to tested object and measuring the
response. Varying the frequency we can study the frequency
properties of the system
x
y
reference
V0sin(t+) x
0 100 200 300 400 500 600 700
-0.6
0.0
0.6
-0.6
0.0
0.6
-0.6
0.0
0.6
time (msec)
Vin=sin(t+/4)
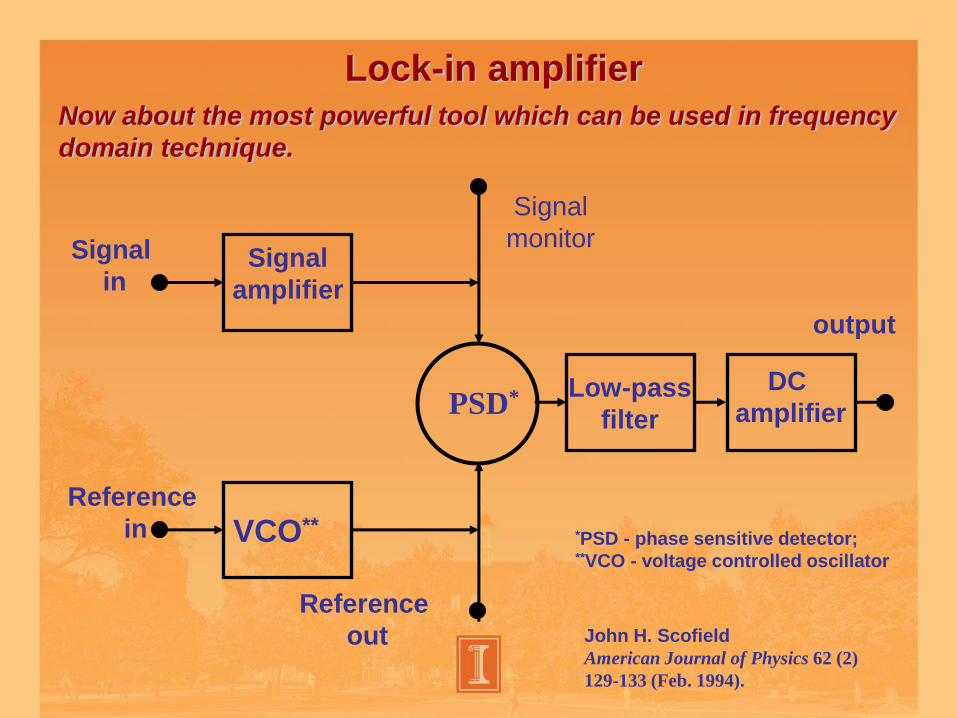
Lock-in amplifier
Now about the most powerful tool which can be used in frequency
domain technique.
PSD*
Signal
amplifier
VCO**
Signal
in
Reference
in
Signal
monitor
Reference
out
Low-pass
filter
DC
amplifier
output
*PSD - phase sensitive detector;**VCO - voltage controlled oscillator
John H. Scofield
American Journal of Physics 62 (2)
129-133 (Feb. 1994).
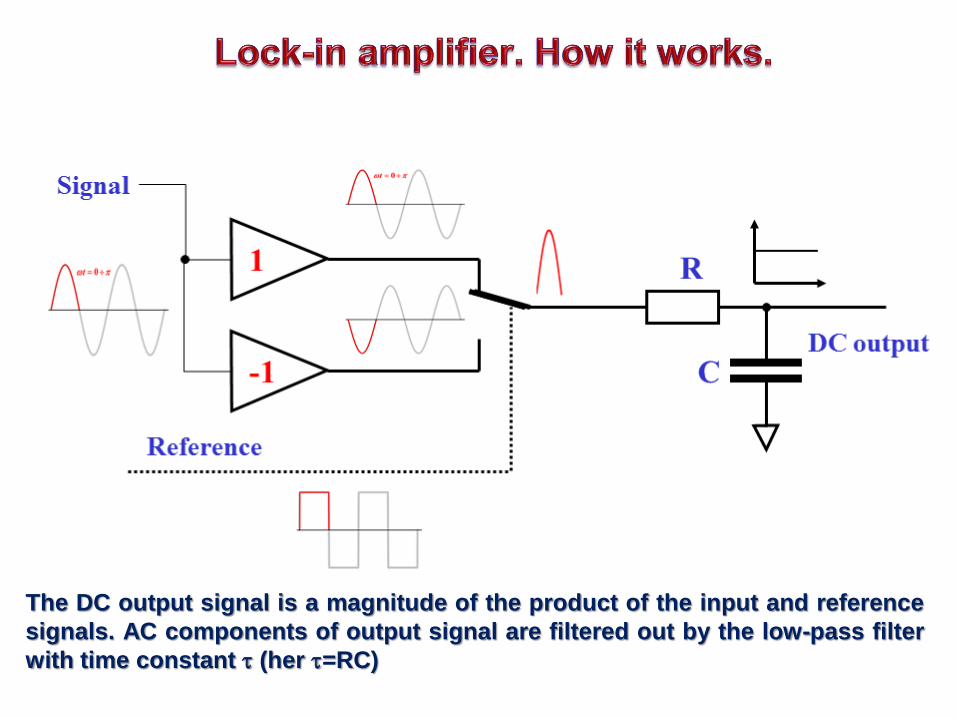
The DC output signal is a magnitude of the product of the input and reference
signals. AC components of output signal are filtered out by the low-pass filter
with time constant t (her t=RC)
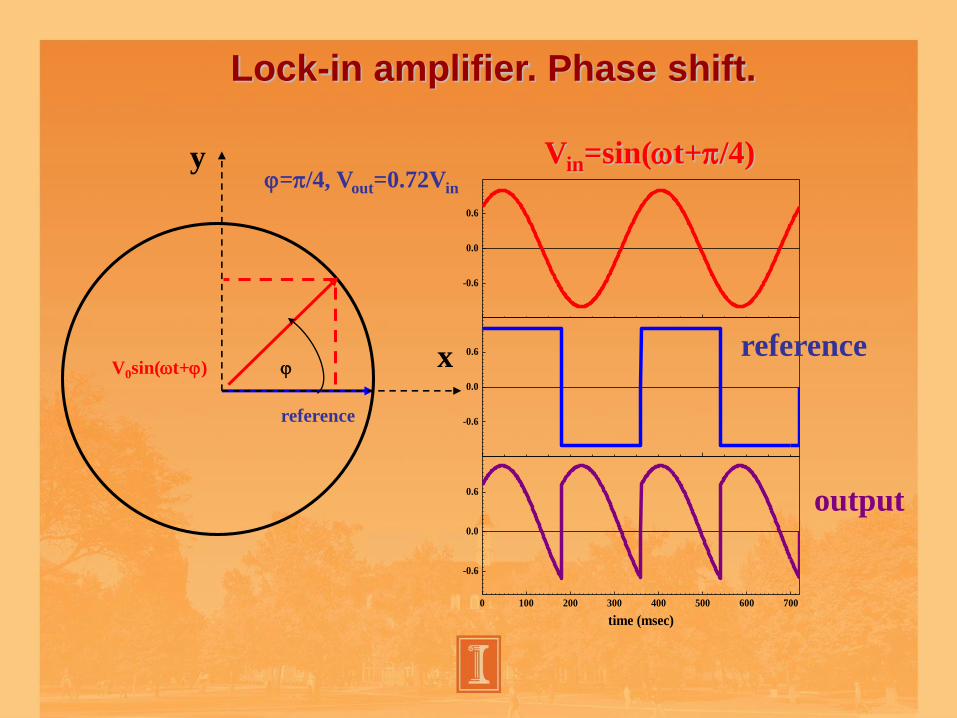
Lock-in amplifier. Phase shift.
x
y
reference
V0sin(t+)
=/4, Vout=0.72Vin
0 100 200 300 400 500 600 700
-0.6
0.0
0.6
-0.6
0.0
0.6
-0.6
0.0
0.6
time (msec)
Vin=sin(t+/4)
reference
output
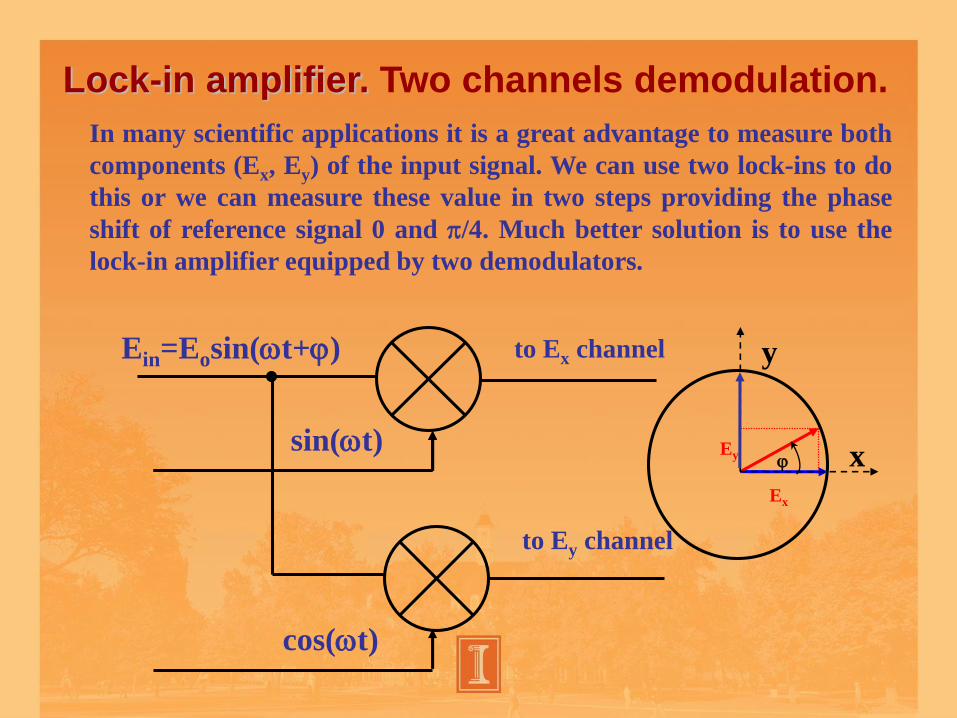
Lock-in amplifier. Two channels demodulation.
In many scientific applications it is a great advantage to measure both
components (Ex, Ey) of the input signal. We can use two lock-ins to do
this or we can measure these value in two steps providing the phase
shift of reference signal 0 and /4. Much better solution is to use the
lock-in amplifier equipped by two demodulators.
Ein=Eosin(t+)
sin(t)
cos(t)
to Ex channel
to Ey channel
x
y
Ey
Ex
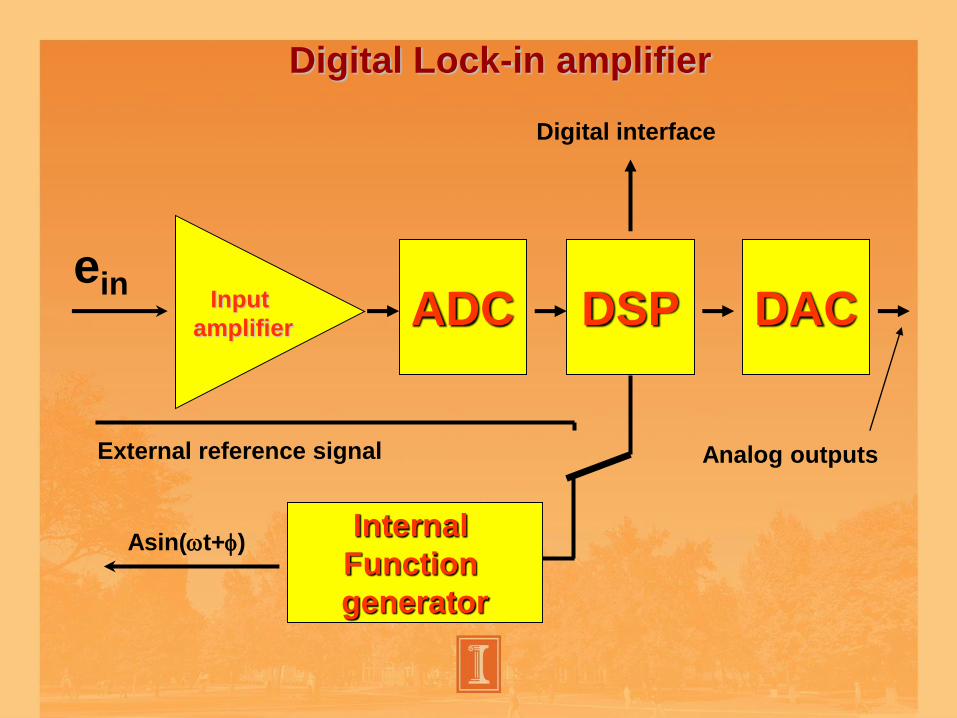
Digital Lock-in amplifier
ADCInput
amplifier
einDSP
External reference signal
Internal
Function
generator
Asin(t+f)
DAC
Analog outputs
Digital interface
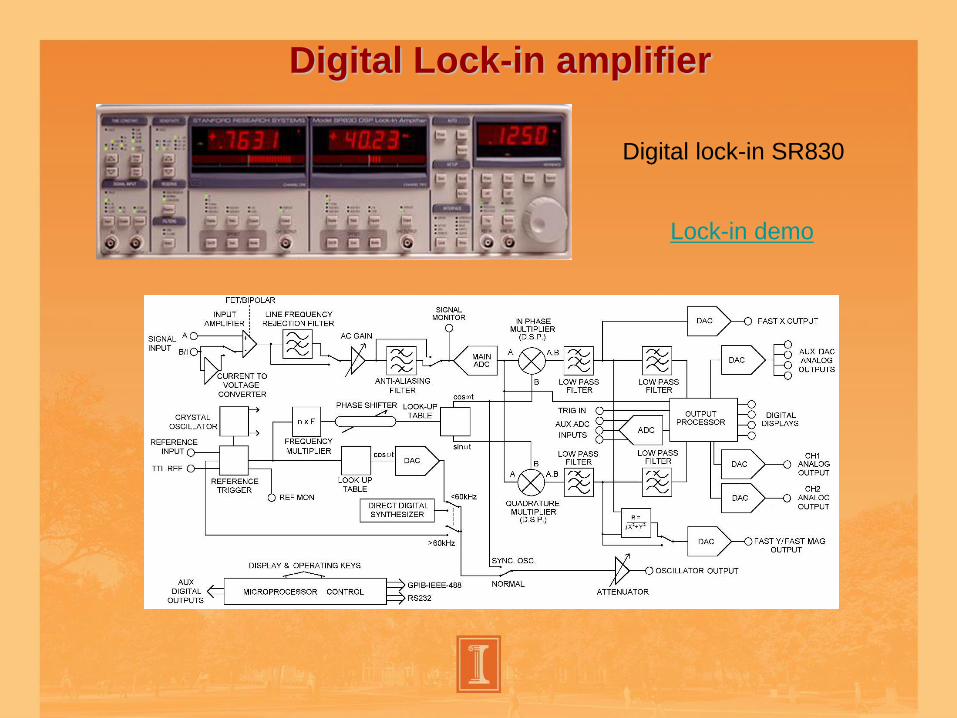
Digital Lock-in amplifier
Digital lock-in SR830
Lock-in demo
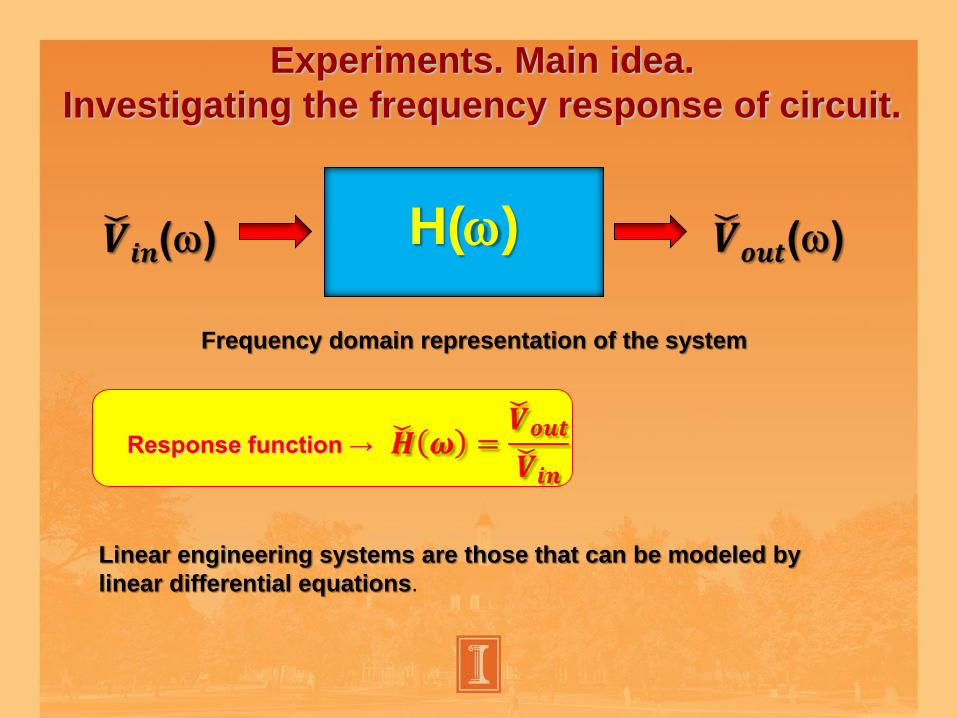
Experiments. Main idea.
Investigating the frequency response of circuit.
H()
Response function →
Frequency domain representation of the system
Linear engineering systems are those that can be modeled by
linear differential equations.
9/9/2013
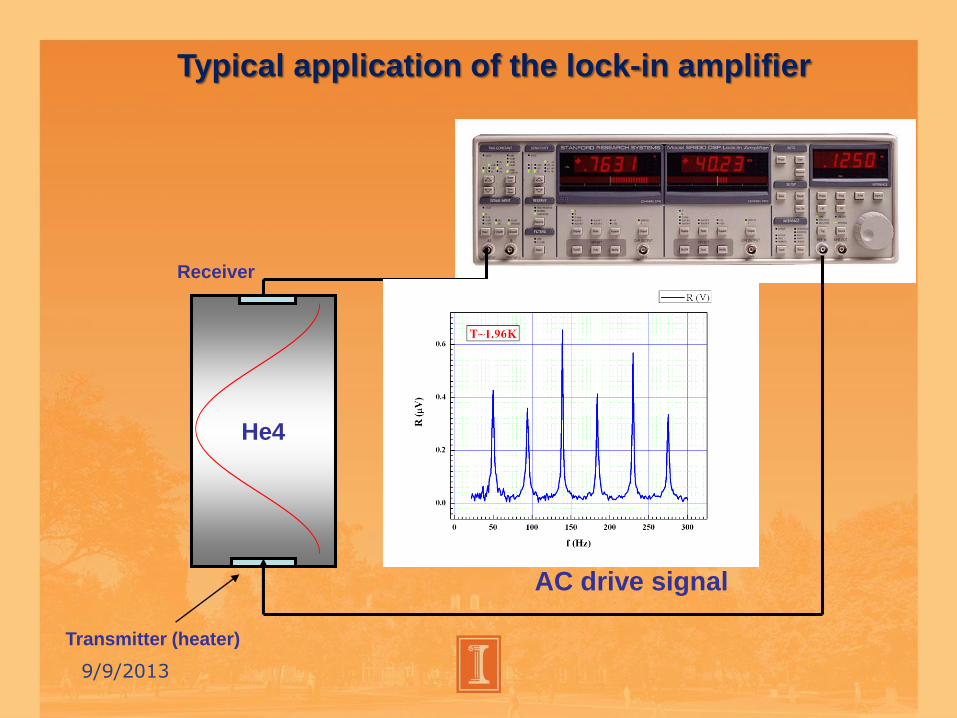
Typical application of the lock-in amplifier
He4
AC drive signal
Transmitter (heater)
Receiver
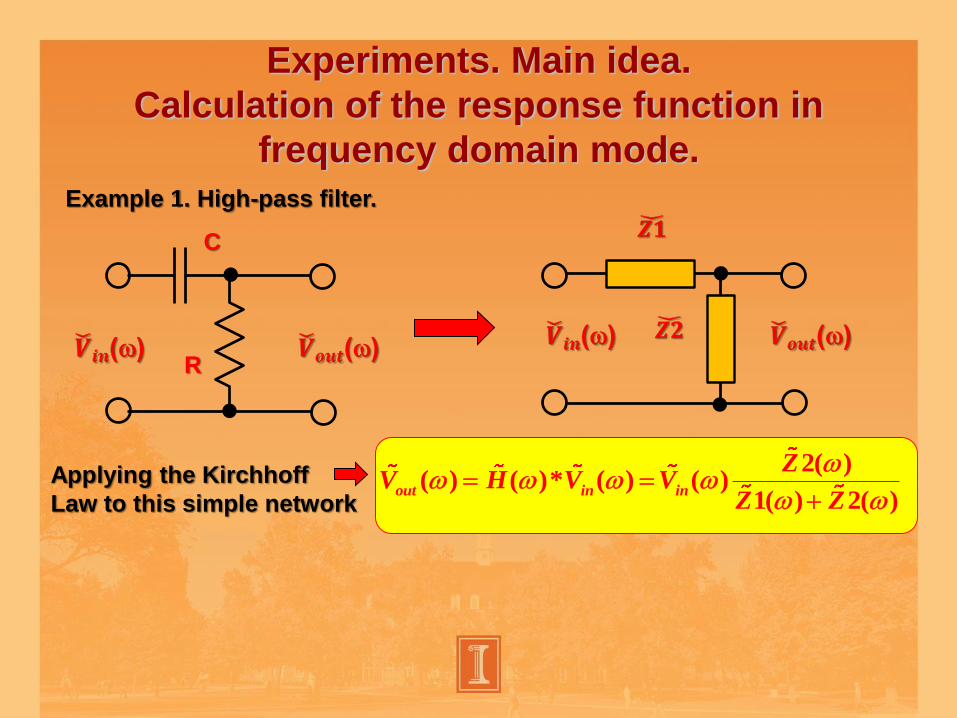
Experiments. Main idea.
Calculation of the response function in
frequency domain mode.
Example 1. High-pass filter.
C
R
2( )( ) ( )* ( ) ( )
1( ) 2( )out in in
ZV H V V
Z Z
Applying the Kirchhoff
Law to this simple network
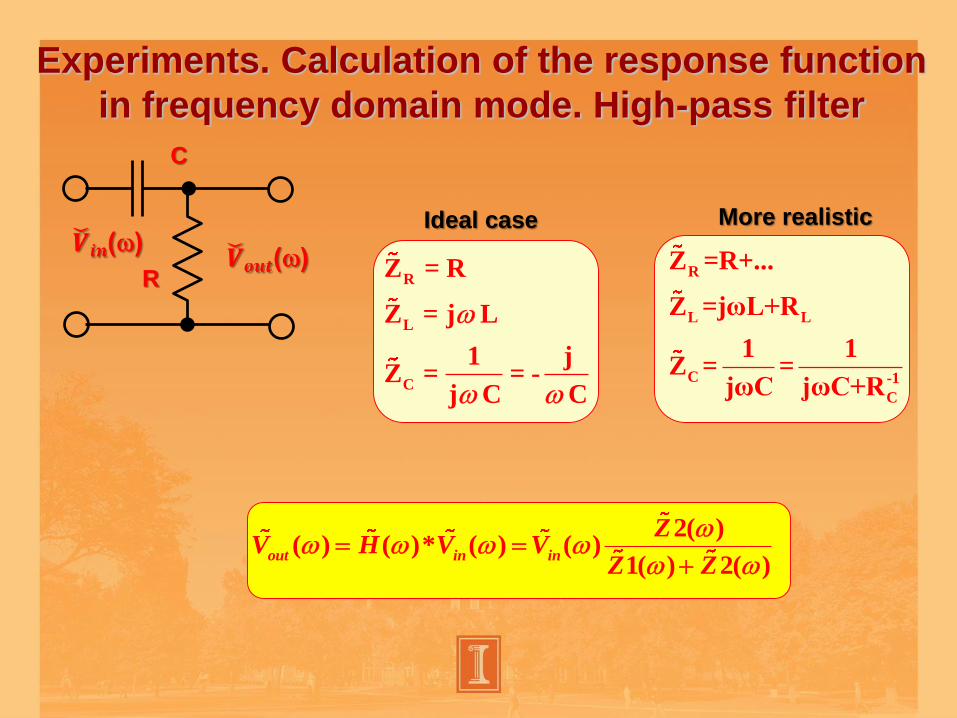
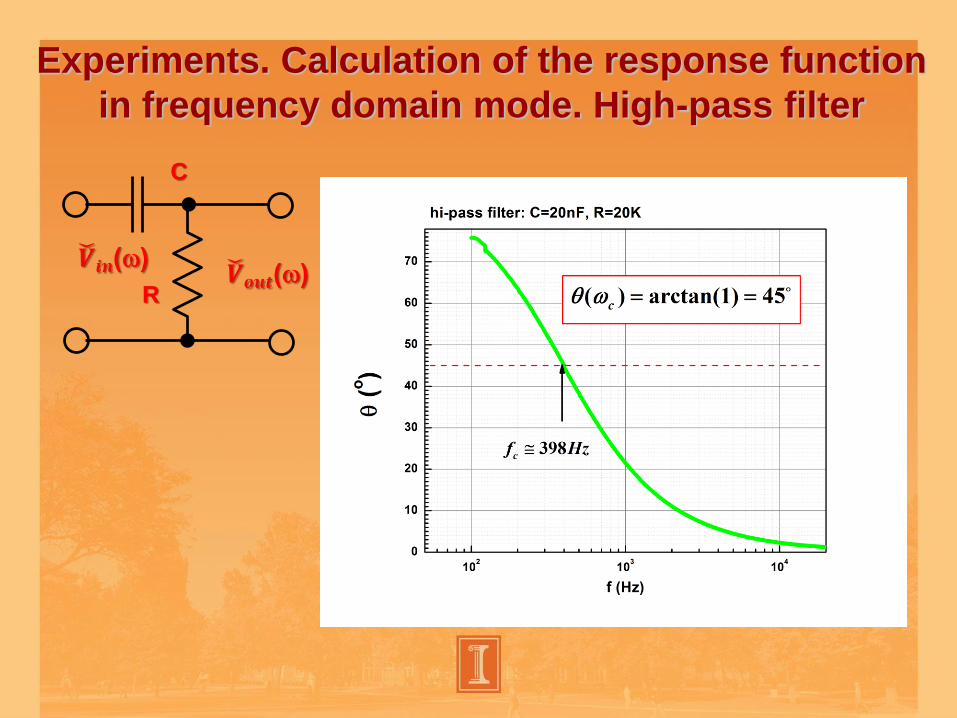
Experiments. Calculation of the response function
in frequency domain mode. High-pass filter
C
R
2( )( ) ( )* ( ) ( )
1( ) 2( )out in in
ZV H V V
Z Z
R
L
C
Z = R
Z = j L
1 jZ = = -
j C C
R
L L
C -1
C
Z =R+...
Z =jωL+R
1 1Z = =
jωC jωC+R
Ideal case More realistic

Experiments. Calculation of the response function
in frequency domain mode. High-pass filter
C
R
2 2
1
2 2
2
( ) ;1 1 1 1
where ;
1( ) ; ( )
( )
( )
( )
( )arctan arctan
1
c
I
I
R
R
R
I
R j RCH
HH
jH j
j RC jR
j C
j
C
H
HH
H
R
t t
t t
t
t
t
t
t
t – time constant of the filter
C - cutoff frequency
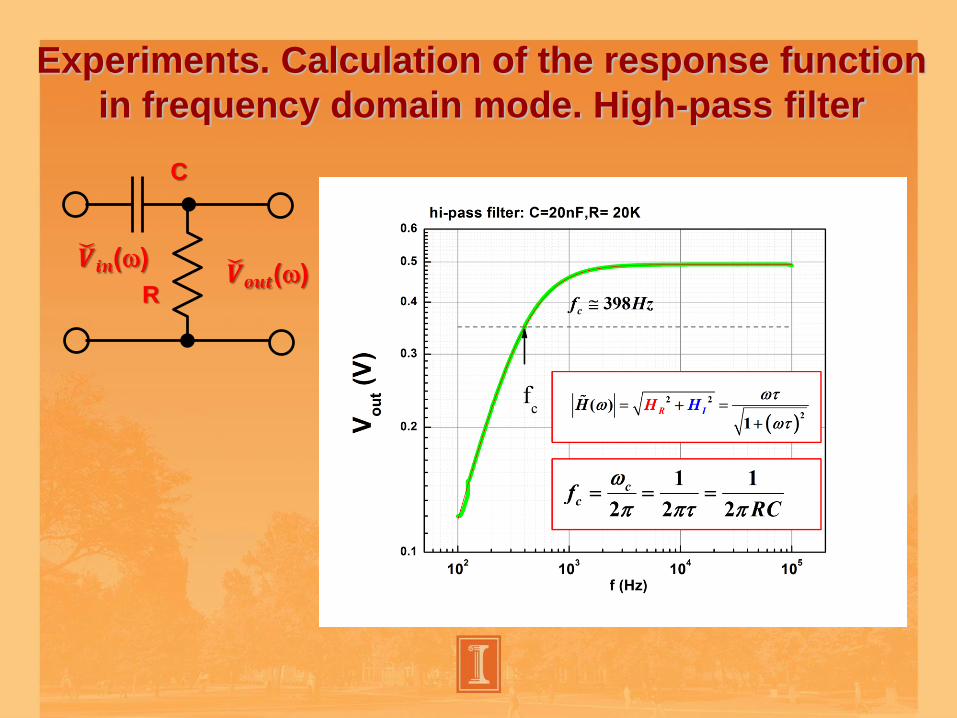
C
R
Experiments. Calculation of the response function
in frequency domain mode. High-pass filter
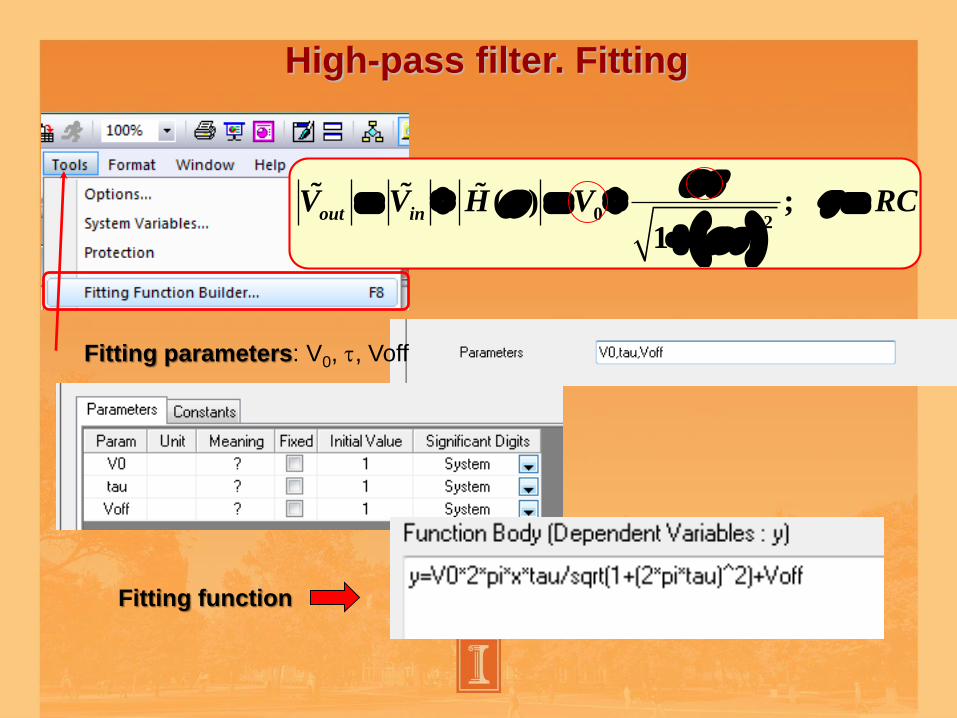
High-pass filter. Fitting
Fitting parameters: V0, t, Voff
0
2( ) ;
1out in
V V H V RCt
tt
Fitting function
C
R
Experiments. Calculation of the response function
in frequency domain mode. High-pass filter
C
R
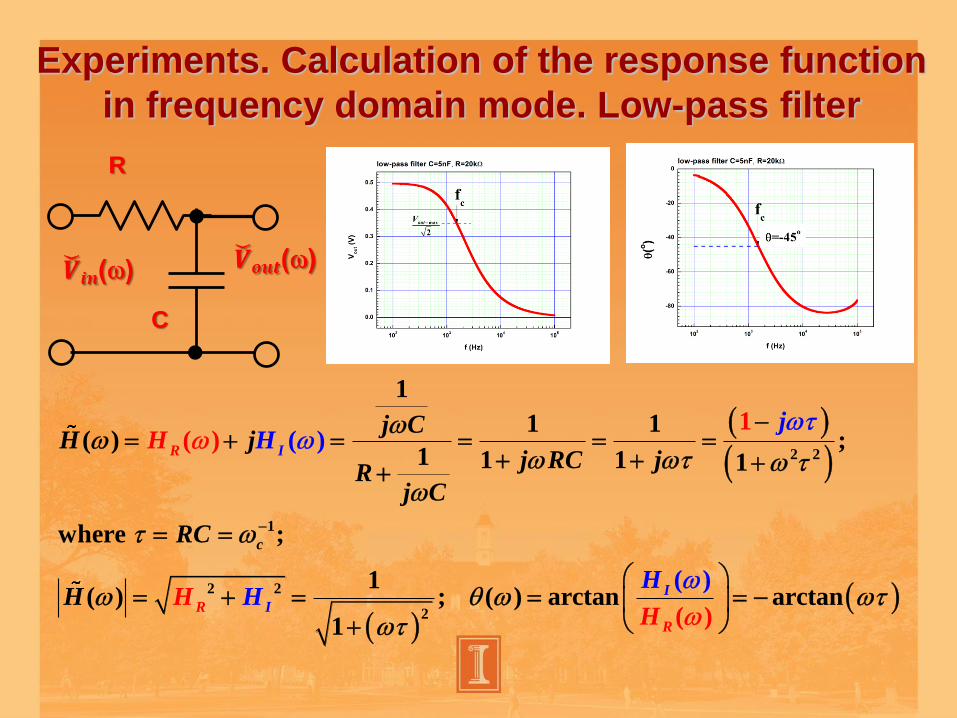
Experiments. Calculation of the response function
in frequency domain mode. Low-pass filter
2 2
1
2 2
2
1
1 1( ) ;
1 1 1 1
whe
1( )
re ;
1( ) ; ( ) arct
( )
an( )
( )arctan
1
R
R
I
R
c
I
I
j CH j
j RC jR
j
H
HH
C
RC
H
HHH
j
t t
t
t
t
t
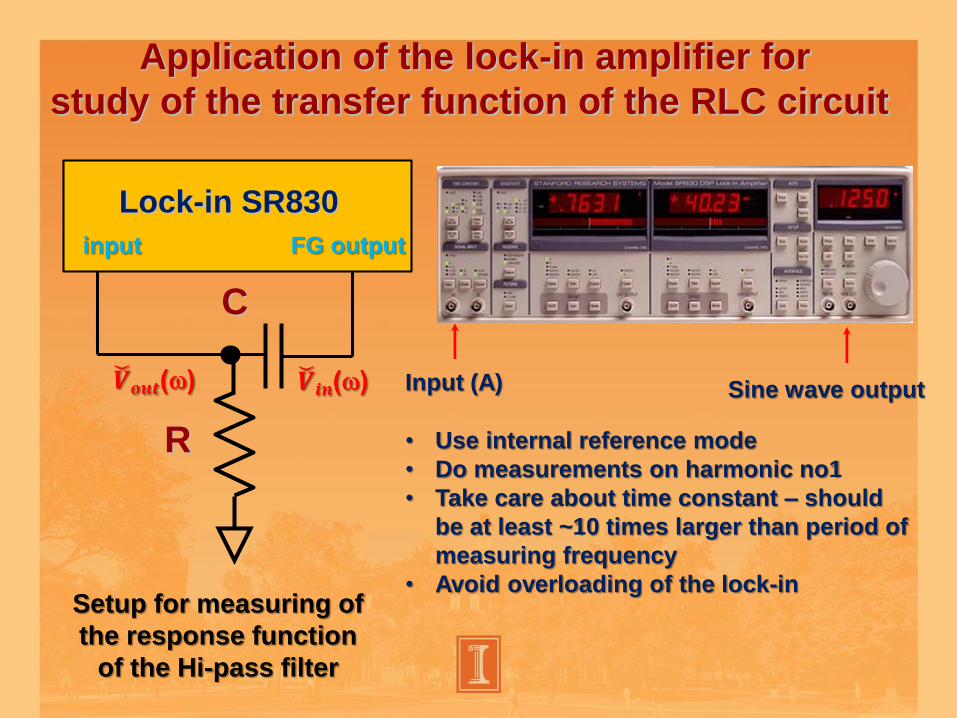
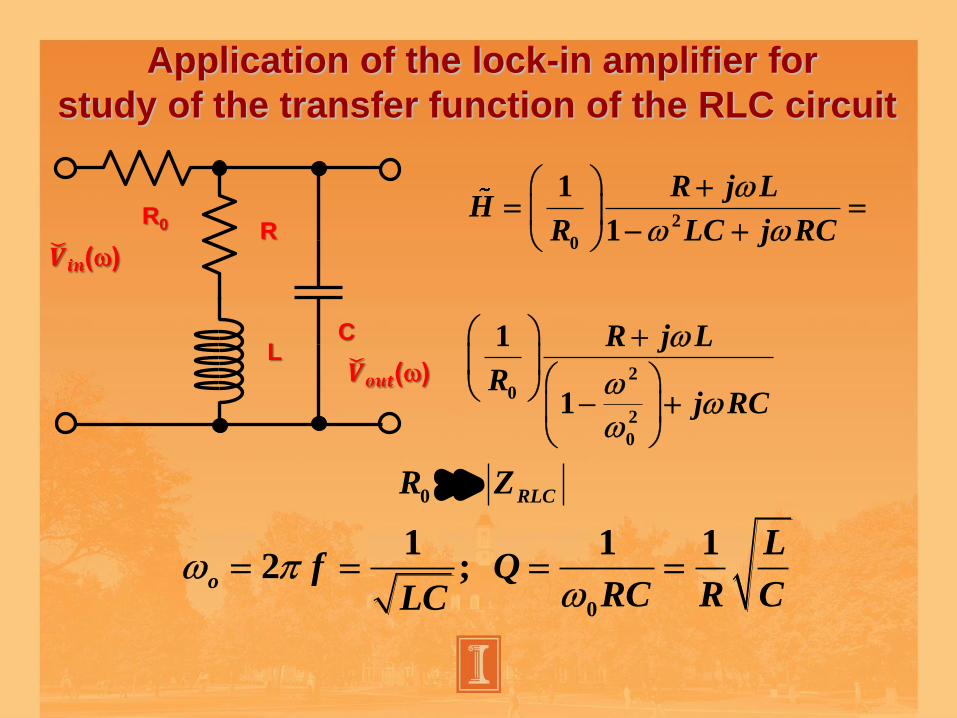
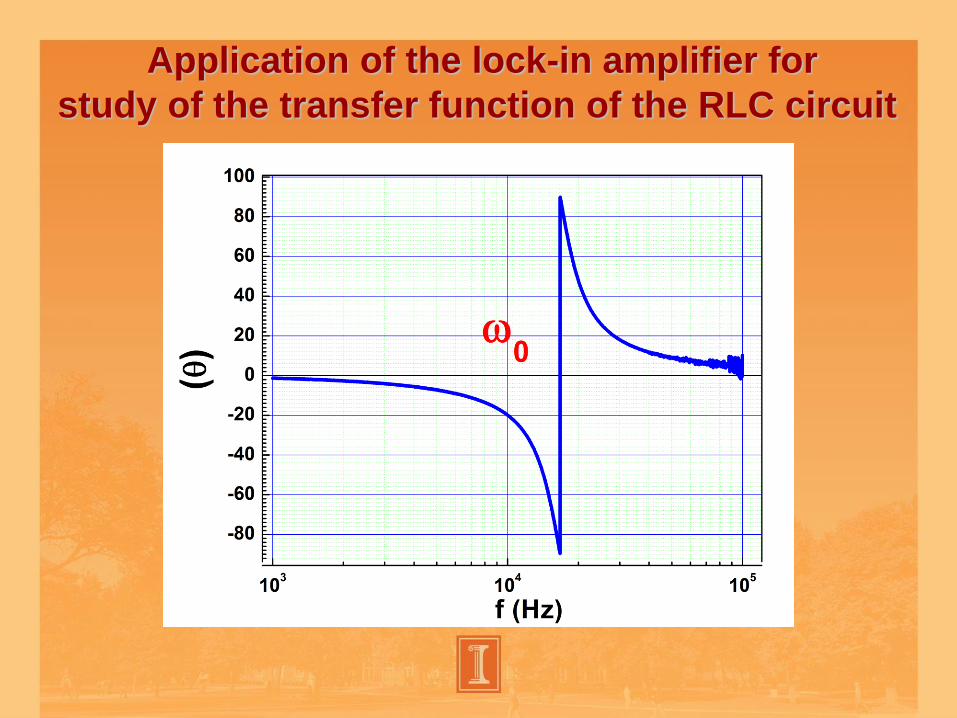
Application of the lock-in amplifier for
study of the transfer function of the RLC circuit
R
C
Lock-in SR830
input FG output
Setup for measuring of
the response function
of the Hi-pass filter
Input (A) Sine wave output
• Use internal reference mode
• Do measurements on harmonic no1
• Take care about time constant – should
be at least ~10 times larger than period of
measuring frequency
• Avoid overloading of the lock-in
Application of the lock-in amplifier for
study of the transfer function of the RLC circuit
R
LC
R0
0
1 1 12 ;
o
Lf Q
RC R CLC
2
0
20
2
0
1
1
1
1
R j LH
R LC j RC
R j L
Rj RC
0 RLCR Z
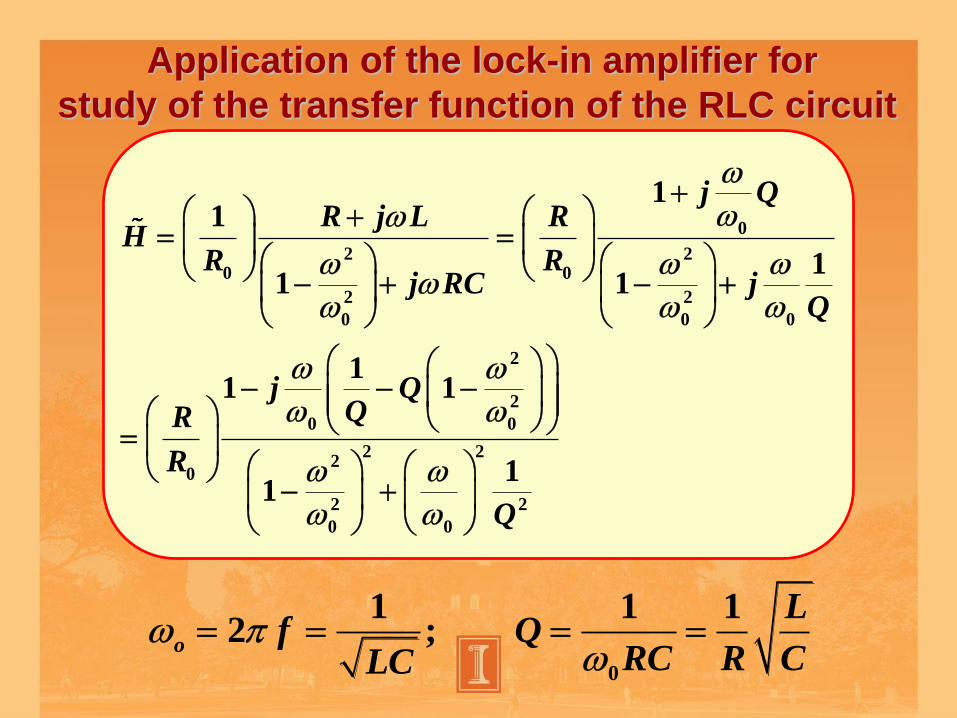
Application of the lock-in amplifier for
study of the transfer function of the RLC circuit
0
1 1 12 ;
o
Lf Q
RC R CLC
0
2 20 0
2 2
0 0 0
2
2
0 0
2 22
0
2 2
0 0
11
11 1
11 1
11
j QR j L R
HR R
j RC jQ
j QQR
R
Q
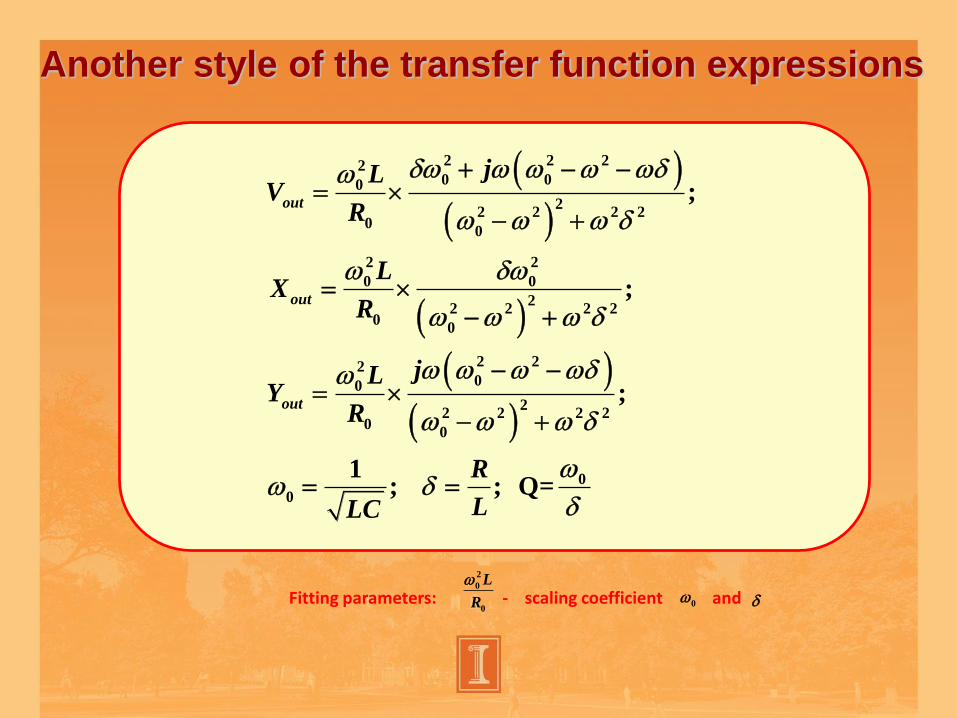
Another style of the transfer function expressions
2 2 220 00
22 2 2 2
00
2 2
0 0
22 2 2 2
00
2 2200
22 2 2 2
00
0
0
;
;
;
1; ; Q=
out
out
out
jLV
R
LX
R
jLY
R
R
LLC
2
0
0
L
R
0 Fitting parameters: - scaling coefficient and
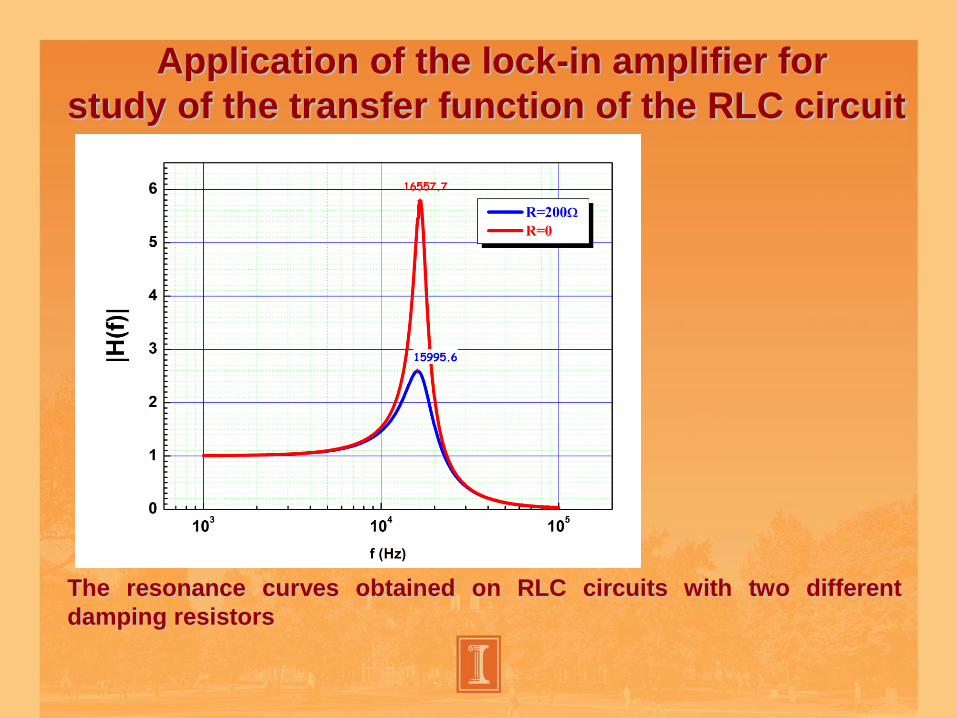
The resonance curves obtained on RLC circuits with two different
damping resistors
Application of the lock-in amplifier for
study of the transfer function of the RLC circuit
Application of the lock-in amplifier for
study of the transfer function of the RLC circuit

The example of fitting of the RLC circuit date to
the analytical expression could be found in: \\engr-file-03\PHYINST\APL Courses\PHYCS401\Common\Simple Examples\Lab 3 Frequency Domain
Analysis_example.opjj\
Fitting function
Fitting parameters
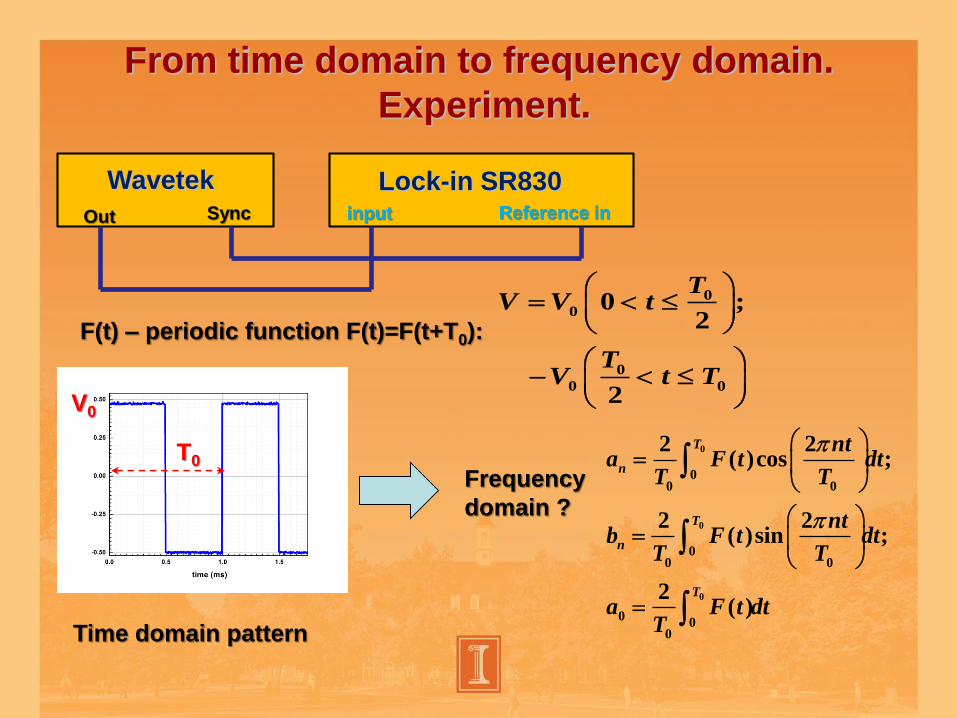
From time domain to frequency domain.
Experiment.
Lock-in SR830input Reference in
Wavetek
Out Sync
Time domain pattern
Frequency
domain ?
0
0
0
00 0
00 0
00
0
2 2( )cos ;
2 2( )sin ;
2( )
T
n
T
n
T
nta F t dt
T T
ntb F t dt
T T
a F t dtT
F(t) – periodic function F(t)=F(t+T0):
0
0
0
0 0
0 ; 2
2
TV V t
TV t T
V0
T0
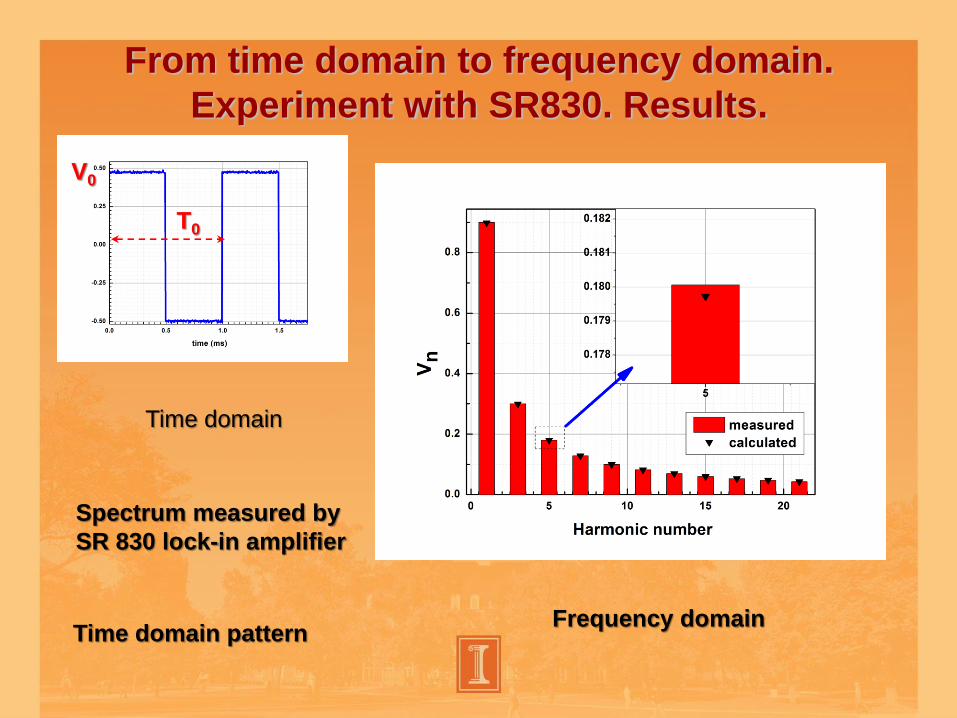
From time domain to frequency domain.
Experiment with SR830. Results.
Time domain pattern
V0
T0
Time domain
Frequency domain
Spectrum measured by
SR 830 lock-in amplifier
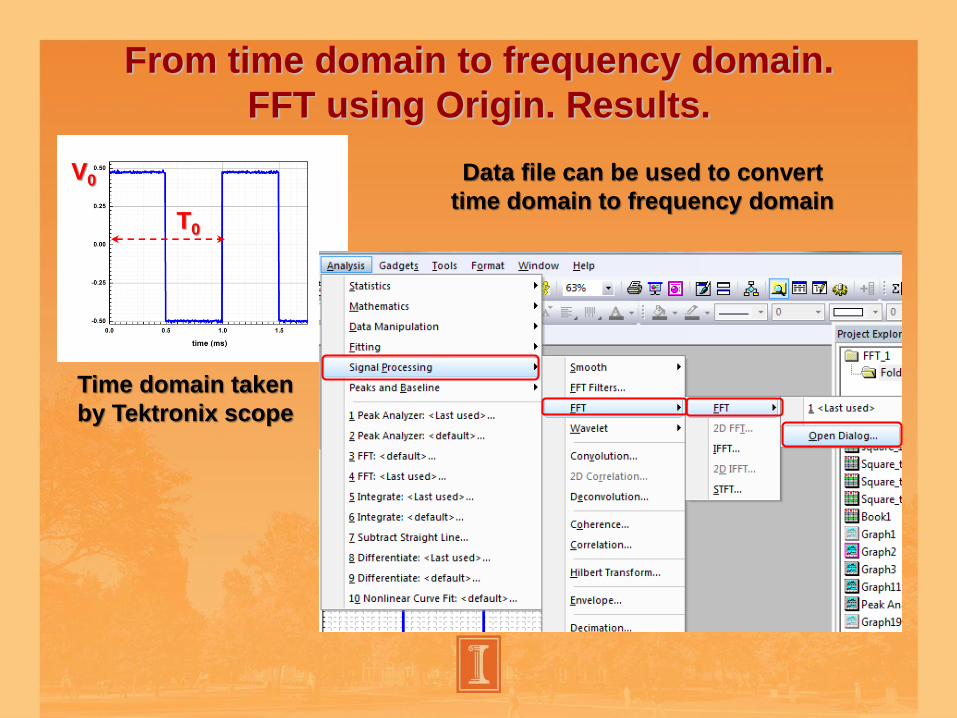
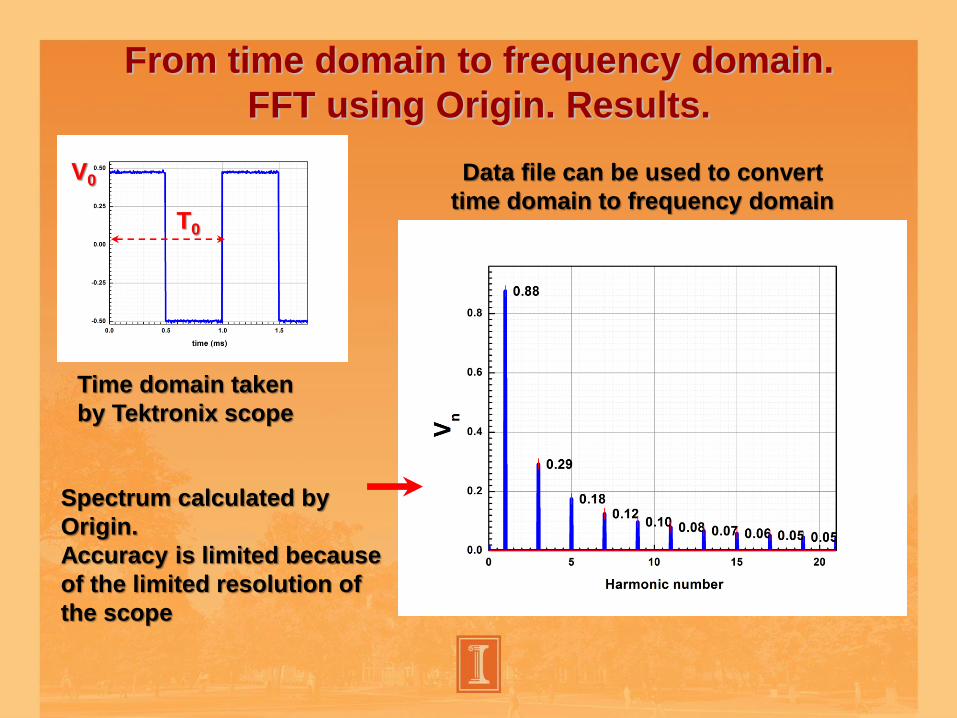
From time domain to frequency domain.
FFT using Origin. Results.
V0
T0
Time domain taken
by Tektronix scope
Data file can be used to convert
time domain to frequency domain
From time domain to frequency domain.
FFT using Origin. Results.
V0
T0
Time domain taken
by Tektronix scope
Data file can be used to convert
time domain to frequency domain
Spectrum calculated by
Origin.
Accuracy is limited because
of the limited resolution of
the scope
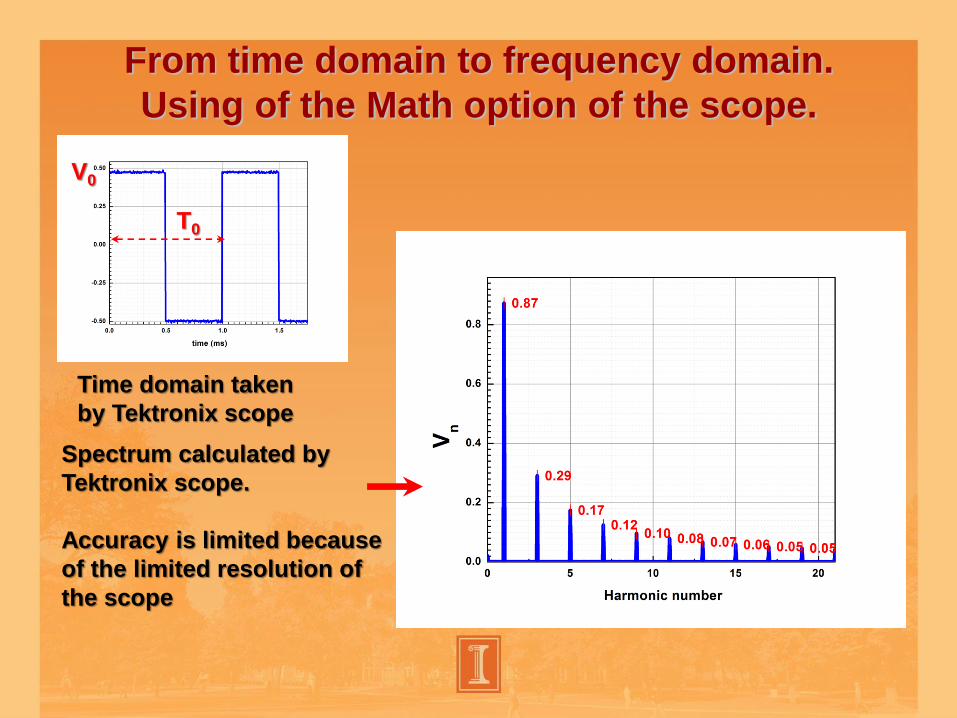
From time domain to frequency domain.
Using of the Math option of the scope.
V0
T0
Time domain taken
by Tektronix scope
Spectrum calculated by
Tektronix scope.
Accuracy is limited because
of the limited resolution of
the scope
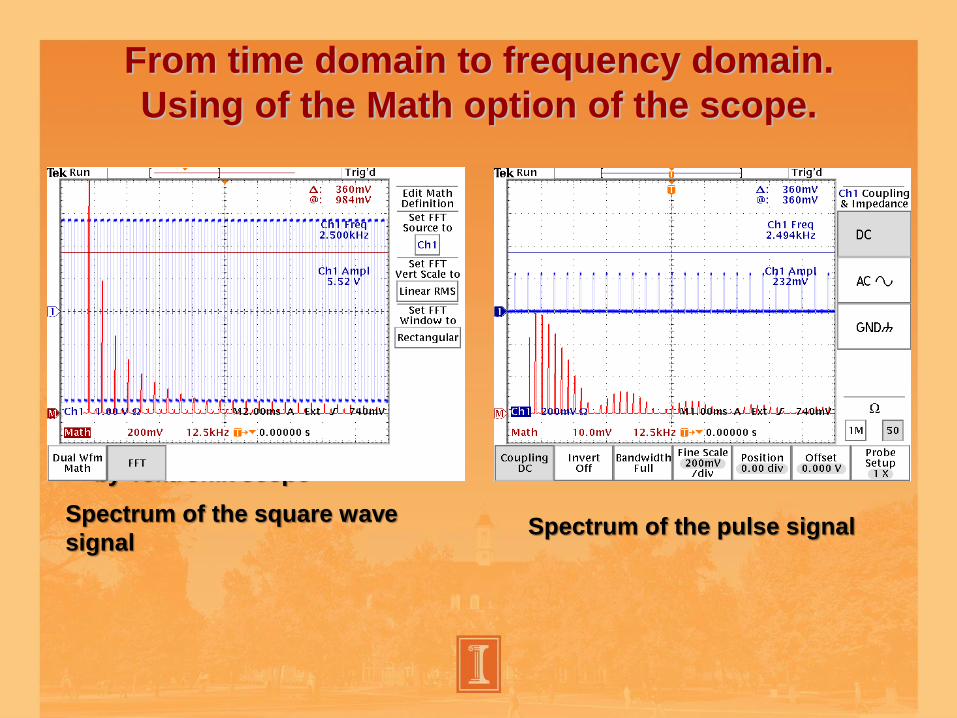
From time domain to frequency domain.
Using of the Math option of the scope.
Time domain taken
by Tektronix scope
Spectrum of the square wave
signalSpectrum of the pulse signal
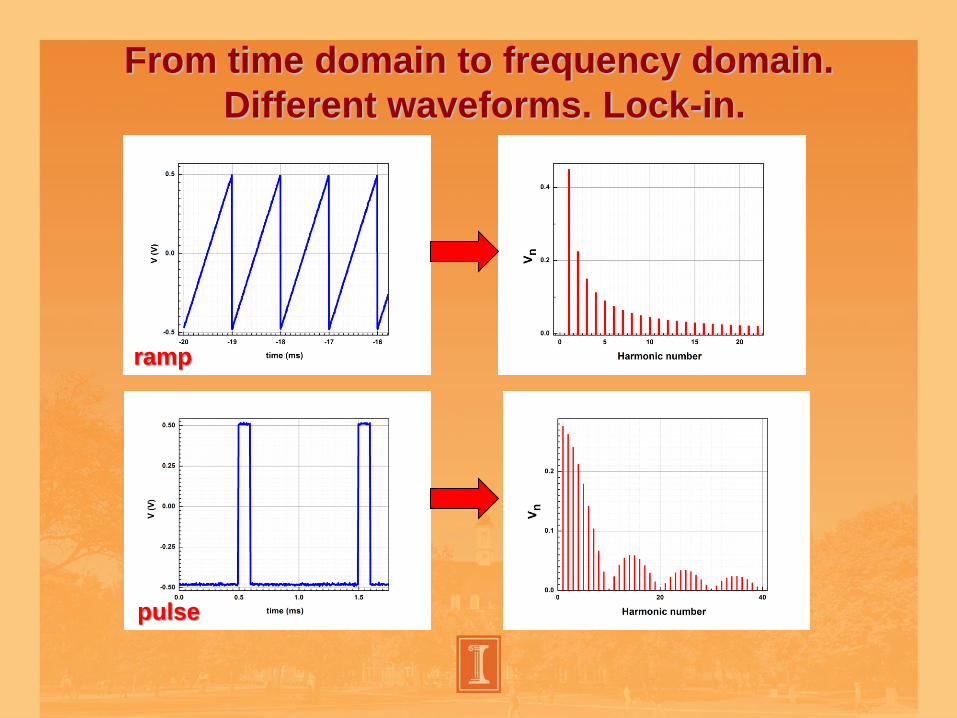
From time domain to frequency domain.
Different waveforms. Lock-in.
ramp
pulse
Appendix #1
Reminder: please submit the reports by e-mail in MsWord or pdf format.
Strongly recommend the file name structure as:
L1_lab2_student1
Lab section Lab number Your name
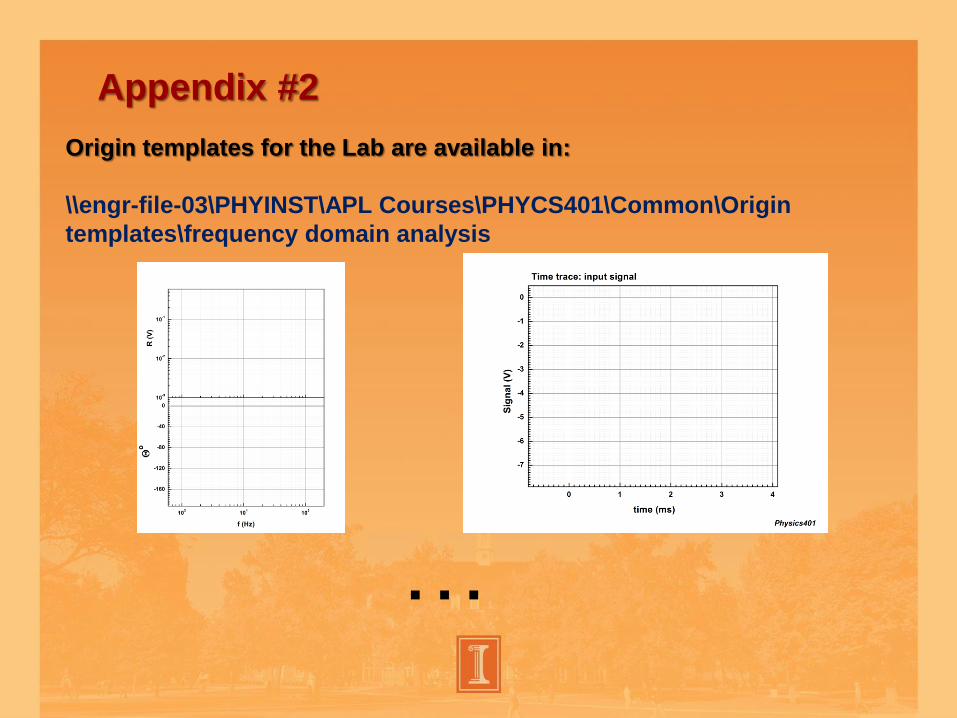
Appendix #2
Origin templates for the Lab are available in:
\\engr-file-03\PHYINST\APL Courses\PHYCS401\Common\Origin
templates\frequency domain analysis
…
References:
1. John H. Scofield, “A Frequency-Domain Description of a Lock-in
Amplifier” American Journal of Physics 62 (2) 129-133 (Feb. 1994).
2. Steve Smith “The Scientist and Engineer's Guide to Digital Signal
Processing” copyright ©1997-1998 by Steven W. Smith. For more
information visit the book's website at: www.DSPguide.com" *
• You can find a soft copy of this book in:
• \\engr-file-03\phyinst\APL Courses\PHYCS401\Experiments