fresenius medical care ag & co. kgaa...medical care management ag, fmc-ag & co. kgaa’s...
TRANSCRIPT

UNITED STATES
SECURITIES AND EXCHANGE COMMISSION Washington, D.C. 20549
_________________________________________
FORM 20-F (Mark One)
REGISTRATION STATEMENT PURSUANT TO SECTION 12(b) OR (g) OF THE SECURITIES EXCHANGE ACT OF 1934
or ANNUAL REPORT PURSUANT TO SECTION 13 OR 15(d) OF THE SECURITIES EXCHANGE ACT
OF 1934 For the fiscal year ended December 31, 2013
or TRANSITION REPORT PURSUANT TO SECTION 13 OR 15(d) OF THE SECURITIES EXCHANGE
ACT OF 1934 For the transition period from to
or SHELL COMPANY REPORT PURSUANT TO SECTION 13 OR 15(d) OF THE SECURITIES
EXCHANGE ACT OF 1934
Date of event requiring this shell company report Commission file number 001-32749
______________________
FRESENIUS MEDICAL CARE AG & Co. KGaA (Exact name of Registrant as specified in its charter)
FRESENIUS MEDICAL CARE AG & Co. KGaA
(Translation of Registrant's name into English)
Germany
(Jurisdiction of incorporation or organization)
_______________________
Else-Kröner Strasse 1, 61352 Bad Homburg, Germany
(Address of principal executive offices)
Josef Dinger, +49 6172 608 2522, [email protected],
Else-Kröner Strasse 1, 61352 Bad Homburg, Germany
(Name, Telephone, E-mail and/or Facsimile number and Address of Company Contact Person)
Securities registered or to be registered pursuant to Section 12(b) of the Act:
Title of each class Name of each exchange on which registered
American Depositary Shares representing Ordinary Shares New York Stock Exchange
Ordinary Shares, no par value New York Stock Exchange(1)
(1) Not for trading, but only in connection with the registration of American Depositary Shares representing
such shares.
Securities registered or to be registered pursuant to Section 12(g) of the Act: None
Securities for which there is a reporting obligation pursuant to Section 15(d) of the Act: 6 7/8 % Senior
Notes due 2017
Indicate the number of outstanding shares of each of the issuer's classes of capital or common stock as of the
close of the period covered by the annual report:
Ordinary Shares, no par value: 301,446,779
Indicate by check mark if the registrant is a well-known seasoned issuer, as defined in Rule 405 of the Security
Act.
Yes No
If this report is an annual or transition report, indicate by check mark if the registrant is not required to file
reports pursuant to Section 13 or 15(d) of the Securities Exchange Act of 1934.
Yes No
Note – Checking the box above will not relieve any registrant required to file reports pursuant to Section 13
or 15(d) of the Securities Exchange Act of 1934 from their obligations under those Sections.
Indicate by check mark whether the registrant (1) has filed all reports required to be filed by Section 13 or
15(d) of the Securities Exchange Act of 1934 during the preceding 12 months (or for such shorter period that the
registrant was required to file such reports) and (2) has been subject to such filing requirements for the past 90
days.
Yes No
Indicate by check mark whether the registrant has submitted electronically and posted on its corporate Web
site, if any, every Interactive Date File required to be submitted and posted pursuant to Rule 405 of Regulation
S-T (§232.405 of this chapter) during the preceding 12 months (or for such shorter period that the registrant was
required to submit and post such files).
Yes No
Indicate by check mark whether the registrant is a large accelerated filer, an accelerated filer, or a non-
accelerated filer. See definition of “accelerated filer and large accelerated filer” in Rule 12b-2 of the Exchange
Act. (Check one):
Large accelerated filer Accelerated filer Non-accelerated filer
Indicate by check mark which basis of accounting the registrant has used to prepare the financial statements
included in this filing:
U.S. GAAP
International Financial Reporting Standards as issued by the International Accounting Standards Board
Other
If “Other” has been checked in response to the previous question, indicate by check mark which financial
statement item the registrant has elected to follow:
Item 17
Item 18
If this is an annual report, indicate by check mark whether the registrant is a shell company (as defined in
Rule 12b-2 of the Exchange Act).
Yes No

i
TABLE OF CONTENTS
Page
INTRODUCTION
PART I
Item 1. N/A Identity of Directors, Senior Management and Advisors 3
Item 2. N/A Other Statistics and Expected Timetable 3
Item 3. Key Information 3
Item 4. Information on the Company 12
Item 4A. N/A Unresolved Staff Comments 53
Item 5. Operating and Financial Review and Prospects 53
Item 6. Directors, Senior Management and Employees 79
Item 7. Major Shareholders and Related Party Transactions 97
Item 8. Financial Information 102
Item 9. The Offer and Listing Details 103
Item 10. Additional Information 105
Item 11. Quantitative and Qualitative Disclosures About Market Risk 117
Item 12. Description of Securities other than Equity Securities 122
PART II
Item 13. N/A Defaults, Dividend Arrearages and Delinquencies 123
Item 14. Material Modifications to the Rights of Security Holders and Use of Proceeds 123
Item 15A. Disclosure Controls and Procedures 123
Item 15B. Management’s annual report on internal control over financial reporting 124
Item 15C. Attestation report of the registered public accounting firm 124
Item 15D. Changes in Internal Control over Financial Reporting 125
Item 16A. Audit Committee Financial Expert 125
Item 16B. Code of Ethics 125
Item 16C. Principal Accountant Fees and Services 125
Item 16D. N/A Exemptions from the Listing Standards for Audit Committees 126
Item 16E. Purchase of Equity Securities by the Issuer and Affiliated Purchaser 126
Item 16F. N/A Change in Registrant’s Certifying Accountant 126
Item 16G. Corporate Governance 126
PART III
Item 17. N/A Financial Statements 136
Item 18. Financial Statements 136
Item 19. Exhibits 136

1
Certain Defined Terms
In this report, (1) the “Company” refers to both Fresenius Medical Care AG prior to the transformation of
legal form discussed in Item 4.A, "Information on the Company – History and Development of the Company –
History" below and to Fresenius Medical Care AG & Co. KGaA after the transformation; (2) “we”, “us” and
“our” refers either to the Company or the Company and its subsidiaries on a consolidated basis both before and
after the transformation, as the context requires; (3) “Fresenius Medical Care AG” and “FMC-AG” refers to the
Company as a German stock corporation before the transformation of legal form and “FMC-AG & Co. KGaA”
refers to the Company as a German partnership limited by shares after the transformation and (4) “FMCH” and
“D-GmbH” refer, respectively, to Fresenius Medical Care Holdings, Inc., the holding company for our North
American operations and to Fresenius Medical Care Deutschland GmbH, one of our German subsidiaries. In
addition, “Fresenius SE” and “Fresenius SE & Co. KGaA” refers to Fresenius SE & Co. KGaA, a German
partnership limited by shares resulting from the change of legal form of Fresenius SE (effective as of January
2011), a European Company (Societas Europaea) previously called Fresenius AG, a German stock corporation.
Fresenius SE owns 100% of the share capital of our general partner and 94,380,382 of our ordinary shares as of
February 19, 2014, 31.3% based on 301,491,605 outstanding shares, as reported herein (prior to the
transformation of our legal form, it held approximately 51.8% of our voting shares). In this report, we use
Fresenius SE to refer to that company as a partnership limited by shares, effective on and after January 28, 2011,
as well as both before and after the conversion of Fresenius AG from a stock corporation into a European
Company on July 13, 2007. The phrase “Fresenius SE and its subsidiaries” refers to Fresenius SE and all of the
companies of the Fresenius SE group, other than FMC-AG & Co. KGaA and the subsidiaries of FMC-AG & Co.
KGaA. Each of “Management AG”, “FMC Management AG” and the “General Partner” refers to Fresenius
Medical Care Management AG, FMC-AG & Co. KGaA’s general partner and a wholly owned subsidiary of
Fresenius SE. “Management Board” and “our Management Board” refer to the members of the management
board of Management AG and, except as otherwise specified, “Supervisory Board” and “our Supervisory Board”
refer to the supervisory board of FMC-AG & Co. KGaA. The term “North America Segment” refers to our
North America operating segment. The term “International Segment” refers to our combined EMEALA (Europe,
Middle East, Africa, and Latin America) and AP (Asia-Pacific) operating segments. All references in this report
to the notes to our financial statements are to the Notes to Consolidated Financial Statements included in this
report.
Forward-looking Statements
This report contains forward-looking statements within the meaning of Section 27A of the Securities Act of
1933, as amended, and Section 21E of the Securities Exchange Act of 1934, as amended (the “Exchange Act”).
When used in this report, the words “outlook”, "expects," "anticipates," "intends," "plans," "believes," "seeks,"
"estimates" and similar expressions are generally intended to identify forward looking statements. Although we
believe that the expectations reflected in such forward-looking statements are reasonable, forward-looking
statements are inherently subject to risks and uncertainties, many of which cannot be predicted with accuracy
and some of which might not even be anticipated, and future events and actual results, financial and otherwise,
could differ materially from those set forth in or contemplated by the forward-looking statements contained
elsewhere in this report. We have based these forward-looking statements on current estimates and assumptions
made to the best of our knowledge. By their nature, such forward-looking statements involve risks, uncertainties,
assumptions and other factors which could cause actual results, including our financial condition and
profitability, to differ materially and be more negative than the results expressly or implicitly described in or
suggested by these statements. Moreover, forward-looking estimates or predictions derived from third parties’
studies or information may prove to be inaccurate. Consequently, we cannot give any assurance regarding the
future accuracy of the opinions set forth in this report or the actual occurrence of the developments described
herein. In addition, even if our future results meet the expectations expressed here, those results may not be
indicative of our performance in future periods.
These risks, uncertainties, assumptions, and other factors that could cause actual results to differ from our
projected results include, among others, the following:
changes in governmental and commercial insurer reimbursement for our complete products and
services portfolio, including the expanded United States (“U.S.”) Medicare reimbursement system for
dialysis services;
changes in utilization patterns for pharmaceuticals and in our costs of purchasing pharmaceuticals;
the outcome of ongoing government and internal investigations;

2
risks relating to compliance with the myriad government regulations applicable to our business
including, in the U.S., the Anti-Kickback Statute, the False Claims Act, the Stark Law and the Foreign
Corrupt Practices Act, and comparable regulatory regimes in many of the 120 countries in which we
supply dialysis services and/ or products;
the influence of private insurers and managed care organizations;
the impact of recently enacted and possible future health care reforms;
product liability risks;
the outcome of ongoing potentially material litigation;
risks relating to the integration of acquisitions and our dependence on additional acquisitions;
the impact of currency fluctuations;
introduction of generic or new pharmaceuticals that compete with our pharmaceutical products;
changes in raw material and energy costs or the ability to procure raw materials; as well as
the financial stability and liquidity of our governmental and commercial payors.
Important factors that could contribute to such differences are noted in Item 3D, “Key Information – Risk
Factors” in Item 4, “Information on the Company,” under “Business Overview,” in Item 5, “Operating and
Financial Review and Prospects” and in Note 20 of the Notes to Consolidated Financial Statements,
“Commitments and Contingencies” included in this report.
Our business is also subject to other risks and uncertainties that we describe from time to time in our public
filings. Developments in any of these areas could cause our results to differ materially from the results that we or
others have projected or may project.
Our reported financial condition and results of operations are sensitive to accounting methods, assumptions
and estimates that are the basis of our financial statements. The actual accounting policies, the judgments made
in the selection and application of these policies, and the sensitivities of reported results to changes in accounting
policies, assumptions and estimates, are factors to be considered along with our financial statements and the
discussion under “Results of Operations” in Item 5 below, “Operating and Financial Review and Prospects.” For
a discussion of our critical accounting policies, see Item 5, “Operating and Financial Review and Prospects –
Critical Accounting Policies” below in this report.

3
PART I
Item 1. Identity of Directors, Senior Management and Advisors
Not applicable
Item 2. Other Statistics and Expected Timetable
Not applicable
Item 3. Key Information
A. Selected Financial Data
The following table summarizes the consolidated financial information for our business for each of the years
2013 through 2009. We derived the selected financial information from our consolidated financial statements.
We prepared our financial statements in accordance with accounting principles generally accepted in the United
States of America and KPMG AG Wirtschaftsprüfungsgesellschaft (“KPMG”), an independent registered public
accounting firm, audited these financial statements. All American Depositary Share (“ADS”) and per ADS data
reflect the two-for-one split of the ADSs representing our ordinary shares and the ADSs representing our
previously outstanding preference shares, which was effective December 3, 2012. As a result of the split of our
ADSs, the ratio of each class of ADSs was changed from one ADSs representing one share to two ADSs
representing one share. (See Item4.A, “Information on the Company – History and Development of the
Company – History”). All per ADS amounts in the table have been restated to reflect the ADS splits. You should
read this information together with our consolidated financial statements and the notes to those statements
appearing elsewhere in this report and the information under Item 5, “Operating and Financial Review and
Prospects.”
2013 2012 2011 2010 2009
(in millions except share and per share amounts)
Statement of Operations Data:
Net revenues(a) $ 14,610 $ 13,800 $ 12,570 $ 11,844 $ 11,047
Cost of revenues 9,872 9,199 8,418 8,009 7,504
Gross profit 4,738 4,601 4,152 3,835 3,543
Selling, general and administrative 2,391 2,223 2,002 1,823 1,698
Gain on sale of dialysis clinics (9) (36) (5) - -
Research and development 126 112 111 97 94
Income from equity method investees (26) (17) (31) (9) (5)
Other operating expenses - 100 - - -
Operating income 2,256 2,219 2,075 1,924 1,756
Investment gain - 140 - - -
Interest expense, net 409 426 297 280 300
Income before income taxes 1,847 1,933 1,778 1,644 1,456
Net income attributable to shareholders of FMC-AG &
Co. KGaA $ 1,110 $ 1,187 $ 1,071 $ 979 $ 891
Weighted average ordinary shares outstanding 301,877,304 301,139,652 299,012,744 296,808,978 294,418,795
Basic earnings per Ordinary share $ 3.65 $ 3.89 $ 3.54 $ 3.25 $ 2.99
Basic earnings per Ordinary ADS(b) 1.83 1.94 1.77 1.62 1.49
Fully diluted earnings per Ordinary share 3.65 3.87 3.51 3.24 2.99
Fully diluted earnings per Ordinary ADS (b) 1.83 1.93 1.75 1.62 1.49
Dividends declared and paid per Ordinary share (€)(c) 0.75 0.69 0.65 0.61 0.58
Dividends declared and paid per Ordinary share ($)(c) 1.03 0.89 0.93 0.77 0.78

4
2013 2012 2011 2010 2009
(in millions except share and per share amounts)
Balance Sheet Data at December 31:
Working capital $ 2,733 $ 2,957 $ 1,432 $ 1,363 $ 2,118
Total assets 23,120 22,326 19,533 17,095 15,821
Total long-term debt (excluding current portion) 7,747 7,842 5,495 4,310 5,084
Shareholders’ equity 9,485 9,207 8,061 7,524 6,798
Capital Stock - Preference shares - Nominal Value(d) - 4 4 4 4
Capital Stock - Ordinary shares - Nominal Value 382 375 372 369 366
(a) The provision for bad debts relating to dialysis services which we presented as an operating expense before 2012 has been reclassified to a deduction from patient service revenue in
accordance with US GAAP.
(b) Basic earnings per Ordinary ADS and fully diluted earnings per Ordinary ADS have been restated to reflect a two-for-one split of our Ordinary ADSs outstanding effected on
December 3, 2012, which changed the ratio from one ADSs representing one share to two ADSs representing one share.
(c) Amounts shown for each year from 2013 to 2009 represent dividends declared and paid in each such year with respect to our operations in the year preceding payment. Our General
Partner’s Management Board has proposed dividends with respect to our operations in 2013 of €0.77 per Ordinary share . These dividends are subject to approval by our shareholders at
our Annual General Meeting ("AGM") to be held on May 15, 2014.
(d) As of June 28, 2013 all preference shares for capital stock were converted into ordinary shares. As of December 31, 2013 only one class of shares exists.
We conduct our business on a global basis in various currencies, although our operations are located
principally in the United States (“U.S”) and Germany. We prepare our consolidated financial statements, from
which we derived the selected financial data above, utilizing the U.S. dollar as our reporting currency. We have
converted the balance sheets of our non-U.S. dollar denominated operations into U.S. dollars at the exchange
rates prevailing at the balance sheet date. Revenues and expenses are translated at the average exchange rates for
the respective period, as shown. For information regarding the exchange rates used in preparing our consolidated
financial statements, see Item 11, “Quantitative and Qualitative Disclosures About Market Risk - Management
of Foreign Exchange and Interest Rate Risks – Foreign Exchange Risks.”
D. Risk Factors
Before you invest in our securities, you should be aware that the occurrence of any of the events described in
the following risk factors or elsewhere in this report, and other events that we have not predicted or assessed
could have a material adverse effect on our results of operations, financial condition and business. If the events
described below or other unpredicted events occur, then the trading price of our securities could decline and you
may lose all or part of your investment.
Risks Relating to Regulatory Matters.
A change in U.S. government reimbursement for dialysis care could materially decrease our revenues and
operating profit.
For the twelve months ended December 31, 2013, approximately 32% of our consolidated revenues resulted
from Medicare and Medicaid reimbursement. Legislative changes or changes in government reimbursement
practice may affect the reimbursement rates for the services we provide, as well as the scope of Medicare and
Medicaid coverage. A decrease in Medicare or Medicaid reimbursement rates or covered services could have a
material adverse effect on our business, financial condition and results of operations. For further information
regarding Medicare and Medicaid reimbursement, see Item 4B, “Information on the Company – Business
Overview – Regulatory and Legal Matters – Reimbursement” and Item 5, “Operating and Financial Review and
Prospects – Overview.”
The utilization of ESAs could materially impact our revenue and operating profit. An interruption of supply
or our inability to obtain satisfactory terms for ESAs could reduce our revenues and operating profit.
Erythropoietin stimulating agents, or ESAs, are produced in the U.S. by Amgen Inc., under the brand names
Epogen® (epoeitin alfa) and Aranesp® (darbepoetin alfa). Under the Medicare end stage renal disease (“ESRD”)
prospective payment system (“ESRD PPS”) effective January 1, 2011, payment for ESAs is generally included
in the bundled rate; previously, it was reimbursed separately. Any of the following developments could
materially adversely affect our business, financial condition and results of operations: (i) a reduction of the
current overfill amount in ESA vials that we currently use (liquid medications, such as ESAs, typically include a
small overfill amount to ensure that the fill volume can be extracted from the vial as administered to the patient),
(ii) an interruption of supply of ESAs, or (iii) material increases in the utilization of or acquisition costs for
ESAs.

5
If we do not comply with the many governmental regulations applicable to our business, we could be excluded
from government healthcare reimbursement programs or our authority to conduct business could be
terminated, either of which would result in a material decrease in our revenue.
Our operations in both our dialysis care business and our products business are subject to extensive
governmental regulation in virtually every country in which we operate. We are also subject to other laws of
general applicability, including antitrust laws. The applicable regulations, which differ from country to country,
cover areas that include:
the quality, safety and efficacy of medical and pharmaceutical products and supplies;
the operation of manufacturing facilities, laboratories and dialysis clinics;
product labeling, advertising and other promotion;
accurate reporting and billing for government and third-party reimbursement; and
compensation of medical directors and other financial arrangements with physicians and other referral
sources.
Failure to comply with one or more of these laws or regulations may give rise to a number of legal
consequences. These include, in particular, monetary and administrative penalties, increased costs for
compliance with government orders, complete or partial exclusion from government reimbursement programs or
complete or partial curtailment of our authority to conduct business. Any of these consequences could have a
material adverse impact on our business, financial condition and results of operations.
The Company’s medical devices and drug products are subject to detailed, rigorous and frequently changing
regulation by the U.S. Food and Drug Administration (“FDA”), and numerous other national, supranational,
federal and state authorities. These regulations include, among other things, regulations regarding product
approvals, manufacturing practices, product labeling and promotion, quality control, quality assurance, and post-
marketing safety reporting, including adverse event reporting and reporting of certain field actions. We cannot
assure that all necessary regulatory approvals for new products or product improvements will be granted on a
timely basis or at all. In addition, the Company's facilities and procedures and those of its suppliers are subject to
periodic inspection by the FDA and other regulatory authorities. The FDA and comparable regulatory authorities
outside the U.S. may suspend, revoke, or adversely amend the authority necessary for manufacture, marketing,
or sale of our products and those of our suppliers. The Company and its suppliers must incur expense and spend
time and effort to ensure compliance with these complex regulations, and if such compliance is not maintained,
they could be subject to significant adverse administrative and judicial enforcement actions in the future. These
possible enforcement actions could include warning letters, injunctions, civil penalties, seizures of the
Company's products, and criminal prosecutions as well as dissemination of information to the public about such
enforcement actions. These actions could result in, among other things, substantial modifications to the
Company’s business practices and operations; refunds; a total or partial shutdown of production while the
alleged violation is remedied; and withdrawals or suspensions of current products from the market. Any of these
events, in combination or alone, could disrupt the Company’s business and have a material adverse effect on the
Company's business, financial condition and results of operations. For a discussion of open FDA warning letters,
see “Regulatory and Legal Matters – Regulatory Overview – Product Regulation – Medical Devices.”
We rely upon the Company’s management structure, regulatory and legal resources and the effective
operation of our compliance programs to direct, manage and monitor our operations to comply with government
regulations. If employees were to deliberately, recklessly or inadvertently fail to adhere to these regulations, then
our authority to conduct business could be terminated and our operations could be significantly curtailed. Any
such terminations or reductions could materially reduce our sales. If we fail to identify in our diligence process
or to promptly remediate any non-compliant business practices in companies that we acquire, we could be
subject to penalties, claims for repayment or other sanctions. Any such terminations or reductions could
materially reduce our sales, with a resulting material adverse effect on our business, financial condition and
results of operations.
By virtue of this regulatory environment, our business activities and practices are subject to extensive review
by regulatory authorities and private parties, and continuing audits, subpoenas, other inquiries, claims and
litigation relating to the Company’s compliance with applicable laws and regulations. We may not always be
aware that an inquiry or action has begun, particularly in the case of “qui tam” or “whistle blower” actions
brought by private plaintiffs under the False Claims Act, which are initially filed under seal. We are the subject
of a number of governmental inquiries and civil suits by the federal government and private plaintiffs. For
information about certain of these pending investigations and lawsuits, see Note 20 of the Notes to our

6
Consolidated Financial Statements, “Commitments and Contingencies – Other Litigation and Potential
Exposures.”
We operate in many different jurisdictions and we could be adversely affected by violations of the U.S.
Foreign Corrupt Practices Act and similar worldwide anti-corruption laws.
The U.S. Foreign Corrupt Practices Act (“FCPA”) and similar worldwide anti-corruption laws generally
prohibit companies and their intermediaries from making improper payments to public officials for the purpose
of obtaining or retaining business. Our internal policies mandate compliance with these anti-corruption laws. We
operate many facilities throughout the United States and other parts of the world. Our decentralized system has
thousands of persons employed by many affiliated companies, and we rely on our management structure,
regulatory and legal resources and effective operation of our compliance program to direct, manage and monitor
the activities of these employees. Despite our training, oversight and compliance programs, we cannot assure
you that our internal control policies and procedures always will protect us from deliberate, reckless or
inadvertent acts of our employees or agents that contravene the Company’s compliance policies or violate
applicable laws. Our continued expansion, including in developing countries, could increase the risk of such
violations in the future. Violations of these laws, or allegations of such violations, could disrupt our business and
result in a material adverse effect on our results of operations or financial condition. The Company has received
communications alleging certain conduct in certain countries outside the U.S. and Germany that may violate the
FCPA or other anti-bribery laws. The Audit and Corporate Governance Committee of the Company's
Supervisory Board is conducting an internal review with the assistance of independent counsel retained for such
purpose. The Company voluntarily advised the U.S. Securities and Exchange Commission ( “SEC”) and the
U.S. Department of Justice (“DOJ”) that allegations have been made and of the Company's internal review. The
Company’s review and dialogue with the SEC and DOJ are ongoing. See “Item 15B. Management’s annual
report on internal control over financial reporting” and Note 20 of the Notes to our Consolidated Financial
Statements, “Commitments and Contingencies – Other Litigation and Potential Exposures.”
If our joint ventures violate the law, our business could be adversely affected.
A number of the dialysis centers and vascular access centers we operate are owned, or managed, by joint
ventures in which we hold a controlling interest and one or more hospitals, physicians or physician practice
groups hold a minority interest. Physician owners, who are usually nephrologists, may also provide medical
director services and physician owners may refer patients to those centers or other centers we own and operate or
to other physicians who refer patients to those centers or other centers we own and operate. While we have
structured our joint ventures to comply with many of the criteria for safe harbor protection under the U.S.
Federal Anti- Kickback Statute, our investments in these joint venture arrangements do not satisfy all elements
of such safe harbor. While we have established comprehensive compliance policies, procedures and programs to
ensure ethical and compliant joint venture business operations, if one or more of our joint ventures were found to
be in violation of the Anti-Kickback Statute or the Stark Law, we could be required to restructure or terminate
them. We also could be required to repay to Medicare amounts received by the joint ventures pursuant to any
prohibited referrals, and we could be subject to criminal and monetary penalties and exclusion from Medicare,
Medicaid and other U.S. federal and state healthcare programs. Imposition of any of these penalties could have a
material adverse effect on our business, financial condition and results of operations.
Proposals for healthcare reform, or relating to regulatory approvals, could decrease our revenues and
operating profit.
Many of the countries in which we operate have been considering proposals to modify their current
healthcare systems to improve access to health care and to control costs. Policymakers in the U.S. and elsewhere
are also considering reforms that could change the methodology used to reimburse providers of health care
services, including dialysis. We cannot predict whether and when these reform proposals will be adopted in
countries in which we operate or what impact they might have on us. In the U.S., automatic across-the-board
spending cuts over nine fiscal years (2013-2021), projected to total $1.2 trillion for all Federal government
programs went into effect on March 1, 2013. Medicare payments to providers and suppliers are subject to these
reductions, but these reductions are limited to one adjustment of no more than 2 percent through 2021. Any
decrease in spending or other significant changes in state funding in countries in which we operate, particularly
significant changes in the U.S. Medicare and Medicaid programs, could reduce our sales and profitability and
have a material adverse effect on our business, financial condition and results of operations.
See Item 4, “Information on the Company – Business Overview – Regulatory and Legal Matters –
Reimbursement” and “- Healthcare reform:” and Item 5, “Operating and Financial Review and Prospects –
Financial Condition and Results of Operations - Overview” for information regarding the impact of the ESRD
PPS on our business, our efforts to mitigate some of its effects, and the anticipated effects of the Patient

7
Protection and Affordable Care Act (“ACA”) on our business, as well as additional information regarding the
legislation and other matters discussed above.
In addition, there may be legislative or regulatory proposals that could affect FDA procedures or decision-
making for approving medical device or drug products. Any such legislation or regulations, if enacted or
promulgated, could result in a delay or denial of regulatory approval for our products. If any of our products do
not receive regulatory approval, or there is a delay in obtaining approval, this also could have a material adverse
effect on our business, financial condition and results of operations.
In the United States, the ACA authorized state and federal health care exchanges to provide greater access to
private health insurance coverage. These exchanges are scheduled to go into effect in 2014, and it is not yet
known how the insurance coverage available through the exchanges will impact reimbursement for dialysis and
vascular access services, if at all. There can be no assurance that we can achieve future price increases from
private insurers and managed care organizations offering coverage through the federal and state health care
exchanges that are comparable to those we have historically received. Any reductions in reimbursement from
private insurers and managed care organizations could materially and adversely impact our operating results.
Moreover, further changes in the U.S. healthcare reforms may be debated by Congress. Whether significant
changes in policy will result is unknown. Changes, if any, that may result from these events could, depending on
the details, have positive or adverse effects, possibly material, on our businesses and results of operations. Any
significant healthcare reforms that substantially change the financing and regulation of the healthcare industry in
countries in which we operate could reduce our sales and profitability and have a material adverse effect on our
business, financial condition and results of operations.
Risks Relating to Our Business
A significant portion of our North America Segment profits is dependent on the services we provide to a
minority of our patients who are covered by private insurance.
Government reimbursement programs generally pay less than private insurance. Medicare only pays us 80%
of the Medicare allowable amount (the patient, Medicaid or secondary insurance being responsible for the
remaining 20%), and Medicaid rates are comparable. As a result, the payments we receive from private payors
generate a substantial portion of the profits we report. We estimate that Medicare and Medicaid are the primary
payors for approximately 76% of the patients to whom we provide care in North America but that for 2013, we
derived 53% of our North America Segment Dialysis Care net revenues (amounting to 32% of our worldwide
revenue) from Medicare and Medicaid. Therefore, if the private payors who pay for the care of the other 24% of
our North America segment’s patients reduce their payments for our services, or if we experience a material shift
in our revenue mix toward Medicare or Medicaid reimbursement, then our revenue, cash flow and earnings
would materially decrease.
Over the last few years, we have generally been able to implement modest annual price increases for private
insurers and managed care organizations, but government reimbursement has remained flat or has been increased
at rates below typical consumer price index (“CPI”) increases. Under the ESRD PPS, Medicare payment rates
are updated annually based on the CPI of relevant market inputs, less an adjustment to account for productivity
improvements (0.4% for 2013). Medicare will implement further reductions pursuant to the American Taxpayer
Relief Act of 2012, to account for reduced drug utilizations. In 2014, Medicare’s base payment rate will be
reduced by $8.16 to account for this effect, and U.S. Centers for Medicare & Medicaid Services (“CMS”)
expects a total reduction, phased in over three to four years, of $29.93. See “Item 4. Information on the
Company- Regulatory and Legal Matters- Reimbursement- U.S.- Budget Control Act and American Taxpayer
Relief Act”. There can be no assurance that we can achieve future price increases from private insurers and
managed care organizations comparable to those we have historically received. With increased governmental
reform and regulatory activity, reimbursement from private insurers may be subject to downward pressure in the
coming years. The advent of the federal and state health care exchanges may also negatively impact
reimbursement from private insurance. Any reductions in reimbursement from private insurers and managed care
organizations could materially and adversely impact our operating results. Any reduction in our ability to attract
private pay patients to utilize our dialysis services relative to historical levels could adversely impact our
operating results. Any of the following events, among others, could have a material adverse effect on our
operating results:
a portion of our business that is currently reimbursed by private insurers or hospitals may become
reimbursed by managed care organizations, which generally have lower rates for our services; or

8
a portion of our business that is currently reimbursed by private insurers at rates based on our billed
charges may become reimbursed under contracts at lower rates.
We are exposed to product liability, patent infringement and other claims which could result in significant
costs and liability which we may not be able to insure on acceptable terms in the future.
Healthcare companies are typically subject to claims alleging negligence, product liability, breach of
warranty, malpractice and other legal theories that may involve large claims and significant defense costs
whether or not liability is ultimately imposed. Healthcare products may also be subject to recalls and patent
infringement claims which, in addition to monetary penalties, may restrict our ability to sell or use our products.
We cannot assure that such claims will not be asserted against us; for example, that significant adverse verdicts
will not be reached against us for patent infringements or that large scale recalls of our products will not become
necessary. In addition, the laws of some of the countries in which we operate provide legal rights to users of
pharmaceutical products that could increase the risk of product liability claims. Product liability and patent
infringement claims, other actions for negligence or breach of contract and product recalls or related sanctions
could result in significant costs. These costs could have a material adverse effect on our business, financial
condition and results of operations. See Note 20 of the Notes to Consolidated Financial Statements,
“Commitments and Contingencies.”
While we have been able to obtain liability insurance in the past to partially cover our business risks, we
cannot assure that such insurance will be available in the future either on acceptable terms or at all. In addition,
FMCH, our largest subsidiary, is partially self-insured for professional, product and general liability, auto
liability and worker’s compensation claims, up to pre-determined levels above which our third-party insurance
applies. A successful claim in excess of the limits of our insurance coverage could have a material adverse effect
on our business, results of operations and financial condition. Liability claims, regardless of their merit or
eventual outcome, also may have a material adverse effect on our business and reputation, which could in turn
reduce our sales and profitability.
The Company is vigorously defending certain patent infringement lawsuits and certain wrongful death and
personal injury lawsuits alleging inadequate labeling and warnings for certain of our dialysate concentrate
products. See Note 20 of the Notes to Consolidated Financial Statements, “Legal and Regulatory Matters –
Commercial Litigation”. While we believe we have valid defenses to these claims, an adverse determination in
any of these matters could have a material adverse effect on the Company’s business, financial condition and
results of operations.
Our growth depends, in part, on our ability to continue to make acquisitions.
The healthcare industry has experienced significant consolidation in recent years, particularly in the dialysis
services sector. Our ability to make future acquisitions depends, in part, on our available financial resources and
could be limited by restrictions imposed by the United States or other countries’ competition laws or under our
credit documents. If we make future acquisitions, we may need to incur additional debt or assume significant
liabilities, either of which might increase our financial leverage and cause the prices of our debt securities to
decline. In addition, any financing that we might need for future acquisitions might be available to us only on
terms that restrict our business. Acquisitions that we complete are also subject to risks relating to, among other
matters, integration of the acquired businesses (including combining the acquired company’s infrastructure and
management information systems with ours, harmonization of its marketing, patient service and logistical
procedures with ours and, potentially, reconciling divergent corporate and management cultures), possible non-
realization of anticipated synergies from the combination, potential loss of key personnel or customers of the
acquired companies, and the risk of assuming unknown liabilities not disclosed by the seller or not uncovered
during due diligence. If we are not able to effect acquisitions on reasonable terms, there could be an adverse
effect on our business, financial condition and results of operations.
We also compete with other dialysis products and services companies in seeking suitable acquisition targets
and the continuing consolidation of dialysis providers and combinations of dialysis providers with dialysis
product manufacturers could affect future growth of our product sales. If we are not able to continue to effect
acquisitions on reasonable terms, especially in the international area, this could have an adverse effect on our
business, financial condition and results of operations.

9
We face specific risks from international operations.
We operate dialysis clinics in approximately 45 countries and sell a range of products and services to
customers in more than 120 countries. Our international operations are subject to a number of risks, including
but not limited to the following:
the economic situation in developing or other countries could deteriorate;
fluctuations in exchange rates could adversely affect profitability;
we could face difficulties in enforcing and collecting accounts receivable under some countries’ legal
systems;
we could be negatively impacted by the ability of certain European Union member states and other
countries to service their sovereign debt obligations;
local regulations could restrict our ability to obtain a direct ownership interest in dialysis clinics or
other operations;
political, social or economic instability, especially in developing and newly industrializing countries,
could disrupt our operations;
some customers and governments could increase their payment cycles, with resulting adverse effects
on our cash flow;
some countries could impose additional or higher taxes or fees or restrict the import of our products;
we could fail to receive or could lose required licenses, certifications or other regulatory approvals for
the operation of subsidiaries or dialysis clinics, sale of products and services or acquisitions;
civil unrest, turmoil, or outbreak of disease in one or more countries in which we have material
operations or material product revenue;
differing labor regulations and difficulty in staffing and managing geographically widespread
operations;
different or less robust regulatory regimes controlling the protection of our intellectual property; and
transportation delays or interruptions.
International growth and expansion into emerging markets, such as China, Eastern Europe, the Middle East
and Africa, could cause us difficulty due to greater regulatory barriers than in the United States or Western
Europe, the necessity of adapting to new regulatory systems, and problems related to entering new markets with
different economic, social, and political systems and conditions. For example, unstable political conditions or
civil unrest could negatively impact our operations and sales in a region or our ability to collect receivables or
reimbursements or operate or execute projects in a region.
Any one or more of these or other factors could increase our costs, reduce our revenues, or disrupt our
operations, with possible material adverse effects on our business, financial condition and results of operations.
We could be adversely affected if we experience shortages of components or material price increases from our
suppliers.
The Company’s purchasing strategy is aimed at developing partnerships with strategic suppliers through long-
term contracts and at the same time ensuring, where reasonably practicable, that it has at least two sources for all
supply and price-critical primary products (dual sourcing, multiple sourcing). To prevent loss of suppliers, we
monitor our supplier relationships on a regular basis. Suppliers which are integral to our procurement functions
are subject to performance and risk analyses. Through constant market analyses, a demands-based design of
supplier relationships and contracts, as well as the use of financial instruments, we seek to mitigate disruptive
component shortages and potential price increases. If the Company is unable to counteract the risk of bottleneck
situations at times of limited availability of components and other materials in spite of its purchasing strategy in
combination with ongoing monitoring of market developments, this could result in delays in production and
hence have an adverse effect on the Company’s results of operations. Similarly, material price increases by
suppliers could also adversely affect the Company’s result of operations.

10
If physicians and other referral sources cease referring patients to our dialysis clinics or cease purchasing or
prescribing our dialysis products, our revenues would decrease.
Our dialysis services business is dependent upon patients choosing our clinics as the location for their
treatments. Patients may select a clinic based, in whole or in part, on the recommendation of their physician. We
believe that physicians and other clinicians typically consider a number of factors when recommending a
particular dialysis facility or vascular access center to an ESRD patient, including, but not limited to, the quality
of care at a clinic, the competency of a clinic’s staff, convenient scheduling, and a clinic’s location and physical
condition. Physicians may change their facility recommendations at any time, which may result in the movement
of new or existing patients to competing clinics, including clinics established by the physicians themselves. At
most of our clinics, a relatively small number of physicians often account for the referral of all or a significant
portion of the patient base. Our dialysis care business also depends on recommendations by hospitals, managed
care plans and other healthcare institutions. If a significant number of physicians, hospitals or other healthcare
institutions cease referring their patients to our clinics, this would reduce our dialysis care revenue and could
materially adversely affect our overall operations.
The decision to purchase or prescribe our dialysis products and other services or competing dialysis products
and other services will be made in some instances by medical directors and other referring physicians at our
dialysis clinics and by the managing medical personnel and referring physicians at other dialysis clinics, subject
to applicable regulatory requirements. A decline in physician recommendations or recommendations from other
sources for purchases of our products or ancillary services would reduce our dialysis product and other services
revenue, and would materially adversely affect our business, financial condition and results of operations.
Our pharmaceutical product business could lose sales to generic drug manufacturers or new branded drugs.
Our branded pharmaceutical product business is subject to significant risk as a result of competition from
manufacturers of generic drugs and other new competing medicines or therapies. Through the end of 2013, we
were obligated to make certain minimum annual royalty payments under certain of our pharmaceutical product
license agreements, regardless of our annual sales of the licensed products. Thereafter, the Company is required
to determine their minimum purchase requirements for the subsequent year on a yearly basis. Any of the
expiration or loss of patent protection for one of our products, the “at-risk” launch by a generic manufacturer of a
generic version of one of our branded pharmaceutical products or the launch of new branded drugs that compete
with one or more of our products could result in the loss of a major portion of sales of that branded
pharmaceutical product in a very short time period, which could materially and adversely affect our business,
financial condition and results of operations.
Our competitors could develop superior technology or otherwise impact our sales.
We face numerous competitors in both our dialysis services business and our dialysis products business,
some of which may possess substantial financial, marketing or research and development resources. Competition
and especially new competitive developments could materially adversely affect the future pricing and sale of our
products and services. In particular, technological innovation has historically been a significant competitive
factor in the dialysis products business. The introduction of new products by competitors could render one or
more of our products or services less competitive or even obsolete.
Global economic conditions as well as further disruptions in financial markets may have an adverse effect on
our businesses.
Although there has been some improvement in the global economy and financial markets since the market
deterioration of the global economy and tightening of the financial markets in 2008 and 2009, the overall global
economic outlooks remains uncertain and current economic conditions could adversely affect our business and
our profitability. Among other things, the potential decline in federal and state revenues that may result from
such conditions may create additional pressures to contain or reduce reimbursements for our services from public
payors around the world, including Medicare, Medicaid in the United States and other government sponsored
programs in the United States and other countries around the world.
Job losses or slow improvement in the unemployment rate in the United States may result in a smaller
percentage of our patients being covered by an employer group health plan and a larger percentage being
covered by lower paying Medicare and Medicaid programs. Employers and individuals who obtain insurance
through exchanges established under the ACA might also begin to select more restrictive commercial plans with
lower reimbursement rates. To the extent that payors are negatively impacted by a decline in the economy, we
may experience further pressure on commercial rates, a further slowdown in collections and a reduction in the
amounts we expect to collect.

11
We depend on the financial markets for access to capital, as do our renal product customers and commercial
healthcare insurers. Limited or expensive access to capital could make it more difficult for these customers to do
business with us, or to do business generally, which could adversely affect our businesses. In addition,
uncertainty in the financial markets could adversely affect the variable interest rates payable under our credit
facilities or could make it more difficult to obtain or renew such facilities or to obtain other forms of financing in
the future. Any or all of these factors, or other consequences of the continuation, or worsening, of domestic and
global economic conditions which cannot currently be predicted, could continue to adversely affect our
businesses and results of operations.
If we are unable to attract and retain skilled medical, technical and engineering personnel, we may be unable
to manage our growth or continue our technological development.
Our continued growth in the dialysis care business will depend upon our ability to attract and retain skilled
employees, such as highly skilled nurses and other medical personnel. Competition for those employees is
intense and the current nursing shortage has increased our personnel and recruiting costs. Moreover, we believe
that future success in the provider business will be significantly dependent on our ability to attract and retain
qualified physicians to serve as medical directors of our dialysis clinics. If we are unable to achieve that goal or
if doing so requires us to bear increased costs this could adversely impact our growth and results of operations.
Our dialysis products business depends on the development of new products, technologies and treatment
concepts to be competitive. Competition is also intense for skilled engineers and other technical research and
development personnel. If we are unable to obtain and retain the services of key personnel, the ability of our
officers and key employees to manage our growth would suffer and our operations could suffer in other respects.
These factors could preclude us from integrating acquired companies into our operations, which could increase
our costs and prevent us from realizing synergies from acquisitions. Lack of skilled research and development
personnel could impair our technological development, which would increase our costs and impair our reputation
for production of technologically advanced products.
Diverging views of fiscal authorities could require us to make additional tax payments.
We are in dispute with the German tax authorities and the U.S. Internal Revenue Service (IRS) on certain
tax deductions disallowed in past and current tax audits and from time to time with other jurisdictions. We are
also subject to ongoing tax audits in the U.S., Germany and other jurisdictions. We have received notices of
unfavorable adjustments and disallowances in connection with certain of these audits and we may be subject to
additional unfavorable adjustments and disallowances. We are contesting, and in some cases appealing certain of
the unfavorable determinations. If our objections, audit appeals or court claims are unsuccessful, we could be
required to make additional tax payments, which could have a material adverse impact on our results of
operations and operating cash flow in the relevant reporting period. See Item 5, “Operating and Financial
Review and Prospects – B. Liquidity and Capital Resources – Liquidity” as well as Note 20 of the Notes to
Consolidated Financial Statements, “Commitments and Contingencies - Legal and Regulatory Matters.”
Risks Relating to our Securities
Our indebtedness may limit our ability to pay dividends or implement certain elements of our business
strategy.
At December 31, 2013, we had consolidated debt of $8,417 million and consolidated total shareholders’
equity of $9,485 million. Our debt could have significant consequences to our operations and our financial
condition. For example, it could require us to dedicate a substantial portion of our cash flow from operations, as
well as the proceeds of certain financings and asset dispositions, to payments on our indebtedness, thereby
reducing the availability of our cash flow and such proceeds to fund working capital, capital expenditures and for
other general corporate purposes.
In October 2012, we entered into a syndicated Credit Agreement (the “2012 Credit Agreement”), which
replaced our prior credit agreement. Our 2012 Credit Agreement, Senior Notes and Euro Notes include
covenants that require us to maintain certain financial ratios or meet other financial tests. Under our 2012 Credit
Agreement, we are obligated to maintain a minimum consolidated interest expense coverage ratio (ratio of
EBITDA to net interest expense) and we are subject to a maximum consolidated leverage ratio (ratio of
consolidated funded debt to consolidated EBITDA) as these terms are defined in the 2012 Credit Agreement.
Our 2012 Credit Agreement and the indentures related to our Senior Notes include other covenants which,
among other things, restrict or have the effect of restricting our ability to dispose of assets, incur debt, pay

12
dividends and other restricted payments, create liens or make investments or acquisitions. These covenants may
otherwise limit our activities. The breach of any of the covenants could result in a default and acceleration of the
indebtedness under the credit agreement or the indentures, which could, in turn, create additional defaults and
acceleration of the indebtedness under the agreements relating to our other long-term indebtedness which would
have an adverse effect on our business, financial condition and results of operations.
Fresenius SE owns 100% of the shares in the General Partner of our Company and is able to exercise
management control of FMC-AG & Co. KGaA.
Fresenius SE owns approximately 31.3% of our outstanding ordinary shares as of February 19, 2014.
Fresenius SE also owns 100% of the outstanding shares of Management AG, the General Partner of the
Company. As the sole shareholder of the General Partner, Fresenius SE has the sole right to elect the supervisory
board of the General Partner which, in turn, appoints the General Partner’s Management Board. The
Management Board of the General Partner is responsible for the management of the Company. Through its
ownership of the General Partner, Fresenius SE is able to exercise de facto management control of FMC-AG &
Co. KGaA, even though it owns less than a majority of our outstanding voting shares. Such de facto control
limits public shareholder influence on management of the Company and precludes a takeover or change of
control of the Company without Fresenius SE’s consent, either or both of which could adversely affect the prices
of our shares.
Because we are not organized under U.S. law, we are subject to certain less detailed disclosure requirements
under U.S. federal securities laws.
Under the pooling agreement that we have entered into for the benefit of non-related holders of our Ordinary
shares (including, in each case, holders of American Depositary Receipts representing beneficial ownership of
such shares), we have agreed to file quarterly reports with the SEC, to prepare annual and quarterly financial
statements in accordance with U.S. generally accepted accounting principles (“G.A.A.P.”), and to file
information with the SEC with respect to annual and general meetings of our shareholders. The pooling
agreement also requires that the supervisory board of Management AG, our General Partner, include at least two
members who do not have any substantial business or professional relationship with Fresenius SE, Management
AG or FMC-AG & Co. KGaA and its affiliates and requires the consent of those independent directors to certain
transactions between us and Fresenius SE and its affiliates.
We are a “foreign private issuer,” as defined in the SEC’s regulations, and consequently we are not subject
to all of the same disclosure requirements applicable to domestic companies. We are exempt from the SEC’s
proxy rules, and our annual reports contain less detailed disclosure than reports of domestic issuers regarding
such matters as management, executive compensation and outstanding options, beneficial ownership of our
securities and certain related party transactions. Also, our officers, directors and beneficial owners of more than
10% of our equity securities are exempt from the reporting requirements and short–swing profit recovery
provisions of Section 16 of the Exchange Act. We are also generally exempt from most of the governance rules
applicable to companies listed on the New York Stock Exchange (including the obligation to maintain a
compensation committee of independent directors), other than the obligation to maintain an audit committee in
accordance with Rule 10A – 3 under the Exchange Act. These limits on available information about our
company and exemptions from many governance rules applicable to U.S. domestic issuers may adversely affect
the market prices for our securities.
Item 4. Information on the Company
A. History and Development of the Company
General
Fresenius Medical Care AG & Co. KGaA (“FMC-AG & Co. KGaA” or the “Company”), is a German
partnership limited by shares (Kommanditgesellschaft auf Aktien or “KGaA”), formerly known as Fresenius
Medical Care AG (“FMC-AG”), a German stock corporation (Aktiengesellschaft or “AG”) organized under the
laws of Germany.
The Company was originally incorporated on August 5, 1996 as a stock corporation and transformed into a
partnership limited by shares upon registration on February 10, 2006. FMC-AG & Co. KGaA is registered with
the commercial register of the local court (Amtsgericht) of Hof an der Saale, Germany, under the registration

13
number HRB 4019. Our registered office (Sitz) is Hof an der Saale, Germany. Our registered business address is
Else-Kröner-Strasse 1, 61352 Bad Homburg, Germany, telephone +49-6172-609-0.
History
On September 30, 1996, we completed a series of transactions to consummate an Agreement and Plan of
Reorganization entered into on February 4, 1996 by Fresenius SE (then Fresenius AG) and W.R. Grace & Co.
which we refer to as the "Merger" elsewhere in this report. Pursuant to that agreement, Fresenius SE contributed
Fresenius Worldwide Dialysis, its global dialysis business, including its controlling interest in Fresenius USA,
Inc., in exchange for 105,630,000 FMC-AG Ordinary shares. Thereafter, we acquired:
all of the outstanding common stock of W.R. Grace & Co., whose sole business at the time of the
transaction consisted of National Medical Care, Inc., its global dialysis business, in exchange for
94,080,000 Ordinary shares; and
the publicly-held minority interest in Fresenius USA, Inc., in exchange for 10,290,000 Ordinary
shares.
On February 10, 2006, the Company completed the transformation of its legal form under German law as
approved by its shareholders during the Extraordinary General Meeting (“EGM”) held on August 30, 2005.
Upon registration of the transformation of legal form in the commercial register of the local court in Hof an der
Saale, on February 10, 2006, Fresenius Medical Care AG’s legal form was changed from a German AG to a
partnership limited by shares with the name Fresenius Medical Care AG & Co. KGaA. The Company as a
KGaA is the same legal entity under German law, rather than a successor to the stock corporation. Management
AG, a subsidiary of Fresenius SE, which was the majority voting shareholder of FMC-AG prior to the
transformation, is the general partner of FMC-AG & Co. KGaA. Shareholders in FMC-AG & Co. KGaA
participated in all economic respects, including profits and capital, to the same extent and (except as modified by
the first share conversion described below) with the same number of shares in FMC-AG & Co. KGaA as they
held in FMC-AG prior to the transformation. Upon effectiveness of the transformation of legal form, the share
capital of FMC-AG became the share capital of FMC-AG & Co. KGaA, and persons who were shareholders of
FMC-AG became shareholders of the Company in its new legal form.
Prior to the effectiveness of the transformation, and as approved by the EGM and by a separate vote of
FMC-AG’s former preference shareholders, the Company offered holders of its non-voting Preference shares
(including preference shares represented by American Depositary Shares (ADSs)) the opportunity to convert
their shares into Ordinary shares, which was accepted by the holders of approximately 96% of the outstanding
Preference shares. Preference shares that were not converted remained outstanding and became Preference
shares of FMC-AG & Co. KGaA in the transformation. In 2013, all remaining Preference shares outstanding
were converted into Ordinary shares in the mandatory conversion described below.
Part of the Company’s stated strategy is to expand and complement its existing business through
acquisitions. See Item 4B, “Information on the Company – Business Overview – Our Strategy and Competitive
Strengths.” On March 31, 2006, the Company completed the acquisition of Renal Care Group, Inc. (“the RCG
Acquisition”), a Delaware corporation with principal offices in Nashville, Tennessee, for an all cash purchase
price, net of cash acquired, of approximately $4.2 billion including the concurrent repayment of approximately
$657.8 million of indebtedness of RCG. In 2010, we acquired Asia Renal Care Ltd, a large dialysis and related
services provider in our Asia-Pacific region, Kraevoy Nefrologocheskiy Centr, a private operator of dialysis
clinics in Russia’s Krasnodar region and Gambro AB’s worldwide peritoneal dialysis business. In 2011, we
acquired IDC, the dialysis service business of Euromedic International, with over 8,200 hemodialysis patients
and 70 clinics in nine countries, principally in Central and Eastern Europe and, American Access Centers, which
operates 28 free-standing vascular access centers in the U.S., which provided us with critical mass in our
vascular access business. In 2012 we acquired 100% of the equity of Liberty Dialysis Holdings, Inc. (“Liberty
Dialysis”), a Delaware corporation with principal offices in Mercer Island, Washington and the owner of all of
the business of Liberty Dialysis, Inc. and 51% of Renal Advantage, Inc., for total cash consideration of $2,182
million consisting of $1,697 million cash, net of cash acquired and $485 million non-cash consideration (the
“Liberty Acquisition”). Prior to entering into the merger agreement for the Liberty Acquisition, we owned 49%
of Renal Advantage, Inc., and we also had a loan receivable from Renal Advantage Partners, LLC of $280
million which was retired as part of the transaction. Liberty Dialysis mainly provided dialysis services in the
United States through the 263 clinics it owned (the “Acquired Clinics”). We accounted for the Liberty
Acquisition as a business combination. Liberty Dialysis’s results have been included in the Company’s
Consolidated Statement of Income since February 29, 2012.

14
We have also expanded the renal pharmaceuticals portion of our product business. In 2006, we acquired
Phoslo®, a phosphate binder. In 2008, we entered into license and distribution agreements to market and
distribute intravenous iron products such as Venofer® and Ferinject® (outside of the U.S.) for dialysis treatment.
In December 2010, we formed a new renal pharmaceutical company with one of the licensors, Galenica Ltd.
“Galenica”, named Vifor Fresenius Medical Care Renal Pharma Ltd. (“VFMCRP”), to develop and distribute
products to treat iron deficiency anemia and bone mineral metabolism for pre-dialysis and dialysis patients. We
own 45% of the shares of VFMCRP. See the discussion of “Renal Pharmaceuticals” below.
Effective December 3, 2012, we completed a two-for-one split of the ADSs representing our Ordinary
shares and the ADSs representing our Preference shares. As a result of the ADSs split, the ratio of our ADSs to
our Ordinary shares and Preference shares was changed from one ADS representing one share to one ADS
representing one-half of a share. All ADS and per ADS amounts in the consolidated financial statements, the
related notes and elsewhere in this report have been restated to reflect the ADS splits.
On May 16, 2013, the Company's AGM and a separate Preference shareholder meeting adopted resolutions
for the mandatory conversion of our Preference shares into Ordinary shares. The amendments to the Company's
articles of association (“Articles of Association”) effecting the conversion were registered with the commercial
register at the local court in Hof an der Saale on June 28, 2013. All outstanding Preference shares were
converted on a 1:1 basis to Ordinary shares and all remaining options to acquire Preference shares were
converted into options to acquire Ordinary shares. On July 5, 2013, the Company received a €27,000 ($34,784)
premium from the largest former preference shareholder, a financial institution located outside the United States,
for the conversion of their preference shares to ordinary shares. In connection with the Preference share
conversion, the listing of the Preference shares at the Frankfurt Stock Exchange was terminated and the New
York Stock Exchange delisted the ADSs representing our Preference shares.
On May 20, 2013 we commenced and on August 14, 2013, we completed a share buy-back program. We
purchased a total of 7,548,951 Ordinary shares on the Frankfurt Stock Exchange at a total cost of approximately
€350 million (approximately US$500 million). The program was financed from cash flow and existing credit
facilities. The repurchased shares will either be cancelled, thereby reducing our registered share capital, or used
to satisfy our share delivery obligations upon exercise of stock options.
Capital Expenditures
We invested, by operating segment and Corporate, the gross amounts shown in the table below during the
twelve month periods ended December 31, 2013, 2012, and 2011.
Actual
2013 2012 2011
(in millions)
Capital expenditures for property, plant and equipment
North America $ 377 $ 299 $ 238
International 205 203 201
Corporate 166 173 159
Total Capital Expenditures $ 748 $ 675 $ 598
Acquisitions and Investments
North America $ 461 $ 1,849 $ 824
International 100 35 1,186
Corporate 2 2 6
Total Acquisitions and Investments $ 563 $ 1,886 $ 2,016
For additional information regarding our capital expenditures, see Item 4. B, “Business Overview –
Acquisitions and Investments” and Item 5.B, “Operating and Financial Review and Prospects – Liquidity and
Capital Resources”

15
B. Business Overview
Our Business
Based on publicly reported sales and number of patients treated, we are the world's largest kidney dialysis
company, operating in both the field of dialysis products and the field of dialysis services. Our dialysis business
is vertically integrated, providing dialysis treatment at our own dialysis clinics and supplying these clinics with a
broad range of products. In addition, we sell dialysis products to other dialysis service providers. At December
31, 2013, we provided dialysis treatment to 270,122 patients in 3,250 clinics worldwide located in approximately
45 countries. In the U.S. we also provide inpatient dialysis services and other services under contract to
hospitals. In 2013, we provided 40,456,900 million dialysis treatments, an increase of approximately 5%
compared to 2012. We also develop and manufacture a full range of machines, systems and disposable products,
which we sell to customers in more than 120 countries. For the year ended December 31, 2013, we had net
revenues of $14.6 billion, a 6% increase (6% in constant currency, see item 5, “Operating and Financial Review
and Prospects – Non U.S. GAAP Measures for Presentation – Constant Currency”) over 2012 revenues. We
derived 66% of our revenues in 2013 from our North America Segment and 34% from our International
Segment, which include our operations in Europe (21%), Latin America (6%) and Asia-Pacific (7%). Our
Ordinary shares are listed on the Frankfurt Stock Exchange and American Depositary Receipts evidencing our
Ordinary shares on the New York Stock Exchange, and on February 19, 2014, we had a market capitalization of
$22.1 billion.
We use the insight we gain when treating patients in developing new and improved products. We believe
that our size, our activities in both dialysis care and dialysis products and our concentration in specific
geographic areas allow us to operate more cost-effectively than many of our competitors.
We estimate the volume of the global dialysis market was approximately $75 billion for 2013, remaining
unchanged compared to the previous year (4% increase in constant currency terms). Approximately $61 billion
represents dialysis services, including the administration of dialysis drugs, and approximately $14 billion
represents sales of dialysis products. The following table summarizes net revenues for our North America
Segment and our International Segment in our major categories of activity, dialysis care and dialysis products for
the three years ended December 31, 2013, 2012 and 2011.
2013 2012 2011
(in millions)
North America
Dialysis Care $ 8,772 $ 8,230 $ 7,113
Dialysis Products 834 801 813
9,606 9,031 7,926
International
Dialysis Care 2,358 2,262 2,170
Dialysis Products 2,612 2,478 2,458
4,970 4,740 4,628
Renal Industry Overview
We offer life-maintaining and life-saving dialysis services and products in a market which is characterized by
favorable demographic development. As a global market leader in dialysis products and dialysis services, FMC-
AG & Co. KGaA considers it important to possess accurate and current information on the status and
development of the global, regional and national markets.
To obtain and manage this information, FMC-AG & Co. KGaA has developed an internal information tool
called Market & Competitor Survey (“MCS”). The MCS is used within the Company as a tool to collect, analyze
and communicate current, accurate and essential information on the dialysis market, developing trends, the market
position of FMC-AG & Co. KGaA and those of its competitors. Country – by – country surveys are performed at
the end of each calendar year which focus on the total number of patients treated for ESRD, the treatment
modality selected, products used, treatment location and the structure of ESRD patient care providers. The survey
has been refined over the years to facilitate access to more detailed information and to reflect changes in the
development of therapies and products as well as changes to the structure of our competitive environment. The
questionnaires are distributed to professionals in the field of dialysis who are in a position to provide ESRD-
relevant country specific information themselves or who can coordinate appropriate input from contacts with the

16
relevant know-how in each country. The surveys are then centrally validated and checked for consistency by
cross-referencing them with the most recent sources of national ESRD information (e.g. registry data or
publications if available) and with the results of surveys performed in previous years. All information received is
consolidated at a global and regional level and analyzed and reported together with publicly available information
published by our competitors. While we believe the information contained in our surveys and competitor
publications to be reliable, we have not independently verified the data or any assumptions from which our MCS
is derived or on which the estimates they contain are based, and we do not make any representation as to the
accuracy of such information.
Except as otherwise specified below, all patient and market data in this report have been derived using our
MCS.
End-Stage Renal Disease
ESRD is the stage of advanced chronic kidney disease characterized by the irreversible loss of kidney
function and requires regular dialysis treatment or kidney transplantation to sustain life. A normally functioning
human kidney removes waste products and excess water from the blood, which prevents toxin buildup, water
overload and the eventual poisoning of the body. Most patients suffering from ESRD must rely on dialysis, which
is the removal of toxic waste products and excess fluids from the body by artificial means. A number of
conditions – diabetes, hypertension, glomerulonephritis and inherited diseases – can cause chronic kidney disease.
The majority of people with ESRD acquire the disease as a complication of one or more of these primary
conditions.
There are currently only two methods for treating ESRD: dialysis and kidney transplantation. Scarcity of
compatible kidneys limits transplants. Therefore, most patients suffering from ESRD rely on dialysis.
We estimate that at the end of 2013, there were approximately 3.20 million ESRD patients worldwide, of
which approximately 675,000 were living with a transplanted kidney. For many years the number of donated
organs worldwide has continued to be significantly lower than the number of patients on transplant waiting lists.
Despite ongoing efforts by many regional initiatives to increase awareness of and willingness for kidney donation,
the distribution of patients between the various treatment modes has remained nearly unchanged over the past ten
years. In both the U.S. and Germany, approximately 20% of all ESRD patients live with a functioning kidney
transplant and approximately 80% require dialysis.
There are two major dialysis methods commonly used today, hemodialysis (“HD”) and peritoneal dialysis
(“PD”). These are described below under “Dialysis Treatment Options for ESRD.” Of the estimated 2.52 million
dialysis patients treated in 2013, approximately 2.25 million received HD and about 269,000 received PD.
Generally, an ESRD patient’s physician, in consultation with the patient, chooses the patient treatment method,
which is based on the patient’s medical conditions and needs. The number of dialysis patients grew by
approximately 7% in 2013.
The present annual patient growth rate in North America, the largest dialysis market, is approximately 5% per
year, while in many developing countries we see annual growth rates of near 10%. We believe that worldwide
patient growth will continue at around 6% per year. At the end of 2013, there were approximately 568,000
patients in North America (including Mexico), approximately 341,000 dialysis patients in the 27 countries of the
European Union (E.U.), approximately 298,000 patients in Europe (excluding the E.U. countries), the Middle East
and Africa, approximately 252,000 patients in Latin America (excluding Mexico), and approximately 1,060,000
patients in Asia (including approximately 318,000 patients in Japan).
Dialysis patient growth rates vary significantly from region to region. The U.S. and Japan, as well as
Western and Central Europe, where patients with terminal kidney failure have had readily available access to
treatment, usually dialysis, for many years, all experience below average increases in the number of patients. In
contrast, growth rates in the economically weaker regions were above average, reaching double digit figures in
some cases. This indicates that accessibility to treatment is still somewhat limited in these countries, but is
gradually improving.
We estimate that about 18% of worldwide patients are treated in the U.S., around 14% in E.U. and
approximately 13% in Japan. The remaining 55% of all dialysis patients are distributed throughout approximately
120 countries in different geographical regions.

17
We believe that the continuing growth in the number of dialysis patients is principally attributable to:
increased general life expectancy and the overall aging of the general population;
the continuing shortage of donor organs for kidney transplants;
improved dialysis technology that makes life-prolonging dialysis available to a larger patient
population;
greater access to treatment in developing countries; and
lifestyle choices such as obesity, lack of exercise and poor diet, causing increased prevalence of
hypertension, diabetes and other illnesses that lead to ESRD, combined with better treatment and
survival of patients with these conditions.
Dialysis Treatment Options for ESRD
Hemodialysis. Hemodialysis removes toxins and excess fluids from the blood in a process in which the
blood flows outside the body through plastic tubes known as bloodlines into a specially designed filter, called a
dialyzer. The dialyzer separates waste products and excess water from the blood. Dialysis solution flowing
through the dialyzer carries away the waste products and excess water, and supplements the blood with solutes
which must be added due to renal failure. The treated blood is returned to the patient. The hemodialysis machine
pumps blood, adds anti-coagulants, regulates the purification process and controls the mixing of dialysis solution
and the rate of its flow through the system. This machine can also monitor and record the patient’s vital signs.
The majority of hemodialysis patients receive treatment at outpatient dialysis clinics, such as ours, where
hemodialysis treatments are performed with the assistance of a nurse or dialysis technician under the general
supervision of a physician. Hemodialysis patients generally receive treatment three times per week, typically for
three to five hours per treatment.
Patients can receive treatment at a clinic run by (1) a public center (government or government subsidiary
owned/run), (2) a healthcare organization (non-profit organizations for public benefit purposes), (3) a private
center (owned or run by individual doctors or a group of doctors) or (4) a company-owned clinic, including multi-
clinic providers (owned or run by a company such as FMC-AG & Co. KGaA). There were approximately 6,100
Medicare-certified ESRD treatment clinics in the U.S. in 2013 with only around 1% of patients receiving care in
public centers. In 2013, there were approximately 5,500 dialysis clinics in the E.U. treating dialysis patients. In the
E.U., approximately 57% of dialysis patients received care through public centers, approximately 21% through
private centers and approximately 22% through company-owned clinics, such as ours. In Latin America, private
centers and company-owned clinics predominated, caring for over 85% of all dialysis patients. In Japan,
nephrologists (doctors who specialize in the treatment of renal patients) cared for around 80% of the population in
their private centers.
Among company-owned clinics, the two largest providers are FMC-AG & Co. KGaA, caring for
approximately 270,000 patients and DaVita, caring for approximately 166,000 patients at the end of 2013. All
other company-owned clinics care for approximately 20,000 or less patients each.
Of the approximately 2.52 million patients who received dialysis care in 2013, more than 89% were treated
with hemodialysis. Hemodialysis patients represented about 92% of all dialysis patients in the U.S., approximately
97% of all dialysis patients in Japan, 92% in the E.U. and 86% in the rest of the world. Based on these data, it is
clear that hemodialysis is the dominant therapy method worldwide.
Peritoneal Dialysis. Peritoneal dialysis removes toxins from the blood using the peritoneum, the membrane
lining covering the internal organs located in the abdominal area, as a filter. Most peritoneal dialysis patients
administer their own treatments in their own homes and workplaces, either by a treatment known as continuous
ambulatory peritoneal dialysis (“CAPD” or “APD”), or by a treatment known as continuous cycling peritoneal
dialysis (“CCPD”). In both of these treatments, a surgically implanted catheter provides access to the peritoneal
cavity. Using this catheter, the patient introduces a sterile dialysis solution from a solution bag through a tube into
the peritoneal cavity. The peritoneum operates as the filtering membrane and, after a specified dwell time, the
solution is drained and disposed. A typical CAPD peritoneal dialysis program involves the introduction and
disposal of dialysis solution four times a day. With CCPD, a machine pumps or "cycles" solution to and from the
patient's peritoneal cavity while the patient sleeps. During the day, one and a half to two liters of dialysis solution
remain in the abdominal cavity of the patient. The human peritoneum can be used as a dialyzer only for a limited
period of time, ideally only if the kidneys are still functioning to some extent.

18
Our Strategy and Competitive Strengths
Company Strategy
We focus our business activities on our patients’ health and hence on the quality of treatment and our
products with the objective of improving their quality of life and raising their life expectancy. Our aim is to
maintain our position as the world’s leading provider of dialysis treatment and products and to use that position
as a basis for sustainable, profitable growth. In this way, we seek to continuously increase our corporate value
and create added value for patients, healthcare systems and investors worldwide.
Our strategy takes into account concrete, measurable growth targets as well as long-term trend forecasts in
the dialysis market. The Management Board uses a number of different tools and indicators to evaluate our
business performance, develop our strategy and make investment decisions. See Item 5, “Operating and
Financial Review and Prospects.” We not only expect the number of patients to increase but also the quality of
services provided and of the products available to become even more important in the future. We think
integrated care for kidney patients is another area that will continue to grow in the future. In response to this, we
will not only focus our business on individual services or dialysis products, but also on combining the different
areas of application related to dialysis, such as combining treatment concepts with dialysis drugs.
Pillars for Strategic Growth
We rely upon four pillars in order to devise measures to govern the Company’s strategy and activities and
enable us to devise measures whereby we can continue to perform successfully in a broader spectrum of the
global dialysis market and achieve our growth and profitability objectives. Our four strategic pillars are
described below:
(1) Continuous Growth and Expansion
We are committed to shaping the development of the dialysis industry by giving more people access to life-
saving dialysis treatment, as well as developing innovative products and therapies that improve our patients’
quality of life. This includes our execution of strategic alliances with various healthcare institutions, which help
to shape the development of the industry, while benefitting from the global growth of the market. To strengthen
our market position, we have developed various approaches ranging from organic growth to the continuous
assessment of acquisitions that create synergies with our existing products and services.
To accomplish lasting, profitable growth we are also steering our business activities towards attractive
future markets. This includes expanding our presence through public private partnerships (“PPP”) in the
dialysis business. We are already involved in several PPP initiatives in Europe, Africa, Asia and Australia with
the intent to further expand these strategic alliances in the future.
(2) Development of New Business Areas
Our main focus continues to be on comprehensive care for dialysis patients and dialysis-related treatments.
In many regions, in addition to our products, dialysis treatments, and wide range of renal pharmaceuticals, we
offer an increasing amount of additional services for patient care. These include laboratory and pharmacy
services as well as services related to vascular access, an essential aspect of treatment for dialysis patients.
With an integrated healthcare approach, we can further develop these and other services and meet the growing
demand for comprehensive care of patients with kidney disease.
(3) Enhancing Products and Services
Our sustainable growth strategy includes the development of innovative products and continuous
improvement for dialysis treatments. We benefit from the vertically-integrated structure of our Company,
which enables our Research & Development division to apply our experience as the world’s largest provider of
dialysis treatments to product development, and our technical department benefits from our daily practical
experience as a provider of dialysis treatment and being directly in-touch with doctors, nurses and patients to
keep track of and meet customer and patient needs.
Our Global Research and Development department was reorganized in 2013, and we continue to operate a
global network of local research and development sites. This network provides us with an advantage to
familiarize ourselves with local requirements and respond to them quickly. However, chronic kidney failure is
also a global problem, with demand for improved, high-quality yet cost-efficient products growing worldwide.
The reorganization of our Research and Development department has leveraged synergies for product

19
development that will continue into the future by providing a global focus and promoting the exchange of
knowledge between regions. Our research also focuses on the vital aspects of the quality and safety of our
products and services. This continued focus on quality makes us a reliable partner for patients, doctors, and
care staff alike.
(4) Fostering Operational Excellence
In a challenging economic environment, we also place importance on enhancing our profitability in the
long term, while positioning and managing the Company more efficiently. In the future, we intend to further
optimize and modernize our administrative structures and processes and make greater use of synergies, such as
the establishment of our Global Manufacturing Operations and Global Research & Development divisions.
This will enable us to meet the increased demand for our products and services and create a flexible
environment which fosters rapid response to changes in the dialysis market. At the same time, we have
benefited, and will continue to benefit, from our decentralized structure, allowing us to remain a reliable local
partner in patient treatment by providing quick responses to customer specific needs, and changes to the local
market and regulatory environment. We believe this flexibility coupled with our localized decision making
structure helps us to gain access to new markets.
Dialysis Care
Dialysis Services
We provide dialysis treatment and related laboratory and diagnostic services through our network of 3,250
outpatient dialysis clinics, 2,133 of which are in the North America Segment (including Mexico) and 1,117 of
which are in approximately 45 countries outside of North America. Our operations within the North America
Segment generated 79% of our 2013 dialysis care revenue and our operations outside the North America
Segment generated 21%. Our dialysis clinics are generally concentrated in areas of high population density. In
2013, we acquired a total of 50 existing clinics, opened 80 new clinics and sold or consolidated 40 clinics. The
number of patients we treat at our clinics worldwide increased by about 5%, from 257,916 at December 31, 2012
to 270,122 at December 31, 2013. For 2013, dialysis services accounted for 76% of our total revenue.
With our large patient population, we have developed proprietary patient statistical databases which enable
us to improve dialysis treatment outcomes, and further improve the quality and effectiveness of dialysis
products. We believe that local physicians, hospitals and managed care plans refer their ESRD patients to our
clinics for treatment due to:
our reputation for quality patient care and treatment;
our extensive network of dialysis clinics, which enables physicians to refer their patients to
conveniently located clinics; and
our reputation for technologically advanced products for dialysis treatment.
At our clinics, we provide hemodialysis treatments at individual stations through the use of dialysis
machines and disposable products. A nurse attaches the necessary tubing to the patient and the dialysis machine
and monitors the dialysis equipment and the patient's vital signs. The capacity of a clinic is a function of the
number of stations and such factors as type of treatment, patient requirements, length of time per treatment, and
local operating practices and ordinances regulating hours of operation.
Each of our dialysis clinics is under the general supervision of a physician medical director. (See "Patients,
Physician and Other Relationships.") Each dialysis clinic also has an administrator or clinical manager who
supervises the day-to-day operations of the facility and the staff. The staff typically consists of registered nurses
and licensed practical nurses. Our North America Segment clinics also employ patient care technicians, a social
worker, a registered dietician, a unit clerk and biomedical technicians, while in some countries within our
International Segment, the staff also includes technicians, social workers and dieticians.
As part of the dialysis therapy, we provide a variety of services to ESRD patients at our dialysis clinics in
the U.S. These services include administering EPO, a synthetic engineered hormone that stimulates the
production of red blood cells. EPO is used to treat anemia, a medical complication that ESRD patients frequently
experience. We administer EPO to most of our patients in the U.S. Amgen Inc. is the sole manufacturer of EPO
in U.S. and any interruption of supply could materially adversely affect our business, financial condition and
results of operations. Our current sourcing and supply contract with Amgen for EPO covers the period from
January 1, 2012 to December 2014. Prior to January 1, 2011, when the ESRD PPS became effective,
administration of EPO was separately billable under the composite rate payment system then in effect, and

20
reimbursement for EPO represented a significant part of our dialysis care revenue. Since January 2011, ESAs
such as EPO are included in the expanded ESRD PPS bundled rate. A material increase in our utilization or
acquisition cost for EPO without an increase in the ESRD PPS bundled reimbursement rate could materially
adversely affect our financial condition and results of operations.
Our clinics also offer services for home dialysis patients, the majority of whom receive peritoneal dialysis
treatment. For those patients, we provide materials, training and patient support services, including clinical
monitoring, follow-up assistance and arranging for delivery of the supplies to the patient's residence. (See "—
Regulatory and Legal Matters — Reimbursement — U.S." for a discussion of billing for these products and
services.)
We also provide dialysis services under contract to hospitals in the U.S. on an "as needed" basis for
hospitalized ESRD patients and for patients suffering from acute kidney failure. Acute kidney failure can result
from trauma or similar causes, and requires dialysis until the patient's kidneys recover their normal function. We
service these patients either at their bedside, using portable dialysis equipment, or at the hospital's dialysis site.
Contracts with hospitals provide for payment at negotiated rates that are generally higher than the Medicare
reimbursement rates for chronic in-clinic outpatient treatments.
We employ a centralized approach in the U.S. with respect to certain administrative functions common to
our operations. For example, each dialysis clinic uses our proprietary manuals containing our standardized
operating and billing procedures. We believe that centralizing and standardizing these functions enhance our
ability to perform services on a cost-effective basis.
The manner in which each clinic conducts its business depends, in large part, upon applicable laws, rules
and regulations of the jurisdiction in which the clinic is located, as well as our clinical policies. However, a
patient's attending physician, who may be the clinic's medical director or an unaffiliated physician with staff
privileges at the clinic, has medical discretion to prescribe the particular treatment modality and medications for
that patient. Similarly, the attending physician has discretion in prescribing particular medical products, although
the clinic typically purchases equipment, regardless of brand, in consultation with its medical director.
In the more than 45 countries outside North America in which we currently operate or manage dialysis
clinics we face legal, regulatory and economic environments varying significantly from country to country.
These individual environments can affect all aspects of providing dialysis services including our legal status, the
extent to which we can provide dialysis services, the way we have to organize these services and the system
under which we are reimbursed. (See "— Regulatory and Legal Matters — Reimbursement — International
(Including Germany and Other Non-U.S.)” for further discussion of reimbursement.) Our approach to managing
this complexity utilizes local management to ensure the strict adherence to the individual country rules and
regulations and international functional departments supporting country management with processes and
guidelines enabling the delivery of the highest possible quality level of dialysis treatment. We believe that with
this bi-dimensional organization we will be able to provide superior care to dialysis patients under the varying
local frameworks leading to improved patient well-being and to lower social cost.
Other Services
Laboratory Services
We have full service laboratories that support the needs of our patients in the U.S. and we also provide
laboratory testing for others in the U.S. through Spectra Laboratories (“Spectra”). Spectra provides blood, urine
and other bodily fluid testing services to determine the appropriate individual dialysis therapy for a patient and to
assist physicians in determining whether a dialysis patient's therapy regimen, diet and medicines remain optimal.
In 2013, Spectra acquired Shiel Laboratories (“Shiel”). Shiel expands our laboratory services to include clinical
anatomic pathology and molecular testing in the New York region.
Pharmacy Services
We offer pharmacy services, mainly in the U.S. These services include delivering renal medications and
supplies to the homes of patients or to their dialysis clinic directly from renal pharmacists who are specially
trained in treating and counseling patients living with kidney disease. We also actively support education and
compliance with phosphate binders and other medications for bone and mineral metabolism.
21
Vascular Access Surgery Services
We have vascular access clinics mainly in the U.S. but we also operate clinics in Portugal and we have
opened a new clinic in Taiwan. Dialysis requires access to the bloodstream, which is accomplished by catheters,
grafts, or arteriovenious fistulas. Patients receiving hemodialysis need to have a vascular access site put in before
their dialysis starts in order for our dialysis machines to filter their blood and return the newly clean blood into
their bodies. Vascular access is necessary because human veins are too small; the surgery usually joins together
an artery and a vein to create a vein strong enough to receive the hemodialysis needles. In addition, the vascular
access centers provide services to address peripheral artery disease, which is common in dialysis patients.
Acquisitions and Investments
A significant factor in the growth in our revenue and operating earnings in prior years has been our ability to
acquire healthcare businesses, particularly dialysis clinics, on reasonable terms. Worldwide, physicians own
many dialysis clinics that are potential acquisition candidates for us. In the U.S., doctors might decide to sell
their clinics to obtain relief from day-to-day administrative responsibilities and changing governmental
regulations, to focus on patient care and to realize a return on their investment. Outside of the U.S., doctors
might determine to sell to us and/or enter into joint ventures or other relationships with us to achieve the same
goals and to gain a partner with extensive expertise in dialysis products and services. Privatization of health care
in Eastern Europe and Asia could present additional acquisition opportunities.
During 2013 and 2012, we had total acquisitions and investments of $496 million and $1,879 million,
respectively. Of the total 2013 acquisitions and investments, FMCH made an investment-type loan granting a
$200 million credit facility to a middle market dialysis provider (of which $170 was drawn as of December 31,
2013; see Note 8 of the Notes to the Consolidated Financial Statements “Other Assets and Notes Receivables”),
we acquired a full-service clinical laboratory, and we continued to enhance our presence outside of the U.S. In
2012, the cash consideration amounted to $1,879 million, primarily for the Liberty Acquisition (see Note 2 of the
Notes to the Consolidated Financial Statements, “Acquisition of Liberty Dialysis Holdings”). For further
discussion of our 2013 acquisitions and investments, see “Information on the Company – History and
Development of the Company – History,” above and “– Our Strategy and Competitive Strengths – Cornerstones
for Strategic Growth- (1) Continuous Growth and Expansion” and “Renal Pharmaceuticals” above.
Quality Assurance and Quality Management in Dialysis Care
With regard to treatment quality, our clinics work in conformance with the generally accepted quality
standards of the industry, particularly the KDOQI (Kidney Disease Outcomes Quality Initiative) guidelines from
the United States, the European ERBP standard (European Renal Best Practice) and increasingly, the KDIGO
(Kidney Disease: Improving Global Outcomes), an industry initiative for global clinical practice guidelines.
Clinical data management systems are used to routinely collect certain medical parameters, which we evaluate in
anonymized form in compliance with these guidelines.
To evaluate the quality of our dialysis treatments, we use quality parameters that are generally recognized by
the dialysis industry, such as hemoglobin values. In cooperation with responsible nephrologists, we aim to
achieve a defined hemoglobin level for our patients. The kt/v value, which represents the volume of fluid
completely cleared of urea during a single treatment divided by the volume of water a patient’s body contains,
gives an indication of the filtering performance of a treatment by establishing the ratio of the length of treatment
and the filtration rate of certain toxic molecules. Albumin, a protein, is one quality parameter used to monitor a
patient’s general nutritional condition. Hospitalization days are another important indicator of the treatment
quality, because they are particularly cost-intensive and can significantly reduce the quality of life of dialysis
patients.
In our EMEA region our quality management activities are primarily focused on comprehensive
development and implementation of a Healthcare Services Management System as part of an Integrated
Management System ("IMS"). Our goals in this area include not only meeting quality requirements for our
dialysis clinics and environmental concerns, but also managing the quality of our dialysis care. This approach
results in an IMS structure that closely reflects existing corporate processes. We are also able to use the IMS to
fulfill many legal and normative regulations covering service lines. In addition, the IMS standard offers a highly
flexible structure that allows us to adapt to future regulations. Our IMS fulfills the ISO-Norm 9001:2008
requirements for quality management systems and links it with the ISO-Norm 14001:2004 for environmental
management systems. At the same time, the IMS conforms to the medical devices requirements of ISO-Norm
13485:2003.

22
Our dialysis clinics’ processes and documentation are regularly inspected by internal auditors and external
parties. The underlying quality management system is certified and found to be in compliance with relevant
regulations, requirements and company policies. Currently, dialysis clinics in 19 countries within our European
region have quality management systems which are certified according to the quality management standard ISO
9001:2008.
Additionally, we have a comprehensive program, NephroCare Excellence, in our European region.
NephroCare is our service that provides complete life-saving treatments for renal failure at the point of care
using advanced technologies and listening to and understanding our patients’ needs to enable the best therapies,
ensure a high-quality of care and empower patients. Our NephroCare Excellence program brings together in one
comprehensive program all of our quality and efficiency standards as well as proven best practices from different
countries. The program is designed to support more than 30 individual countries in introducing NephroCare’s
quality standards and tools to all clinics efficiently, systematically and within a defined timeframe. Our goal is to
harmonize the routines in our network of clinics, to make sure that clinic employees identify with the values of
NephroCare, and to foster awareness of the NephroCare brand and of our commitment to enabling affordable
renal replacement therapy for the different healthcare authorities worldwide.
The UltraCare® program of our North America Segment dialysis services group represents our commitment
to deliver excellent care to patients through innovative programs, state-of-the art technology, continuous quality
improvement and a focus on superior patient service. It combines our latest product technology with our highly
trained and skilled staff to offer our patients what we believe is a superior level of care. The basis for this form of
treatment is the Optiflux® polysulfone single-use dialyzer. Optiflux® single use dialyzers are combined with our
2008™ Hemodialysis Delivery System series, which has advanced online patient monitoring and Ultra Pure
Dialysate, all of which we feel improve mortality rates and increase the quality of patient care. The UltraCare®
program also utilizes several systems to allow the tailoring of treatment to meet individual patient needs. Among
the other capabilities of this system, staff will be alerted if toxin clearance is less than the target prescribed for
the patient, and treatment can be adjusted accordingly. The UltraCare® program also includes an annual training
program for staff recertification. Additionally, the UltraCare® at Home emphasizes patient-centered care:
offering the full range of treatment modalities coupled with superior customer service for patients desiring care
in the home setting.
At each of our North America Segment dialysis clinics, a quality assurance committee is responsible for
reviewing quality of care data, setting goals for quality enhancement and monitoring the progress of quality
assurance initiatives. We believe that we enjoy a reputation of providing high quality care to dialysis patients. In
2013, the Company continued to develop and implement programs to assist in achieving our quality goals. Our
Access Intervention Management Program detects and corrects arteriovenous access failure in hemodialysis
treatment and the percentage of patients who use catheters, which is the major cause of hospitalization and
morbidity.
Our principal focus of our research and development activities is the development of new products,
technologies and treatment concepts to optimize treatment quality for dialysis patients. See Item 5.C, “Operating
and Financial Review and Prospects – Research and Development.”
Sources of U.S. Dialysis Care Net Revenue
The following table provides information for the years ended December 31, 2013, 2012 and 2011 regarding
the percentage of our U.S. dialysis treatment services net revenues from (a) the Medicare ESRD program, (b)
private/alternative payors, such as commercial insurance and private funds, (c) Medicaid and other government
sources and (d) hospitals.
Year Ended December 31,
2013 2012 2011
Medicare ESRD program 49.4% 48.0% 46.2%
Private / alternative payors 42.6% 42.6% 42.8%
Medicaid and other government sources 3.3% 4.5% 5.9%
Hospitals 4.7% 4.9% 5.1%
Total 100.0% 100.0% 100.0%

23
Under the Medicare ESRD program, Medicare reimburses dialysis providers for the treatment of certain
individuals who are diagnosed as having ESRD, regardless of age or financial circumstances. See "Regulatory
and Legal Matters — Reimbursement."
Patient, Physician and Other Relationships
We believe that our success in establishing and maintaining dialysis clinics, both in the U.S. and in other
countries, and vascular access centers in the U.S. depends significantly on our ability to obtain the acceptance of
and referrals from local physicians, hospitals and managed care plans. In nearly all our dialysis clinics, local
doctors, who specialize in the treatment of renal patients (nephrologists) act as practitioners. A dialysis patient
generally seeks treatment at a conveniently located clinic at which the patient's nephrologist has staff privileges.
Our ability to provide high-quality dialysis care and to fulfill the requirements of patients and doctors depends
significantly on our ability to enlist nephrologists for our dialysis clinics and receive referrals from
nephrologists, hospitals and general practitioners.
Medicare ESRD program reimbursement regulations require that a medical director generally supervise
treatment at a dialysis clinic. Generally, the medical director must be board certified or board eligible in internal
medicine or pediatrics, have completed a board-approved training program in nephrology and have at least
twelve months of experience providing care to patients undergoing dialysis. Our medical directors also generally
maintain their own private practices. We have entered into written agreements with physicians who serve as
medical directors in our clinics. In the North America Segment these agreements generally have an initial term
between five to ten years. The compensation of our medical directors and other contracted physicians is
negotiated individually and depends in general on local factors such as competition, the professional
qualification of the physicians, their experience and their tasks as well as the size and the offered services of the
clinic. The total annual compensation of the medical directors and the other contracted physicians is stipulated at
least one year in advance and the medical directors agree to seek to continue to improve efficiency and quality.
We believe that the compensation of our medical directors is in line with the market.
Almost all contracts we enter into with our medical directors in the United States as well as the typical
contracts which we obtain when acquiring existing clinics, contain non-competition clauses concerning certain
activities in defined areas for a defined period to time. These clauses do not enjoin the physicians from
performing patient services directly at other locations/areas. As prescribed by law we do not require physicians
to send patients to us or to specific clinics or to purchase or use specific medical products or ancillary services.
A number of the dialysis and vascular access centers we operate are owned, or managed, by joint ventures in
which we hold a controlling interest and one or more hospitals, physicians or physician practice groups hold a
minority interest. We also have agreements with physicians to provide management and administrative services
at vascular access centers in which physicians or physicians groups hold an ownership interest and agreements
with physicians to provide professional services at vascular access centers. While we have structured our joint
ventures to comply with many of the criteria for safe harbor protection under the U.S. Federal Anti-Kickback
Statute, our investments in these joint venture arrangements and administrative service agreements do not satisfy
all the elements of such safe harbors.
Competition
Dialysis Services. Our largest competitors in the North America Segment are DaVita HealthCare Partners,
Inc., and US Renal Care, Inc. and, in our International Segment, our largest competitors are Diaverum and
Kuratorium für Heimdialyse in Europe, Zenjin-Kai and Showai-Kai in Asia-Pacific, and Baxter International
Inc. and Diaverum in Latin America. Ownership of dialysis clinics in the U.S. consists of a large number of
company-owned clinic providers, each owning ten or fewer clinics and a small number of larger company-
owned, multi-clinic providers who own the majority of U.S. clinics, of which the Company and DaVita
HealthCare Partners are the largest. Over the last decade the dialysis industry has been characterized by ongoing
consolidations. Internationally, the dialysis services market is much more fragmented, with a higher degree of
public ownership in many countries.
Many of our dialysis clinics are in urban areas, where there frequently are many competing clinics in
proximity to our clinics. We experience direct competition from time to time from former medical directors,
former employees or referring physicians who establish their own clinics. Furthermore, other healthcare
providers or product manufacturers, some of which have significant operations, may decide to enter the dialysis
business in the future.

24
Because in the U.S. government programs are the primary source of reimbursement for services to the
majority of patients, competition for patients in the U.S. is based primarily on quality and accessibility of service
and the ability to obtain admissions from physicians with privileges at the facilities. However, the extension of
periods during which commercial insurers are primarily responsible for reimbursement and the growth of
managed care have placed greater emphasis on service costs for patients insured with private insurance.
In most countries other than the U.S., we compete primarily against individual freestanding clinics and
hospital-based clinics. In many of these countries, especially the developed countries, governments directly or
indirectly regulate prices and the opening of new clinics. Providers compete in all countries primarily on the
basis of quality and availability of service and the development and maintenance of relationships with referring
physicians.
Laboratory Services. Spectra competes in the U.S. with large nationwide laboratories, dedicated dialysis
laboratories and numerous local and regional laboratories, including hospital laboratories. In the laboratory
services market, companies compete on the basis of performance, including quality of laboratory testing,
timeliness of reporting test results and cost-effectiveness. We believe that our services are competitive in these
areas.
Dialysis Products
Based on internal estimates prepared using our MCS, publicly available market data and our data of
significant competitors, we are the world's largest manufacturer and distributor of equipment and related
products for hemodialysis and the second largest manufacturer and distributer of peritoneal dialysis products,
measured by publicly reported revenues. We sell our dialysis products directly and through distributors in more
than 120 countries. Most of our customers are dialysis clinics. For the year 2013, dialysis products accounted for
24% of our total revenue.
We produce a wide range of machines and disposables for HD, PD and acute dialysis:
HD machines and PD cyclers
Dialyzers, our largest product group
PD solutions in flexible bags
HD concentrates, solutions and granulates
Bloodlines
Systems for water treatment
Our product business also includes adsorbers, which are specialized filters used in other extracorporeal
therapies. In addition we sell products from other producers, including specific instruments for vascular access as
well as other supplies, such as bandages, clamps and injections. We also include our PhosLo®, Phoslyra® and
Venofer® iron products and sales of other renal pharmaceutical products as part of our dialysis product revenues.
Our Body Composition Monitor is also sold as part of both our peritoneal and hemodialysis products. The Body
Composition Monitor is used for home dialysis to determine a patient’s body composition (water, body mass and
fat) which assesses a patient’s hydration state to assist in determining the patient’s therapy
The markets in which we sell our dialysis products are highly competitive. The three largest manufacturers
of dialysis products accounted for approximately 64% of the worldwide market in 2013. As the market leader in
dialysis products, we had an approximately 34% market share. We estimate that in 2013, we supplied
approximately 42% of global dialyzer production and approximately 55% of all HD machines sold worldwide.
We estimate that our market share for PD products sold worldwide in 2013 was 20%.

25
Overview
The following table shows the breakdown of our dialysis product revenues into sales of hemodialysis
products, peritoneal dialysis products and other dialysis products.
Year Ended December 31,
2013 2012 2011
Total Total Total
Product % of Product % of Product % of
Revenues Total Revenues Total Revenues Total
( in millions)
Hemodialysis Products
$
2,813 81 $ 2,649 80 $ 2,603 79
Peritoneal Dialysis Products 424 12 415 13 417 13
Other 243 7 245 7 268 8
Total
$
3,480 100 $ 3,309 100 $ 3,288 100
Hemodialysis Products
The reduction of risk factors for cardiovascular diseases is core to the development of dialysis systems and
products at FMC-AG & Co. KGaA. Taking this challenge into account, we offer a comprehensive hemodialysis
product line, including HD machines, modular components for dialysis machines, Polysulfone dialyzers,
bloodlines, HD solutions and concentrates, needles, connectors, machines for water treatment, data
administration systems, dialysis chairs, PhosLo® and Phoslyra® phosphate binders, Venofer® iron products, and
other renal drug products. We continually strive to expand and improve the capabilities of our hemodialysis
systems to offer an advanced treatment mode at reasonable cost.
Dialysis Machines. We sell our 4008, 5008, and 5008s Series HD dialysis machines in EMEALA and AP.
In North America, we sell our 2008® Series machines, modeled on the 4008 Series. The 4008/2008 series is the
most widely sold machine for hemodialysis treatment. The 2008T is the only hemodialysis machine currently
available with the Clinical Data eXchangeTM (“CDX”) feature. CDX allows machine users to toggle their 2008T
monitor view to provide access to their medical information system and dialysis screen. In 2011 in North
America, the 2008K@home hemodialysis machine was introduced, which features user interface enhancements
and the WetAlertTM wireless wetness detector for identification of blood leaks. In our International Segment, the
4008S classic machine is a basic dialysis machine for performing conventional HD treatments with limited
therapy options for budget-focused customers. Following the successful launch of the 5008 series, we
concentrated on the continued improvement of the reliable operation of our model 5008 dialysis machine in
clinical use and under increasingly varied conditions in international applications. These efforts for improvement
have taken into account considerable feedback from our own dialysis clinics as well as from other customers
while focusing on therapeutic, technical, and economic aspects of the machine. The 5008 series is intended to
gradually replace most of the 4008 series in the coming years. The successor 5008 contains a number of newly
developed technical components for revised and improved dialysis processes and is offering the most efficient
therapy modality, ONLINE-Hemodiafiltration (“ONLINE HDF”), as a standard feature. Our latest machine
software upgrades the 5008 Therapy System to the CorDiax product line for use with our FX CoreDiax
dialyzers. Significant advances in the field of electronics enable highly complex treatment procedures to be
controlled and monitored safely and clearly through dedicated interfaces. Our dialysis machines offer the
following features and advantages:
Volumetric dialysate balancing and ultrafiltration control system. This system provides for safe and
more efficient use of highly permeable dialyzers, permitting efficient dialysis with controlled rates of
fluid removal;
Proven hydraulic systems, providing reliable operation and servicing flexibility;
Compatibility with all manufacturers' dialyzers and a variety of bloodlines and dialysis solutions,
permitting maximum flexibility in both treatment and disposable products usage;
Modular design, which permits us to offer dialysis clinics a broad range of options to meet specific
patient or regional treatment requirements and specialized modules that provide monitoring and

26
response capability for selected biophysical patient parameters, such as body temperature and relative
blood volume. Modular design also allows upgrading through module substitution without replacing
the entire machine;
Sophisticated microprocessor controls, touchscreen interfaces, displays and/or readout panels that are
adaptable to local language requirements;
Battery backup, which continues operation of the blood circuit and all protective systems up to 20
minutes following a power failure;
Online clearance, measurement of dialyzer clearance for quality assurance with On-Line Clearance
Monitoring, providing immediate effective clearance information, real time treatment outcome
monitoring, and therapy adjustment during dialysis without requiring invasive procedures or blood
samples;
Clinical Data eXchange in the 2008T:
− The 2008T features an industrial grade computer inside the machine, as well as, an external
keyboard and touchpad;
− The Medical Information System (MIS) and dialysis screens are accessible on the same monitor by
simply pressing the CDX toggle key; and
− Clinicians no longer need to leave the patient station to gain access via standalone computers on the
treatment floor or at nursing stations;
Online data collection capabilities and computer interfacing with our Therapy Data Management
System (TDMS) and/or Fresenius Medical Information System (FMiS) systems. Our systems enable
users to:
− monitor and assess prescribed therapy;
− connect a large number of hemodialysis machines and peripheral devices, such as patient scales,
blood chemistry analyzers and blood pressure monitors, to a computer network;
− enter nursing records automatically at bedside;
− adapt to new data processing devices and trends;
− perform home hemodialysis with remote monitoring by a staff caregiver; and
− record and analyze trends in medical outcome factors in hemodialysis patients;
The series 2008k@home, introduced in North America in 2011, a dialysis machine specifically
developed for in home use with an intuitively designed user interface and the addition of the wetness
detector for increased safety. The use of our most advanced technology and adaptability for in-home
use makes this machine highly accessible for patients who would like more flexibility and control
throughout their dialysis process; and
In the series 5008 CorDiax, the most efficient therapy mode ONLINE HDF is standard.
Dialyzers. We manufacture our F-Series and premium FX class® series of dialyzers and our Optiflux®
polysulfone single-use dialyzer using hollow fiber Fresenius Polysulfone® and Helixone® membranes from
synthetic materials. We estimate that we are the leading worldwide producer of polysulfone dialyzers. In 2011,
we introduced the new FX CorDiax dialyzer which contains the Helixone®plus high performance membrane. The
Helixone®plus membrane selectively filters out toxins such as phosphates to reduce the risk of cardiovascular
disease. It was improved in 2011 with the addition of improved performance characteristics and is characterized
by a very high permeability to enable an increased removal of uremic toxins in the middle molecular weight
range.
We believe that Polysulfone offers the following superior performance characteristics compared to other
materials used in dialyzers:
increased biological compatibility, resulting in reduced incidence of adverse reactions to the fibers;
greater capacity to clear uremic toxins from patient blood during dialysis, permitting more thorough,
more rapid dialysis, resulting in shorter treatment time; and
a complete range of permeability or membrane pore size, which permits dialysis at prescribed rates —
high flux and low flux, as well as ultra flux for acute dialysis — and allows tailoring of dialysis
therapy to individual patients.

27
Other Dialysis Products. We manufacture and distribute arterial, venous, single needle and pediatric
bloodlines. We produce both liquid and dry dialysate concentrates. Liquid dialysate concentrate is mixed with
purified water by the hemodialysis machine to produce dialysis solution, which removes the toxins and excess
water from the patient's blood during dialysis. Dry concentrate, developed more recently, is less labor-intensive
to use, requires less storage space and may be less prone to bacterial growth than liquid solutions. We also
produce dialysis solutions in bags, including solutions for priming and rinsing hemodialysis bloodlines, as well
as connection systems for central concentrate supplies and devices for mixing dialysis solutions and supplying
them to hemodialysis machines. Other products include solutions for disinfecting and decalcifying hemodialysis
machines, fistula needles, hemodialysis catheters, and products for acute renal treatment.
Peritoneal Dialysis Products
We offer a full line of peritoneal dialysis systems and solutions which include both continuous ambulatory
peritoneal dialysis (“CAPD”) and continuous cycling peritoneal dialysis (“CCPD”) also called automated
peritoneal dialysis (“APD”).
CAPD Therapy: We manufacture both systems and solutions for CAPD therapy. Our product range has a
number of advantages for patients including:
Fewer possibilities for touch contamination. Our unique PIN and DISC technology was designed to
reduce the number of steps in the fluid exchange process, which decreases the risk of infection,
particularly in the disconnection step in which the patient connector is closed automatically without
any direct touch intervention.
Optimal biocompatibility. Our PD stay safe Balance and stay safe Bicavera® solutions are pH neutral
and have ultra-low glucose degradation product contents providing greater protection for the peritoneal
membrane and allowing for the protection of residual renal function of the PD patients.
Environmentally friendly material: In our International Segment, our stay•safe® system is made of
Biofine®, a material developed by Fresenius, which upon combustion is reduced to carbon dioxide and
is PVC and plasticizer free. Biofine® requires less energy to manufacture, generates less waste and is
easy to recycle.
APD Therapy: We have been at the forefront of the development of automated peritoneal dialysis machines
since 1980. APD therapy differs from CAPD in that fluid is infused into the patient’s peritoneal cavity while the
patient sleeps. The effectiveness of the therapy is dependent on the dwell time, the composition of the solution
used, the volume of solution and the time of the treatment, usually 8 – 10 hours. APD offers a number of benefits
to patients:
Improved quality of life. The patient is treated at night and can lead a more normal life during the day
without fluid exchange every few hours.
Improved adequacy of dialysis. By adjusting the parameters of treatment it is possible to provide more
dialysis to the patient compared to conventional CAPD therapy. This therapy offers important options
to physicians such as improving the delivered dose of dialysis for certain patients.
Personalized adapted APD. The cycler allows patients to be treated using a modified version of APD
where short dwell times with small fill volumes are used first to promote ultrafiltration and
subsequently longer dwell times and larger fill volumes promote the removal of uremic toxins from
the blood.
Our automated peritoneal dialysis equipment incorporates microprocessor technology. This offers physicians
the opportunity to program specific prescriptions for individual patients. Our APD equipment product line
includes:
sleepsafe: The sleep•safe machine has been used since 1999. It has automated connection
technology thus further reducing the risk of touch contamination. Another key safety feature is a
barcode recognition system for the various types of solution bags used. This improves compliance and
ensures that the prescribed dosage is administered to the patient. There is also a pediatric option for
the treatment of infants. The sleep•safe machine allows for innovative and simple ways of
individualizing APD prescriptions to achieve better treatment results, including personalized
adapted APD therapy.
North American cycler portfolio: This includes: (a) the Liberty® cycler introduced in 2008
incorporating many new operational and safety features with an innovative piston driven pumping
cassette design, and user interface enhancements such as a color touch screen which guides the patient

28
through the setup and treatment, (b) the Freedom® cyclers for low volume applications and acute
markets, and (c) the Newton IQ® Cycler, which offers gentle gravity fills and drains as well as the
option of pumping waste dialysate directly into the receptacle. The IQdrive® USB stick can provide
actual treatment details and results to the physician for compliance monitoring and, when used with
our North American PD cyclers, can upload the patient’s prescription into the machine.
Patient Management Software: We have developed specific patient management software tools to
support both CAPD and APD therapies in the different regions of the world. These include:
PatientOnLine, IQsystem®, Pack-PD®
and FITTness™. These tools can be used by physicians and
nurses to design and monitor treatment protocols thus ensuring that therapy is optimized and that
patient care is maximized. These different approaches aim to support physicians and nurses in better
formulating treatments for a patient’s individual needs; improving a patient’s quality of life while
safely extending their time on PD.
Renal Pharmaceuticals
We registered Osvaren®, a phosphate binder with a reduced calcium component, within Europe in 2006.
Osvaren® supports cardiovascular health through excellent phosphate binding with a reduced calcium component
as well as supplementation with magnesium. We are in the process of developing a new flavored granulate
formulation of Osvaren® which is expected to further increase patient acceptance. Osvaren® granulate is
expected to be registered in Europe and other international markets in 2016. In international markets we are in
the process of registering other patent free compounds used frequently in dialysis patients for use in our own
clinics and for third party sales.
Excess phosphates, which are ordinarily removed by healthy kidneys, can cause bone and heart problems.
Phosphate binders reduce phosphate absorption. We acquired the rights to PhosLo®, a phosphate binder, in
November 2006. We have received approval of PhosLo® in selected European countries. In October 2008, a
competitor’s generic phosphate binder that competes with PhosLo® was introduced in the U.S. market, which
reduced our PhosLo® sales in 2009. In October 2009, we launched a competing authorized generic version of the
PhosLo® existing gelcap formulation in the U.S. Since FDA approval in April 2011 of our drug application for
Phoslyra®, the liquid formulation of PhosLo®, we have been selling and will continue to sell Phoslyra® in the
U.S. market.
In 2008, we entered into two separate and independent license and distribution agreements, one for certain
countries in Europe and the Middle East (with Galenica AG and Vifor (International) AG) and one for the U.S.
(with Luitpold Pharmaceuticals Inc. and American Regent, Inc.), to market and distribute intravenous iron
products, such as Venofer® (iron sucrose) and Ferinject® (ferric carboxymaltose) (outside of the U.S.). Both
drugs are used to treat iron deficiency anemia experienced by non-dialysis Chronic Kidney Disease (“CKD”)
patients as well as dialysis patients. Venofer® is the leading intravenous iron product worldwide. The first
agreement concerns all commercialization activities for these intravenous iron products in the field of dialysis
and became effective on January 1, 2009. In North America, a separate license agreement effective November 1,
2008 provides our subsidiary Fresenius USA Manufacturing Inc. (“FUSA”) with exclusive rights to manufacture
and distribute Venofer® to freestanding (non-hospital based) U.S. dialysis facilities and, in addition, grants
FUSA similar rights for certain new formulations of the drug. The U.S. license agreement has a term of ten years
and includes FUSA extension options. The international agreement has a term of 20 years.
In 2009, we entered into separate agreements with AMGEN International to purchase Aranesp and Mimpara
and to jointly communicate selected scientific and promotional topics to the physician community. Together
with Amgen, we are working to foster new scientific understanding of CKD through the evaluation of our
research database with the help of renowned academic advisory committees.
In December 2010, we announced the expansion of our agreements with Galenica by forming a new renal
pharmaceutical company, Vifor Fresenius Medical Care Renal Pharma, (“VFMCRP”), with the intention to
develop and distribute products to treat iron deficiency anemia and bone mineral metabolism for pre-dialysis and
dialysis patients. FMC-AG & Co. KGaA owns 45% of the company which is headquartered in Switzerland.
Galenica contributed licenses (or the commercial benefit in the U.S.) to its Venofer® and Ferinject®
products for
use in the dialysis and pre-dialysis market (CKD stages III to V). Commercialization of both of these products
outside the renal field will remain fully the responsibility of Galenica and its existing key affiliates or partners.
Galenica also contributed to the new company exclusive worldwide rights for PA21 (excluding Japan, where
PA21 will be developed through another partner), a novel iron-based phosphate binder. In July 2012, Galenica
announced that PA21 had achieved its primary and secondary endpoint in its phase III trial and that regulatory
submissions in the U.S., EU and Switzerland would move forward. On November 27, 2013 FMC and Galencia
were notified by the FDA that Velphoro® (PA21) had received U.S. FDA approval for the treatment of

29
hyperphosphatemia in CKD dialysis patients. FMC will market the product on behalf of VFMCRP and plans to
launch Velphoro® in the first quarter of 2014. The initial product for the U.S. market will be supplied by an
FDA approved, Vifor manufacturing facility while FMC works with a U.S. based contract manufacturer to
move the manufacturing to the U.S. in late 2014 or early 2015. The expansion of our agreement in December
2010 allowed Galenica and the Company to work together in the development and commercialization of renal
pharmaceuticals for CKD stages III to V in the U.S. and to continue their collaboration in CKD stage V in
selected other countries. European antitrust authorities granted approval in October 2011, which allowed
VFMCRP to proceed with the targeted expansion of its global operations on November 1, 2011. This approval
brought to fruition an agreement that superseded an earlier agreement for certain countries in Europe and the
Middle East. Furthermore, in 2012, FUSA renegotiated and further amended the contract originally signed in
2008 with Luitpold Pharmaceuticals, Inc. The original term length of the agreement remained the same.
In September 2011, we closed an agreement with the Japanese company Toray for co-development in
Europe of the compound TRK820 for chronic itch (uremic pruritus). Registration of this drug, which bears an
orphan disease indication, is currently pending.
We estimate that the worldwide market for dialysis drugs used to treat ESRD and CKD (currently vitamin
D, iron, potassium binders and phosphate binders) in 2013 was more than $3.0 billion, remaining constant in
comparison to the prior year. As part of our integration of new business areas strategy, we intend to continue to
integrate the use of dialysis drugs with our existing product technology, dialysis treatment and vascular access.
In an increasing number of countries, we are required by health care systems and reimbursement
requirements to supply pharmaceuticals for many conditions as part of comprehensive treatment packages. See
“Regulatory and Legal Matters – Reimbursement.” We intend to continue to pursue development and
commercialization partnerships with suppliers of branded and unbranded high quality pharmaceutical
substances to cover this requirement. In addition, we will increasingly work toward the development of
proprietary innovative pharmaceutical solutions that offer additional medical value to dialysis patients.
Customers, Marketing, Distribution and Service
We sell most of our products to clinics, hospitals and specialized treatment clinics. With our comprehensive
product line and years of experience in dialysis, we believe that we have been able to establish and maintain very
close relationships with our global clinic customer base. Close interaction between our Sales and Marketing and
Research and Development (“R&D”) personnel enables us to integrate concepts and ideas that originate in the
field into product development. We maintain a direct sales force of trained salespersons engaged in the sale of
both hemodialysis and peritoneal dialysis products. Sales and Marketing engages in direct promotional efforts,
including visits to physicians, clinical specialists, hospitals, clinics and dialysis clinics, and represents us at
industry trade shows. We also sponsor medical conferences and scientific symposia as a means for disseminating
scientific or technical information. Our clinical nurses provide clinical support, training and assistance to
customers and assist our sales force. We also use outside distributors to provide sales coverage in countries that
our internal sales force does not service.
In our basic distribution system, we ship products from factories to central warehouses which are frequently
located near the factories. From these central warehouses, we distribute our dialysis products to regional
warehouses. We distribute home hemodialysis and peritoneal dialysis products to the patient at home, and ship
hemodialysis products directly to dialysis clinics and other customers. Local sales forces, independent
distributors, dealers and sales agents sell all our products.
We offer customer service, training and education in the applicable local language, and technical support
such as field service, repair shops, maintenance, and warranty regulation for each country in which we sell
dialysis products. We provide training sessions on our equipment at our facilities in Schweinfurt, Germany,
Waukegan, Illinois, Coppell, Texas and Manila, Philippines and we also maintain regional service centers that
are responsible for day-to-day international service support.
Manufacturing Operations
We operate state-of-the-art production facilities worldwide to meet the demand for machines, cyclers,
dialyzers, solutions, concentrates, bloodlines, and disposable tubing assemblies and equipment for water
treatment in dialysis clinics. We have invested significantly in developing proprietary processes, technologies
and manufacturing equipment which we believe provide a competitive advantage in manufacturing our products.
Our strategically located production and distribution centers help to reduce transport costs. We are using our
facilities in St. Wendel, Germany and Ogden, Utah as centers of competence for development and

30
manufacturing. For example, in St. Wendel we developed in-house an automatic bundling machine for
processing polysulfone fibers. The machine automatically carries out all steps required to convert hollow fibers
for dialyzer production and to create bundles with a fixed number of fibers – the core of the dialyzer. We
integrated the first automatic bundling machine into production in 2008. Currently, we have twelve spinning
lines that are equipped with these bundling machines.
We produce and assemble hemodialysis machines and CCPD cyclers in our Schweinfurt, Germany and our
Concord, California facilities. We also maintain facilities at our service and local distribution centers in
Argentina, Egypt, France, The Netherlands, China, Brazil, and Russia for testing and calibrating dialysis
machines manufactured or assembled elsewhere, to meet local end user market needs. We manufacture and
assemble dialyzers and polysulfone membranes in our St. Wendel, Germany, L'Arbresle, France, Vrsac, Serbia
and Inukai and Buzen, Japan facilities and at production facilities of our joint ventures in Belarus and Japan. At
our Ogden, Utah facilities, we manufacture and assemble dialyzers and polysulfone membranes and manufacture
PD solutions. We manufacture hemodialysis concentrate at various facilities worldwide, including France, Italy,
Great Britain, Spain, Turkey, Serbia, Morocco, Argentina, Brazil, Columbia, Australia, Germany, Canada,
Mexico and the U.S. PD products are manufactured in North America, Europe, Latin America, and Asia, with
two of our largest plants for production of PD products in Germany and the U.S. In 2013, our worldwide
dialyzer production increased 7% as compared to the same period in 2012 and our hemodialysis machines
production increased by 3% in 2013 as compared to the same period in 2012. This was mainly driven by
additional sales of the series 4008 machines. Additionally, our plant in Reynosa, Mexico is the world’s largest
(by volume) bloodline manufacturing facility and our facility in Jiangsu, China, which produces bloodlines also
is in the pre-production phase of implementing their production line for dialyzers, which began in 2013. In
addition, we are pursuing the approval process for manufacture of peritoneal dialysis solutions as well as
hemodialysis concentrate in Jiangsu. Our facilities are inspected on a regular basis by national and/or
international authorities.
We have also expanded our dialyzer production capacities in the U.S. (Ogden, Utah), from 37 million to 48
million with an assembly line that went into production in 2012. Additionally, operations began in 2012 for
several new production lines and a high-bay storage area. We are also expanding our operations for the
production of FX-class premium dialyzers in France and China. The new production lines for FX dialyzers
commenced in 2013, mainly in France. The production lines will provide an additional capacity of 18 million
dialyzers on an annual basis.
We operate a comprehensive quality management system in our production facilities. Raw materials
delivered for the production of solutions are subjected to infra-red and ultra-violet testing as well as physical and
chemical analysis to ensure their quality and consistency. During the production cycle, sampling and testing take
place in accordance with applicable quality control measures to assure sterility, safety and effectiveness of the
finished products. All process parameters e.g., pressure, temperature and time, required for the various processes
are monitored to ensure consistency of unfinished products during the production process. Through monitoring
of environmental conditions, particle and bacterial content are kept below permitted limits. We provide regular
ongoing training for our employees in the areas of quality control and proper production practice. All production
sites follow the Lean Manufacturing approach which in North America and our Schweinfurt plant includes the
“Lean Six Sigma” management system. The focus of Lean Manufacturing and Six Sigma is continuous
improvement of all manufacturing processes to achieve a very low error rate resulting in better quality
production while shortening manufacturing time. Our IMS fulfils ISO 9001:2008 requirements for quality
control systems in combination with the ISO norm 14001:2009 for environmental control systems. At the same
time, our IMS conforms to the requirements for medical devices of ISO norm 13485:2003/AC 2002 and of the
Medical Device Directive 93/42/EEC. We have implemented our IMS in all our European production sites. (See
also “Regulatory and Legal Matters – Facilities and Operational Regulations” below). All of our production
facilities have undergone annual ISO 13485:2003 Quality Systems inspections, maintaining all certifications, with
no major non-conformances to the standard being noted.
Environmental Management
We have integrated environmental protection targets into our operations worldwide. To reach these goals,
our IMS has been in use at our production facilities as well as at a number of dialysis clinics. IMS fulfils the
requirements of quality management systems as well as environmental management. Environmental goals are
set, adhered to and monitored during all stages of the lives of our products, from their development to their
disposal.

31
We continually seek to improve our production processes for environmental compatibility, which frequently
generates cost savings. Our environmentally certified production plants, dialysis clinics and research and
development in the European region participate in the Corporate Environment Program, the purpose of which is
to improve environmental awareness and ecological efficiency, comply with new environmental regulations and
expand the number of units certified under the environmental management standard ISO 14001:2004.
In some of our dialysis facilities, we establish, depending on the particular facility and circumstance, a
priority environmental protection target on which our dialysis clinics concentrate for at least one year.
Environmental performance in other dialysis facilities is used as the basis for comparisons and targets.
Improvements are implemented on a site-by-site basis after evaluation of the site’s performance.
In our European clinics, we continue to introduce our environmental management system in dialysis clinics
and we continue to monitor and assess the management system performance in clinics where it was previously
implemented. Currently, dialysis clinics in 13 countries in our European region are certified according to the
environmental management standard ISO 14001:2004. We are also working towards ISO 14001:2004
certification for our first dialysis clinic and manufacturing location in North America. We continued to roll out
the integrated software solution e-con 5 for the management of eco-controlling data in over 600 clinics. This
software is intended to reduce environmental management working time while increasing the eco-controlling
data quality and possibilities for data analysis at the place of origin.
In our North America Segment dialysis clinics, we implemented recycling programs for corrugated materials
and hemodialysis machines. Use of heat exchangers enables us to obtain residual heat from water used for
industrial purposes, which we use to heat fresh water for dialysis treatment. Our clinics in the North America
Segment commenced a reusable sharp containers program in 2009, for which there are currently 137 clinics
participating. Targeted environmental performance criteria in other locations include fresh water consumption
and improved separation of waste.
Sources of Supply
Our purchasing policy combines worldwide sourcing of high-quality materials with the establishment of
long-term relationships with our suppliers. Additionally, we carefully assess the reliability of all materials
purchased to ensure that they comply with the rigorous quality and safety standards required for our dialysis
products and we outsource only if we believe that a supplier can exceed our own quality standards. An
interactive information system links all our global projects to ensure that they are standardized and constantly
monitored.
We focus on further optimizing procurement logistics and reducing purchasing costs. Supplemental raw
material contracts for all manufacturers of semi-finished goods will enable us to improve purchasing terms for
our complete network. We are continuously intensifying, where appropriate, our use of internet-based
procurement tools by purchasing raw materials through special on-line auctions. Our sophisticated routing
software enables us to distribute our supplies to best accommodate customer requests while maintaining
operational efficiency. Additionally we have an automated replenishment control in our national warehouses that
allows the warehouses to be refilled when their inventory reaches a preset defined minimum level and allows us
to continue to improve our operational efficiency.
Patents and Licenses
As the owner of patents or licensee under patents throughout the world, we currently hold rights in 5,556
patents and patent applications in major markets. Patented technologies that relate to dialyzers include our
generation of DiaSafeplus® filters and FX® dialyzers which are the subject of patents and pending patent
applications.
The patents protecting the connector-container system for our biBag bicarbonate concentrate powder
container for the 4008 dialysis equipment series expired in 2013; while we expect there to be an impact, we
believe the price pressure will be mitigated by our strategic advantages in manufacturing and distribution. The
5008 biBag connector, a substantial part of the connector container system, is covered by further patents and
pending patent applications with expiry dates beyond 2020.
A number of patents and pending patent applications relate to components of the more recent 5008 dialysis
equipment series, including, for example, the pump technology, extracorporeal blood pressure measurement and
connector system for a modified biBag bicarbonate concentrate container. A number of applications are
pending for the North American 2008T HD machine including, for example, the CDX system for the display of

32
medical information directly on the 2008T screen, a wireless wet detector for sensing line disconnect and a U. S.
version of the biBag filling system. Applications are also pending relating to our new Liberty® peritoneal dialysis
cycler which has a number of innovative attributes such as its multi-channel disposable cassette, dual piston pump
and pneumatically locking door. Finally, a large number of new patent applications have been filed related to our
new table top portable HD machine and wearable kidney devices in development.
In 2011 we acquired Hema Metrics LLC’s assets related to noninvasive optical measurement of absolute
blood parameters (the CRIT-LINE system). We filed several new patent applications for improved blood
chambers and related software developed since the acquisition.
For PD, we hold protective rights for our polyolefine film, Biofine®, which is suitable for packaging
intravenous and peritoneal dialysis fluids. Patents have been granted in Australia, Brazil, Canada, Germany,
Europe, South Korea, Belarus and the United States. A further patent family describes and claims a special film for
peelable, non-PVC, multi chamber bag for peritoneal dialysis solutions. These patents have been granted in Brazil,
Europe, Germany, Japan, South Korea and the United States. However, oppositions against the patents in Europe
are currently pending.
We believe that our success will continue to depend significantly on our technology. As a standard practice,
we obtain the legal protections we believe are appropriate for our intellectual property. Nevertheless, we are in a
position to successfully market a material number of products for which patent protection has lapsed or where
only particular features are patented. We believe that even after the expiration of some of our patents, our
proprietary know how for the manufacturing of our products and our continuous efforts in obtaining targeted
patent protection for newly developed upgraded products will continue to provide us with a competitive
advantage. From time to time our patents may be infringed by third parties and in such case we will assert our
rights. Initially registered patents may also be subject to invalidation or infringement claims made by
competitors in formal proceedings (oppositions, trials, re-examinations, etc.) either in part or in whole. For
information regarding patent-related legal proceedings, see Note 20, “Commitments and Contingencies – Legal
and Regulatory Matters – Commercial Litigation” in our Consolidated Financial Statements. In addition,
technological developments could suddenly and unexpectedly reduce the value of some of our existing
intellectual property.
Trademarks
Our principal trademarks are the name “Fresenius” and the “F” logo, for which we hold a perpetual, royalty-
free license from Fresenius SE, our major shareholder and the sole shareholder of our general partner. See Item
7.B, “Related Party Transactions – Trademarks.”
Competition
Our competitors in the sale of hemodialysis and peritoneal dialysis products include Baxter International
Inc. (which acquired the hemodialysis product business of Gambro AB in 2013), Asahi Kasei Medical Co. Ltd.,
Bellco S.r.l., B. Braun Melsungen AG, Nipro Corporation, Nikkiso Co., Ltd., NxStage Medical, Inc., Terumo
Corporation, Kawasumi Laboratories Inc., Fuso Pharmaceuticals Industries Ltd., and Toray Industries, Inc.
Risk Management
We see risk management as the ongoing task of determining, analyzing and evaluating the spectrum of
potential and actual risks in the Company and its environment and, where possible, taking corrective measures.
Our risk management system, which is described in more detail below, provides us with a basis for doing so. It
enables management to identify at an early stage risks that could jeopardize our growth or going concern, and to
take steps to minimize any negative impact. As such, it is an important component of the Company’s
management and governance.
Risk management is part of our integrated management system. The main objective is to identify potential
risks as early as possible to assess their impact on business activities, where necessary, to take appropriate
countermeasures. Opportunities are not covered by the implemented risk management system. The two pillars of
our risk management are the corporate controlling function, which is used for the identification and steering of
short-term risks, and the internal risk monitoring system, which is typically used for the identification and
steering of mid- to long-term risks. In the monitoring system, regional risk managers are responsible for
identifying, assessing, and managing potential as well as existing industry- and market-related risks in their
region and reporting them to the regional chief financial officers. Twice a year, the regional chief financial
officers send their aggregated risk management reports to the central risk management coordinator who

33
consolidates the reports and presents them to the Management Board. The main focus lies with material risks
that have a total negative impact of €25 million or more in relation to operating income. The risk management
reports contain further information on potential risks. Our Management Board is informed directly and
immediately of any newly identified significant risks. The effectiveness of the risk management system is
monitored by the Audit and Corporate Governance Committee of the Supervisory Board.
In addition to risk reporting, traditional reporting to management is an important tool for managing and
controlling risks, as well as for taking preventive measures in a timely manner. Therefore, our Management
Board is informed on a monthly basis about the industry situation, our operating and non-operating business and
the outcome of analyses of our earnings and financial position, as well as of our assets position on a quarterly
basis.
Part of our risk management system is the Global Internal Audit department. The Global Internal Audit
department is regularly informed about the results of the risk management system. This department audits a
selected number of departments and subsidiaries worldwide each year. The department works according to the
internationally accepted standards of the Institute of Internal Auditors. The scope of internal auditing is
widespread and involves, among others, the effectiveness of controls over business processes, the reliability of
financial reporting and compliance with accounting regulations and internal policies. The Company’s locations
and units to be audited are determined annually on the basis of a selection model taking various risks into
consideration. This annual audit plan is reviewed by the Management Board and approved by the Audit and
Corporate Governance Committee of the Supervisory Board. It comprises financial audits of individual balance
sheet positions, as well as full audits of all business processes of subsidiaries or business units. All audit reports
are presented to the Management Board.
The Global Internal Audit department is also responsible for monitoring the implementation of measures
documented in the reports. The Management Board is informed about the implementation status on a quarterly
basis. The Audit and Corporate Governance Committee of the Supervisory Board is also informed of the audit
results. In 2013, a total of 39 audits were carried out. These included full-scope audits-reviews of all business
processes at the selected Company’s sites.
As a company required to file reports under the Exchange Act, we are subject to the provisions of the
Sarbanes-Oxley Act of 2002 and related listing rules of the New York Stock Exchange applicable to foreign
private issuers. For further information on this requirement, see Items 15.A. and 15.B, “Disclosure Controls and
Procedures” and “Management’s annual report on internal control over financial reporting.”
Regulatory and Legal Matters
Regulatory Overview
Our operations are subject to extensive governmental regulation by virtually every country in which we operate
including, most notably, in the U.S., at the federal, state and local levels. Although these regulations differ from
country to country, in general, non-U.S. regulations are designed to accomplish the same objectives as U.S.
regulations governing the operation of dialysis clinics, vascular access centers, laboratories and manufacturing
facilities, the provision of high quality health care for patients, compliance with labor and employment laws, the
maintenance of occupational, health, safety and environmental standards and the provision of accurate reporting
and billing for governmental payments and/or reimbursement. In the U.S., some states establish regulatory
processes that must be satisfied prior to the establishment of new dialysis clinics and vascular access centers. Outside
the U.S., each country has its own payment and reimbursement rules and procedures, and some countries prohibit
ownership of healthcare providers or establish other regulatory barriers to direct ownership by foreign companies. In
such jurisdictions, we may establish alternative contractual arrangements to provide services to those facilities.
Any of the following matters could have a material adverse effect on our business, financial condition and
results of operations:
failure to receive required licenses, certifications, clearances or other approvals for new facilities or
products or significant delays in such receipt;
complete or partial loss of various federal certifications, licenses, or other permits required under the
laws of any state or other governmental authority by withdrawal, revocation, suspension, or
termination or restrictions of such certificates and licenses by the imposition of additional
requirements or conditions, or the initiation of proceedings possibly leading to such restrictions or the
partial or complete loss of the required certificates, licenses or permits;
a non-appealable finding of material violations of U.S. healthcare laws; and

34
changes resulting from healthcare reform or other government actions that restrict our operations,
reduce reimbursement or reduce or eliminate coverage for particular products or services we
provide.
We must comply with all U.S., German and other legal and regulatory requirements under which we operate,
including the U.S. federal Medicare and Medicaid Fraud and Abuse Amendments of 1977, as amended, generally
referred to as the “Anti-Kickback Statute”, the federal False Claims Act, the federal restrictions on certain physician
referrals, commonly known as the “Stark Law”, the U.S. Civil Monetary Penalties Law, including the prohibition
on inducements to patients to select a particular healthcare provider, U.S. federal rules protecting the privacy and
security of patient medical information, as promulgated under the Health Insurance Portability and
Accountability Act of 1996 (“HIPAA”) and, as amended by the Health Information Technology for
Economic and Clinical Health (“HITECH”) Act (enacted as part of the American Recovery and
Reinvestment Act of 2009), and other fraud and abuse laws and similar state statutes, as well as similar laws in
other countries. The Patient Protection and Affordable Care Act (Pub.L. 111-148), as amended by the Health
Care and Education Reconciliation Act (Pub.L. 111-152) (collectively, “ACA”) enacted in the U.S. in 2010 and
other recent laws expanded the reach of many of these laws and expanded federal enforcement authority.
Moreover, there can be no assurance that applicable laws, or the regulations thereunder, will not be amended, or
that enforcement agencies or the courts will not make interpretations inconsistent with our own, any one of which
could have a material adverse effect on our business, reputation, financial condition and operating results. Sanctions
for violations of these statutes may include criminal or civil penalties, such as imprisonment, fines or forfeitures,
denial of payments, and suspension or exclusion from the Medicare and Medicaid programs. In the U.S., some of
these laws have been broadly interpreted by a number of courts, and significant government funds and personnel
have been devoted to their enforcement because such enforcement has become a high priority for the federal
government and some states. Our company, and the healthcare industry in general, will continue to be subject to
extensive federal, state and foreign regulation, the full scope of which cannot be predicted. In addition, the U.S.
Congress and federal and state regulatory agencies continue to consider modifications to healthcare laws that may
create further restrictions.
We maintain a comprehensive worldwide compliance program under the overall supervision of our general
counsel and chief compliance officer, who is a member of the General Partner’s Management Board. The program
includes a compliance staff, a written code of conduct applicable worldwide, training programs, regulatory
compliance policies and procedures including corrective action for failure to follow policies, provisions for
anonymous reporting of suspected violations of applicable laws or Company policies, and periodic internal audits
of our compliance procedures. Nevertheless, we operate many facilities throughout the United States and other
countries in which we do business. In such a decentralized system, it is often difficult to maintain the desired level
of oversight and control over the thousands of individuals employed by many affiliated companies. We rely on our
management structure, regulatory and legal resources, and the effective operation of our compliance program to
direct, manage and monitor the activities of these employees. If our employees, deliberately or inadvertently,
were to submit inadequate or incorrect billings to any federally-funded healthcare program, or engage in
impermissible conduct with physicians or other referral sources or vendors with which we do business, the actions
of such persons could subject us and our subsidiaries to liability under the Anti-Kickback Statute, the Stark Law
or the False Claims Act, among other laws. See Note 20, “Legal and Regulatory Matters — Other Litigation and
Potential Exposures” of the Notes to our audited consolidated financial statements.
Product Regulation
U.S.
In the U.S. numerous regulatory bodies, including the Food and Drug Administration (“FDA”) and
comparable state regulatory agencies impose requirements on certain of our subsidiaries as a manufacturer
and a seller of medical devices and drug products under their jurisdiction.
Pharmaceuticals. Some of the products our subsidiaries manufacture and/or distribute are subject to
regulation under the Federal Food, Drug, and Cosmetic Act of 1938, as amended (“FDCA”) and FDA’s
implementing regulations. They include our peritoneal dialysis and saline solutions, PhosLo ® (calcium
acetate), Phoslyra® (calcium acetate oral solution), Venofer® (iron sucrose injection, USP), and Velphoro
(sucroferric oxyhydroxide),. Many of these requirements are similar to those for devices, as described below.
We are required to register as an establishment with the FDA, and comply with regulatory requirements
governing product approvals, drug manufacturing, labelling promotion, distribution, post market safety
reporting and recordkeeping. Our pharmaceutical products must be manufactured in accordance with current
Good Manufacturing Practices (“cGMP”). We are required to provide information to the FDA whenever we
become aware of a report of an adverse drug experience associated with the use of one of our drug products
that is both serious and unexpected, as defined in FDA regulations and guidance. In addition, as with the

35
marketing of our medical devices, in order to obtain marketing approval of our drug products we must
satisfy mandatory procedures and safety and efficacy requirements. Furthermore, the FDA prohibits our
products division from promoting our pharmaceutical products in a false or misleading manner or for
unapproved indications and from otherwise misbranding or adulterating them. Finally, if the FDA believes
that a company is not in compliance with applicable drug regulations, it has similar enforcement authorities
as those discussed below with respect to medical devices.
Medical Devices. Our subsidiaries engaged in the manufacture of medical devices are required to
register with the FDA as device manufacturers and submit listing information for devices in commercial
distribution. As a manufacturer of medical devices, we are subject to requirements governing premarket
approval and clearance, labelling and promotion, medical device adverse event reporting, manufacturing
practices, reporting of corrections and removals, and recordkeeping, and we are subject to periodic
inspection by the FDA for compliance with these requirements. With respect to manufacturing, we are
subject to FDA’s Quality System Regulation (21 C.F.R. Part 820), which requires us to manufacture
products in accordance with cGMP, including standards governing product design. The medical dev ice
reporting regulations require that our products division report to the FDA whenever we receive or become
aware of information that reasonably suggests that a device may have caused or contributed to a death or
serious injury, or that a device has malfunctioned and a device or similar device would be likely to cause or
contribute to a death or serious injury if the malfunction were to recur. In addition, the FDA prohibits our
products division from promoting our manufactured products for unapproved or uncleared indications or in
an otherwise false or misleading manner.
In order to clinically test, produce and market certain medical products and other disposables (including
hemodialysis and peritoneal dialysis equipment, dialyzers, bloodlines and other disposables) for human use,
we must also satisfy mandatory procedures and safety and efficacy requirements established by the FDA or
comparable foreign governmental agencies. In the U.S., unless 510(k)-exempt, medical devices generally
require approval of a Premarket Approval Application (“PMA”) or clearance of a Section 510(k) Premarket
Notification (“510(k)”) prior to commercial marketing. After approval or clearance to market is given, the
FDA, upon the occurrence of certain events, has the authority to withdraw the approval or clearance or
require changes to a device, its manufacturing process, or its labelling or may require additional proof that
regulatory requirements have been met. Such rules generally require that products be approved or cleared by
the FDA as safe and effective for their intended use prior to being marketed.
PMA approval is based on a determination by FDA that the PMA contains sufficient valid scientific
evidence to assure that the device is safe and effective for its intended use(s). Many medical devices do not
require PMA approval by the FDA, but rather require 510(k) premarket clearance. For these devices, which
are usually deemed to pose a moderate risk to patients, in order to obtain marketing clearance, the applicant
must demonstrate that the device is as safe and effective or “substantially equivalent” to a legally marketed
“predicate” device. Moreover, FDA regulations also require prior approval or clearance for certain
modifications to a legally marketed device. In recent years, concerns have been raised that the 510(k)
process cannot adequately ensure that medical devices cleared for marketing are safe and effective. At the
same time, others have raised concerns that the 510(k) process and the FDA’s device premarket review
programs generally, are inefficient and unpredictable, and are stifling innovation. Since 2010, the FDA has
been evaluating and making improvements to its device premarket review programs, in particular the 510(k)
clearance process. The stated goal of these improvements is to achieve regulation that promotes both
safety/effectiveness and innovation. Substantially, all of the dialysis products that we manufacture or
distribute in the U.S., other than peritoneal dialysis solutions and renal pharmaceuticals, are mar keted on the
basis of 510(k) clearances. At the present time, regulatory and legislative changes to the 510(k) clearance
process continue to be proposed, and we cannot predict whether or to what extent the 510(k) process will be
significantly modified or what the effects, if any, of a modified review process for medical devices would be
on our dialysis products business.
If the FDA believes that a company is not in compliance with applicable laws and regulations, it can
pursue various regulatory and enforcement actions, including, for example, issuing a warning letter
mandating a recall, initiating seizure, or seeking injunction or consent decree. On September 15, 2010, the
FDA issued a warning letter to us citing several cGMP deficiencies, in response to which we have been
taking corrective action and are subject to re-inspections by the FDA. In any re-inspection the FDA is not
limited to reviewing only the processes and procedures that triggered the re-inspection. We are engaged in
ongoing remediation efforts and continued dialogue with the FDA regarding remediation.
On April 6, 2011 the FDA issued to us a warning letter alleging that we marketed certain blood tubing sets
without required premarket 510(k) clearance, in response to which we ceased marketing and distributing those
blood tubing sets that were the subject of a January 2011 recall. We received 510(k) clearance of the blood

36
tubing set product from the FDA on June 15, 2012 and subsequently recommenced marketing and distribution of
these products. In addition, we have completed a comprehensive review of our 510(k) filings and submitted our
findings to the FDA, and we continue to work with the FDA regarding effective submission strategies for certain
product lines.
On March 29, 2012, we issued an urgent product notification regarding our NaturaLyte® Liquid and
Granuflo® powder product lines. The notification cautioned clinicians that inappropriate prescription of these
dialysate products can lead to a high serum bicarbonate level in patients undergoing hemodialysis, which may
cause serious adverse health consequences, including death. The FDA classified our voluntary corrective action
as a Class I recall, which is the most serious type of recall and involves situations in which there is a reasonable
probability that use of these products will cause serious adverse health consequences or death. Wrongful death
and personal injury proceedings have been brought alleging various legal theories relating to these products,
including that inadequate labelling and warnings caused harm to patients. See Note 19 of the Notes to
Consolidated Financial Statements, “Commitments and Contingencies - Commercial Litigation” included in this
report.
On March 6, 2013, the FDA issued a warning letter following a two week inspection of the Ogden, Utah
facility. The warning letter alleges two violations of current Good Manufacturing Practice (cGMP)
requirements. First, the FDA asserts Fresenius Medical Care North America (“FMCNA”) did not conduct
adequate design verification studies related to electron beam (E-Beam) sterilized polysulfone dialyzers.
Second, the FDA alleges the corresponding design validation of these dialyzers is incomplete. FMCNA has
responded to these allegations and is actively working with the FDA to resolve any issues.
We cannot assure that all necessary regulatory clearances or approvals, including those for new products
or product improvements, will be granted on a timely basis, if at all. Delays in or failure to receive clearance
or approval, delays in or failures to carry out product recalls or corrective actions under warn ing letters or
other regulatory enforcement actions may materially adversely affect operating results.
International (Including Germany and Other Non-U.S)
The Company sells its dialysis products in over 120 countries. Most countries maintain different
regulatory regimes for medicinal products and for medical devices. In almost every country, there are rules
regarding the quality, effectiveness, and safety of products and regulating their testing, production, and
distribution. Treaties or other international law and standards and guidelines under treaties or laws may
supplement or supersede individual country regulations.
Pharmaceuticals. Some of our products, such as peritoneal dialysis solutions and PhosLo® and
Phoslyra®, are considered medicinal products and are, therefore subject to the specific drug law provisions in
the various countries. The European Union has issued a directive on medicinal products, No. 65/65/EWG
(January 26, 1965), as amended. Each member of the European Union is responsible for conforming its law
to comply with this directive. In Germany the German Drug Law (Arzneimittelgesetz) (“AMG”), which
implements European Union requirements, is the primary regulation applicable to medicinal products.
The provisions of the German Drug Law are comparable with the legal standards in other European
countries. As in many other countries, the AMG provides that a medicinal product may only be placed on the
market if it has been granted a corresponding marketing authorization. Such marketing authorizat ion is
granted by the licensing authorities only if the quality, efficacy and safety of the medicinal product has been
scientifically proven. Medicinal products marketed on the basis of a corresponding marketing authorization
are subject to ongoing control by the competent authorities. The marketing authorization may also be
subsequently restricted or made subject to specific requirements. It may be withdrawn or revoked if there
was a reason for the refusal of the marketing authorization upon its grant or such a reason arises
subsequently, or if the medicinal product is not an effective therapy or its therapeutic effect has been
insufficiently proven according to the relevant state of scientific knowledge. Such a reason for refusal is,
inter alia, found to exist if there is a well-founded suspicion that the medicinal product has not been
sufficiently examined in accordance with the current state of scientific knowledge, that the medicinal
product does not show the appropriate quality, or that the medicinal product, when properly used as
intended, produces detrimental effects going beyond the extent justifiable according to the current state of
knowledge of medicinal science. The marketing authorization can also be withdrawn or revoked in the case
of incorrect or incomplete information supplied in the authorization documents, if the quality checks
prescribed for the medicinal product were insufficient or have not been sufficiently carried out, or if the
withdrawal or revocation is required to comply with a decision made by the European Commission or the

37
Council of the European Union. Instead of a withdrawal or revocation, the suspension of the marketing
authorization may be ordered for a limited period.
The provisions of the AMG and a statutory order, Arzneimittel- und Wirkstoffherstellungsverordnung,
also contain special requirements for the manufacture of medicinal products. The production of medicinal
products requires a corresponding manufacturing license which is granted by the competent authorities of the
relevant Member State for a specific manufacturing facility and for specific medicinal products and forms of
medicinal products. The manufacturing license is granted only if the manufacturing facility, production
techniques and production processes comply with the national drug law requirements, with the principles and
guidelines of EU-good manufacturing practice (“EU-GMP”) as well as the terms of the particular marketing
authorization. A manufacturer of medicinal products must, inter alia, employ pharmacists , chemists,
biologists, or physicians responsible for the quality, safety and efficacy of the medicinal products. The
manufacturer must name several responsible persons: a Qualified Person (QP) for the release of the
medicinal product into the market possessing the expert knowledge specified by the AMG, a head of
production, a head of quality control, and, if the manufacturer markets the medicinal products itself, a
commissioner for the so-called graduated plan (Stufenplanbeauftragter for Germany, a Qualified Person for
Pharmacovigilance (QPP) for the European Union) and an information officer. It is the responsibility of the
QP to ensure that each batch of the medicinal products is produced and examined in compliance with the
statutory provisions of the AMG. The QPP must, among other things, collect and assess any reported risks
associated with the medicinal products and coordinate any necessary measures according to German Drug
Law. The QPP, residing within the European Economic Area, is responsible for pharmacovigilance and the
establishment of a system for handling of all suspected adverse reactions that need to be reported. The
information officer is in charge of the scientific information relating to the medicinal products. All these
persons may be held personally liable under German criminal law for any breach of the AMG.
International guidelines also govern the manufacture of medicinal products and, in many cases, overlap
with national requirements. Material regulations concerning manufacture and regist ration related to
medicinal products have been issued by the European Commission and the International Conference on
Harmonization of Technical Requirements for Human Use (“ICH”). In particular, the Pharmaceutical
Inspection Co-operation Scheme (“PIC/S”) an international treaty, contains rules binding many countries in
which medicinal products are manufactured. Among other things, the European Commission, PIC/S and ICH
establish requirements for GMP which are then adopted at the national level. Another inte rnational standard,
which is non-binding for medicinal products, is the ISO9001:2008 system for assuring quality management
system requirements. This system has a broader platform than EU-GMP, which is more detailed and is
primarily acknowledged outside the field of medicinal products, e.g., with respect to medical devices.
Medical Devices. In the past, medical devices were subject to less stringent regulation than medicinal
products in some countries. In the last decade, however, statutory requirements have been increased. In the
EU, the requirements to be satisfied by medical devices are laid down in three European directives to be
observed by all Member States and all Member States of the European Economic Area (“EEA”), as well as
all future accession states: (1) Directive 90/385/EEC of June 20, 1990 relating to active implantable medical
devices (“AIMDs”), as last amended (“AIMD Directive”), (2) Directive 93/42/EEC of June 14, 1993 relating
to medical devices, as last amended (“MD Directive”), and (3) Directive 98/79/EC of October 27, 1998
relating to in vitro diagnostic medical devices as last amended (“IVD Directive”). In addition, Directive
2001/95/EC of December 3, 2001, as last amended, concerning product safety should be noted. The MD
Directive, has been amended, 2007/47/EC, with the intention to achieve improvements, including in the
following areas: clinical assessment by specification of the requirements in more detail; monitoring of the
devices after their placing on the market; and decision making by enabling the Commission to make binding
decisions in case of contradictory opinions of states regarding the classification of a product as a medical
device. In the future, the industry will face increasing requirements for medical devices. In Septembe r 2012,
the first draft of a new regulation on medical devices was published by the European Commission. In
October 2013, this draft, supplemented by additional amendments, was voted on by the European Parliament
and subsequently published. It provided for further tightening of regulations for the manufacture of medical
devices, as it applies to both manufacturers and accredited organizations within the EU (“Notified Bodies”)
for assessing product standards. The final regulation is expected to replace the MD Directive by
approximately 2015.
According to the directives relating to medical devices, the CE mark (the abbreviation of Conformité
Européenne signifying that the device complies with all applicable requirements) shall serve as a general
product passport for all Member States of the EU and the EEA. Upon receipt of a CE certificate for a
product according to the applicable conformity assessment procedure, e.g. a certified full quality
management system for medical devices according to ISO13485:2012, and the documented declaration and

38
proof of conformity of our products to the harmonized European norms (Declaration of Conformity), we as
the legal manufacturer are able to mark products as being in compliance with the European Community
(“EC”) requirements. If able to do so, the manufacturer has to put a “CE” mark on the products. Medical
devices that do not bear the “CE” mark cannot be imported, sold or distributed within the EC.
The right to affix the CE mark is granted to any manufacturer who has observed the conformity
assessment procedure prescribed for the relevant medical device and submitted the EC declaration of
conformity before placing the medical device on the market. The conformity assessment procedures were
standardized by Council Decision 93/465/EEC of July 22, 1993, which established modules for the various
phases of the conformity assessment procedures intended to be used in the technical harmonization norms
and the rules for the affixing and use of the CE conformity mark. The conformity asses sment modules to be
used differ depending on the risk class of the medical device to be placed on the market. The classification
rules for medical devices are, as a general rule, based upon the potential risk of causing harm to the human
body. Annex IX to the MD Directive (making a distinction between four product classes I, IIa, IIb, and III)
and Annex II to the IVD Directive (including a list of the products from lists A and B) contain classification
criteria for products and product lists that are, in turn, assigned to specific conformity assessment modules.
AIMDs represent a product class of their own and are subject to the separate AIMD Directive. Special rules
apply, for example, to custom-made medical devices, medical devices manufactured in-house, medical
devices intended for clinical investigation or in vitro diagnostic medical devices intended for performance
evaluation, as well as for diagnostic medical devices for in-house use (“lay use”), combination devices and
accessories to medical devices.
The conformity assessment procedures for Class I devices with a low degree of invasiveness in the
human body (e.g. devices without a measuring function that are not subject to any sterilization
requirements), can be made under the sole responsibility of the manufacturer by submitting an EC
declaration of conformity (a self-certification or self-declaration). For Class IIa devices, the participation of
a Notified Body is mandatory for the production phase. Devices of classes IIb and III involving a high risk
potential are subject to inspection by the Notified Body not only in relation to their manufacture (as for class
IIa devices), but also in relation to their specifications and design. Class III is reserved for the most critical
devices the marketing of which is subject to an explicit prior authorization with regard to their conformity.
In risk categories IIa, IIb and III, the manufacturer can make use of several different conformity assessment
modules.
To maintain the high quality standards and performance of our operations, we have subjected our entire
European business to the most comprehensive procedural module, which is also the fastest way to launch a
new product in the European Union. This module requires the certification of a full quality management
system by a Notified Body charged with supervising the quality management system from design,
manufacture, and distribution, to after sales service.
Our Series 4008 dialysis machines and their therapy modifications, our 5008 dialysis machine and its
accessories and devices, our Sleep-safe cycler for automated PD treatment, the multiFiltrate system, and our
other active medical devices distributed in the European market, as well as our dialysis filters and dialysis
tubing systems and accessories, all bear the “CE” mark. We expect to continue to obtain additional
certificates for newly developed products or product groups.
Sales of Dialysis Products to Iran. The Company is committed to compliance with applicable export
control and economic sanctions laws and regulations and has in place comprehensive policies and
procedures in this regard. The Company has allocated significant resources to design, implement and
maintain a robust compliance program specific to the Company’s U.S. and non -U.S. activities. At the same
time, the Company’s dedication to providing its life-saving dialysis products to patients and sufferers of end-
stage renal disease extends worldwide, including conducting humanitarian-related business with distributors
in Iran in compliance with applicable law. In particular, the Company's product sales to Iran from Germany
are not subject to the EU’s restrictive measures against Iran established by EU Council Regulations No.
267/2012 of March 23, 2012 as last amended by the EU Council Regulation No. 42/2014 of January
20,2014, as the Company’s products sold to Iran do not fall within the scope of the EU sanctions and none of
the end users or any other person or organization involved is listed on the relevant EU sanctions lists.
Because the Company's sales to Iran were made solely by its German subsidiaries and do not involve
products of U.S. origin or incorporating U.S. content, the sales are not subject to the Iranian Transactions
and Sanctions Regulations, 31 C.F.R Part 560 (“ITSR”), and are not eligib le for licenses from the U.S.
Treasury Department's Office of Foreign Assets Control (“OFAC”) pursuant to the Trade Sanctions Reform
and Export Enhancement Act of 2000. Also, ITSR § 560.215(a) is not applicable in the present case because
the Company does not have a U.S. parent company and is not in any other way owned or controlled by a

39
United States person, and the Company’s affiliates involved in Iran-related transactions are not owned or
controlled by a United States person. That the Company has a U.S. subsidiary does not cause the ITSR to
apply to the Company’s Iran-related transactions (because the sales by the Company’s non-U.S. affiliates are
outside the scope of ITSR §560.215(a)). In any case, OFAC’s public guidance provides that sales of medical
devices to Iran by non-U.S. companies are generally subject to humanitarian exceptions under U.S. sanctions
targeting Iran.
During the year ended December 31, 2013, the Company sold approximately $11.2 million of dialysis
products to independent Iranian distributors and other foreign distributors for resale, processing and
assembling in Iran. The products included fibre bundles, hemodialysis concentrates, dialysis machines and
parts, and related disposable supplies. The sales of these products generated approximately $7.1 million in
operating income. During 2013, we also paid approximately $25 thousand in transportation costs for which
were mostly reimbursed by the distributors. All such sales were made by the Company's German
subsidiaries. Based on information available to the Company, the Company believes that most if not all
products were eventually sold to hospitals in Iran through state purchasing organizations affiliated with the
Iranian Ministry of Health and were therefore sales to the "Government of Iran" as defined in ITSR §
560.304. In addition, during 2013, the Company received payments totalling €4.8 million for dialysis
machines, spare parts and related disposable supplies sold to Iranian customers in 2010. The approval and
notification procedures with the German Federal Central Bank (Deutsche Bundesbank) for receiving the
payments under European Union sanctions law are conducted by the Company's German banks in close
coordination with the Company. The Company’s 2013 sales to Iran represent 0.10% of its total revenues.
The Company has no subsidiaries, affiliates or offices, nor does it have any direct investment or own any
assets, in Iran. In light of the humanitarian nature of its products and the patient communities that benefit
from our products, the Company expects to continue selling dialysis products to Iran, provided such sales
continue to be permissible under applicable export control and economic sanctions laws and regulations.
Environmental Regulation
We are subject to a broad range of federal, foreign, state and local laws and regulations relating to
pollution and the protection of the environment. These laws regulate, among other things, the discharge of
materials into the environment, the handling and disposal of wastes, remediation of contaminated sites and
other matters relating to worker and consumer health, and safety and to the protection of the environment. In
addition, the Company uses substances regulated under U.S. and European environmental laws, primarily in
manufacturing and sterilization processes. Noncompliance with these regulations can result in significant
fines or penalties or limitations on our operations. The applicable environmental, health and safety laws and
regulations, and any changes to them or their enforcement, may require us to make material expenditures
with respect to ongoing compliance with or remediation under these laws and regulations or require that we
modify our products or processes in a manner that increases our costs or reduces revenues. While it is
difficult to quantify, we believe the ongoing impact of compliance with environmental protection laws, rules
and regulations will not have a material impact on the Company’s financial position or results of operations.
An Environmental Management System (“EMS”) based on ISO 14001:2004 has been established in our
main European production plants and in a high number of dialysis clinics in the European region.
Compliance with environmental laws and regulations is a core objective of our EMS. Internal and externa l
audits are organized and performed to verify compliance with the EMS requirements and applicable
environmental laws and regulations.
Facilities and Operational Regulation
U.S.
Federal, state and local regulations (implemented by CMS, FDA, the Occupational Health and Safety
Administration (“OSHA”), the Drug Enforcement Administration, and state departments or boards of public health,
public welfare, medicine, nursing, pharmacy, and medical assistance, among others) require us to meet various
standards relating to, among other things, the management, licensing, safety, security and operation of facilities
(including, e.g., laboratories, pharmacies, and clinics), personnel qualifications and licensing, the maintenance
of proper records, equipment, and quality assurance programs, and the dispensing, storage, and administration
of controlled substances. All of our operations in the U.S. are subject to periodic inspection by federal, state and
local agencies to determine if the operations, premises, equipment, personnel and patient care meet app licable
standards. To receive Medicare/Medicaid reimbursement, our dialysis clinics, vascular access centers, renal
diagnostic support business and laboratories must be certified by CMS. While all of our entities that furnish
Medicare or Medicaid services maintain and renew the required certifications, it is possible that any such

40
entity could lose or be delayed in renewing a certification, which could have a material adverse effect on our
business, financial condition, and results of operations.
Certain of our facilities and certain employees are also subject to state licensing statutes and regulations.
These statutes and regulations are in addition to federal and state rules and standards that must be met to qualify
for payments under Medicare, Medicaid and other government reimbursement programs. Licenses and approvals
to operate these centers and conduct certain professional activities are customarily subject to periodic renewal
and to revocation upon failure to comply with the conditions under which they were granted.
The Clinical Laboratory Improvement Amendments of 1988 (“CLIA”) subjects virtually all clinical
laboratory testing facilities, including ours, to the jurisdiction of the Department of Health and Human Services
(“HHS”). CLIA establishes national standards for assuring the quality of laboratories based upon the complexity of
testing performed by a laboratory. Certain of our operations are also subject to federal laws governing the
repackaging and dispensing of drugs and the maintenance and tracking of certain life sustaining and life-supporting
equipment.
Our operations are subject to various U.S. Department of Transportation, Nuclear Regulatory Commission,
Environmental Protection Agency, and OSHA requirements and other federal, state and local hazardous and
medical waste disposal laws. As currently in effect, laws governing the disposal of hazardous waste do not
classify most of the waste produced in connection with the provision of dialysis, or laboratory services as
hazardous, although disposal of nonhazardous medical waste is subject to specific state regulation. Our operations
are also subject to various air emission and wastewater discharge regulations.
OSHA regulations require employers to provide employees who work with blood or other potentially
infectious materials with prescribed protections against blood-borne and air-borne pathogens. These regulatory
requirements apply to all healthcare facilities, including dialysis clinics, vascular access centers and laboratories,
and require employers to make a determination as to which employees may be exposed to blood or other potentially
infectious materials and to have in effect a written exposure control plan. In addition, employers are required to
provide hepatitis B vaccinations, personal protective equipment, blood-borne pathogens training, post-exposure
evaluation and follow-up, waste disposal techniques and procedures, engineering and work practice controls and
other OSHA-mandated programs for blood-borne and air-borne pathogens.
Some states in which we operate have certificate of need (“CON”) laws that require any person or entity
seeking to establish a new healthcare service or to expand an existing service to apply for and receive an
administrative determination that the service is needed. Several states in which we operate, as well as the District
of Columbia and Puerto Rico have CON laws applicable to dialysis clinics and vascular access centers. These
requirements could, as a result of a state’s internal determination of its dialysis service needs, prevent entry to new
companies seeking to provide services in these states, and could constrain our ability to expand our operations
in these states.
International (Including Germany and Other Non-U.S.)
Most countries outside of the U.S. regulate operating conditions of dialysis clinics and hospitals and the
manufacturing of dialysis products, medicinal products and medical devices.
We are subject to a broad spectrum of regulation in almost all countries. Our operations must comply
with various environmental and transportation regulations in the various countries in which we operate.
Our manufacturing facilities and dialysis clinics are also subject to various standards relating to, among other
things, facilities, management, personnel qualifications and licensing, maintenance of proper records, equipment,
quality assurance programs, the operation of pharmacies, the protection of workers from blood-borne diseases
and the dispensing of controlled substances. All of our operations may be subject to periodic inspection
by various governmental authorities to determine if the operations, premises, equipment, personnel and
patient care meet applicable standards. Our dialysis clinic operations and our related activities generally require
licenses, which may be subject to periodic renewal and may be revoked for violation of applicable regulatory
requirements.
In addition, many countries impose various investment restrictions on foreign companies. For instance,
government approval may be required to enter into a joint venture with a local partner. Some countries do not
permit foreign investors to own a majority interest in local companies or require that companies organized under
their laws have at least one local shareholder. Investment restrictions therefore affect the corporate structure,
operating procedures and other characteristics of our subsidiaries and joint ventures in these and other
countries.
We believe our facilities are currently in compliance in all material respects with the applicable national
and local requirements in the jurisdictions in which they operate.

41
Reimbursement
As a global company delivering dialysis care and dialysis products, we are represented in more than 120
countries worldwide. Consequently, we face the challenge of addressing the needs of a wide variety of
stakeholders, such as patients, customers and payors in very different economic environments and healthcare
systems.
Healthcare systems and reimbursement structures for ESRD treatment vary significantly by country. In
general, the government (in some countries in coordination with private insurers) or social insurance programs
pay for health care and finances their payments through taxes and other sources of government income, from
social security contributions, or a combination of those sources. However, not all healthcare systems provide for
dialysis treatment. In some developing countries, only limited subsidies from government, social insurances or
charitable institutions are available, and dialysis patients must finance all or substantially all of the cost of their
treatment out of pocket. Irrespective of the funding structure, in some countries patients in need of dialysis do not
receive treatment on a regular basis but rather when the financial resources allow it.
U.S.
Dialysis Services. Our dialysis clinics provide outpatient hemodialysis treatment and related services for
ESRD patients. In addition, some of the Company’s clinics offer services for the provision of peritoneal dialysis
and hemodialysis treatment at home, and dialysis for hospitalized patients.
The Medicare and Medicaid programs are the largest single source of dialysis services revenues from dialysis
treatment. Approximately 53% of North America Segment dialysis services revenues for 2013 (amounting to 32%
of our worldwide revenue) were for services rendered patients covered by Medicare’s ESRD program and
Medicaid. In order to be eligible for reimbursement by Medicare, ESRD facilities must meet conditions for
coverage established by CMS.
Medicare pays as the primary insurer for Medicare-eligible individuals under some circumstances. For
details, see “— Coordination of Benefits” below. For Medicare-primary patients, Medicare pays 80% of the
prospective payment amount for the ESRD PPS items and services. The beneficiary or third-party insurance
payors (including employer-sponsored health insurance plans, commercial insurance carriers and the Medicaid
program) on behalf of the beneficiary are responsible for paying the beneficiary’s cost-sharing obligations
(typically the annual deductible and 20% co-insurance), subject to the specific coverage policies of such payors.
Each third-party payor, including Medicaid, makes payment under contractual or regulatory reimbursement
provisions that may or may not cover the full 20% co-payment or annual deductible. Where the beneficiary has
no third-party insurance or the third-party insurance does not fully cover the co-payment or deductible, the
beneficiary is responsible for paying the co-payments or the deductible, which we frequently cannot fully collect
despite collection efforts. In some states, Medicaid does not fully cover the cost-sharing obligations of Medicare-
Medicaid dually eligible individuals, and we are precluded from collecting directly from these beneficiaries.
Under an advisory opinion from the Office of the Inspector General of the Department of Health and Human
Services, subject to specified conditions, we and other similarly situated providers may make contributions to a
non-profit organization that has created a program to subsidize premium payments for supplemental medical
insurance and/or “Medigap” insurance on behalf of indigent ESRD patients, including some of our patients.
Vascular Care. Dialysis requires access to the bloodstream, which is accomplished by catheters, grafts, or
arteriovenious fistulas. Fresenius Vascular Care, Inc. (“FVC”) owns and/or manages a number of vascular access
centers located in the U.S., which provide interventional services for the maintenance of ESRD patients’
vascular access. Maintaining the patency of a patient’s vascular access is an ongoing challenge and may
occasionally require arthroplasty or other interventional services. In addition, the vascular access centers provide
services to address peripheral artery disease, which is common in dialysis patients. For Medicare patients, who
comprise the largest patient group served by FVC, these services are paid under Medicare’s physician fee
schedule. CMS, usually acting in response to recommendations from the American Medical Association’s
Relative Value Scale Update Committee, may revise the relative value units (a measure of the cost, complexity
and risk of providing a specific healthcare service) and hence the payment rates of services paid under this fee
schedule. In addition, all payment amounts under this fee schedule are subject to updates determined in part by
the Medicare program sustainable growth rate (“SGR”) provision. The SGR seeks to limit annual increases in
Medicare program costs to no more than the annual increase in the nation's gross domestic product.
Medicaid Rebate Program and Other Government Drug Pricing Program Requirements. Manufacturers of
certain drugs that are covered by the Medicaid program or that are reimbursed by the Medicare program are
subject to various price determination and reporting requirements under federal statutes, including the Medicaid
and Medicare statutes as well as the Public Health Service Act (“PHSA”) and the Veterans Health Care Act

42
(“VHCA”). Compliance with the Medicaid rebate statute, the VHCA, the Medicare statute, and Section 340B of
the PHSA requires us to calculate and/or report a number of different pricing metrics (e.g., Average
Manufacturer Price (“AMP”), Best Price (“BP”), Average Sales Price (“ASP”), Federal Ceiling Price (“FCP”),
non-federal average manufacturer price (“Non-FAMP”), and 340B ceiling price) to federal authorities
responsible for monitoring and enforcing drug manufacturer compliance with federal law and policy.
We participate in the federal Medicaid rebate program established by the Omnibus Budget Reconciliation
Act of 1990, as well as several state supplemental rebate programs. We make our pharmaceutical products
available to authorized users of the Federal Supply Schedule (“FSS”) of the General Services Administration
under an FSS contract negotiated by the department of Veterans Affairs (“VA”). Under our license to market and
distribute the IV Iron medication Venofer® to freestanding dialysis clinics, we also are considered, for statutory
price reporting purposes, to be the manufacturer of Venofer® (when sold by us under one of our national drug
codes (“NDCs”)), which is reimbursed under Part B of the Medicare program. Our products also are subject to a
federal requirement that any company participating in the Medicaid rebate or Medicare program extend
discounts comparable to the rebates paid to State Medicaid agencies to qualified purchasers under the Public
Health Services (“PHS”) pharmaceutical pricing program managed by HHS (also known as the “340B program”
by virtue of the section of the PHSA that created the program). The PHS pricing program extends these deep
discounts on drugs to a variety of community health clinics and other entities that receive health services grants
from the PHS, as well as hospitals that serve a disproportionate share of poor Medicare and Medicaid
beneficiaries. ACA expanded the 340B program to include additional providers.
Under the Medicaid rebate program, we pay a rebate to each state Medicaid program based upon sales of our
covered outpatient drugs that are separately reimbursed by those programs. The ACA increased the minimum
federal Medicare rebate percentages, effective January 1, 2010. Rebate calculations are complex and, in certain
respects, subject to interpretations of law, regulation, or policy guidance by us, government or regulatory
agencies and the courts. The Medicaid rebate amount is computed each quarter based on our submission to CMS
of our current AMP and BP for our pharmaceutical products. The VHCA imposes a requirement that the prices
we charge to certain federal entities under the FSS must be no greater than the FCP, which is determined by
applying a statutory discount to the non-FAMP charged to non-federal customers. Because the amount the
government pays to reimburse the cost of a drug under Part B of the Medicare program is ordinarily based on the
drug’s ASP, additional price calculation and reporting obligations are imposed on the manufacturers of Part B
drugs under that program. Since Venofer® is a Part B drug (i.e., one ordinarily administered incident to a
physician service), we are responsible for compiling and utilizing a wide range of sales data elements to
determine the ASP of Venofer® marketed under our NDC, and reporting it to CMS. We are subject to specific
ASP reporting obligations with respect to our Venofer® sales under a consent order issued by the Federal Trade
Commission in October 2008 in connection with establishment of our licensing and distribution arrangements
with Galenica and Luitpold (File No. 081-0146) described under “Business Overview – Dialysis Products –
Renal Pharmaceuticals.” The Medicare ESRD PPS system incorporated payment for Venofer® at most dialysis
facilities starting January 1, 2011. Because a small fraction of dialysis facilities elected a four-year transition to
the new system, Medicare paid separately for a gradually diminishing proportion of the use of the drug in these
facilities until December 31, 2013.
Government agencies may make changes in program interpretations, requirements or conditions of
participation, and retain the right to audit the accuracy of our computations of rebates and pricing, some of which
may result in implications (such as recoupment) for amounts previously estimated or paid which may have a
material adverse effect on the Company’s revenues, profitability and financial condition.
Laboratory Tests. Spectra obtains a portion of its net revenue from Medicare, which pays for clinical
laboratory services provided to dialysis patients in two ways.
First, payment for most tests is included in the ESRD PPS bundled rate paid to dialysis centers. The centers
obtain the laboratory services from laboratories and pay the laboratories for the services. In accordance with industry
practice, Spectra usually provides such testing services under capitation agreements with its customers pursuant
to which it bills a fixed amount per patient per month to cover the laboratory tests included in the ESRD PPS
rate at the frequencies designated in the capitation agreement.
Second, the few laboratory tests performed by Spectra for Medicare beneficiaries that are not included in the
ESRD PPS bundled rate are billed separately to Medicare. Such tests are paid at 100% of the Medicare clinical
laboratory fee schedule amounts, which vary across different geographic areas but which cannot exceed national
ceilings on payment rates, called national limitation amounts (“NLAs”). Medicare updates the payment rates to
reflect inflation by the change in consumer price index, subject to certain reductions. The ACA imposed a 1.75
percentage point reduction from the rate of change in the consumer price index for calendar years 2011 to 2015

43
together with a “productivity adjustment,” expected to be slightly above 1 percentage point, applicable
(with some restrictions) for years starting with 2011. In addition, the Middle Class Tax Relief and Job Creation
Act of 2012 rebased payment amounts under the clinical laboratory fee schedule, reducing them by two percent
effective January 1, 2013, and the sequester resulting from the Budget Control Act of 2011 produced an
additional cut of two percent effective April 1, 2013.
Erythropoietin stimulating agents. ESAs, including Epogen®, and Aranesp® are used for anemia
management of patients with renal disease. ESAs are included in the bundled payment under the ESRD PPS.
The amount of ESA that is appropriate for a patient varies by several factors, including the severity of the
patient’s anemia and the patient’s clinical response to the ESA. Anemia severity is commonly monitored by
measuring a patient’s hematocrit, an indicator of the proportion of red blood cells in a patient’s whole blood, or
by evaluating a patient’s hemoglobin level. Until recently, product labels for ESAs recommended dosing to
achieve and maintain hemoglobin levels within the range of 10 to 12 grams/deciliter (g/dl) in patients with
ESRD. In 2011 the FDA recommended more conservative dosing guidelines for ESAs, including EPO, when
used to achieve a normal or nearly normal hemoglobin level in ESRD patients, due to the increased risks of
cardiovascular events such as stroke, thrombosis and death. The recommendation is to initiate ESA treatment
when the patient’s hemoglobin level is less than 10 g/dcl and reduce or interrupt the dose of ESA if the patient’s
hemoglobin level approaches or exceeds 11 g/dcl. The recommendation, which was added to the “black-box”
warning on ESA packages and the package insert, states that for each patient, therapy should be individualized,
using the lowest ESA dose possible to reduce the need for red blood cell transfusions.
Any of the following changes relating to ESAs could adversely affect our business, and results of operations,
possibly materially:
an interruption in the supply of ESAs;
material increases in utilization or the cost of ESAs without offsetting increases in the
ESRD PPS reimbursement rate; or
reduction by the manufacturer of ESAs of the amount of overfill in the ESA vials.
Medicare’s ESRD Prospective Payment System. With the enactment of the Medicare Improvements for
Patients and Providers Act of 2008 (“MIPPA”), Congress mandated the development of an expanded ESRD
bundled payment system for services furnished on or after January 1, 2011. Under the ESRD PPS, CMS
reimburses dialysis facilities with a single payment for each dialysis treatment, inclusive of (i) all items and
services included in the former composite rate, (ii) oral vitamin D analogues, oral levocarnitine (an amino acid
derivative) and all ESAs and other pharmaceuticals (other than vaccines) furnished to ESRD patients that were
previously reimbursed separately under Part B of the Medicare program, (iii) most diagnostic laboratory tests
and (iv) certain other items and services furnished to individuals for the treatment of ESRD. ESRD-related drugs
with only an oral form, including PhosLo®, are expected to be reimbursed under the ESRD PPS starting in
January 2016 with an adjusted payment amount to be determined by the Secretary of Health and Human Services
to reflect the additional cost to dialysis facilities of providing these medications. The base ESRD PPS payment is
subject to case mix adjustments that take into account individual patient characteristics (e.g., age, body surface
area, body mass, time on dialysis) and certain co-morbidities. The base payment is also adjusted for (i) certain
high cost patient outliers due to unusual variations in medically necessary care, (ii) disparately high costs
incurred by low volume facilities relative to other facilities, (iii) provision of home dialysis training and (iv)
wage-related costs in the geographic area in which the provider is located.
The ESRD PPS payment amounts are subject to annual adjustment based on increases in the costs of a
“market basket” of certain healthcare items and services less a productivity adjustment. On November 22,
2013, CMS issued the final rule regarding the 2014 ESRD PPS rate pursuant to which the base rate was reduced
from $240.36 to $239.02 for 2014. This change reflects (a) an increase in the ESRD bundled market basket of
3.2%, reduced by an estimated multifactor productivity adjustment of 0.4%; (b) the application of a wage index
budget neutrality factor and a home dialysis training add-on budget neutrality factor; and (c) the application of a
portion ($8.16) of an overall reduction in reimbursement under the ESRD PPS mandated by the American
Taxpayer Relief Act of 2012 (“American Taxpayer Relief” or “ATRA”) to account for a decrease in the
historical utilization of certain ESRD-related drugs and biologicals from 2007 to 2012.See “—Budget Control
Act and American Taxpayer Relief Act” below.
In addition, payments to Medicare providers, including dialysis facilities and vascular access centers, are
subject to automatic across-the-board spending cuts, or sequestration, for years 2013 to 2023, pursuant to the
Budget Control Act of 2011, as amended by the Bipartisan Budget Act of 2013, unless Congress changes the

44
law. For Medicare, sequestration is limited to two percent of Medicare’s payments, except in FY 2023 when the
cap will be raised to 2.9 percent for the first half of the year and lowered to 1.11 percent for the second half of
the year.
The ESRD PPS’s quality incentive program (“QIP”), initially focusing on anemia management and
dialysis adequacy, began affecting payments for dialysis services in 2012. Dialysis facilities that fail to
achieve the established quality standards have payments for a particular year reduced by up to 2 percent,
based on a year’s performance. In the November 2011 final rule, CMS established the quality measures for
payment year 2013, which focus on anemia management and dialysis adequacy. For the 2014 payment year,
CMS has adopted four additional measures to determine whether dialysis patients are receiving high quality care.
The new measures include (i) prevalence of catheter and A/V fistula use; (ii) reporting of infections to the
Centers for Disease Control and Prevention; (iii) administration of patient satisfaction surveys; and (iv) monthly
monitoring of phosphorus and calcium levels. The 2014 QIP payment adjustment will be based on performance
in 2012. For payment year 2015, CMS has continued all of the 2014 QIP measures except URR dialysis
adequacy, expanded the scope of infection reporting and mineral metabolism reporting, and added four new
measures. Payment year 2015 measures consist of three new clinical measures (hemodialysis adequacy (adult
patients), hemodialysis adequacy (pediatric patients) and peritoneal dialysis adequacy), and one new reporting
measure (anemia management reporting). For payment year 2016, CMS has continued all of the 2015 QIP
measures and added two new clinical measures (proportion of patients with hypercalcemia and dialysis-related
infections reported to the Center for Disease Control and Prevention’s National Health Safety Network by
ESRD facilities treatment patients on an in-center basis).
The ESRD PPS resulted in a lower Medicare reimbursement rate on average as a result of the above
measures by CMS, at nearly all of our U.S. dialysis facilities that elected to be fully subject to the ESRD PPS
starting on January 1, 2011. We mitigated the impact of the ESRD PPS with two broad measures. First, we
worked with medical directors and treating physicians to make clinical protocol changes used in treating
patients consistent with the QIP and good clinical practices, and we negotiated pharmaceutical acquisition
cost savings. In addition, we have achieved greater efficiencies and better patient outcomes by introducing
new initiatives to improve patient care upon initiation of dialysis, increase the percentage of patients using
home therapies and achieve additional cost reductions in our clinics. For information regarding the impact of
ESRD PPS and the above implementation plan on our business, see the discussion of our North America
Segment in Item 5, “Operating and Financial Review and Prospects – Financial Condition and Results of
Operations.”
Any significant decreases in Medicare reimbursement rates could have material adverse effects on our
provider business and, because the demand for products is affected by Medicare reimbursement, on our products
business. To the extent that increases in operating costs that are affected by inflation, such as labor and supply
costs, are not fully reflected in a compensating increase in reimbursement rates, our business and results of
operations may be adversely affected.
On February 4, 2013, CMS announced plans to test a new Comprehensive ESRD Care Model and issued a
solicitation for applications. CMS initially proposed to work with up to 15 healthcare provider groups comprised
of dialysis clinics and nephrologists, also known as ESRD Seamless Care Organizations (“ESCOs”), to test a
new system of payment and care delivery that seeks to deliver better health outcomes for ESRD patients while
lowering CMS’s costs. ESCOs that achieve the program’s minimum quality thresholds and generate reductions
in CMS’s cost of care above certain thresholds for the ESRD patients covered by the ESCO will receive a share
of the cost savings. ESCOs that include dialysis chains with more than 200 facilities are required to share in the
risk of cost increases and reimburse CMS a share of any such increases. Organizations must apply and be
approved by CMS to participate in the program. In August 2013, we submitted an application to participate in
the program as an ESCO. Following submission of our application, CMS announced that it would suspend
review of all applications and reopen its request for application in the winter of 2014 to solicit additional
participation and respond to stakeholder feedback. At such time, we will review CMS’ revisions and determine
whether to apply to the revised program.
Effective February 15, 2011, the Department of Veterans Affairs (“VA”) adopted payment rules which reduced
its payment rates for non-contracted dialysis services to coincide with those of the Medicare program. As a result
of the enactment of these new rules, we have experienced variability in our aggregated VA reimbursement rates
for contracted and non-contracted services. In addition, we may also experience reductions in the volume of VA
patients treated in our facilities.
45
Coordination of Benefits. Medicare entitlement begins for most patients at least three months after the
initiation of chronic dialysis treatment at a dialysis center. During the first three months, considered to be a
waiting period, the patient or patient’s insurance, Medicaid or a state renal program is generally responsible for
payment.
Patients who are covered by Medicare and are also covered by an employer group health plan (“EGHP”) are
subject to a 30-month coordination period during which the EGHP is the primary payor and Medicare the
secondary payor. During this coordination period the EGHP pays a negotiated rate or in the absence of such a
rate, our standard rate or a rate defined by its plan documents. The EGHP payments are generally higher than the
Medicare payment. EGHP insurance, when available, will therefore generally cover as the primary payor a total
of 33 months, the 3-month waiting period plus the 30-month coordination period. Any significant decreases in
EGHP reimbursement rates could have material adverse effects on our provider business and, because the
demand for products is affected by provider reimbursement, on our products business.
Budget Control Act and American Taxpayer Relief Act. On August 2, 2011, the U.S. Budget Control Act
of 2011 (‘‘Budget Control Act’’) was enacted, raising the U.S.’s debt ceiling and putting into effect a series of
actions for deficit reduction. Automatic across-the-board spending cuts over nine fiscal years (2013-2021),
projected to total $1.2 trillion for all Federal government programs, were scheduled to go into effect on
January 2, 2013. Pursuant to the American Taxpayer Relief Act, which was enacted on January 3, 2013, these
reductions went into effect on March 1, 2013. These reductions would be limited to one adjustment of no more
than two percent through 2021. Reductions to Medicare payments under Budget Control Act’s cuts are
independent of annual inflation update mechanisms, such as the market basket update pursuant to the ESRD
PPS. In addition to delaying the Budget Control Act’s automatic spending reductions for several months, the
American Taxpayer Relief Act also directed CMS to reduce the ESRD PPS payment rate, effective January 1,
2014, to account for changes in the utilization of certain drugs and biologicals that are included in the ESRD
PPS. In making such reduction, the law requires CMS to use the most recently available pricing data for such
drugs and biologicals. On November 22, 2013, CMS issued the final rule regarding the 2014 ESRD PPS rate.
The base rate per treatment was reduced from $240.36 to $239.02 for 2014. This change reflects (a) an increase
in the ESRD bundled market basket of 3.2%, reduced by an estimated multifactor productivity adjustment of
0.4%; (b) the application of a wage index budget neutrality factor and a home dialysis training add-on budget
neutrality factor; and (c) the application of a portion ($8.16) per treatment of a reduction in reimbursement to
account for a decrease in the historical utilization of certain ESRD-related drugs and biologicals from 2007 to
2012. As set forth in the November 2013 final rule, CMS will phase in the ATRA reduction, which CMS
estimates will total $29.93 per treatment, over three to four years. CMS intends that the portion of the drug
utilization adjustment mandated by ATRA that will be applied in 2014 and 2015 will largely offset the net
market basket increases in average payments to ESRD facilities, resulting in essentially unchanged
reimbursement rates from 2013 to 2015. In 2016, CMS will re-evaluate whether to apply the balance of the drug
utilization adjustment mandated by ATRA over the subsequent one or two years.
Possible future legislation. In the current legislative environment, increases in government spending may
need to be accompanied by corresponding offsets. For example, the Budget Control Act did not address
reductions in physician payments mandated by the sustainable growth rate (“SGR”). The Middle Class Tax
Relief and Job Creation Act of 2012 delayed implementation of these reductions until December 31, 2012 and
the American Taxpayer Relief Act further delayed them until December 31, 2013. A cut of approximately 20.1
percent in physician fees will ensue unless Congress acts, as it has in the past, to prevent it. In order to reduce or
eliminate SGR physician payment reductions and not adversely affect deficit reduction, Congress would have to
reduce other spending (or raise revenues). In addition, budget and debt ceiling deliberations may result in further
reductions in spending. We cannot predict whether other reductions in Medicare or Medicaid spending would be
required.
Possible Changes in Statutes or Regulations. Further legislation or regulations may be enacted in the future that
could substantially modify or reduce the amounts paid for services and products offered by us and our subsidiaries.
It is also possible that statutes may be adopted or regulations may be promulgated in the future that impose
additional eligibility requirements for participation in the federal and state healthcare programs. Such new
legislation or regulations could, depending upon the detail of the provisions, have positive or adverse effects,
possibly material, on our businesses and results of operations. See “Risk Factors — Risks Relating to Litigation and
Regulatory Matters — Proposals for healthcare reform could decrease our revenues and operating profit,” and “—
Healthcare Reform” below.

46
International (Including Germany and Other Non-U.S.)
As a global company delivering dialysis care and dialysis products in more than 120 countries worldwide, we
face the challenge of addressing the needs of dialysis patients and customers in widely varying economic and
healthcare environments.
In the major European and British Commonwealth countries, healthcare systems are generally based on one
of two funding models. The “Bismarck system”, is based on mandatory employer and employee contributions
dedicated to healthcare financing. The “Beveridge system”, provides a national healthcare system financed by taxes.
The healthcare systems of countries such as Germany, Japan, France, Belgium, Austria, Czech Republic, Poland,
Hungary, Turkey and the Netherlands are based on the Bismarck-type system. Countries such as the United Kingdom,
Canada, Denmark, Finland, Portugal, Sweden and Italy established their national health services using the Beveridge-
type system. For information on the distribution of clinic ownership in various countries in which we operate, see
“Renal Industry Overview — Dialysis Treatment Options for ESRD,” above. However, during the last decade,
healthcare financing under many social security systems has also been significantly subsidized with tax money.
In Asia-Pacific, tax-based funding is available in Australia, New Zealand, Hong Kong, Macau, Malaysia,
South Korea, Taiwan and Thailand. Japan and the Philippines run a Bismarck-style system. Singaporeans
contribute to a mandatory medical savings plan that can be used to cover hospital costs and may receive a limited
amount of tax-based subsidies to cover catastrophic illnesses. China aims for universal coverage by 2020 by
enrolling patients in various mixed social insurance and taxation-based schemes. Most other countries provide
little or no funding for ESRD patients.
Remuneration for ESRD treatment widely differs between countries. There are three main types of
reimbursement modalities: national budget allocation, reimbursement based on fee-for-service and a flat periodic
rate. In some cases, the reimbursement modalities also vary within the same country depending on the type of
healthcare provider (public or private). Budget allocation is a reimbursement modality used mainly for public
providers in most of the European countries where the funding is based on taxation and in some of the countries
where it is based on social security. Fee for service is still the most common reimbursement modality for
private providers in all European and Asia-Pacific countries (with exceptions, such as Germany, where
reimbursement to private providers is based on a weekly flat rate) and for public providers in countries where
the funding system is based on social security payments.
Treatment components included in the base reimbursement rate may vary from country-to-country or even
within countries, depending on the structure and cost allocation principles. In the highly integrated reimbursement
models for dialysis, also often referred to as “bundled” reimbursement, (applicable e.g., in Portugal, Ukraine, Taiwan and
South Korea) the dialysis reimbursement rate covers all — or almost all — treatment-related components, including
the dialysis session, laboratory services and ESAs. Under such reimbursement models, the amount of
reimbursement can depend on the fulfilment of specified treatment results and quality control parameters by the
dialysis services that are provided. In such systems, the therapeutic goals include, among others, the adequacy of
dialysis, targets for haemoglobin levels, bone metabolism status, water quality as well as outcome measures such as
mortality rate and hospitalization days. Countries with a relatively low integration of the treatment components in the
base reimbursement (such as the Czech Republic, the United Kingdom and Germany) dedicate correspondently diverse
additional payments for other services rendered to dialysis patients arising from different budgets (or payment
streams), depending on the national healthcare regulations.
Where treatment is reimbursed on a fee-for-service basis, reimbursement rates are sometimes allocated in
accordance with the type of treatment performed. We believe that it is difficult to judge reimbursement based
on an average global reimbursement amount because the services and costs for which reimbursement is provided in
any such average global amount would likely bear little relation to the actual reimbursement system in any one
country. Generally, in European countries with established dialysis programs, reimbursements range from $100 to
more than $300 per treatment. In Asia-Pacific, reimbursement rates can be significantly lower. However, a comparison
from country to country would not be meaningful if made in the absence of a detailed analysis of the cost components
reimbursed, services rendered and the structure of the dialysis clinic in each country being compared.
Healthcare expenditures are consuming an ever-increasing portion of gross domestic product worldwide. In
the developed economies of Europe, Asia and Latin America, healthcare spending is in the range of 5%-15% of
gross domestic product. In many countries, dialysis costs consume a disproportionately high portion of the
healthcare budget. In South Korea and Japan, patients contribute co-payments of up to 10 percent of the treatment
costs unless they live below the poverty line. Other countries, such as Hong Kong and Thailand, have adopted
“Peritoneal Dialysis First” policies to reduce dialysis treatment costs. In times of increasing financial constraints,

47
e.g., the current Eurozone financial crisis, these costs among others may be considered a target for implementation
of cost containment measures.
However, past experiences have shown that legislators are often willing to combine austerity measure with a
healthcare regulation reform. This offers significant chances for industrialized integrated medical service providers
to take up more responsibilities in the care cycle towards outcome-based reimbursement models.
Today, there is increasing awareness of the correlation between the quality of care delivered in the dialysis
unit and the total healthcare expenses incurred by the dialysis patient. Accordingly, developments in
reimbursement policies might include higher reimbursement rates for practices which are believed to improve the
overall state of health of the ESRD patient and reduce the need for additional medical treatment, thereby
reducing overall healthcare costs for dialysis patients. There can be no assurance, however, that any such
reimbursement will be adopted.
Anti-Kickback Statutes, False Claims Act, Health Insurance Portability and Accountability Act of 1996,
Civil Monetary Penalties Law, Stark Law and Other Fraud and Abuse Laws in the United States
Some of our operations are subject to federal and state statutes and regulations governing financial
relationships between healthcare providers and potential referral sources and reimbursement for services and
items provided to Medicare and Medicaid patients. Such laws include the Anti-Kickback Statute, the False
Claims Act, the Stark Law, and other federal healthcare fraud and abuse laws and similar state laws.
The U.S. Government, many individual states and private third-party risk insurers have devoted increasing
resources to combat fraud, waste, and abuse in the healthcare sector. The Office of the Inspector General of HHS
(“OIG”), state Medicaid fraud control units, and other enforcement agencies have dedicated substantial resources
to their efforts to detect agreements between physicians and service providers that may violate fraud and abuse
laws. In its most recent Work Plan for Fiscal Year 2014, the OIG has scheduled an ESRD-related review on: (i)
Medicare payments for and utilization of renal dialysis services and related drugs under the ESRD PPS to
determine how the acquisition costs for certain drugs have changed in comparison to inflation-adjusted
government estimates and (ii) the extent, nature, and outcomes of Medicare’s survey and certification process of
dialysis facilities and whether the survey process falls short in identifying poorly performing facilities.
Recent health reform legislation has also enhanced the government’s ability to pursue actions against
potential violators, by expanding the government’s investigative authority, expanding criminal and
administrative penalties, by increasing funding for enforcement and providing the government with expanded
opportunities to pursue actions under the federal Anti-Kickback Statute, the False Claims Act, and the Stark
Law. For example, ACA narrowed the public disclosure bar under the False Claims Act, allowing increased
opportunities for whistleblower litigation. In addition, the legislation modified the intent standard under the
federal Anti-Kickback Statute, making it easier for prosecutors to prove that alleged violators had met the
requisite knowledge requirement. ACA also requires providers and suppliers to report any Medicare or Medicaid
overpayment and return the overpayment on the later of 60 days of identification of the overpayment or the date
the cost report is due (if applicable), or all claims associated with the overpayment will become false claims. The
ACA also provides that any claim submitted from an arrangement that violates the Anti-Kickback Statute is a
false claim. Also, final regulations promulgating recent “sunshine” legislation were issued in early February
2013, requiring pharmaceutical and medical device manufacturers to record any payments made to physicians
and teaching hospitals, requiring information collection to begin August 1, 2013 and reporting of data to CMS
by March 31, 2014.
Anti-Kickback Statutes
The federal Anti-Kickback Statute establishes criminal prohibitions against and civil penalties for the
knowing and willful solicitation, receipt, offer or payment of any remuneration, whether direct or indirect, in
return for or to induce the referral of patients or the ordering or purchasing of items or services payable in whole
or in part under Medicare, Medicaid or other federal healthcare programs. Sanctions for violations of the Anti-
Kickback Statute include criminal and civil penalties, such as imprisonment and/or criminal fines of up to
$25,000 per violation, and civil penalties of up to $50,000 per violation and up to three times the amount
received from the healthcare program, and exclusion from the Medicare or Medicaid programs and other federal
programs.

48
The OIG has the authority to promulgate regulations referred to as “safe harbors” that define certain
business relationships and arrangements that would not be subject to civil sanction or criminal enforcement
under the Anti-Kickback Statute. Failure to comply with a safe harbor provision does not make the activity
illegal. Rather, the safe harbors set forth specific criteria that, if fully met, will assure the entities involved of not
being prosecuted criminally or civilly for the arrangement under the Anti-Kickback Statute.
Many states also have enacted statutes similar to the Anti-Kickback Statute, which may include criminal
penalties, applicable to referrals of patients regardless of payor source, and may contain exceptions different
from state to state and from those contained in the federal Anti-Kickback Statute.
False Claims Act and Related Criminal Provisions
The federal False Claims Act (the “False Claims Act”) imposes civil penalties for knowingly making or
causing to be made false claims with respect to governmental programs, such as Medicare and Medicaid, for
services billed but not rendered, or for misrepresenting actual services rendered, in order to obtain higher
reimbursement. Under the interpretation of certain courts, claims submitted for services furnished in violation of
the Anti-Kickback Statute or Stark Law could also violate the False Claims Act. Moreover, private individuals
may bring qui tam or “whistle blower” suits against providers under the False Claims Act, which authorizes the
payment of 15-30% of any recovery to the individual bringing suit. Such actions are initially required to be filed
under seal pending their review by the Department of Justice. The False Claims Act generally provides for the
imposition of civil penalties of $5,500 to $11,000 per claim and for treble damages, resulting in the possibility of
substantial financial penalties for small billing errors that are replicated in a large number of claims, as each
individual claim could be deemed to be a separate violation of the False Claims Act. Some states also have
enacted statutes similar to the False Claims Act which may include criminal penalties, substantial fines, and
treble damages.
The Health Insurance Portability and Accountability Act of 1996 (“HIPAA”)
HIPAA, which was enacted in August 1996, expanded federal fraud and abuse laws by increasing their
reach to all federal healthcare programs, establishing new bases for exclusions and mandating minimum
exclusion terms, creating an additional statutory exception to the Anti-Kickback Statute for risk-sharing
arrangements, requiring the Secretary of HHS to issue advisory opinions, increasing civil money penalties to
$10,000 per item or service and assessments to three times the amount claimed, creating a specific healthcare
fraud offense and related health fraud crimes, and expanding investigative authority and sanctions applicable to
healthcare fraud. HIPAA also prohibits a provider from offering anything of value which the provider knows or
should know would be likely to induce a federal healthcare program beneficiary to select or continue with the
provider.
HIPAA includes a healthcare fraud provision prohibiting knowingly and willfully executing a scheme or
artifice to defraud any “healthcare benefit program,” which includes any public or private plan or contract
affecting commerce under which any medical benefit, item, or service is provided to any individual, and includes
any individual or entity who is providing a medical benefit, item, or service for which payment may be made
under the plan or contract. Penalties for violating this statute include criminal penalties, exclusion from the
Medicare and Medicaid programs, freezing of assets and forfeiture of property traceable to commission of a
healthcare fraud.
Pursuant to HIPAA, HHS has promulgated regulations that (1) establish national standards for certain
electronic healthcare transactions, (2) restrict the use and disclosure of certain individually identifiable patient
health information, and (3) regulate the security of the electronic systems maintaining such information (the
“HIPAA Regulations”). Health insurance payers and healthcare providers like us must comply with the HIPAA
Regulations. Violations of the HIPAA Regulations may result in civil monetary penalties and criminal sanctions.
Many U.S. states also have enacted healthcare privacy and data security breach laws governing patient
information, medical records and personal information, including sensitive information such as financial and
identity data. The HIPAA privacy regulations (“Privacy Rule”) and the HIPAA security regulations (“Security
Rule”) establish minimum U.S. federal standards for protecting the privacy and security of protected health
information (“PHI”). These federal regulations pre-empt conflicting U.S. state laws, but they do not pre-empt
U.S. state laws that are more stringent or more protective of individual privacy or the security of personal health
information. In such instances, we would need to comply with both the Privacy and Security Rules and U.S. state
privacy law. In addition, almost all U.S. states now require notification to affected individuals and state
authorities, as well as the media in certain cases, in the event of a breach of the security of personal information

49
(including personal health information in a few states), often with significant financial penalties for
noncompliance.
The Health Information Technology for Economic and Clinical Health Act (“HITECH Act”), enacted as part
of the American Recovery and Reinvestment Act of 2009 (“ARRA”), required changes to HIPAA Privacy and
Security Rules that, among other things, (i) require HIPAA covered entities to provide patients (as well as HHS
and in some cases the media) with notifications in the event of a breach in the security of their unsecured PHI;
(ii) reinforce the standard for “minimum necessary” uses and disclosures of PHI by a covered entity; (iii) restrict
certain uses of PHI for marketing purposes (by expanding the definition of marketing activities requiring
authorization); (iv) prohibit certain sales of PHI; (v) require granting individual requests to restrict disclosures of
PHI to insurers in certain circumstances; (vi) apply the Security Rule and certain portions of the Privacy Rule to
“business associates” of covered entities; and (vii) enhance an individuals’ right to access PHI in electronic form.
HHS issued modifications to the HIPAA Regulations, effective March 26, 2013, implementing these changes.
The HITECH Act also provides for rules requiring HIPAA covered entities to provide patients with an
accounting of disclosures (within the past 3 years) of PHI for purposes of payment, treatment, and healthcare
operations. HHS may issue those regulations in the coming year. The HITECH Act also includes measures to
strengthen enforcement of HIPAA and increased applicable penalties for HIPAA violations. Penalties are now
tiered and range from $100 to $50,000 per violation with an annual cap for the same violation of $25,000 to
$1,500,000. The HHS Office for Civil Rights (“OCR”) has increased enforcement activities and has recently
levied large penalties for violations. In addition, as mandated by the HITECH Act, OCR has been conducting
audits to assess compliance by covered entities and their business associates with the HIPAA Privacy and
Security Rules and the security breach notification standards.
Civil Monetary Penalties Law
Individuals or entities who have, among other things, (1) directly submitted, or caused to be submitted,
claims which are improper or false; (2) arranged or contracted with an individual or entity that the person knows
or should know is excluded from participation in federal healthcare programs; or (3) offered or transferred
remuneration to an individual to influence such individual in order to receive healthcare services from a
particular healthcare provider; or (4) offered or received kickbacks may also be subject to monetary penalties or
exclusion under the Civil Monetary Penalties Law (“CMPL”) at the discretion of the OIG. Penalties are
generally not more than $10,000 for each item or service. However, under the CMPL, violators of the federal
Anti-Kickback Statute provisions may also be subject to additional civil money penalties of $50,000 per
violation. Violators are also subject to an assessment of up to three times the amount claimed for each item or
service in lieu of damages sustained by the United States or a state agency because of such claim, or damages of
up to three times the total amount of remuneration offered, paid, solicited, or received. In addition, any person or
entity who violates this section may be excluded from participation in the federal or state healthcare programs.
Stark Law
The original Ethics in Patient Referrals Act of 1989 (commonly referred to as the “Stark Law”) was enacted
as part of the Omnibus Budget Reconciliation Act (“OBRA”) of 1989, and prohibited a physician from referring
Medicare patients for clinical laboratory services to entities with which the physician (or an immediate family
member) has a financial relationship, unless an exception applies. Sanctions for violations of the Stark Law may
include denial of payment, refund obligations, civil monetary penalties and exclusion of the provider from the
Medicare and Medicaid programs. In addition, the Stark Law prohibits the entity receiving the referral from
filing a claim or billing for services arising out of the prohibited referral.
Provisions of OBRA 1993, known as “Stark II,” amended the Stark Law to revise and expand upon various
statutory exceptions, expanded the services regulated by the statute to a list of “Designated Health Services,” and
expanded the reach of the statute to the Medicaid program. The provisions of Stark II generally became effective
on January 1, 1995. The additional Designated Health Services, in addition to clinical laboratory services,
include: physical therapy, occupational therapy and speech language pathology services; radiology and certain
other imaging services; radiation therapy services and supplies; durable medical equipment and supplies;
parenteral and enteral nutrients, equipment and supplies; prosthetics, orthotics, and prosthetic devices and
supplies; home health services; outpatient prescription drugs; and inpatient and outpatient hospital services. The
first phase of Stark regulations was finalized on January 4, 2001. Most portions of the first phase regulations
became effective in 2002. The first phase of the final regulations implementing the Stark Law (the “Phase I
regulations”) contains an exception for Epogen® and certain other dialysis-related outpatient prescription drugs
furnished in or by an ESRD facility under many circumstances. In addition, the regulations made clear that
services reimbursed by Medicare to a dialysis facility under the ESRD composite rate do not implicate the Stark

50
Law. Further, the final Phase I regulations also adopted a definition of durable medical equipment which
effectively excludes ESRD equipment and supplies from the category of Designated Health Services. Phase II of
the Stark regulations was published on March 26, 2004, and became effective on July 26, 2004. This phase of
the regulations finalized all of the compensation exceptions to the Stark Law, including those for “personal
services arrangements” and “indirect compensation arrangements.” In addition, Phase II revised the exception
for Epogen® and certain other dialysis-related outpatient prescription drugs furnished in or by an ESRD facility
to include certain additional drugs. Our dialysis facilities, laboratory testing facilities and certain of our vascular
access centers perform and bill for Designated Health Services and those providers’ financial arrangements with
referring physicians are subject to the Stark Law.
On September 5, 2007, CMS published Phase III of the Stark regulations. While this rulemaking was
intended to be the final phase of the Stark rulemaking process, CMS continues to address the Stark Law as part
of its annual rulemaking process for reimbursement under the Medicare Part B Physician Fee Schedule or under
the Inpatient Prospective Payment System.
Finally, it should be noted that many states in which we operate have enacted self-referral statutes similar to
the Stark Law. Such state self-referral laws may apply to referrals of patients regardless of payor source and may
contain exceptions different from each other and from those contained in the Stark Law.
Other Fraud and Abuse Laws
Our operations are also subject to a variety of other federal and state fraud and abuse laws, principally
designed to ensure that claims for payment to be made with public funds are complete, accurate and fully comply
with all applicable program rules, and to prevent remuneration in exchange for referrals or purchases of items
which may be reimbursed by the government or which may lead to overutilization, corruption of healthcare
provider judgment, or a lack of transparency in costs or charges. Failure to remain in compliance with any of these
rules by any of our subject businesses could result in a material adverse effect on our business, financial condition
or results of operations.
Healthcare Reform
ACA contains broad healthcare system reforms, including (i) provisions to facilitate access to affordable
health insurance for all Americans, (ii) expansion of the Medicaid program, (iii) an industry fee on
pharmaceutical companies starting in 2011 based on sales of brand name pharmaceuticals to government
healthcare programs, (iv) a 2.3% excise tax on manufacturers’ medical device sales starting in 2013,
(v) increases in Medicaid prescription drug rebates effective January 1, 2010, (vi) commercial insurance market
reforms that protect consumers, such as bans on lifetime and annual limits, coverage of pre-existing conditions,
and limits on waiting periods, (vii) provisions encouraging integrated care, efficiency and coordination among
providers and (viii) provisions for reduction of healthcare program waste and fraud. ACA’s medical device
excise tax, Medicaid drug rebate increases and annual pharmaceutical industry fees will adversely impact our
product business earnings and cash flows. We expect modest favorable impact from ACA’s integrated care and
commercial insurance consumer protection provisions.
ACA also contains the Physician Payment Sunshine Act (section 6002) (“PPSA”). On February 8, 2013,
CMS issued final regulations under the PPSA that require applicable pharmaceutical, medical device, biological,
and medical supply manufacturers to report annually to the Secretary of Health and Human Services (HHS)
certain "payments or other transfers of value" to physicians and teaching hospitals. The PPSA also requires
applicable manufacturers to report certain information regarding the ownership or investment interests held by
physicians or the immediate family members of physicians in such entities. The first reports will be due March
31, 2014 for the initial reporting period (August – December 2013), and thereafter for each calendar year. The
report must include, among other things, information about the amount of the payment, the date on which the
payment was made, the form of payment, and the nature of the payment (e.g., consulting fees, compensation for
services, gifts, entertainment and research).
Although the constitutionality of ACA was, in large part, upheld by the U.S. Supreme Court in June 2012,
the law has continued to be strongly opposed by many members of Congress. Proposals have been advanced in
Congress to repeal ACA in whole or in part, to reduce its scope and scale, to delay it, or to defund it. We cannot
predict which Congressional proposals, if any, will be adopted or, if any proposals are adopted, what the effect
would be.

51
The U.S. Supreme Court decision affirmed the right of individual states to elect to participate or not in
ACA’s Medicaid expansion. A large number of states are expected to forego the expansion, at least initially. As
a result, the decrease in the number of uninsured individuals will be smaller than originally expected. We cannot
predict whether additional states will agree to participate in the expansion in future years.
CMS and the Department of Health and Human Services have not yet finalized all of the rules and regulations
implementing the provisions of ACA. As a result, further regulations may be promulgated in the future that could
substantially change the Medicare and Medicaid reimbursement systems, or that impose additional eligibility
requirements for participation in the federal and state healthcare programs. Moreover, such regulations could alter
the current responsibilities of third-party insurance payors (including employer-sponsored health insurance plans,
commercial insurance carriers and the Medicaid program) including, without limitation, with respect to cost-
sharing obligations. Such new regulations could, depending upon the detail of the provisions, have positive or
adverse effects, possibly material, on our businesses and results of operations.
C. Organizational Structure
The following chart shows our organizational structure and our significant subsidiaries as of December 31,
2013. Fresenius Medical Care Holdings, Inc. conducts its business as "Fresenius Medical Care North America."
Fresenius SE & Co. KGaA Public Shareholders
approximately 68.7 % of
ordinary shares
Fresenius Medical Care
AG & Co. KGaA
Germany
100 %
Fresenius Medical Care
Deutschland GmbH
Germany
Other International
Business
Fresenius Medical Care
Management AG Germany
Sole
General
Partner
100 %
(indirect) 100 %
(indirect)
National Medical Care,
Inc.
Delaware USA
Fresenius Medical Care
Holdings, Inc.
New York
USA
Fresenius Medical Care
North America Holdings
Limited Partnership
100 %
100 %
100 % Renal Care Group, Inc.
Delaware USA
100 %
direct or
indirect
approximately 31.3 % of
ordinary shares

52
D. Property, plant and equipment
Property
The table below describes our principal facilities. We do not own the land and buildings comprising our
principal facilities in Germany. Rather, we lease those facilities on a long-term basis from Fresenius SE or one of
its affiliates. These leases are described under "Item 7.B. Related Party Transactions – Real Property Lease."
Location
Floor Area
(Approximate
Square Meters)
Currently
Owned or
Leased by
Fresenius
Medical
Care Lease Expiration Use
St. Wendel, Germany 87,122 leased December 2016 Manufacture of polysulfone membranes,
dialyzers and peritoneal dialysis solutions;
research and development
Suzhou, China
(Changshu Plant)
83,808 owned Manufacture of hemodialysis bloodline sets /
AV fistula set
Ogden, Utah 74,322 owned Manufacture polysulfone membranes and
dialyzers and peritoneal dialysis solutions;
research and development
Schweinfurt, Germany 38,100 leased December 2016 Manufacture of hemodialysis machines and
peritoneal dialysis cyclers; research and
development
Fukuoka, Japan
(Buzen Plant)
37,092 owned Manufacture of peritoneal dialysis bags and
dialyzers
Biebesheim, Germany 33,500 leased December 2023 Central distribution Europe, Asia Pacific and
Latin America
Waltham,
Massachusetts
27,982 leased April 2017 with a
10 year and a
second 5 year
renewal option
North American corporate headquarters
Fukuoka, Japan
(Buzen Plant) -
Site Area for future
expansion
27,943 owned Manufacture of peritoneal dialysis bags and
dialyzers
Guadalajara, México 26,984 owned Manufacture of peritoneal dialysis bags
Canosa Sannita
(Chieti), Italy
22,500 owned Manufacture of PD bags and warehouse
Buenos Aires,
Argentina
20,000 owned Manufacture of hemodialysis concentrate
solutions, dry hemodialysis concentrates,
bloodlines and disinfectants
Palazzo Pignano, Italy 19,990 owned Manufacture of bloodlines and tubing, office
Rockleigh, New Jersey 19,974 leased May 31, 2028 Clinical laboratory testing
Bad Homburg,
Germany
18,700 leased December 2016 Corporate headquarters and administration
L´Arbresle, France 18,001 owned Manufacture of polysulfone dialyzers, special
filters, dry & liquid hemodialysis concentrates,
empty pouches
Concord, California 16,495 leased October 2028 Manufacture of Hemodialysis machines and
peritoneal
dialysis cyclers; research and development;
warehouse space
São Paulo, Brazil 15,474 owned Manufacture of hemodialysis concentrate
solutions, dry hemodialysis concentrates,
peritoneal dialysis bags, intravenous solutions
bags, peritoneal dialysis and blood lines sets
Bad Homburg (OE),
Germany
10,304 leased December 2016 Manufacture of hemodialysis concentrate
solutions / technical services / logistics services
Bad Homburg,
Germany
4,556 leased December 2014 Administration building FMC GmbH Central
Europe

53
We lease most of our dialysis clinics, manufacturing, laboratory, warehousing and distribution and
administrative and sales facilities in the U.S. and other countries on terms which we believe are customary in the
industry. We own those dialysis clinics and manufacturing facilities that we do not lease.
For information regarding plans to expand our facilities and related capital expenditures, see "Item 4.A.
History and Development of the Company – Capital Expenditures.”
Item 4A. Unresolved Staff Comments
Not applicable.
Item 5. Operating and Financial Review and Prospects
You should read the following discussion and analysis of the results of operations of Fresenius Medical Care
AG & Co. KGaA and its subsidiaries in conjunction with our historical consolidated financial statements and
related notes contained elsewhere in this report. Some of the statements contained below, including those
concerning future revenue, costs and capital expenditures and possible changes in our industry and competition
and financial conditions include forward-looking statements. We made these forward-looking statements based
on the expectations and beliefs of the management of the Company’s General Partner concerning future events
which may affect us, but we cannot assure that such events will occur or that the results will be as anticipated.
Because such statements involve risks and uncertainties, actual results may differ materially from the results
which the forward-looking statements express or imply. Such statements include the matters and are subject to
the uncertainties that we described in the discussion in this report entitled "Introduction - Forward-Looking
Statements." See also Item 3.D., “Key Information - Risk Factors.”
Our business is also subject to other risks and uncertainties that we describe from time to time in our public
filings. Developments in any of these areas could cause our results to differ materially from the results that we or
others have projected or may project.
Critical Accounting Policies
The Company’s reported financial condition and results of operations are sensitive to accounting methods,
assumptions and estimates that are the basis for our financial statements. The critical accounting policies, the
judgments made in the creation and application of these policies, and the sensitivities of reported results to
changes in accounting policies, assumptions and estimates are factors to be considered along with the
Company’s financial statements, and the discussion below in “Results of Operations.”
Recoverability of Goodwill and Intangible Assets
The growth of our business through acquisitions has created a significant amount of intangible assets,
including goodwill and other non-amortizable intangible assets such as trade names and management contracts.
At December 31, 2013, the carrying amount of goodwill amounted to $11,658 million and non-amortizable
intangible assets amounted to $218 million representing in total approximately 51% of our total assets.
In accordance with current accounting standards, we perform an impairment test of goodwill and non-
amortizable intangible assets at least once a year for each reporting unit, or if we become aware of events that
occur or if circumstances change that would indicate the carrying value might be impaired. See also Note 1e) in
the Notes to Consolidated Financial Statements.
To comply with the provisions of the accounting standards for impairment testing, the fair value of the
reporting unit is compared to the reporting unit’s carrying amount. As we are subject to the International
Financial Reporting Standards requirements, which utilizes the two-step approach, we do not follow the
qualitative assessment within ASC 350-20-35. We estimate the fair value of each reporting unit using estimated
future cash flows for the unit discounted by a weighted average cost of capital (“WACC”) specific to that
reporting unit. Estimating the future cash flows involves significant assumptions, especially regarding future
reimbursement rates and sales prices, treatments and sales volumes and costs. In determining cash flows, the
Company utilizes for every reporting unit, its three-year budget, projections for years 4 to 10 and a representative
growth rate for all remaining years. Projections for up to ten years are possible due to the non-discretionary
nature of the healthcare services we provide, the need for products utilized to provide such services and the
availability of government reimbursement for a substantial portion of our services. The Company’s WACC

54
consisted of a basic rate of 6.17% for 2013. This basic rate is then adjusted by a weighted average country risk
rate and, if appropriate, by a factor to reflect higher risks associated with the cash flows from recent material
acquisitions until they are appropriately integrated within each reporting unit.
If the fair value of the reporting unit is less than its carrying value, a second step would be performed which
compares the implied fair value of the reporting unit’s goodwill to the carrying value of its goodwill. If the fair
value of the goodwill is less than its carrying value, the difference is recorded as an impairment.
A prolonged downturn in the healthcare industry with lower than expected increases in reimbursement rates
and/or higher than expected costs for providing healthcare services and for procuring and selling products could
adversely affect our estimated future cash flows. Future adverse changes in a reporting unit’s economic
environment could affect the country-specific rate and therefore the discount rate. An increase in interest rates
could impact the basic rate and accordingly our WACC. These changes could result in impairment charges to
goodwill and other intangible assets which could materially and adversely affect our future financial position and
operating results.
Legal Contingencies
We are party to litigation and subject to investigations relating to a number of matters as described in Note
20 of the Notes to Consolidated Financial Statements, “Commitments and Contingencies.” The outcome of
these matters may have a material effect on our financial position, results of operations or cash flows.
We regularly analyze current information including, as applicable, our defenses and we provide accruals for
probable contingent losses including the estimated legal expenses to resolve the matters. We use the resources
of our internal legal department as well as external lawyers for the assessment. In making the decision regarding
the need for loss accrual, we consider the degree of probability of an unfavorable outcome and our ability to
make a reasonable estimate of the amount of loss.
The filing of a suit or formal assertion of a claim or assessment, or the disclosure of any such suit or
assertion, does not automatically indicate that accrual of a loss may be appropriate.
Accounts Receivable and Allowance for Doubtful Accounts
Trade accounts receivable are a substantial asset of ours and the allowance for doubtful accounts is based
upon a significant estimate made by management. Trade accounts receivable were $3,037 million and $3,019
million at December 31, 2013 and 2012, respectively, net of allowances for doubtful accounts of $413 million
and $329 million, respectively.
We sell dialysis products directly or through distributors in more than 120 countries and we provide dialysis
services in approximately 45 countries through clinics we own or manage. Most payors are government
institutions or government-sponsored programs with significant variations between the countries and even
between payors within one country in local payment and collection practices.
Receivables are recognized and billed at amounts estimated to be collectable under government
reimbursement programs and reimbursement arrangements with third party payors. U.S. Medicare and Medicaid
government programs are billed at pre-determined net realizable rates per treatment that are established by
statute or regulation. Revenues for non-governmental payors with which we have contracts or letters of
agreement in place are recognized at the prevailing contract rates. The remaining non-governmental payors are
billed at our standard rates for services and, in our North America Segment, a contractual adjustment is recorded
to recognize revenues based on historic reimbursement. The contractual adjustment and the allowance for
doubtful accounts are reviewed quarterly for their adequacy. No material changes in estimates were recorded for
the contractual allowance in the periods presented. The collectability of accounts receivable is reviewed locally
on a regular basis, generally monthly.
In our U.S. operations, the collection process is usually initiated 30 days after service is provided or upon the
expiration of the time provided by contract. For Medicare and Medicaid, once the services are approved for
payment, the collection process begins upon the expiration of a period of time based upon experience with
Medicare and Medicaid. In all cases where co-payment is required the collection process usually begins within
30 days after service has been provided. In those cases where claims are approved for amounts less than
anticipated or if claims are denied, the collection process usually begins upon notice of approval of the lesser
amounts or upon denial of the claim. The collection process can be confined to internal efforts, including the

55
accounting and sales staffs and, where appropriate, local management staff. If appropriate, external collection
agencies may be engaged.
Public health institutions in a number of countries outside the U.S. require a significant amount of time until
payment is made because a substantial number of payors are government entities whose payments are often
determined by local laws and regulations and budget constraints. Depending on local facts and circumstances,
the period of time to collect can be quite lengthy. In those instances where there are commercial payors, the same
type of collection process is initiated as in the U.S.
Due to the number of our subsidiaries and different countries that we operate in, our policy of determining
when a valuation allowance is required considers the appropriate individual local facts and circumstances that
apply to an account. While payment and collection practices vary significantly between countries and even
agencies within one country, government payors usually represent low to moderate credit risks. It is our policy to
determine when receivables should be classified as bad debt on a local basis taking into account local payment
practices and local collection experience. A valuation allowance is calculated locally if specific circumstances
indicate that amounts will not be collectible.
In our International Segment and North America Segment product division, for receivables overdue by more
than one year, an additional valuation allowance is recorded based on an individual country risk, since we
believe that the length of time to collect does indicate an increased credit risk.
When all efforts to collect a receivable, including the use of outside sources where required and allowed,
have been exhausted, and after appropriate management review, a receivable deemed to be uncollectible is
considered a bad debt and written off.
In the Consolidated Statement of Income, expenses from our allowance for doubtful accounts is presented
either as a deduction from revenue or as operating expense depending on the source of the receivable. For our
dialysis care business, we determine an allowance for patient services provided where all or a portion of the
amounts billed or billable cannot be determined to be collectible at the time services are performed, e.g., when
we provide treatment to a patient when such treatment is not covered by an insurance program or a
reimbursement arrangement regardless of the patient’s ability to pay. This allowance is shown as a reduction to
our Consolidated Statements of Income line item Dialysis Care. All of our other receivables are evaluated with
the changes in the allowance for doubtful accounts recorded as an operating expense.
Write offs are taken on a claim-by-claim basis when the collection efforts are exhausted. Due to the fact that
a large portion of our reimbursement is provided by public health care organizations and private insurers, we
expect that most of our accounts receivable will be collectible. However, we have experienced some collection
delays with distributors in a few Asia-Pacific countries. See “B. Liquidity and Capital Resources – Operations,”
below, for a discussion of days sales outstanding developments in 2013. A significant change in our collection
experience, deterioration in the aging of receivables and collection difficulties could require that we increase our
estimate of the allowance for doubtful accounts. Any such additional bad debt charges could materially and
adversely affect our future operating results.
If, in addition to our existing allowances, 1% of the gross amount of our trade accounts receivable as of
December 31, 2013 were uncollectible through either a change in our estimated contractual adjustment or as bad
debt, our operating income for 2013 would have been reduced by approximately 1.5%.
The following tables show the portion and aging of trade accounts receivable of major debtors or debtor
groups at December 31, 2013 and 2012. No single debtor other than U.S. Medicaid and Medicare accounted for
more than 5% of total trade accounts receivable in either year. Amounts pending approval from third party
payors represented less than 3% at December 31, 2013.

56
Aging of Net Trade Accounts Receivable by Major Payor Groups:
At December 31, 2013
current
overdue by
up to 3
months
overdue
more than 3
months
up to 6
months
overdue
more than
6 months
up to 1
year
overdue
by
more than
1 year
Total
% of net
trade
A/R
(in millions)
U.S. Government Healthcare
Programs $ 534 $ 106 $ 45 $ 118 $ 13 $ 816 27
U.S. Commercial Payors 239 140 41 36 13 469 16
U.S. Hospitals 87 34 3 3 3 130 4
Self-Pay of U.S. patients 1 4 0 1 1 7 0
Other North America 6 0 0 0 0 6 0
International product customers
and dialysis payors 953 266 120 136 134 1,609 53
Total $ 1,820 $ 550 $ 209 $ 294 $ 164 $ 3,037 100
At December 31, 2012
current
overdue by
up to 3
months
overdue
more than 3
months
up to 6
months
overdue
more than
6 months
up to 1
year
overdue
by
more than
1 year
Total
% of net
trade
A/R
(in millions)
U.S. Government Healthcare
Programs $ 473 $ 89 $ 47 $ 36 $ 27 $ 672 22
U.S. Commercial Payors 292 175 42 35 21 565 19
U.S. Hospitals 107 33 4 3 2 149 5
Self-Pay of U.S. patients 1 11 6 2 2 22 1
Other North America 7 2 0 0 0 9 0
International product customers
and dialysis payors 901 279 124 113 185 1,602 53
Total $ 1,781 $ 589 $ 223 $ 189 $ 237 $ 3,019 100
Self-Insurance Programs
Under the insurance programs for professional, product and general liability, auto liability and worker’s
compensation claims, FMCH, our largest subsidiary, is partially self-insured for professional liability claims. For
all other coverages we assume responsibility for incurred claims up to predetermined amounts above which third
party insurance applies. Reported liabilities for the year represent estimated future payments of the anticipated
expense for claims incurred (both reported and incurred but not reported) based on historical experience and
existing claim activity. This experience includes both the rate of claims incidence (number) and claim severity
(cost) and is combined with individual claim expectations to estimate the reported amounts.
Financial Key Performance Indicators used for Internal Management
The Management Board oversees our Company by setting strategic and operational targets and measuring
various financial key performance indicators used for internal management determined in U.S. dollar based on
accounting principles generally accepted in the U.S. (“U.S. GAAP”). These key performance indicators do not
differ between the operating segments. Each operating segment is evaluated based on target figures that reflect
revenue and expenses the operating segments control. See “Financial Condition and Results of Operations-
Overview” below for a discussion of exclusion of certain costs from operating segment results.

57
U.S. GAAP-based measures
Revenue
For our operating segments, revenue is a financial key performance indicator. The number of treatments
performed each year is an indicator of revenue generation. For further information regarding revenue recognition
and measurement, refer to Note 1 of the Notes to Consolidated Financial Statements, “The Company and Basis
of Presentation – Summary of Significant Accounting Policies – Revenue Recognition and Allowance for
Doubtful Accounts”. Revenue is also benchmarked based on movement at Constant Exchange Rates. See the
“Non-U.S. GAAP Measures” below.
Operating Income
Operating income is used to measure the profitability of the operating segments and therefore is also a
financial key performance indicator.
Operating Income Margin
Operating income margin, the ratio of operating income to revenue, represents the percentage of profit
earned on revenue generated and is another financial key performance indicator for each segment.
Growth in Net Income
On a consolidated level, the percentage growth in net income (net income attributable to shareholders of
FMC-AG & Co. KGaA), which compares current period to prior period net income, is an additional financial
key performance indicators used for internal management of the Company.
Growth in Basic Earnings per Share
Percentage growth in basic earnings per shares is a financial key performance indicator to evaluate our
profitability. This indicator helps to manage our overall performance. Basic earnings per share is calculated by
dividing net income attributable to shareholders by the weighted-average number of ordinary shares outstanding
during the year. Prior to the conversion of preference shares to ordinary shares during the second quarter of
2013, basic earnings per share was computed according to the “two-class method” by dividing net income
attributable to shareholders, less preference amounts, by the weighted average number of ordinary and
preference shares outstanding during the year. Additionally, we compute a percentage growth in adjusted basic
earnings per share for use in our management incentive program targets.
Capital Expenditures
Capital expenditures for property, plant, and equipment (“CapEx”) is an indicator used by our internal
management. We manage our CapEx using a detailed coordination and evaluation process. The Management
Board sets this CapEx budget. Before CapEx projects are approved, our internal Acquisition Investment
Committee (AIC) examines the individual projects and measures the potential return on these expenditures and
their expected yield. The CapEx projects are evaluated based on commonly used methods such as the net present
value and internal interest rate methods, as well as payback periods.
Non-U.S. GAAP Measures
EBITDA
EBITDA (earnings before interest, tax, depreciation and amortization expenses) was approximately $2,904
million, 19.9% of revenues for 2013, $2,821 million, 20.4% of revenues for 2012 and $2,632 million, 20.9% of
revenues for 2011. EBITDA is the basis for determining compliance with certain covenants contained in our
2012 Credit Agreement, Euro Notes, EIB agreements, and the indentures relating to our senior notes. You should
not consider EBITDA to be an alternative to net earnings determined in accordance with U.S. GAAP or to cash
flow from operations, investing activities or financing activities. In addition, not all funds depicted by EBITDA
are available for management's discretionary use. For example, a substantial portion of such funds are subject to
contractual restrictions and functional requirements for debt service, to fund necessary capital expenditures and
to meet other commitments from time to time as described in more detail elsewhere in this report. EBITDA, as
calculated, may not be comparable to similarly titled measures reported by other companies. A reconciliation of
EBITDA to cash flow provided by (used in) operating activities, which we believe to be the most directly
comparable U.S. GAAP financial measure, is calculated as follows:

58
Reconciliation of EBITDA to net cash provided by (used in) operating activities
For the years ended December 31,
2013 2012 2011
(in millions)
Total EBITDA $ 2,904 $ 2,821 $ 2,632
Interest expense (net of interest income) (409) (426) (297)
Income tax expense, net (592) (605) (601)
Change in deferred taxes, net 16 75 159
Changes in operating assets and liabilities 137 169 (378)
Stock compensation expense 14 26 29
Other items, net (35) (21) (98)
Net cash provided by (used in) operating activities $ 2,035 $ 2,039 $ 1,446
The ratio of debt to EBITDA is a key financial performance indicator used for overseeing the Company. To
determine the total debt to EBITDA ratio, financial liabilities are compared to EBITDA. We believe this ratio
provides more reliable information regarding the extent to which we are able to meet our payment obligations
than considering only the total amount of financial liabilities.
Cash flow measures
Our consolidated statement of cash flows indicates how we generated and used cash and cash equivalents.
When used in conjunction with the other primary financial statements, it provides information that helps us
evaluate the changes in our net assets and our financial structure (including our liquidity and solvency). The net
cash provided by (used in) operating activities is used to assess whether our business can generate the cash
required to make replacement and expansion investments. Net cash provided by (used in) operating activities is
impacted by the profitability of our business and development of working capital, principally receivables. The
financial key performance indicator of net cash provided by (used in) operating activities in percentage of
revenue shows the percentage of our revenue that is available in terms of financial resources.
Free cash flow is the cash flow provided by (used in) operating activities after capital expenditures for
property, plant and equipment but before acquisitions and investments. The key performance indicator used by
management is free cash flow in percentage of revenue. This represents the percentage of revenue that is
available for acquisitions, dividends to shareholders, or the reduction of debt financing.
Significant Cash Flow key performance indicators
For the years ended December 31,
2013 2012 2011
(in millions)
Revenue $ 14,610 $ 13,800 $ 12,571
Net cash provided by (used in) operating activities 2,035 2,039 1,446
Capital expenditures (748) (675) (598)
Proceeds from sale of property, plant and equipment 20 9 28
Capital expenditures, net (728) (666) (570)
Free cash flow 1,307 1,373 876
Net cash provided by (used in) operating activities in % of
revenue 13.9% 14.8% 11.5%
Free cash flow in % of revenue 8.9% 10.0% 7.0%

59
Non-U.S. GAAP Measures for Presentation
Constant Currency
Changes in revenue include the impact of changes in foreign currency exchange rates. We use the non-
GAAP financial measure at Constant Exchange Rates or Constant Currency in our filings to show changes in our
revenue without giving effect to period-to-period currency fluctuations. Under U.S. GAAP, revenues received in
local (non-U.S. dollar) currency are translated into U.S. dollars at the average exchange rate for the period
presented. Once we translate the current period local currency revenues for the Constant Currency, we then
calculate the change, as a percentage, of the current period revenues using the prior period exchange rates versus
the prior period revenues. This resulting percentage is a non-GAAP measure referring to a percentage change at
Constant Currency.
We believe that revenue growth is a key indication of how a company is progressing from period to period
and that the non-GAAP financial measure Constant Currency is useful to investors, lenders, and other creditors
because such information enables them to gauge the impact of currency fluctuations on a company’s revenue
from period to period. However, we also believe that the usefulness of data on Constant Currency period-over-
period changes is subject to limitations, particularly if the currency effects that are eliminated constitute a
significant element of our revenue and significantly impact our performance. We therefore limit our use of
Constant Currency period-over-period changes to a measure for the impact of currency fluctuations on the
translation of local currency revenue into U.S. dollars. We do not evaluate our results and performance without
considering both Constant Currency period-over-period changes in non-U.S. GAAP revenue on the one hand and
changes in revenue prepared in accordance with U.S. GAAP on the other. We caution the readers of this report
to follow a similar approach by considering data on Constant Currency period-over-period changes only in
addition to, and not as a substitute for or superior to, changes in revenue prepared in accordance with U.S.
GAAP. We present the fluctuation derived from U.S. GAAP revenue next to the fluctuation derived from non-
GAAP revenue. Because the reconciliation of non-GAAP to U.S. GAAP measures is inherent in the disclosure,
we believe that a separate reconciliation would not provide any additional benefit.
Financial Condition and Results of Operations
Overview
We are engaged primarily in providing renal dialysis services including pharmacy services and vascular
access surgery services (together, the “Expanded Services”) and manufacturing and distributing products for the
treatment of End-Stage Renal Disease (“ESRD”). In the U.S. the Company also provides laboratory testing
services, and inpatient dialysis services as well as other services under contract to hospitals. We estimate that
providing dialysis services and distributing dialysis products represents a worldwide market of approximately
$75 billion with expected annual worldwide market growth of around 4%, adjusted for currency. Patient growth
results from factors such as the aging population and increased life expectancies; shortage of donor organs for
kidney transplants; increasing incidence and better treatment of and survival of patients with diabetes and
hypertension, which frequently precede the onset of ESRD; improvements in treatment quality, which prolong
patient life; and improving standards of living in developing countries, which make life-saving dialysis treatment
available. Key to continued growth in revenue is our ability to attract new patients in order to increase the
number of treatments performed each year. For that reason, we believe the number of treatments performed each
year is a strong indicator of continued revenue growth and success. In addition, the reimbursement and ancillary
services utilization environment significantly influences our business. The majority of treatments are paid for by
governmental institutions such as Medicare in the United States. As a consequence of the pressure to decrease
healthcare costs, reimbursement rate increases have been historically and are expected in the future to be limited.
With the exception of (i) the implementation of the ESRD prospective payment system (“ESRD PPS”) in the
U.S. in January 2011, (ii) the U.S. federal government Sequestration cuts and (iii) commencing on January 1,
2014, the phased-in reductions to the ESRD PPS rate over three to four years to account for the decline in
utilization of certain drugs and biologicals associated with dialysis, (see discussion of the American Taxpayer
Relief Act of 2012 below) we experienced and also expect in the future to experience generally stable
reimbursements for dialysis services globally. This includes the balancing of unfavorable reimbursement
changes in certain countries with favorable changes in other countries.
With the enactment in the U.S. of the Medicare Improvements for Patients and Providers Act of 2008
(“MIPPA”), Congress mandated the development of an expanded ESRD PPS for services furnished on or after
January 1, 2011. Under the ESRD PPS, CMS reimburses dialysis facilities with a single payment for each
dialysis treatment, inclusive of (i) all items and services included in the pre-2011 ESRD composite rate, (ii)
oral vitamin D analogues, oral levocarnitine (an amino acid derivative) and all erythropoietin stimulating
agents (“ESAs”) and other pharmaceuticals (other than vaccines and certain other oral drugs) furnished to

60
ESRD patients that were previously reimbursed separately under Part B of the Medicare program, (iii) most
diagnostic laboratory tests and (iv) certain other items and services furnished to individuals for the treatment
of ESRD. ESRD-related drugs with only an oral form, including our phosphate binder PhosLo®, are expected
to be reimbursed under the ESRD PPS starting in January 2016 with an adjusted payment amount to be
determined by the Secretary of Health and Human Services to reflect the additional cost to dialysis facilities
of providing these medications. The base ESRD PPS payment is subject to case mix adjustments that take into
account individual patient characteristics (e.g., age, body surface area, body mass, time on dialysis) and
certain co-morbidities. The base payment is also adjusted for (i) certain high cost patient outliers due to
unusual variations in medically necessary care, (ii) disparately high costs incurred by low volume facilities
relative to other facilities, (iii) provision of home dialysis training and (iv) wage-related costs in the
geographic area in which the provider is located.
The ESRD PPS payment amount is subject to annual adjustment based on increases in the costs of a
“market basket” of certain healthcare items and services less a productivity adjustment. The 2013 ESRD PPS
base rate is $240.36 per treatment. This amount reflects a productivity adjusted market basket update of 2.3%,
which was based on a market basket update over 2012 reimbursement rates of 2.9% less a productivity
adjustment of 0.6%, and a wage index budget-neutrality adjustment factor of 1.000613 applied to the 2012
ESRD PPS base rate of $234.81 per treatment.
The 2011 ESRD PPS resulted in a lower Medicare reimbursement rate on average at our U.S. dialysis
facilities. We mitigated the impact of the ESRD PPS with two broad measures. First, we worked with medical
directors and treating physicians to find efficiencies consistent with the ESRD PPS’s quality incentive program
(“QIP”) and good clinical practices, and we negotiated pharmaceutical acquisition cost savings. In addition, we
achieved greater efficiencies and better patient outcomes by introducing new initiatives to improve patient care
upon initiation of dialysis, increase the percentage of patients using home therapies and achieve additional cost
reductions in our clinics.
The ESRD PPS’s QIP began affecting payments starting January 1, 2012. Dialysis facilities that fail to
achieve the established quality standards could have payments reduced by up to 2%. Performance on speci fied
measures in a fiscal year affects payments two fiscal years later. For instance, the payments we receive during
2014 will be affected by our performance measures from 2012. Based on our performance from 2010 through
2012, the QIP’s impact on our results through 2014 is immaterial. The initial QIP measures for 2010 and
2011 focused on anemia management and dialysis adequacy (Urea Reduction Ratio or URR). For 2012
reporting (affecting payments in 2014), CMS adopted four additional measures: prevalence of catheter and A/V
fistula use, reporting of infections to the Centers for Disease Control and Prevention, administration of patient
satisfaction surveys and monthly monitoring of phosphorus and calcium levels. For payment year 2015, CMS
has continued all of the 2014 QIP measures except URR dialysis adequacy, expanded the scope of infection
reporting and mineral metabolism reporting, and added four new measures. Payment year 2015 measures consist
of three new clinical measures (hemodialysis adequacy (adult patients), hemodialysis adequacy (pediatric
patients) and peritoneal dialysis adequacy), and one new reporting measure (anemia management reporting). For
payment year 2016, CMS has continued all of the 2015 QIP measures and added two new clinical measures
(proportion of patients with hypercalcemia and dialysis-related infections reported to the Center for Disease
Control and Prevention’s National Health Safety Network by ESRD facilities treatment patients on an in-
center basis).
The Patient Protection and Affordable Care Act, as amended by the Health Care and Education
Reconciliation Act of 2011 (collectively, “ACA”) implements broad healthcare system reforms, including (i)
provisions to facilitate access to affordable health insurance for all Americans, (ii) expansion of the Medicaid
program, (iii) an industry fee on pharmaceutical companies that began in 2011 based on sales of brand name
pharmaceuticals to government healthcare programs, (iv) a 2.3% excise tax on manufacturers’ medical device
sales starting in 2013, (v) increases in Medicaid prescription drug rebates effective January 1, 2010, (vi)
commercial insurance market reforms that protect consumers, such as bans on lifetime and annual limits,
coverage of pre-existing conditions, limits on administrative costs, and limits on waiting periods, (vii) provisions
encouraging integrated care, efficiency and coordination among providers and (viii) provisions for reduction of
healthcare program waste and fraud. ACA does not modify the dialysis reimbursement provisions of MIPPA,
except to change the annual update provision by substituting a productivity adjustment to the market basket rate
of increase for a MIPPA provision that specified a one percentage point reduction in the market basket rate of
increase. ACA’s medical device excise tax, Medicaid drug rebate increases and annual pharmaceutical industry
fees will adversely impact our product business earnings and cash flows. We expect modest favorable impact
from ACA’s integrated care and commercial insurance consumer protection provisions.

61
On August 2, 2011, the Budget Control Act (“BCA”) was enacted, raising the U.S.’s debt ceiling and putting
into effect a series of actions for deficit reduction. Pursuant to the American Taxpayer Relief Act of 2012
(“ATRA”), automatic across-the-board spending cuts over nine fiscal years (2013-2021), projected to total $1.2
trillion for all U.S. Federal government programs required under the BCA became effective as of March 1, 2013
and were implemented on April 1, 2013 for CMS reimbursement to providers. The Bipartisan Budget Act of
2013 extended the cuts to mandatory spending programs such as Medicare for an additional two years. The
reduction in Medicare payments to providers and suppliers is limited to one adjustment of no more than 2%
through 2022 (the “Sequestration”), rising to 2.9 percent for the first half of FY 2023 and dropping to 1.11
percent for the second half of FY 2023. The impact of the Sequestration based on our dialysis care revenue from
Medicare since the implementation date resulted in a decrease of approximately $56 million in operating income
for the year ended December 31, 2013. The Medicare reimbursement reduction is independent of annual
inflation update mechanisms, such as the market basket update pursuant to the ESRD PPS.
The American Taxpayer Relief Act of 2012 (“ATRA”) also directed CMS to reduce the ESRD PPS payment
rate, effective January 1, 2014, to account for changes in the utilization of certain drugs and biologicals that are
included in the ESRD PPS. In making such reduction, the law requires CMS to use the most recently available
pricing data for such drugs and biologicals. On November 22, 2013, CMS issued the final rule regarding the
2014 ESRD PPS rate. The base rate per treatment was reduced from $240.36 to $239.02 for 2014. This change
reflects (a) a bundled market basket increase of 3.2%, reduced by an estimated multifactor productivity
adjustment of 0.4%; (b) the application of a wage index budget neutrality factor and a home dialysis training
add-on budget neutrality factor; and (c) the application of a portion ($8.16) per treatment of a reduction in to
account for a decrease in the historical utilization of certain ESRD-related drugs and biologicals from 2007 to
2012. As set forth in the November 2013 final rule, CMS will phase in the ATRA reduction, which CMS
estimates will total $29.93 per treatment, over three to four years. CMS intends that the portion of the drug
utilization adjustment mandated by ATRA that will be applied in 2014 and 2015 will largely offset the net
market basket increases in average payments to ESRD facilities as a whole resulting in essentially unchanged
reimbursement rates from 2013 to 2015. In 2016, CMS will re-evaluate whether to apply the balance of the drug
utilization adjustment mandated by ATRA over the subsequent one or two years.
Any significant decreases in Medicare reimbursement rates could have material adverse effects on our
provider business and, because the demand for dialysis products is affected by Medicare reimbursement, on our
products business. To the extent that increases in operating costs that are affected by inflation, such as labor and
supply costs, are not fully reflected in a compensating increase in reimbursement rates, our business and results
of operations may be adversely affected.
On February 4, 2013, CMS announced plans to test a new Comprehensive ESRD Care Model and issued a
solicitation for applications. As currently proposed, CMS will work with up to 15 healthcare provider groups
comprised of dialysis clinics and nephrologists, also known as ESRD Seamless Care Organizations (“ESCOs”),
to test a new system of payment and care delivery that seeks to deliver better health outcomes for ESRD patients
while potentially lowering CMS’s costs. ESCOs that achieve the program’s minimum quality thresholds and
generate reductions in CMS’s cost of care above certain thresholds for the ESRD patients covered by the ESCO
will receive a share of the cost savings. ESCOs that include dialysis chains with more than 200 facilities are
required to share in the risk of cost increases and reimburse CMS a share of any such increases. Organizations
must apply and be approved by CMS to participate in the program. In August 2013, we submitted an application
to participate in the program as an ESCO. Following submission of our application, CMS announced that it
would suspend review of all applications and reopen its request for application in the winter of 2014 to solicit
additional participation and respond to stakeholder feedback. At such time, we will review CMS’ revisions and
determine whether to apply to the revised program.
We have identified three operating segments, North America Segment, EMEALA, and Asia-Pacific, which
were determined based upon how we manage our businesses. All segments are primarily engaged in providing
dialysis care services and the distribution of products and equipment for the treatment of ESRD. For reporting
purposes, we have aggregated the EMEALA and Asia-Pacific operating segments as the “International
Segment.” We aggregated these operating segments due to their similar economic characteristics. These
characteristics include same services provided and same products sold, the same type of patient population,
similar methods of distribution of products and services and similar economic environments. Our General
Partner’s management board member responsible for the profitability and cash flow of each segment’s various
businesses supervises the management of each operating segment. The accounting policies of the segments are
the same as those we apply in preparing our consolidated financial statements under U.S. GAAP.

62
Our management evaluates each segment using a measure that reflects all of the segment’s controllable
revenues and expenses. With respect to the performance of our business operations, our management believes
that the most appropriate measure in this regard is operating income which measures our source of earnings. We
do not include the effects of certain transactions, such as the investment gain resulting from our 2012 acquisition
of Liberty Dialysis Holdings, Inc. (the “Liberty Acquisition”) nor income taxes as we believe these items to be
outside the segments’ control. Financing is a corporate function which our segments do not control. Therefore,
we do not include interest expense relating to financing as a segment measurement. Similarly, we do not allocate
certain costs, which relate primarily to certain headquarters overhead charges, including accounting and finance,
global research and development, etc. (“Corporate”), because we believe that these costs are also not within the
control of the individual segments. Production of products, production asset management, quality management
and procurement are centrally managed at Corporate by Global Manufacturing Operations. These Corporate
activities do not fulfill the definition of a segment. Products are transferred to the segments at cost; therefore no
internal profit is generated. The associated internal revenues for the product transfers and their elimination are
recorded as Corporate activities (See Note 24 of the Notes to Consolidated Financial Statements “Segment and
Corporate Information” found elsewhere in this report). Capital expenditures for production are based on the
expected demand of the segments and consolidated profitability considerations. In addition, certain revenues,
investments, and intangible assets, as well as any related expenses, are not allocated to a segment but accounted
for as Corporate. Accordingly, all of these items are excluded from our analysis of segment results and are
discussed below in our consolidated results of operations.

63
A. Results of Operations
The following tables summarize our financial performance and certain operating results by principal
reporting segment and Corporate for the periods indicated. Inter-segment sales primarily reflect sales of medical
equipment and supplies. We prepared the information using a management approach, consistent with the basis
and manner in which our management internally disaggregates financial information to assist in making internal
operating decisions and evaluating management performance.
2013 2012 2011
(in millions)
Total revenue
North America $ 9,613 $ 9,041 $ 7,935
International 4,970 4,740 4,628
Corporate 34 29 17
Totals 14,617 13,810 12,580
Inter-segment revenue
North America 7 10 9
International - - -
Totals 7 10 9
Total net revenue
North America 9,606 9,031 7,926
International 4,970 4,740 4,628
Corporate 34 29 17
Totals 14,610 13,800 12,571
Operating income
North America 1,624 1,615 1,435
International 858 809 807
Corporate (226) (205) (167)
Totals 2,256 2,219 2,075
Investment gain - 140 -
Interest income 39 44 60
Interest expense (448) (470) (357)
Income tax expense (592) (605) (601)
Net Income 1,255 1,328 1,177
Less: Net Income attributable to Noncontrolling interests (145) (141) (106)
Net Income attributable to shareholders of FMC-AG & Co. KGaA $ 1,110 $ 1,187 $ 1,071

64
Year ended December 31, 2013 compared to year ended December 31, 2012
Highlights
Revenues increased by 6% to $14,610 million (6% at constant exchange rates) mainly due to organic growth
of 5% and contributions from acquisitions of 2%, partially offset by the effect of closed or sold clinics of 1%.
Operating income increased 2%.
Net income attributable to shareholders of FMC-AG & Co. KGaA decreased by 6% to $1,110 million.
However excluding the 2012 investment gain of $140 million related to the Liberty Acquisition, net income
attributable to shareholders of FMC-AG & Co. KGaA increased 6% from $1,047 in 2012.
Consolidated Financials
Key Indicators for Consolidated Financial Statements
Change in %
as
reported
at Constant
Exchange
Rates (1)
2013
2012
Revenue in $ million 14,610 13,800 6% 6%
Number of treatments 40,456,900 38,588,184 5%
Same market treatment growth in % 3.6% 3.8%
Gross profit as a % of revenue 32.4% 33.3%
Selling, general and administrative costs as a
% of revenue 16.4% 16.1%
Operating income in $ million 2,256 2,219 2%
Operating income margin in % 15.4% 16.1%
Net income attributable to shareholders of
FMC-AG & Co. KGaA in $ million 1,110 1,187 (6%)
Basic earnings per share in $ 3.65 3.89 (6%)
(1) For further information on Constant Exchange Rates, see "Non-U.S. GAAP Measures for Presentation - Constant Currency" above.
Net dialysis care revenue increased by 6% to $11,130 million (7% at Constant Exchange Rates) for the year
ended December 31, 2013 from $10,492 million in the same period of 2012, mainly due to growth in same
market treatments (4%), contributions from acquisitions (3%), and increases in organic revenue per treatment
(1%), partially offset by the effect of closed or sold clinics (1%) and the negative impact of exchange rate
fluctuations (1%).
Treatments increased by 5% for the twelve months ended December 31, 2013 as compared to the same
period in 2012. The increase is due to same market treatment growth (4%) and acquisitions (3%), partially offset
by the effect of closed or sold clinics (2%).
At December 31, 2013, we owned, operated or managed (excluding those managed but not consolidated in
the U.S.) 3,250 clinics compared to 3,160 clinics at December 31, 2012. During 2013, we acquired 50 clinics,
opened 80 clinics and combined or closed 40 clinics. The number of patients treated in clinics that we own,
operate or manage (excluding patients of clinics managed but not consolidated in the U.S.) increased by 5% to
270,122 at December 31, 2013 from 257,916 at December 31, 2012.
Dialysis product revenue increased by 5% (5% increase at Constant Exchange Rates) to $3,480 million as
compared to $3,308 million in the same period of 2012. The increase was driven by increased sales of
hemodialysis products, especially of dialyzers, machines, solutions and concentrates, and bloodlines as well as
products for acute care and peritoneal dialysis products, partially offset by lower sales of renal pharmaceuticals.
There was no material impact from foreign exchange effects.
The decrease in gross profit margin to 32.4% from 33.3% reflects a decrease in the North America Segment,
partially offset by an increase in the International Segment. The decrease in the North America Segment was due

65
to higher personnel expense, the 2012 impact of special collection efforts in the prior year, lower commercial
payor mix coupled with price reductions from commercial contracting, increased revenue in the Expanded
Services at lower than average margins, and the impact of the U.S. Sequestration. These decreases were partially
offset by reduced pharmaceutical utilization and the updated Medicare reimbursement rate which came into
effect in 2013. The increase in the International Segment was due to favorable foreign currency exchange effects
and lower manufacturing costs driven by decreases in labor costs, facilities operating costs and cost for raw
materials, partially offset by price pressure on products and business growth in China, however at lower margins.
SG&A expenses increased to $2,391 million in the year ended December 31, 2013 from $2,223 million in
the same period of 2012. SG&A expenses as a percentage of sales increased to 16.4% for the twelve months of
2013 in comparison with 16.1% in the same period of 2012 due to an increase in the International Segment an
unfavorable impact from Corporate and a slight increase in the North America Segment. The increase in the
International Segment was mainly driven by higher bad debt expense in Asia-Pacific, unfavorable foreign
exchange effects including devaluation of the Venezuelan Bolivar due to a hyperinflationary economy and
various cost increases, partially offset by a gain on the sale of real estate in Colombia. The increase at Corporate
was due to increased legal and consulting expenses attributable in significant part to the internal investigation we
are conducting (see Note 20 of the Notes to Consolidated Financial Statements), partially offset by lower
compensation expenses.
For the twelve months ended 2013, we had an $8 million gain from the sale of FMC-AG & Co. KGaA
dialysis clinics in our North America Segment and a $1 million gain in the International Segment as compared to
a $36 million gain in the same period of the prior year mainly in connection with divestitures required for
regulatory clearance of the Liberty Acquisition, which occurred in the first quarter of 2012. (See Note 2 of the
Notes to Consolidated Financial Statements, “Acquisition of Liberty Dialysis Holdings, Inc. – Divestitures”
included in this report).
Research and development (“R&D”) expenses increased to $126 million for the year ended December 31,
2013 as compared to $112 million in the same period in 2012. This increase was driven by major product
developments as well as the expansion of strategic projects during the year.
Income from equity method investees increased to $26 million for the twelve months ended December 31,
2013 from $17 million for the same period of 2012 due to increased income from the VFMCRP renal
pharmaceuticals joint venture.
In 2012, other operating expense was $100 million due to charges incurred in connection with the
amendment of our agreement with Luitpold Pharmaceuticals and American Regent, Inc. regarding Venofer®.
Operating income increased to $2,256 million for the year ended December 31, 2013 from $2,219 million
for the same period in 2012. Operating income margin decreased to 15.4% for the year ended December 31,
2013 as compared to 16.1% for the same period in 2012 as a result of the decrease in gross profit margin, higher
SG&A as a percentage of revenue and a lower gain on the sale of FMC-AG & Co. KGaA clinics, partially offset
by the effect of the other operating expense in 2012, all as discussed above.
The non-taxable investment gain for 2012 of $140 million was due to the fair valuation of our investment in
Renal Advantage Partners, LLC at the time of the 2012 Liberty Acquisition.
Interest expense decreased by 5% to $448 million for the twelve months ended December 31, 2013 from
$470 million for the same period in 2012 due to a decrease in the average debt level during the year, lower
interest rates due to the expiration of interest rates swaps at the end of the first quarter of 2012, as well as the
2012 effect of one-time costs related to the new Credit Agreement. Interest income decreased to $39 million for
the twelve months ended December 31, 2013 from $44 million for the same period in 2012 mainly as a result of
lower interest income from high interest-bearing notes receivables.
Income tax expense decreased to $592 million for the year ended December 31, 2013 from $605 million for
the same period in 2012. The effective tax rate increased to 32.0% from 31.3% for the same period of 2012, as a
result of a non-taxable investment gain in 2012.
Net income attributable to noncontrolling interests for the twelve months ended December 31, 2013
increased to $145 million from $141 million for the same period of 2012 primarily due to losses attributable to
noncontrolling interests in the International Segment in 2012.

66
Net income attributable to shareholders of FMC-AG & Co. KGaA for the twelve months ended December
31, 2013 decreased 6% to $1,110 million from $1,187 million for the same period in 2012 as a result of the
combined effects of the items discussed above. Excluding the investment gain in the amount of $140 million as
noted above the net income attributable to shareholders of FMC-AG & Co. KGaA for the twelve months ended
December 31, 2013 increased 6% to $1,110 million from $1,047 million for the same period in 2012.
Basic earnings per share decreased by 6% for the twelve months ended December 31, 2013 to $3.65 as
compared with $3.89 in 2012 due to the decrease in net income attributable to shareholders of FMC-AG & Co.
KGaA above. The average weighted number of shares outstanding for the period was approximately 303.8
million in 2013 (305.1 million in 2012). The decrease in the number of shares outstanding was the result the
share buyback program completed during the year, partially offset by stock options exercised.
We employed 90,690 people (full-time equivalents) as of December 31, 2013 compared to 86,153 as of
December 31, 2012, an increase of 5%, primarily due to overall growth in our business and acquisitions.
The following discussions pertain to the North America Segment and the International Segment and the
measures we use to manage these segments.
North America Segment
Key Indicators for North America Segment
2013 2012 Change in %
Revenue in $ million 9,606 9,031 6%
Number of treatments 25,656,357 24,412,416 5%
Same market treatment growth in % 3.5% 3.6%
Operating income in $ million 1,624 1,615 1%
Operating income margin in % 16.9% 17.9%
Revenue
Net dialysis care revenue increased for the year ended December 31, 2013 by 7% to $8,772 million from
$8,230 million in the same period of 2012. This increase was driven by same market treatment growth (4%) and
contributions from acquisitions (3%).
Treatments increased by 5% for the year ended December 31, 2013 as compared to the same period in 2012
mostly due to same market treatment growth (4%) and acquisitions (2%), partially offset by the effect of closed
or sold clinics (1%). At December 31, 2013, 171,440 patients (a 4% increase over December 31, 2012) were
being treated in the 2,133 clinics that we own or operate in the North America Segment, compared to 164,554
patients treated in 2,082 clinics at December 31, 2012. Average North America Segment revenue per treatment,
which includes Canada and Mexico, before bad debt expense, was $352 for the year ended December 31, 2013
and $348 in the same period in 2012. In the U.S., the average revenue per treatment was $359 for the year ended
December 31, 2013 and $355 for the same period in 2012. The increase in the U.S. was mainly attributable to
further development of our Expanded Services and the updated Medicare reimbursement rate which came into
effect in 2013, partially offset by the effects of the 2012 increase in revenue from special collection efforts for
services performed in prior years, the unfavorable impact of the U.S. Sequestration, and unfavorable commercial
payor mix coupled with price reductions from commercial contracting.
Dialysis product revenue increased for the year ended December 31, 2013 by 4% to $834 million from $801
million in the first twelve months of 2012. This increase was driven by higher sales of dialyzers, partially offset
by lower sales of peritoneal dialysis products and machines.
Operating Income
Operating income increased to $1,624 million for the year ended December 31, 2013 from $1,615 million
for the same period in 2012. Operating income margin decreased to 16.9% for the year ended December 31,
2013 from 17.9% for the same period in 2012, due to higher personnel expense, the effects of the 2012 impact of
special collection efforts in prior years, the impact of the U.S. Sequestration, a lower commercial payor mix
coupled with price reductions from commercial contracting, and increased revenue in the Expanded Services at
lower than average margins. Further, the margin was impacted by the lower gain on the sale of FMC-AG & Co.
KGaA clinics related to the Liberty Acquisition resulting from fewer clinics sold in 2013 as compared to 2012

67
and increased legal costs. These effects were partially offset by the effects of 2012 charges incurred in
connection with the amendment of our agreement with Luitpold Pharmaceuticals and American Regent, Inc.
regarding Venofer®, the updated Medicare reimbursement rate which came into effect in 2013, reduced
pharmaceutical utilization, and the effect of one-time costs related to the Liberty Acquisition. Cost per treatment
for the North America Segment increased to $287 for the year ended December 31, 2013 as compared to $278
the same period of 2012. Cost per treatment in the U.S. increased to $293 for the year ended December 31, 2013
from $283 in the same period of 2012.
International Segment
Key Indicators for International Segment
Change in %
as
reported
at Constant
Exchange
Rates(1)
2013
2012
Revenue in $ million 4,970 4,740 5% 6%
Number of treatments 14,800,543 14,175,768 4%
Same market treatment growth in % 3.8% 4.0%
Operating income in $ million 858 809 6%
Operating income margin in % 17.3% 17.1%
(1) For further information on Constant Exchange Rates, see "Non-U.S. GAAP Measures for Presentation- Constant Currency" above.
Revenue
Including the effects of acquisitions, European region revenue increased 5% (3% at Constant Exchange
Rates) to $3,023 million, Latin America region revenue increased 5% (15% at Constant Exchange Rates) to $843
million, and Asia-Pacific region revenue increased 6% (8% at Constant Exchange Rates) to $1,104 million.
Net dialysis care revenue for the International Segment increased during the year ended December 31, 2013
by 4% (7% at Constant Exchange Rates) to $2,358 million from $2,262 million in the same period of 2012. This
increase is a result of same market treatment growth (4%), contributions from acquisitions (3%) and increases in
organic revenue per treatment (2%), partially offset by the negative effect of exchange rate fluctuations (3%) and
the effect of closed or sold clinics (2%).
Treatments increased by 4% for the year ended December 31, 2013 over the same period in 2012 mainly due
to same market treatment growth (4%) and contributions from acquisitions (2%), partially offset by the effect of
closed or sold clinics (2%). As of December 31, 2013, we had 98,682 patients (a 6% increase over December 31,
2012) being treated at the 1,117 clinics that we own, operate or manage in the International Segment compared
to 93,362 patients treated at 1,078 clinics at December 31, 2012. Average revenue per treatment for the year
ended December 31, 2013 decreased to $159 from $160 in comparison with the same period of 2012 due to
increased reimbursement rates and changes in country mix ($4), offset by weakening of local currencies against
the U.S. dollar ($5).
Dialysis product revenue for the year ended December 31, 2013 increased by 5% (5% increase at Constant
Exchange Rates) to $2,612 million compared to $2,478 million in the same period of 2012. The 5% increase in
product revenue was driven by increased sales of hemodialysis products, especially of machines, solutions and
concentrates, dialyzers, and bloodlines as well as products for acute care treatments and peritoneal dialysis,
partially offset by lower sales of renal pharmaceuticals.
Operating Income
Operating income increased to $858 million for the year ended December 31, 2013 as compared to $809
million for the same period in 2012. Operating income margin increased to 17.3% for the year ended December
31, 2013 from 17.1% for the same period in 2012 mainly due to a gain on the sale of real estate in Colombia, and
lower manufacturing costs driven by decreases in labor costs, facilities operating costs and cost for raw
materials, partially offset by higher bad debt expense in Asia-Pacific.

68
Inflationary Accounting
As we are subject to foreign exchange risk, we monitor the economic conditions of the countries in which
we operate. Venezuela has been considered a hyperinflationary economy since 2010, most recently reaffirmed
by the International Practices Task Force in May 2013. Effective January 1, 2013 our operations in Venezuela
were still considered to be operating in a hyperinflationary economy, as the Venezuelan economy had a three-
year cumulative inflation rate of approximately 100%. We use a blend of the National Consumer Price Index and
the Consumer Price Index to determine whether Venezuela is a hyperinflationary economy. As a result, the
financial statements of our subsidiaries operating in Venezuela continue to use the U.S. dollar as their functional
currency. However, in 2013, the Venezuelan government revalued the Bolivar. Consequently, we recorded a pre-
tax loss of $15 million for the twelve months ended December 31, 2013.
Year ended December 31, 2012 compared to year ended December 31, 2011
Consolidated Financials
Highlights
Revenues increased by 10% to $13,800 million (12% at constant exchange rates) mainly due to
contributions from acquisitions of 8% and organic growth of 5%, partially offset by the effect of closed or sold
clinics 1%.
Operating income increased 7%.
Net Income attributable to shareholders of FMC-AG & Co. KGaA increased by 11%.
In 2012, we also successfully completed the Liberty Acquisition, renegotiated one of our credit facilities and
issued senior notes.
Key Indicators for Consolidated Financial Statements
Change in %
as
reported
at Constant
Exchange
Rates(1)
2012
2011
Revenue in $ million 13,800 12,571 10% 12%
Number of treatments 38,588,184 34,388,422 12%
Same market treatment growth in % 3.8% 3.9%
Gross profit as a % of revenue 33.3% 33.0%
Selling, general and administrative costs as a %
of revenue 16.1% 15.9%
Operating income in $ million 2,219 2,075 7%
Operating income margin in % 16.1% 16.5%
Net income attributable to shareholders of FMC-
AG & Co. KGaA in $ million 1,187 1,071 11%
Basic earnings per share in $ 3.89 3.54 10%
(1) For further information on Constant Exchange Rates, see "Non-U.S. GAAP Measures for Presentation- Constant Currency" above.
Net dialysis care revenue increased by 13% to $10,492 million (15% at Constant Exchange Rates) for the
year ended December 31, 2012 from $9,283 million in the same period of 2011, mainly due to contributions
from acquisitions (12%), growth in same market treatments (4%), partially offset by the negative effect of
exchange rate fluctuations (2%) and the effect of closed or sold clinics (1%).
Treatments increased by 12% for the twelve months ended December 31, 2012 as compared to the same
period in 2011. The increase is due to acquisitions (9%), including the effect of the Liberty Acquisition (6%) and
same market treatment growth (4%), partially offset by the effect of closed or sold clinics (1%).

69
At December 31, 2012, we owned, operated or managed (excluding those managed but not consolidated in
the U.S.) 3,160 clinics compared to 2,898 clinics at December 31, 2011. During 2012, we acquired 276 clinics,
opened 65 clinics and combined or closed 79 clinics. The number of patients treated in clinics that we own,
operate or manage (excluding patients of clinics managed but not consolidated in the U.S.) increased by 11% to
257,916 at December 31, 2012 from 233,156 at December 31, 2011. Including 32 clinics managed but not
consolidated in the U.S., the total number of patients was 260,282.
Dialysis product revenue increased by 1% (5% increase at constant exchange rates) to $3,308 million
compared to $3,288 million in the same period of 2011. The increase at constant currency was driven by
increased sales of hemodialysis products, especially of machines, bloodlines and dialyzers as well as peritoneal
dialysis products, partially offset by lower sales of renal pharmaceuticals.
The increase in gross profit margin mostly reflects an increase in gross profit margin in the North America
Segment, partially offset by a decrease in the International Segment. The increase in the North America Segment
was due to higher revenue rate associated with Medicare, special collection efforts for services performed in
prior years and the impact of the Liberty Acquisition, which contributed higher gross margins, partially offset by
higher personnel expenses. The decrease in the International Segment was mainly due to lower margin sales in
the dialysis care business.
Selling, general and administrative (“SG&A”) expenses increased to $2,223 million for the year ended
December 31, 2012 from $2,002 million in the same period of 2011. SG&A expenses as a percentage of sales
increased to 16.1% for the year ended December 31, 2012 from 15.9% in the same period of 2011 as a result of
an increase in the North America Segment and in Corporate. The increase in the North America Segment was a
result of higher personnel expense, and one-time costs related to the Liberty Acquisition, partially offset by the
impact of that acquisition due to LD Holdings’ lower SG&A expenses as a percentage of revenue. The increase
in Corporate was mainly driven by a $10 million charitable donation to the American Society of Nephrology to
establish a research fellowship program and increased legal costs.
In the year ended December 31, 2012, we had a $36 million gain from the sale of dialysis clinics, including
$33 million from the sale of 24 FMC-AG & Co. KGaA clinics, in connection with regulatory clearance of the
Liberty Acquisition, which occurred in the first quarter of 2012. (See Note 2 of the Notes to Consolidated
Financial Statements, “Acquisition of Liberty Dialysis Holdings – Divestitures” included in this report.)
Research and development (“R&D”) expenses increased slightly to $112 million for the year ended
December 31, 2012 as compared to $111 million in the same period in 2011.
Income from equity method investees decreased to $17 million for the twelve months ended December 31,
2012 from $31 million for the same period of 2011 due to reduced income from the VFMCRP renal
pharmaceuticals joint venture.
Other operating expense was $100 million due to charges incurred in connection with the amendment of our
agreement with Luitpold Pharmaceuticals and American Regent, Inc. regarding Venofer®. (See Note 4 of the
Notes to Consolidated Financial Statements, “Inventories” found elsewhere in this report.)
Operating income increased to $2,219 million for the year ended December 31, 2012 from $2,075 million
for the same period in 2011. Operating income margin decreased to 16.1% for the year ended December 31,
2012 as compared to 16.5% for the same period in 2011 as a result of the charge incurred for the amendment to
the agreement regarding Venofer® and higher SG&A as a percentage of revenue, partially offset by the increase
in gross profit margin and the gain on the sale of FMC-AG & Co. KGaA clinics, all as discussed above.
For the twelve months ended December 31, 2012, we recognized a non-taxable investment gain of $140
million related to the Liberty Acquisition as a result of a fair valuation of our investment in Renal Advantage
Partners, LLC at the time of the acquisition.
Interest expense increased by 32% to $470 million for the twelve months ended December 31, 2012 from
$357 million for the same period in 2011 mainly as a result of increased debt incurred to finance the Liberty
Acquisition. Interest income decreased to $44 million for the twelve months ended December 31, 2012 from $60
million for the same period in 2011.
Income tax expense increased to $605 million for the year ended December 31, 2012 from $601 million for
the same period in 2011. The effective tax rate decreased to 31.3% from 33.8% for the same period of 2011, as a
result of the nontaxable investment gain noted above.

70
Net income attributable to FMC-AG & Co. KGaA for the twelve months ended December 31, 2012
increased 11% to $1,187 million from $1,071 million for the same period in 2011 as a result of the combined
effects of the items discussed above.
Basic earnings per share rose by 10% in 2012 to $3.89 compared with $3.54 in 2011. The average weighted
number of shares outstanding in 2012 was approximately 305.1 million (303.0 million in 2011). The increase in
the number of shares outstanding was the result of stock options exercises.
We employed 86,153 people (full-time equivalents) as of December 31, 2012 compared to 79,159 as of
December 31, 2011, an increase of 8.8%, primarily due to overall growth in our business and acquisitions.
The following discussions pertain to the North America Segment and the International Segment and the
measures we use to manage these segments.
North America Segment
Key Indicators for North America Segment
2012 2011 Change in %
Revenue in $ million 9,031 7,926 14%
Number of treatments 24,412,416 21,608,620 13%
Same market treatment growth in % 3.6% 3.2%
Operating income in $ million 1,615 1,435 13%
Operating income margin in % 17.9% 18.1%
Revenue
Net dialysis care revenue increased for the year ended December 31, 2012 by 16% to $8,230 million from
$7,113 million in the same period of 2011. This increase was driven by contributions from acquisitions (13%),
same market treatment growth (4%) and the impact of the special collection efforts (1%), partially offset by the
effect of closed or sold clinics (1%) and higher bad debt expense (1%).
Treatments increased by 13% for the twelve months ended December 31, 2012 as compared to the same
period in 2011 mostly due to the Liberty Acquisition, net of divestitures (7%), same market growth (4%) and
contributions from other acquisitions (3%), partially offset by the effect of closed or sold clinics (1%). At
December 31, 2012, 164,554 patients (a 16% increase over December 31, 2011) were being treated in the 2,082
clinics that we own or operate in the North America Segment, compared to 142,319 patients treated in 1,838
clinics at December 31, 2011. Average North America Segment revenue per treatment, which includes Canada
and Mexico, before bad debt expense, was $348 for the twelve months ended December 31, 2012 and $340 in
the same period in 2011. In the U.S., the average revenue per treatment was $355 for the twelve months ended
December 31, 2012 and $348 for the same period in 2011. The increase was mainly attributable to further
development of our expanded service offerings, a modest increase in commercial rates, the impact of the
increase in Medicare reimbursement from the updated Medicare reimbursement rate and removal of the
Transition Adjuster which occurred in the first quarter of 2011 as well as increased revenue due to the special
collection efforts for services performed in prior years. This improvement was partially offset by reduced
pharmaceutical utilization in non-bundled commercial treatments.
The dialysis product revenue decreased for the year ended December 31, 2012 to $801 million from $813
million in the same period of 2011. This decrease was driven by lower sales of renal pharmaceuticals, machines
and dialyzers, partially offset by higher sales of bloodlines and other hemodialysis products. The decrease in
machines and dialyzers was mainly caused by the Liberty Acquisition, which resulted in the conversion of third
party sales into internal sales.
Operating Income
Operating income increased to $1,615 million for the year ended December 31, 2012 from $1,435 million
for the same period in 2011. Operating income margin decreased to 17.9% for the year ended December 31,
2012 from 18.1% for the same period in 2011, primarily due to higher personnel expenses, the $100 million

71
impact of the amendment of the agreement regarding Venofer® and costs related to the Liberty Acquisition,
partially offset by higher revenue per treatment rate associated with Medicare, the positive impact of the Liberty
Acquisition, including acquisition-related divestiture gains and special collection efforts for services performed
in prior years. Cost per treatment for the North America Segment increased to $278 for the year ended December
31, 2012 from $276 in 2011. Cost per treatment in the U.S. increased to $283 for the year ended December 31,
2012 from $282 in the same period of 2011.
International Segment
Key Indicators for International Segment
Change in %
as
reported
at Constant
Exchange
Rates(1)
2012
2011
Revenue in $ million 4,740 4,628 2% 9%
Number of treatments 14,175,768 12,779,802 11%
Same market treatment growth in % 4.0% 5.4%
Operating income in $ million 809 807 0%
Operating income margin in % 17.1% 17.4%
(1) For further information on Constant Exchange Rates, see "Non-U.S. GAAP Measures for Presentation - Constant Currency" above.
Revenue
Including the effects of acquisitions, European region revenue decreased 2% (6% increase at constant
exchange rates) to $2,893, Latin America region revenue increased 15% (24% at constant exchange rates) to
$804, and Asia-Pacific region revenue increased 6% (7% at constant exchange rates) to $1,043.
Net dialysis care revenue for the International Segment increased for the year ended December 31, 2012 by
4% (11% increase at constant exchange rates) to $2,262 million from $2,170 million in the same period of 2011.
This increase is a result of contributions from acquisitions (7%), same market treatment growth (4%) and
increases in organic revenue per treatment (2%), partially offset by the negative effect of exchange rate
fluctuations (7%) and the effect of closed or sold clinics (2%).
Treatments increased by 11% in the twelve months ended December 31, 2012 over the same period in 2011
mainly due to contributions from acquisitions (8%) and same market growth (4%), partially offset by the effect
of closed or sold clinics (1%). As of December 31, 2012, we had 93,362 patients (a 3% increase over December
31, 2011) being treated at the 1,078 clinics that we own, operate or manage in the International Segment
compared to 90,837 patients treated at 1,060 clinics at December 31, 2011. Average revenue per treatment for
the twelve months ended December 31, 2012 decreased to $160 in comparison with $170 for the same period of
2011 due to the weakening of local currencies against the U.S. dollar ($11), partially offset by slightly increased
reimbursement rates and changes in country mix ($1).
Dialysis product revenue for the year ended December 31, 2012 increased by 1% (7% increase at constant
exchange rates) at $2,478 million compared to $2,458 million in the same period of 2011. The 7% increase in
product revenue at constant currency was driven by increased sales of hemodialysis products, especially of
machines, dialyzers, bloodlines and products for acute care as well as peritoneal dialysis products.
Operating Income
Operating income remained relatively flat at $809 million compared to $807 million for the same period in
2011. Operating income margin decreased to 17.1% for the twelve months ended December 31, 2012 from
17.4% for the same period in 2011 mainly due to lower margin sales in our dialysis care business, partially offset
by favorable foreign currency exchange effects and business growth in Asia, mainly China.

72
B. Liquidity and Capital Resources
Our primary sources of liquidity are typically cash provided by operating activities, cash provided by short-
term borrowings from third parties and related parties, as well as proceeds from the issuance of long-term debt
and equity securities. We require this capital primarily to finance working capital needs, fund acquisitions and
joint ventures, develop free-standing renal dialysis centers, purchase equipment for existing or new renal dialysis
centers and production sites, repay debt, pay dividends, and repurchase shares (see “Financing” section below).
At December 31, 2013, we had cash and cash equivalents of $683 million. For information regarding
utilization and availability of cash under our principal credit facility (the “2012 Credit Agreement”), see Note 11
of the Notes to Consolidated Financial Statements, “Long-term Debt and Capital Lease Obligations and Long-
Term Debt from Related Parties – 2012 Credit Agreement,” included in this report.
Net Cash Provided By (Used In) Operating Activities
In 2013, 2012, 2011, net cash provided by operating activities was $2,035 million, $2,039 million and
$1,446 million, respectively. Cash provided by operating activities is impacted by the profitability of our
business, the development of our working capital, principally receivables, and cash outflows that occur due to a
number of specific items as discussed below. The slight decrease in 2013 versus 2012 was mainly a result of a
$100 million payment, partially offset by the favorable effects of other working capital items including
repayments received, both of which were associated with the amendment to the license agreement relating to our
iron product Venofer®.
The profitability of our business depends significantly on reimbursement rates. Approximately 76% of our
revenues are generated by providing dialysis services, a major portion of which is reimbursed by either public
health care organizations or private insurers. For the twelve months ended December 31, 2013, approximately
32% of our consolidated revenues were attributable to U.S. federal health care benefit programs, such as
Medicare and Medicaid reimbursement. Legislative changes could affect Medicare reimbursement rates for a
significant portion of the services we provide, as well as the scope of Medicare coverage. A decrease in
reimbursement rates or the scope of coverage could have a material adverse effect on our business, financial
condition and results of operations and thus on our capacity to generate cash flow. With the exception of (i) the
implementation of the ESRD PPS in the U.S. in January 2011, (ii) the U.S. federal government Sequestration
cuts and (iii) commencing January 1, 2014, the phased-in reductions to the ESRD PPS rate over three to four
years to account for the decline in utilization of certain drugs and biologicals associated with dialysis, we have
experienced and also expect in the future to experience generally stable reimbursements for dialysis services.
This includes the balancing of unfavorable reimbursement changes in certain countries with favorable changes in
other countries.
Our working capital, which is defined as current assets less current liabilities, was $2,733 million at
December 31, 2013 which decreased from $2,957 million at December 31, 2012. The change is primarily the
result of an increase accrued expenses and other current liabilities, as well as an increase in the amount
reclassified from long-term debt to the current portion of long-term debt as a result of larger quarterly payments
becoming due under the 2012 Credit Agreement, the reclassification of the Euro tranche of our European
Investment Bank (“EIB”) Agreements for amounts which were due and paid in February 2014 and for Euro
Notes due in 2014, and a reclassification of a loan with a related party from long-term debt to short-term
borrowings, partially offset by a reduction in accounts payable driven by the payment of the $100 million
Venofer® agreement amendment fee incurred in 2012. Our ratio of current assets to current liabilities was 1.77 at
December 31, 2013.
We intend to continue to address our current cash and financing requirements using cash provided by
operating activities, our existing and future credit agreements, and the issuance of debt securities. In addition,
when funds are required for acquisitions or to meet other needs, we expect to successfully complete long-term
financing arrangements, such as the issuance of senior notes, see “Financing” below. We aim to preserve
financial resources with a minimum of $300 to $500 million of committed and unutilized credit facilities.
Cash provided by operating activities depends on the collection of accounts receivable. Commercial
customers and governments generally have different payment cycles. A lengthening of their payment cycles
could have a material adverse effect on our capacity to generate cash flow. In addition, we could face difficulties
in enforcing and collecting accounts receivable under some countries' legal systems and due to the economic
conditions in some countries. Accounts receivable balances at December 31, 2013 and December 31, 2012, net
of valuation allowances, represented DSO of approximately 73 and 76, respectively.

73
DSO by segment is calculated by dividing the segment’s accounts receivable, as converted to U.S. dollars
using the average exchange rate for the period presented, less any value added tax included in the receivables, by
the average daily sales for the last twelve months of that segment, as converted to U.S. dollars using the average
exchange rate for the period. Receivables and sales are adjusted for amounts related to significant acquisitions
made during the periods presented. The development of DSO by reporting segment is shown in the table below:
December 31, December 31,
2013 2012
North America Segment days sales outstanding 53 55
International Segment days sales outstanding 110 115
FMC-AG & Co. KGaA average days sales outstanding 73 76
The decrease in the North America Segment is due to continued strong cash performance across all payor
groups. The International Segment’s DSO decrease reflects increased collections in Europe, partially offset by
unfavorable DSO development in Asia-Pacific. Due to the fact that a large portion of our reimbursement is
provided by public health care organizations and private insurers, we expect that most of our accounts receivable
will be collectible. However, we have experienced some collection delays with distributors in a few Asia-Pacific
countries.
We are subject to ongoing and future tax audits in the U.S., Germany and other jurisdictions. As a result of a
tax audit we identified a tax item relating to civil settlement payment deductions taken by FMCH in prior year
tax returns that will or could impact our financial results in the future (see Note of the Notes to the Consolidated
Financial Statements 20 “Commitments and Contingencies-Other Litigation and Potential Exposures” for further
details on this tax matter).We have also received notices of unfavorable adjustments and disallowances in
connection with certain of the audits, including those described above. We are contesting, including appealing,
certain of these unfavorable determinations. If our objections and any final audit appeals are unsuccessful, we
could be required to make additional tax payments, including payments to state tax authorities reflecting the
adjustments made in our federal tax returns in the U.S. With respect to other potential adjustments and
disallowances of tax matters currently under review, we do not anticipate that an unfavorable ruling could have a
material impact on our results of operations. We are not currently able to determine the timing of these potential
additional tax payments.
Net Cash Provided By (Used In) Investing Activities
We used net cash of $1,206 million, $2,281 million and $2,346 million in investing activities in 2013, 2012
and 2011, respectively.
Capital expenditures for property, plant and equipment, net of proceeds from sales of property, plant and
equipment were $728 million, $666 million and $570 million in 2013, 2012 and 2011, respectively. In 2013,
capital expenditures were $374 million in the North America Segment, $189 million for the International
Segment and $165 million at Corporate. Capital expenditures in 2012 were $298 million in the North America
Segment, $195 million for the International Segment and $173 million at Corporate. In 2011, capital
expenditures were $237 million in the North America Segment, $175 million for the International Segment and
$158 million at Corporate. The majority of our capital expenditures was used for maintaining existing clinics,
equipping new clinics, maintenance and expansion of production facilities, primarily in Germany, the North
America Segment, France and China and capitalization of machines provided to our customers, primarily in the
International Segment. Capital expenditures were approximately 5% of total revenue in 2013, 2012 and 2011.
In addition to the capital expenditures discussed above, we invested approximately $496 million cash in
2013, $412 million in the North America Segment, $82 million in the International Segment and $2 million at
Corporate. In the North America Segment this included, an investment-type loan made by FMCH granting a
$200 million credit facility to a middle market dialysis provider in the third quarter of 2013 (of which $170 was
drawn as of December 31, 2013; see Note 8 of the Notes to the Consolidated Financial Statements “Other Assets
and Notes Receivables”), as well as the acquisition of a full-service clinical laboratory. In the International
Segment this mainly included acquisitions of dialysis clinics. In 2012, we invested approximately $1,879 in
cash, $1,849 million in the North America Segment, primarily through the $1,697 million ($1,466 million net of
divestitures) acquisition of Liberty (see Note 2 of the Notes to the Consolidated Financial Statements,

74
“Acquisition of Liberty Dialysis Holdings”), $28 million in the International Segment and $2 million at
Corporate. In 2011, we invested approximately $1,785 million in cash ($818 million in the North America
Segment, $960 million in the International Segment, and $7 million at Corporate), primarily for the acquisitions
of International Dialysis Centers, the dialysis service business of Euromedic International, and American Access
Care Holdings, LLC, which operates vascular access centers, loans provided to, as well as the purchase of a 49%
ownership interest in Renal Advantage Partners LLC, the parent company of Renal Advantage, Inc., a provider
of dialysis services, and payments for the extension of the activities of VFMCRP. We received $18 million, $264
million and $10 million in conjunction with divestitures in 2013, 2012 and 2011, respectively.
We anticipate capital expenditures of approximately $0.9 billion and expect to make acquisitions of
approximately $0.4 billion in 2014. See “Outlook” below.
Net Cash Provided By (Used In) Financing Activities
Net cash used in financing activities was $808 million in 2013 compared to net cash provided by financing
activities of $468 million in 2012 and $793 million in 2011.
In 2013, cash was used in the purchase of our shares through a share buyback program, the repayment of
portions of long-term debt and short-term borrowings, the payment of dividends, and distributions to
noncontrolling interests, partially offset by proceeds from long-term and short-term borrowings, proceeds from
the draw-down under our Accounts Receivable facility, proceeds the exercise of stock options and proceeds of a
premium paid for the conversion of preference shares into ordinary shares by the largest former holder of
preference shares, a European financial institution. In 2012, cash was provided by the issuance of senior notes,
refinancing of the then-current Amended 2006 Senior Credit Agreement by the 2012 Credit Agreement,
exercises of stock options, proceeds from short-term borrowings and short term borrowings from related parties
as well as contributions from noncontrolling interests, partially offset by the repayment of long-term debt,
reduction of the amount outstanding under our accounts receivable securitization program, the payment of
dividends, distributions to noncontrolling interests as well as the repayment of short-term borrowings and short-
term borrowings from related parties. In 2011, cash was provided by the issuance of senior notes in February
2011, September 2011, and October 2011, short-term borrowings and short-term borrowings from related
parties, partially offset by repayment of long-term debt, the repayment of the Trust Preferred Securities, the
repayment of short-term borrowings and short-term borrowings from related parties as well as the payment of
dividends
On May 16, 2013, we held our AGM and a separate Preference Shareholder Meeting during which
resolutions on the conversion of our preference shares to ordinary shares were passed. The preference share
conversion was effected on June 28, 2013 with 3,975,533 preference shares in the amount of €3.9 million ($4.5
million) converted on a 1:1 basis to ordinary shares. On July 5, 2013, the Company received a €27 million ($35
million) premium from the largest former preference shareholder, a European financial institution, for the
conversion of their preference shares to ordinary shares. This amount was recorded as an increase in equity as of
June 30, 2013 and the payment was received during the third quarter of 2013.
Additionally, our share buy-back program started on May 20, 2013 and was completed on August 14, 2013.
We repurchased 7,548,951 shares in the amount of €385 million ($505 million). These shares are restricted
treasury stock which means there are no associated dividends or voting rights. These treasury shares will be
used solely to either reduce our registered share capital by cancellation of the acquired shares, or to fulfill our
employee participation programs.
On May 17, 2013, we paid a dividend with respect to 2012 of €0.75 per ordinary share (for 2011 paid in
2012: €0.69; for 2010 paid in 2011: €0.65) and €0.77 per then-outstanding preference share (for 2011 paid in
2012: €0.71; for 2010 paid in 2011: €0.67). The total dividend payment was €230 million ($296 million), €210
million ($272 million) and €197 million ($281 million) in 2013, 2012 and 2011, respectively.

75
The following table summarizes the Company’s available sources of liquidity at December 31, 2013:
Expiration per period of
Available Sources of Liquidity
in millions Total
less than 1
Year 1-3 Years 3-5 Years
Over 5
Years
Accounts receivable facility(a) $ 383 $ - $ 383 $ - $ -
Revolving Credit Facility of the Credit
Agreement 2012 (b) 1,073 - - 1,073 -
Other Unused Lines of Credit 233 233 - - -
$ 1,689 $ 233 $ 383 $ 1,073 $ -
(a) Subject to availability of sufficient accounts receivable meeting funding criteria. At December 31, 2013, the Company had letters of
credit outstanding in the amount of $66 million which reduces the availability under the Accounts Receivable Facility to the amount shown
in this table.
(b) At December 31, 2013, the Company had letters of credit outstanding in the amount of $9 million which reduces the availability under
the Revolving Credit Facility to the amount shown in this table.
The amount of guarantees and other commercial commitments at December 31, 2013 was not significant.
At December 31, 2013, we had short-term borrowings, excluding the current portion of long-term debt, other
financial liabilities and short-term borrowings from related parties, in the total amount of $159 million.
The following table summarizes, as of December 31, 2013, our obligations and commitments to make future
payments under our long-term debt and other long-term obligations, and our commitments and obligations under
lines of credit and letters of credit.
Payments due by period of
Contractual Obligations and
Commitments (a)
in millions
Total
less than 1
Year 1-3 Years 3-5 Years
Over 5
Years
Long-term Debt(b) $ 10,151 $ 852 $ 1,932 $ 4,088 $ 3,279
Capital Lease Obligations 26 2 5 3 16
Operating Leases 3,226 610 981 633 1,002
Unconditional Purchase Obligations
for inventory 613 337 200 44 32
Other Long-term Obligations(c) 285 212 61 9 3
Letters of Credit 75 - 66 9 -
$ 14,376 $ 2,013 $ 3,245 $ 4,786 $ 4,332
(a) Our pension liabilities are not included in the table of contractual obligations and commitments. The regular or special funding of our
pension plans may adversely affect our liquidity in the future periods. The liability recognized in our consolidated financial statements may
fluctuate significantly in future periods due to changes in assumptions, in particular the discount rate, rate of future compensation increases
and pension progression. Actual results could differ from assumptions due to changing market, economic and governmental regulatory
conditions, thereby resulting in an increase or decrease of the liability. Employer contributions expected to be paid to the defined benefit
plans during fiscal year 2014 are $ 42.6 million. For additional information regarding our pension plans and expected payments for the next
ten years, see Item 18. Financial Statements – Note 12 of the Notes to the Consolidated Financial Statements, "Employee Benefit Plans" in
this report. (b) Includes expected interest payments which are based upon the principal repayment schedules and fixed interest rates or estimated
variable interest rates considering the applicable interest rates (e.g. Libor, Prime), the applicable margins, and the effects of related interest
rate swaps.
(c) Other Long-term Obligations consist mainly of production asset acquisition commitments.
Our 2012 Credit Agreement, Euro Notes and Senior Notes include covenants that require us to maintain
certain financial ratios or meet other financial tests. Under our 2012 Credit Agreement, we are obligated to
maintain a minimum consolidated interest expense coverage ratio (ratio of EBITDA to net interest expense) and
a maximum consolidated leverage ratio (ratio of consolidated funded debt to consolidated EBITDA) as these
terms are defined in the 2012 Credit Agreement. Other covenants in one or more of each of these agreements
restrict or have the effect of restricting our ability to dispose of assets, incur debt, pay dividends and make other
restricted payments, create liens or engage in sale-lease backs.

76
The breach of any of the covenants in any of the instruments or agreements governing our long-term debt –
2012 Credit Agreement, the Euro Notes or the Senior Notes– could, in turn, create additional defaults under one
or more of the other instruments or agreements. In default, the outstanding balance under the 2012 Credit
Agreement becomes due at the option of the lenders under that agreement, and the “cross default” provisions in
our other long-term debt permit the lenders to accelerate the maturity of the debt upon such a default as well. As
of December 31, 2013, we were in compliance with all covenants under the 2012 Credit Agreement and our
other financing agreements. For information regarding our 2012 Credit Agreement, Euro Notes and Senior
Notes, see Note 11 of the Notes to Consolidated Financial Statements, “Long-Term Debt and Capital Lease
Obligations, and Long-Term Debt from Related Parties.”
Although we are not immune from the global financial crisis, we believe that we are well positioned to
continue to grow our business while meeting our financial obligations as they come due. Due to the non-
discretionary nature of the healthcare services we provide, the need for products utilized to provide such services
and the availability of government reimbursement for a substantial portion of our services, our business is
generally not cyclical. A substantial portion of our accounts receivable are generated by governmental payers.
While payment and collection practices vary significantly between countries and even between agencies within
one country, government payors usually represent low to moderate, credit risks. However, limited or expensive
access to capital could make it more difficult for our customers to do business with us, or to do business
generally, which could adversely affect our business by causing our customers to reduce or delay their purchases
of our dialysis products. See “Results of Operations” above. If the current conditions in the credit and equity
markets continue, or worsen, they could also increase our financing costs and limit our financial flexibility.
Our General Partner’s Management Board will propose to the shareholders at the Annual General meeting
on May 15, 2014, a dividend with respect to 2013 and payable in 2014, of €0.77 per ordinary share (for 2012
paid in 2013: €0.75). The total expected dividend payment is approximately €232 million (approximately $320
million based upon the December 31, 2013 spot rate) compared to dividends of €230 million ($296 million) paid
in 2013 with respect to 2012. The 2012 Credit Agreement provides for a limitation on dividends and other
restricted payments which is €330 million ($455 million based upon the December 31, 2013 spot rate) for
dividends to be paid in 2014, and increases in subsequent years.
Our 2014 principal financing needs are the W.R Grace bankruptcy settlement payment of $115 million (paid
on February 3, 2014) (See Note 20 of the Notes to the Consolidated Financial Statements, “Commitments and
Contingencies”), payments for our EIB loans, which were paid in February 2014, Euro Notes due in 2014, as
well as the quarterly payments under our 2012 Credit Agreement Term Loan facility. These payments as well as
our dividend payment of approximately $320 in May 2014, capital expenditures, and acquisition payments are
expected to be covered by our cash flows, by using existing credit facilities and if required additional debt
financing. We currently have sufficient flexibility under our debt covenants to meet our financing needs in the
near future. Generally, we believe that we will have sufficient financing to achieve our goals in the future and to
continue to promote our growth.

77
Outlook
Below is a table showing our growth outlook for 2014:
2014
Revenue ~ $15.2 billion
Operating income ~ $2.2 billion
Operating income margin ~ 14,5%
Net income1) $1.0 - $1.05 billion
Net income growth1) decrease 5 - 10%
Basic earnings per share growth1) based on development of
net income
Capital Expenditures ~ $0.9 billion
Acquisitions and investments ~ $0.4 billion
Net cash provided by (used in) operating activities > $1.5 billion
Net cash provided by (used in) operating activities in % of revenue > 10%
Free cash flow in % of revenue > 4%
Debt/EBITDA Ratio ≤ 3.0
Employees2) ~ 92,000
Research and development expenses ~ $140 million
1) Net income attributable to shareholders of FMC AG & Co. KGaA
2) Full-time equivalents.
The Company initiated a global efficiency program designed to enhance the Company’s performance over a
multi-year period which should lead to sustainable savings. Potential cost savings before income taxes of up to
$60 million generated from this program are not included in the Outlook for 2014.
In addition to the consolidated financial statements prepared in accordance with U.S. GAAP included in this
report, we are subject to home country reporting requirements in Germany. These require that we provide an
assessment of the probability and impact of certain risks and uncertainties that could materially affect our
outlook. A summary of such risk assessment is set forth below.
Although we believe our fiscal year 2014 outlook is based on reasonable assumptions, it is subject to risks
and uncertainties that may materially impact the achievement of the outlook. In the following table, we have
listed certain risks and the corresponding risk factor (or other discussion of such risks) within this report as well
as our assessment of the reasonable probability and potential impact of these known risks on our 2014 results.
The risks and their related risk factors or other disclosure headings have been paired together to provide further
information on the risks as well as provide an indication of their location in this report. The assessment below
should be read together with the discussions of such risks and uncertainties contained in Item 3, Key Information
–D. “Risk Factors” and Item 11, Quantitative and Qualitative Disclosures About Market Risk – “Management of
Foreign Exchange and Interest Rate Risks.” Our Litigation risk represents an assessment of material litigation
currently known or threatened and is discussed in Note 20 of the Notes to Consolidated Financial Statements,
“Commitments and Contingencies” found elsewhere in this report. These assessments by their nature do not
purport to be a prediction or assurance as to the eventual resolution of such risks. As with all forward-looking
statements, actual results may vary materially. See “Forward-looking Statements” immediately following the
Table of Contents to this report.

78
Risk to our 2014
outlook
Risk Factor (or other related disclosure) within the
report Probability Impact
Regulatory Environment
If we do not comply with the many governmental
regulations applicable to our business, we could be
excluded from government healthcare reimbursement
programs or our authority to conduct business could be
terminated, either of which would result in a material
decrease in our revenue.
Low
Medium
Quality
If we do not comply with the many governmental
regulations applicable to our business, we could be
excluded from government healthcare reimbursement
programs or our authority to conduct business could be
terminated, either of which would result in a material
decrease in our revenue.
Low
Medium
Erythropoietin
stimulating agents
(ESAs)
The utilization of ESAs could materially impact our
revenue and operating profit. An interruption of supply
or our inability to obtain satisfactory terms for ESAs
could reduce our revenues and operating profit.
Low Medium
Reimbursement by
private insurers
A significant portion of our North America Segment
profits are dependent on the services we provide to a
minority of our patients who are covered by private
insurance.
Low Medium
Procurement
We could be adversely affected if we experience
shortages of components or material price increases from
our suppliers
Low Low
Corruption
We operate in many different jurisdictions and we could
be adversely affected by violations of the U.S. Foreign
Corrupt Practices Act and similar worldwide anti-
corruption laws.
Medium Medium
Currencies and interests
Foreign currency and interest rate exposure. See Item 11,
Quantitative and Qualitative Disclosures About Market
Risk - "Management of Foreign Exchange and Interest
Rate Risks"
High Medium
Litigation
Legal and Regulatory Matters (See Note 20 of the Notes
to the Consolidated Financial Statements, "Commitments
and Contingencies - Legal and Regulatory Matters")
Low Low
Taxes
Diverging views of fiscal authorities could require us to
make additional tax payments. Medium Low
Balance Sheet Structure
Total assets as of December 31, 2013 increased to $23.1 billion compared to $22.3 billion at December 31,
2012. Current assets as a percent of total assets remained constant at 27% at December 31, 2013 as compared to
December 31, 2012. The equity ratio, the ratio of our equity divided by total liabilities and shareholders’ equity,
remained flat at 41% as compared to December 31, 2012.
C. Research and Development
As a leading global dialysis company, we focus our R&D strategy on three essential objectives: first, to
continuously enhance the quality of life of patients with chronic kidney disease using innovative products and
treatment concepts; second, to offer our patients and purchasers of our products high-quality services while
keeping our prices as low as possible; and third, to continue to expand our position as the dialysis market leader.
Due to our vertical integration, our research and development department can apply our experience as the

79
world’s largest provider of dialysis treatments to product development, and our technical department benefits
from our daily practical experience as a provider of dialysis treatment and being directly in-touch with doctors,
nurses and patients to keep track of and meet customer and patient needs. In addition, our research and
development units are usually located at production sites, enabling direct exchange of ideas with our production
staff. We conduct annual internal R&D conferences which our employees attend every year. In addition, our
employees visit research events worldwide and participate actively in scientific discourse. This not only enables
them to inject new concepts into their work, but also strengthens our reputation in the international professional
community. We also maintain close contacts with universities and research institutions. We are cooperating
closely with the University of Michigan (on a longitudinal study of chronic kidney patients), Danube University
Krems in Krems, Austria (on extracorporeal methods), and the Renal Research Institute (“RRI”) in the United
States. RRI was founded in 1997 as a joint venture between Fresenius Medical Care North America and the
Beth Israel Medical Center, a hospital in New York. Together, we are researching the fundamental issues of
dialysis treatment, including the causes that lead to kidney failure, the particular features of treating children
with ESRD, and issues such as the mineralization of dialysis patients’ bones or the effects of kidney diseases
on the natural acid-base balance in the human body.
During 2013, we restructured our research and development activities with an international focus. This
included expanding the Management Board to include a member responsible for global research and
development activities. This focus enables us to accelerate development timelines, promote an exchange of
knowledge and technology, enhance our process efficiency, and better manage risks and the related costs.
The task of our research and development group, which employs approximately 552 full time equivalents,
is to continually develop and improve our products and treatments. Our largest research and development
department is in our European region with approximately 350 employees, most of whom work at our
Schweinfurt and Bad Homburg locations. Smaller teams also work in St. Wendel, Germany and in Bucharest,
Romania, where an R&D competency center specializing in software development has been established and in
Krems, specializing in sorbent technology. Apart from R&D in Europe, we have research and development
departments in the North America and the Asia-Pacific regions. All of these units are closely connected and
cooperate on many projects.
Four trends for our continued strategic development
Technological developments- focused on information technology, technologies to gradually reduce the
size of our products and simplify their use, and the integration of various treatment elements to create
holistic therapy systems. We are also continuing to develop sorbent technology for recycling tap
water, as large amounts of water are required for hemodialysis treatment.
Home hemodialysis systems – with increased demand as a result of sustained growth in patient
numbers. As a result, our aim is continued integration of these systems for home hemodialysis, while
maintaining treatment quality. Our research and development involves making these systems smaller
and easier to transport, as well as significantly reducing the amount of water required.
Concomitant diseases-as patients with chronic kidney failure age, the likelihood of developing illness
such as severe cardiac and vascular condition increases. Based on their growing prevalence and new
scientific insights, these are increasingly a focal point of our research and development in the form of
diagnostic and therapy systems.
Rising cost of healthcare- impacted by an aging population, the spread of chronic illness, and the
aspiration to offer new or improved technologies in patient care. We continue to abide by the principle
that innovations must not only be of a high quality, but must be affordable for patients to benefit from
them.
Clinical Research
During 2013, we performed clinical studies to examine the automatic regulation of the electrolyte balance of
the human body, which is important to the functioning of the entire body. In hemodialysis, where dialysis
solution is continuously being produced by a dialysis machine, it is possible to influence these processes
favorably by adapting the dialysis solution accordingly. We are currently performing clinic tests on such a
procedure. In addition we are focusing on PD and overhydration, proving that active fluid management can
increase a patient’s survival rate, reduce the number and duration of hospital stays, and improve the maintenance
of the residual renal function. We are also assessing the benefits of a low-sodium PD solution for patients with
high blood pressure, a typical illness concurrent with dialysis.
Research and development expenditures amounted to $126 million in 2013, compared to $112 million and
$111 million in 2012 and 2011, respectively. Our 2013 expenditures focused on continuously enhancing and

80
improving our products and treatment concepts for our patients and users, implementing further technological
developments, and remaining active in relevant areas of clinical research such as chronic kidney failure.
Outlook
We intend to continue investing in developing and improving life-sustaining products and treatment
concepts in the years to come, thus improving the quality of life for as many patients as possible with
financially viable, environmentally-friendly innovations based on strategic technology platforms. We plan to
spend approximately $140 million on research and development in 2014.
D. Trend information
For information regarding significant trends in our business see Item 5.A, “Operating Financial Review and
Prospects.”
F. Tabular Disclosure of contractual obligations
The information required by this item may be found under Item 5B, “- Liquidity and Capital Resources –
Financing.”
Item 6. Directors, Senior Management and Employees
A. Directors and senior management
General
As a partnership limited by shares, under the German Stock Corporation Act (Aktiengesetz), our corporate
bodies are our General Partner, our Supervisory Board and our general meeting of shareholders. Our sole
General Partner is Management AG, a wholly-owned subsidiary of Fresenius SE. Management AG is required
to devote itself exclusively to the management of Fresenius Medical Care AG & Co. KGaA.
For a detailed discussion of the legal and management structure of Fresenius Medical Care AG & Co.
KGaA, including the more limited powers and functions of the Supervisory Board compared to those of the
general partner, see Item 16.G, below, “Governance – The Legal Structure of Fresenius Medical Care AG & Co.
KGaA.”
Our General Partner has a supervisory board and a management board. These two boards are separate and no
individual may simultaneously be a member of both boards. A person may, however, serve on both the
supervisory board of our General Partner and on our Supervisory Board.
The General Partner’s Supervisory Board
The supervisory board of Management AG consists of six members who are elected by Fresenius SE (acting
through its general partner, Fresenius Management SE), the sole shareholder of Management AG. Pursuant to a
pooling agreement for the benefit of the public holders of our shares, at least one-third (but no fewer than two) of
the members of the General Partner’s supervisory board are required to be independent directors as defined in
the pooling agreement, i.e., persons with no substantial business or professional relationship with us, Fresenius
SE, the general partner, or any affiliate of any of them.
Unless resolved otherwise by the general meeting of shareholders, the terms of each of the members of the
supervisory board of Management AG will expire at the end of the general meeting of shareholders held during
the fourth fiscal year following the year in which the Management AG supervisory board member was elected by
Fresenius SE, but not counting the fiscal year in which such member’s term begins. Fresenius SE, as the sole
shareholder of Management AG, is at any time entitled to re-appoint members of the Management AG
supervisory board. The most recent election of members of the General Partner’s supervisory board took place in
July 2011. Members of the General Partner’s supervisory board may be removed only by a resolution of
Fresenius SE in its capacity as sole shareholder of the General Partner. Neither our shareholders nor the separate

81
Supervisory Board of FMC AG & Co. KGaA has any influence on the appointment of the supervisory board of
the General Partner.
The General Partner’s supervisory board ordinarily acts by simple majority vote and the Chairman has a tie-
breaking vote in case of any deadlock. The principal function of the general partner’s supervisory board is to
appoint and to supervise the General Partner’s management board in its management of the Company, and to
approve mid-term planning, dividend payments and matters which are not in the ordinary course of business and
are of fundamental importance to us.
The table below provides the names of the members of the supervisory board of Management AG and their
ages as of January 1, 2014.
Age as of
January 1,
2014 Name
Dr. Ulf M. Schneider, Chairman (1) 48
Dr. Dieter Schenk, Vice Chairman (4) 61
Dr. Gerd Krick (1) (2) 75
Mr. Rolf A. Classon (3) (4) 68
Dr. Walter L. Weisman (1) (2) (3) 78
Mr. William P. Johnston (1) (2) (3) (4) 69
(1) Members of the Human Resources Committee of the supervisory board of Management AG
(2) Members of the Audit and Corporate Governance Committee of FMC-AG & Co. KGaA
(3) Independent director for purposes of our pooling agreement
(4) Member of the Regulatory and Reimbursement Assessment Committee of the supervisory board of Management AG
DR. ULF M. SCHNEIDER has been Chairman of the Supervisory Board of Management AG, the
Company’s General Partner, since April 2005. He is also Chairman of the Management Board of Fresenius
Management SE, the general partner of Fresenius SE & Co. KGaA, and Chairman or member of the Board of a
number of other Fresenius SE group companies. Additionally, he was Group Finance Director for Gehe UK plc.,
a pharmaceutical wholesale and retail distributor, in Coventry, United Kingdom. He has also held several senior
executive and financial positions since 1989 with Gehe’s majority shareholder, Franz Haniel & Cie. GmbH,
Duisburg, a diversified German multinational company.
DR. DIETER SCHENK has been Vice Chairman of the Supervisory Board of Management AG since 2005
and is also Vice Chairman of the Supervisory Board of FMC AG & Co. KGaA and a member of the Supervisory
Board of Fresenius Management SE. He is an attorney and tax advisor and has been a partner in the law firm of
Noerr LLP (formerly Nörr Stiefenhofer Lutz) since 1986. Additionally, he also serves as the Chairman of the
Supervisory Board of Gabor Shoes AG and TOPTICA Photonics AG and as a Vice-Chairman of the Supervisory
Board of Greiffenberger AG. Dr. Schenk is also Chairman of the Advisory Board of Else Kröner-Fresenius-
Stiftung, the sole shareholder of Fresenius Management SE, which is the sole general partner of Fresenius SE &
Co. KGaA.
DR. GERD KRICK has been a member of the Supervisory Board of Management AG since December 2005
and the Chairman of the Company’s Supervisory Board since February 2006. He is the Chairman of the
Supervisory Board of Fresenius Management SE and of Fresenius SE & Co. KGaA and is also Chairman of the
Board of Vamed AG, Austria.
MR. ROLF A. CLASSON has been a member of the Supervisory Board of Management AG since July 7,
2011 and a member of the Company’s Supervisory Board since May 12, 2011. Mr. Classon is the Chairman of
the Board of Directors for Auxilium Pharmaceuticals, Inc. and Tecan Group Ltd. Additionally, Mr. Classon is
the Chairman of the Board of Directors for Hill-Rom Holdings, Inc.
DR. WALTER L. WEISMAN has been a member of the Supervisory Board of Management AG since
December 2005 and also serves on the Company’s Supervisory Board. Additionally, he is the former Chairman
and Chief Executive Officer of American Medical International, Inc., and was a member of the Board of
Directors of Occidental Petroleum Corporation until May 4, 2012. He is also a Senior Trustee of the Board of
Trustees for the California Institute of Technology, a Life Trustee of the Board of Trustees of the Los Angeles

82
County Museum of Art, a Trustee of the Oregon Shakespeare Festival and Chairman of the Board of Trustees of
the Sundance Institute.
MR. WILLIAM P. JOHNSTON has been a member of the Supervisory Board of Management AG since
August 2006 and also serves on the Company’s Supervisory Board. Mr. Johnston has been an Operating
Executive of The Carlyle Group since June 2006. He is also a member of the Board of Directors of The Hartford
Mutual Funds, Inc. and HCR-Manor Care, Inc.
The General Partner’s Management Board
Each member of the Management Board of Management AG is appointed by the Supervisory Board of
Management AG for a maximum term of five years and is eligible for reappointment thereafter. Their terms of
office expire in the years listed below.
The table below provides names, positions and terms of office of the members of the Management Board of
Management AG and their ages as of January 1, 2014.
Name
Age as of
January
1, 2014 Position
Year term
expires
Rice Powell 58 Chief Executive Officer and Chairman of the
Management Board
2017
Michael Brosnan 58 Chief Financial Officer 2017
Roberto Fusté 61 Chief Executive Officer for Asia Pacific 2016
Dr. Emanuele Gatti 58 Chief Executive Officer for Europe, Middle East,
Africa and Latin America and Chief Strategist for
FMC-AG & Co. KGaA
2015
Ronald Kuerbitz 54 Chief Executive Officer, Fresenius Medical Care
North America
2015
Dr. Rainer Runte 54 Chief Administrative Officer for Global Law,
Compliance, Intellectual Property and Corporate
Business Development and Labor Relations Director
for Germany
2014
Dr. Olaf Schermeier 41 Chief Officer of Global Research & Development 2017
Kent Wanzek 54 Head of Global Manufacturing Operations 2017
RICE POWELL has been with the Company since 1997. He became Chairman and Chief Executive Officer
of the Management Board of Management AG effective January 1, 2013. He is also a member of the Board of
Administration of Vifor Fresenius Medical Care Renal Pharma, Ltd., Switzerland. He was the Chief Executive
Officer and director of Fresenius Medical Care North America until December 31, 2012. Mr. Powell has over 30
years of experience in the healthcare industry, which includes various positions with Baxter International Inc.,
Biogen Inc., and Ergo Sciences Inc.
MICHAEL BROSNAN has been with the Company since 1998. He is a member of the Management Board
and Chief Financial Officer of Management AG. He is member of the Board of Administration of Vifor
Fresenius Medical Care Renal Pharma, Ltd., Switzerland. He was a member of the Board of Directors of
Fresenius Medical Care North America. Prior to joining Fresenius Medical Care, Mr. Brosnan held senior
financial positions at Polaroid Corporation and was an audit partner at KPMG.
ROBERTO FUSTÉ has been with the Company since 1991 and his present positions include member of the
Management Board of Management AG and Chief Executive Officer for Asia Pacific. Additionally, he founded
the company Nephrocontrol S.A. in 1983. In 1991, Nephrocontrol was acquired by the Fresenius Group, where
Mr. Fusté has since worked. Mr. Fusté has also held several senior positions within the Company in Europe and
the Asia Pacific region.
DR. EMANUELE GATTI has been with the Company since 1989. His present positions include member of
the Management Board of Management AG, Chief Executive Officer and Global Chief Strategist for Europe,

83
Latin America, Middle East and Africa. Dr. Gatti also became president of Italienische Handelskammer für
Deutschland e.V, a private company, in May, 2012. Additionally, Dr. Gatti has lectured at several biomedical
institutions. He continues to be involved in comprehensive research and development activities focusing on
dialysis and blood purification, biomedical signal analysis, medical device safety and healthcare economics.
RONALD KUERBITZ has been with the Company since 1997. He became a member of the Management
Board of Management AG and Chief Executive Officer of Fresenius Medical Care North America on January 1,
2013. Mr. Kuerbitz is a member of the board of directors for Fresenius Medical Care Holdings, Inc. and member
of the board of directors for Specialty Care Services Group, LLC. Mr. Kuerbitz has more than 20 years of
experience in the health care field, having held positions in law, compliance, business development, government
affairs and operations.
DR. RAINER RUNTE has been with the Company since 1991. He is a member of the Management Board
of Management AG since December 2005 and is Chief Administrative Officer for Global Law, Compliance,
Intellectual Property, and Corporate Business Development and is also Labor Relations Director for Germany.
Furthermore, he is a member of the Board of Administration of Vifor Fresenius Medical Care Renal Pharma
Ltd., Switzerland. Previously, he served as scientific assistant to the law department of the Johann Wolfgang
Goethe University in Frankfurt and as an attorney in a law firm specialized in economic law.
DR OLAF SCHERMEIER was appointed Chief Executive Officer for Global Research and Development on
March 1, 2013. Previously, he served as President of Global Research and Development for Draeger Medical,
Lübeck, Germany. Dr. Schermeier has many years of experience in various areas of the health care industry,
among others at Charite-clinic and Biotronik, Germany.
KENT WANZEK has been with the Company since 2003. He is a member of the Management Board of
Management AG with responsibility for Global Manufacturing Operations and prior to joining the Management
Board was in charge of North American Operations for the Renal Therapies Group at Fresenius Medical Care
North America since 2004. Additionally, Mr. Wanzek held several senior executive positions with companies in
the healthcare industry, including Philips Medical Systems, Perkin-Elmer, Inc. and Baxter Healthcare
Corporation.
The business address of all members of our Management Board and Supervisory Board is Else-Kröner-
Strasse 1, 61352 Bad Homburg, Germany.
The Supervisory Board of FMC-AG & Co. KGaA
The Supervisory Board of FMC-AG & Co. KGaA consists of six members who are elected by the
shareholders of FMC-AG & Co. KGaA in a general meeting. The most recent Supervisory Board elections
occurred in May of 2011. Fresenius SE, as the sole shareholder of Management AG, the general partner, is
barred from voting for election of the Supervisory Board of FMC-AG & Co. KGaA, but it nevertheless has and
will retain significant influence over the membership of the FMC-AG & Co. KGaA Supervisory Board in the
foreseeable future. See Item 16.G, below, “Governance – The Legal Structure of FMC-AG & Co. KGaA.”
The current Supervisory Board of FMC-AG & Co. KGaA consists of six persons, five of whom – Messrs.
Krick (Chairman), Schenk (Vice-Chairman), Classon, Johnston, and Weisman– are also members of the
supervisory board of our General Partner. For information regarding those members of the Supervisory Board of
FMC-AG & Co. KGaA, see “The General Partner’s Supervisory Board,” above. The sixth member of the
Supervisory Board of FMC-AG & Co. KGaA is Prof. Dr. Bernd Fahrholz. Information regarding his age, term of
office and business experience is as follows:
PROF. DR. BERND FAHRHOLZ, age 66 was a member of the Supervisory Board of Management AG
from April 2005 until August 2006 and was a member of the Supervisory Board of FMC-AG from 1998 until the
transformation of legal form to KGaA and has been a member of the Supervisory Board of FMC-AG & Co.
KGaA since the transformation. He is Vice Chairman of our Audit and Corporate Governance Committee.
Additionally, he was of counsel and a partner in several large law firms. He also is the Chairman of the
Supervisory Board of SMARTRAC N.V.
The terms of office of the aforesaid members of the Supervisory Board of FMC-AG & Co. KGaA will
expire at the end of the general meeting of shareholders of FMC-AG & Co. KGaA, in which the shareholders
discharge the Supervisory Board held during the fourth fiscal year following the year in which they were elected,
but not counting the fiscal year in which such member’s term begins. Fresenius SE, as sole shareholder of our
general partner, does not participate in the vote on discharge of the Supervisory Board. Members of the FMC-

84
AG & Co. KGaA Supervisory Board may be removed only by a resolution of the shareholders of FMC-AG &
Co. KGaA with a majority of three quarters of the votes cast at such general meeting. Fresenius SE is barred
from voting on such resolutions. The Supervisory Board of FMC-AG & Co. KGaA ordinarily acts by simple
majority vote and the Chairman has a tie-breaking vote in case of any deadlock.
The principal function of the Supervisory Board of FMC-AG & Co. KGaA is to oversee the management of
the Company but, in this function, the supervisory board of a partnership limited by shares has less power and
scope for influence than the supervisory board of a stock corporation. The Supervisory Board of FMC-AG & Co.
KGaA is not entitled to appoint the General Partner or its executive bodies, nor may it subject the general
partner’s management measures to its consent or issue rules of procedure for the general partner. Only the
supervisory board of Management AG, elected solely by Fresenius SE, has the authority to appoint or remove
members of the General Partner’s Management Board. See Item 16.G, below, “Governance – The Legal
Structure of FMC-AG & Co. KGaA.” Among other matters, the Supervisory Board of FMC-AG & Co. KGaA
will, together with the general partner, fix the agenda for the AGM and make recommendations with respect to
approval of the Company’s financial statements and dividend proposals. The Supervisory Board of FMC-AG &
Co. KGaA will also propose nominees for election as members of its Supervisory Board. The Audit and
Corporate Governance Committee also recommends to the Supervisory Board a candidate as the Company’s
auditors to audit our German statutory financial statements to be proposed by the Supervisory Board to our
shareholders for approval and, as required by the SEC and NYSE audit committee rules, retains the services of
our independent auditors to audit our U.S. GAAP financial statements.
B. Compensation
Report of the Management Board of Management AG, our General Partner
The compensation report of FMC-AG & Co. KGaA summarizes the main elements of the compensation
system for the members of the Management Board of Fresenius Medical Care Management AG as general
partner of FMC-AG & Co. KGaA and in this regard notably explains the amounts and structure of the
compensation paid to the Management Board. Furthermore, the principles and the amount of the remuneration of
the Supervisory Board are described. The compensation report is part of the management report of the annual
financial statements and the annual consolidated group financial statements of FMC-AG & Co. KGaA as of
December 31, 2013. The compensation report is prepared on the basis of the recommendations of the German
Corporate Governance Code and also includes the disclosures as required pursuant to the applicable statutory
regulations, notably in accordance with the German Commercial Code (HGB).
Compensation of the Management Board
The entire Supervisory Board of Fresenius Medical Care Management AG is responsible for determining the
compensation of the Management Board. The Supervisory Board is assisted in this task by a personnel
committee, the Human Resources Committee. In the fiscal year, the Human Resources Committee was
composed of Dr. Ulf M. Schneider (Chairman), Dr. Gerd Krick (Vice Chairman), Mr. William P. Johnston and
Dr. Walter L. Weisman. See Item 16G, "Corporate Governance."
The current Management Board compensation system was last approved by resolution of the General
Meeting of FMC-AG & Co. KGaA on May 12, 2011 with a majority of 99.71% of the votes cast. Furthermore,
this compensation system is reviewed by an independent external compensation expert at the beginning of each
fiscal year.
The objective of the compensation system is to enable the members of the Management Board to participate
reasonably in the sustainable development of the Company’s business and to reward them based on their duties
and performance as well as their success in managing the Company’s economic and financial position giving due
regard to the peer environment.
The amount of the total compensation of the members of the Management Board is measured taking
particular account of relevant reference values of other DAX-listed companies and similar companies of
comparable size and performance in the relevant industry sector.

85
The compensation of the Management Board is, as a whole, performance-based and consisted of three
components in the fiscal year:
• non-performance-based compensation (fixed compensation and fringe benefits)
• short-term performance-based compensation (one-year variable compensation)
• components with long-term incentive effects (multi-year variable compensation, consisting of stock
options and share-based compensations with cash settlement)
The individual components are designed on the basis of the following criteria:
In the fiscal year, the fixed compensation paid in Germany was divided in twelve instalments, while the
fixed compensation paid in the U.S. was divided in twenty-four instalments as base salary. Moreover, the
members of the Management Board received additional benefits consisting mainly of payment for insurance
premiums, the private use of company cars, special payments such as foreign supplements, rent supplements,
reimbursement of fees for the preparation of tax returns and reimbursement of certain other charges and
additional contributions to pension and health insurance.
Performance-based compensation will also be awarded for the fiscal year as a short-term cash component
(one-year variable compensation) and as components with long-term incentive effects (stock options and share-
based compensations with cash settlement). The share-based compensations with cash settlement consist of
phantom stocks and of the Share Based Award.
The amount of the one-year variable compensation and of the Share Based Award depends on the
achievement of the following individual and common targets:
• Net income growth
• Free cash flow (Net cash provided by (used in) operating activities after Capital Expenditures, before
Acquisitions and Investments) in percent of revenue
• Operating income margin
The level of achievement of these targets is derived from the comparison of target amounts and actual
results. Furthermore, targets are divided into Group level targets and those to be achieved in individual regions.
Lastly, the various target parameters are weighted differently by their relative share in the aggregate amount of
variable compensation depending on the respective (regional and/or sectoral) areas of responsibility assumed by
the members of the Management Board.
The respective minimum level of Net income growth to be achieved was at least 6% in the fiscal year, with
the maximum bonus payable upon achievement of Net income growth of 15%. Furthermore, the members of the
Management Board assuming Group functions and the members of the Management Board with regional
responsibilities were also evaluated by reference to the development of free cash flow within the Group or in the
relevant regions, respectively, during the fiscal year, with the targets being within a range of rates between 3%
and 6% of the respective free cash flow in percent of revenue. For Board members without Group functions,
growth of regional operating income margins within the fiscal year was compensated within individual targets
ranging between 13% and 18.5%, reflecting the particularities of the respective Board responsibilities.
The targets are, as a rule, weighted differently depending on whether the Management Board member
exercises Group functions – these are Mr. Rice Powell, Mr. Michael Brosnan and Dr. Rainer Runte – or whether
the Management Board member is responsible for regional earnings – these are Mr. Roberto Fusté, Dr.
Emanuele Gatti and Mr. Ronald Kuerbitz – or takes on specific Management Board responsibilities without
Group functions – these are Mr. Kent Wanzek for Global Manufacturing Operations and Dr. Olaf Schermeier for
Research & Development. For members of the Management Board with Group functions, Net income growth
accounts for 80% and is thus weighted higher than for the other Board members, where Net income growth
accounts for 60%. For members of the Management Board without Group functions, a further 20% is based upon
the evaluation of the operating income margin. Achievement of the target for free cash flow in percent of
revenue is weighted at 20% for all members of the Management Board equally.
Multiplying the level of target achievement by the respective fixed compensation and another fixed
multiplier provides a total amount, of which a 75% share is paid out in cash to the Management Board members
(one-year variable compensation) after approval of the annual financial statements for the fiscal year. Since the
maximum level of target achievement is set at 120%, the Management Board’s maximum achievable one-year

86
variable compensation is limited. The Management Board’s maximum achievable and minimum one-year
variable compensation in the fiscal year are as follows:
Amounts of the short-term
performance-related cash
compensation (annual bonus)
Minimum Maximum
2013 2013
in thousands
Rice Powell $ 281 $ 2,475
Michael Brosnan $ 163 $ 1,435
Roberto Fusté $ 164 $ 1,446
Dr. Emanuele Gatti $ 216 $ 1,928
Ron Kuerbitz $ 191 $ 1,683
Dr. Rainer Runte $ 127 $ 1,157
Dr. Olaf Schermeier1) $ 93 $ 877
Kent Wanzek $ 117 $ 1,030
1) pro rata temporis
The remaining share, amounting to 25% of the total amount calculated according to the key data above, is
granted to the members of the Management Board in the form of the Share Based Award, which is included in
components with long-term incentive effects. The Share Based Award is subject to a three- or four-year waiting
period, although a shorter period may apply in special cases (e.g. professional incapacity, entry into retirement,
non-renewal by the Company of expired service agreements). The amount of the cash payment of the Share
Based Award is based on the share price of FMC-AG & Co. KGaA ordinary shares upon exercise after the three-
or four-year waiting period.
In determining the variable compensation, it is ensured that performance-based components with long-term
incentive effects (i.e. the Share Based Award as well as the stock option and phantom stock components
described below) are granted in amounts which constitute at least 50% of the sum of one- and multi-year
variable components. Should this turn out not to be the case mathematically, the Management Board members’
contracts provide that the portion of variable compensation payable as one-year variable compensation shall be
reduced and the portion payable as the Share Based Award correspondingly increased, in order to meet this
requirement. The components with long-term incentive effects also contain a limitation possibility for cases of
extraordinary developments. The Supervisory Board may also grant a discretionary bonus for extraordinary
performance.
In addition, a special bonus component applied in some cases for fiscal years 2006, 2007 and 2008 which
was linked to the achievement of targets measured only over this three-year period but whose payment was also
subject, in part, to a waiting period of several years through 2012. This bonus component also included special
components linked to the achievement of extraordinary financial targets related to special integration measures
(e.g. in connection with the acquisition of Renal Care Group in the U.S.) and thus required the achievement of an
extraordinary increase in earnings. The present report also reflects those payments based on this earlier bonus
component but exercised and paid only in the previous fiscal year (see table “Expenses for Long-term Incentive
Components”).
For the fiscal year and the previous year, the amount of cash compensation payments to members of the
Management Board without components with long-term incentive effects consisted of the following:

87
Amount of Cash Payments
Non-Performance Related
Compensation
Performance
Related
Compensation
Cash Compensation
(without long-term
Incentive Components)
Salary Other1)
Bonus
2013 2012 2013 2012 2013 2012 2013 2012
in thousands in thousands
in thousands in thousands Rice Powell $ 1,250 $ 990 $ 224 $ 40 $ 495 $ 1,587 $ 1,969 $ 2,617
Michael Brosnan 725 675 193 317 287 998 1,205 1,990
Roberto Fusté 730 707 400 322 370 889 1,500 1,918
Dr. Emanuele Gatti 973 899 165 148 702 1,204 1,840 2,251
Ronald Kuerbitz 850 - 35 - 668 - 1,553 -
Dr. Ben Lipps2) - 1,250 - 387 - 1,847 - 3,484
Dr. Rainer Runte 584 565 58 53 231 835 873 1,453
Dr. Olaf Schermeier 442 - 92 - 175 - 709 -
Kent Wanzek 521 520 70 37 403 834 994 1,391
Total $ 6,075 $ 5,606 $ 1,237 $ 1,304 $ 3,331 $ 8,194 $ 10,643 $ 15,104
1) Includes insurance premiums, private use of company cars, rent supplements, contributions to pension and health insurance and other benefits.
2) Chairman of the Management Board until December 31, 2012.
In addition to the Share Based Award, stock options under the Company's Stock Option Plan 2011 and
phantom stock awards under the Phantom Stock Plan 2011 were granted to members of the Management Board
as additional components with long-term incentive effects in the fiscal year. These stock-option and phantom-
stock components are granted during the course of each fiscal year. The Stock Option Plan 2011, together with
the Phantom Stock Plan 2011, forms the Long Term Incentive Program 2011 (LTIP 2011).
In addition to the Members of the management boards of affiliated companies, managerial staff members of
the Company and of certain affiliated companies the members of the Management Board are entitled to
participate in LTIP 2011. Under LTIP 2011 a combination of stock options and phantom stock awards are
granted to the participants. Stock options and phantom stock awards will be granted on specified grant days
during a period of five years. The number of stock options and phantom stock awards to be granted to the
members of the Management Board is determined by the Supervisory Board in its discretion. In principle all
members of the Management Board are entitled to receive the same number of stock options and phantom stock
awards, with the exception of the Chairman of the Management Board, who is entitled to receive double the
granted quantity. At the time of the grant participants can choose a ratio based on the value of the stock options
vs. the value of phantom stock awards in a range between 75:25 and 50:50. The exercise of stock options and
phantom stock awards is subject to several conditions, including the expiration of a four year waiting period, the
consideration of black-out periods, the achievement of a defined success target and the existence of a service or
employment relationship. Stock options may be exercised within four years and phantom stock awards within
one year after the expiration of the waiting period. For Management Board members who are U.S. tax payers
specific conditions apply with respect to the exercise period of phantom stock awards. The success target is
achieved in each case if, during the waiting period, either the adjusted basic income per share increases by at
least eight per cent per annum in comparison to the previous year in each case or - if this is not the case - the
compounded annual growth rate of the adjusted basic income per share during the four years of the waiting
period reflects an increase of at least eight per cent per annum. If with regard to any reference year or more than
one of the four reference years within the waiting period neither the adjusted basic income per share increases by
at least eight per cent per annum in comparison to the previous year nor the compounded annual growth rate of
the adjusted basic income per share during the four years of the waiting period reflects an increase of at least
eight per cent per annum, the stock options and phantom stock awards subject to such waiting period are
cancelled to such proportion to which the success target was not achieved within the waiting period, i.e. in the
proportion of 25% for each year in which the target is not achieved within the waiting period, up to 100%.
Additional information regarding the basic principles of the LTIP 2011 and of the other employee
participation programs in place at the beginning of the fiscal year and secured by conditional capital, which
entitled their participants to convertible bonds or stock options (from which, however, in the past fiscal year no
further options could be issued), are described in more detail in Note 15, “Stock Options,” in the Notes to
Consolidated Financial Statements included in this report, in Item 6.E below, "Directors, Senior Management
and Employees - Share Ownership - Options to Purchase Our Securities" and in Item 10.B below, "Additional
Information - Articles of Association - General Information Regarding Our Share Capital - Conditional Capital."

88
Under Stock Option Plan 2011 in the fiscal year 2,141,076 stock options were granted in total (2012:
2,166,035), with 328,680 stock options (2012: 310,005) granted to the Management Board members. Moreover,
in the fiscal year 186,392 (2012: 178,729) phantom stock awards were granted under the Phantom Stock Plan
2011, of which 25,006 awards (2012: 23,407) were granted to Management Board members.
For the fiscal year the number and value of stock options issued to members of the Management Board and
the value of the share based compensations with cash settlement paid to them, each as compared to the previous
year, are shown individually in the following table:
Components with Long-term Incentive Effect
Share-based
Compensation with
Cash Settlement1)
Total
Stock Options
2013 2012 2013 2012 2013 2012 2013 2012
Number in thousands in thousands in thousands
Rice Powell 74,700 56,025 $ 884 $ 870 $ 476 $ 794 $ 1,360 $ 1,664
Michael Brosnan 37,350 37,350 442 580 251 509 693 1,089
Roberto Fusté 37,350 37,350 442 580 278 473 720 1,053
Dr. Emanuele Gatti 29,880 29,880 354 464 482 703 836 1,167
Ronald Kuerbitz 37,350 - 442 - 378 - 820 -
Dr. Ben Lipps2) - 74,700 - 1,160 - 969 - 2,129
Dr. Rainer Runte 37,350 37,350 442 580 232 455 674 1,035
Dr. Olaf Schermeier 37,350 - 442 - 214 - 656 -
Kent Wanzek 37,350 37,350 442 580 290 455 732 1,035
Total 328,680 310,005 $ 3,890 $ 4,814 $ 2,601 $ 4,358 $ 6,491 $ 9,172
1) This includes Phantom Stocks granted to Board Members during the fiscal year. The share-based compensation amounts are based on the grant
date fair value.
2) Chairman of the Management Board until December 31, 2012.
The stated values of the stock options granted to the members of the Management Board in the fiscal year
correspond to their fair value at the time of grant, namely a value of $11.84 (€8.92) (2012: $15.53/€12.68) per
stock option. The exercise price for the stock options granted is $66.03 (€49.76) (2012: $70.17/€57.30).
At the end of the fiscal year, the members of the Management Board held a total of 1,993,305 stock options
and convertible bonds (collectively referred to as stock options; 2012: 2,201,205 stock options).
The development and status of stock options of the members of the Management Board in the fiscal year are
shown in more detail in the following table:
Development and status of the stock options
Rice Michael Roberto Dr. Emanuele Ronald Dr. Rainer Dr. Olaf Kent
Powell Brosnan Fusté Gatti Kuerbitz Runte Schermeier Wanzek Total
Options outstanding at January 1, 2013
Number 336,150 340,878 359,169 334,698 184,002 321,210 - 160,500 2,036,607
Weighted average exercise price in $ 59.02 50.16 51.88 50.40 58.96 54.36 - 63.93 54.51
Options granted during the fiscal year
Number 74,700 37,350 37,350 29,880 37,350 37,350 37,350 37,350 328,680
Weighted average exercise price in $ 66.03 66.03 66.03 66.03 66.03 66.03 66.03 66.03 66.03
Options exercised during the fiscal year
Number 49,800 47,244 49,800 125,538 - 99,600 - - 371,982
Weighted average exercise price in $ 46.77 35.39 42.05 38.09 - 44.41 - - 41.13
Weighted average share price in $ 51.09 52.21 52.18 49.75 - 53.29 - - 51.51
Options outstanding at December 31, 2013
Number 361,050 330,984 346,719 239,040 221,352 258,960 37,350 197,850 1,993,305
Weighted average exercise price in $ 62.70 54.35 55.09 59.15 60.59 60.25 68.62 64.82 59.33
Weighted average remaining
contractual life in years 4.76 3.50 3.37 4.07 4.10 4.28 7.58 5.00 4.17
Range of exercise price in $ 44.09 - 79.02 27.94 - 79.02 27.94 - 79.02 44.09 - 79.02 44.09 - 79.02 44.09 - 79.02 68.62 - 68.62 44.09 - 79.02 27.94 - 79.02
Options exercisable at December 31, 2013
Number 174,300 218,934 234,669 149,400 124,002 149,400 - 85,800 1,136,505
Weighted average exercise price in $ 51.81 44.63 49.38 50.63 50.86 50.63 - 53.68 49.03

89
Based on the targets achieved in the fiscal year, members of the Management Board also earned entitlements
to Share Based Awards totalling $1.110 million (2012: $2.751 million). On the basis of that value, determination
of the specific number of virtual shares will not be made by the Supervisory Board until March of the following
year, based on the then current price of the ordinary shares of FMC-AG & Co. KGaA. This number will then
serve as a multiplier for the share price and as a base for calculation of the payment of this respective share-
based compensation after the three-year waiting period.
Phantom stocks with a total value of $1.491 million (2012: $1.607 million) were granted to the Management
Board members under the Company's Phantom Stock Plan 2011 in July of the fiscal year as further share-based
compensation components with cash settlement.
Therefore, the amount of the total compensation of the Management Board for the fiscal year and for the
previous year is as shown in the following table:
Total Compensation
Cash Compensation
(without long-term
Incentive
components)
Components with
long-term Incentive
Effect
Total Compensation
(including long-term
Incentive
Components)
2013 2012 2013 2012 2013 2012
in thousands in thousands in thousands
Rice Powell $ 1,969 $ 2,617 $ 1,360 $ 1,664 $ 3,329 $ 4,281
Michael Brosnan 1,205 1,990 693 1,089 1,898 3,079
Roberto Fusté 1,500 1,918 720 1,053 2,220 2,971
Dr. Emanuele Gatti 1,840 2,251 836 1,167 2,676 3,418
Ronald Kuerbitz 1,553 - 820 - 2,373 -
Dr. Ben Lipps1) - 3,484 - 2,129 - 5,613
Dr. Rainer Runte 873 1,453 674 1,035 1,547 2,488
Dr. Olaf Schermeier 709 - 656 - 1,365 -
Kent Wanzek 994 1,391 732 1,035 1,726 2,426
Total $ 10,643 $ 15,104 $ 6,491 $ 9,172 $ 17,134 $ 24,276
1) Chairman of the Management Board until December 31, 2012.
Components with long-term incentive effects, i.e. stock options and share-based compensation components
with cash settlement, can be exercised only after the expiration of the specified vesting period. Their value is
allocated over the vesting period recognized as an expense in the respective fiscal year of the vesting period.
Compensation expenses attributable to the fiscal year and for the previous year are shown in the following table:
Expenses for Long-term Incentive Components
Stock Options
Share-based
Compensation with
Cash Settlement
Share-based
Compensation
2013 2012 2013 2012 2013 2012
in thousands in thousands in thousands
Rice Powell $ 432 $ 690 $ 586 $ 564 $ 1,018 $ 1,254
Michael Brosnan 272 397 333 239 605 636
Roberto Fusté 272 492 308 284 580 776
Dr. Emanuele Gatti 239 447 495 602 734 1,049
Ronald Kuerbitz 46 - 17 - 63 -
Dr. Ben Lipps1) - 2,745 - 2,160 - 4,905
Dr. Rainer Runte 275 481 353 242 628 723
Dr. Olaf Schermeier 46 - 17 - 63 -
Kent Wanzek 272 397 287 211 559 608
Total $ 1,854 $ 5,649 $ 2,396 $ 4,302 $ 4,250 $ 9,951
1) Chairman of the Management Board until December 31, 2012.

90
Commitments to Members of the Management Board for the Event of the Termination of their Appointment
The following pension commitments and other benefits are also part of the compensation system for the
members of the Management Board: there are individual contractual pension commitments for the Management
Board members Mr. Rice Powell, Mr. Roberto Fusté, Dr. Emanuele Gatti, Dr. Rainer Runte, Mr. Michael
Brosnan and Mr. Kent Wanzek. Under all of these commitments, Fresenius Medical Care Management AG as of
the end of the fiscal year has aggregate pension obligations of $25.210 million (2012: $19.494 million).
Each of the pension commitments provides for a pension and survivor benefit as of the time of conclusively
ending active work, at age 65 at the earliest (at age 60 at the earliest with respect to Dr. Emanuele Gatti) or upon
occurrence of disability or incapacity to work (Berufs- oder Erwerbsunfähigkeit), however, calculated by
reference to the amount of the recipient’s most recent base salary.
The retirement pension will be based on 30% of the last fixed compensation and will increase for each
complete year of service by 1.5 percentage points up to a maximum of 45%. Current pensions increase according
to legal requirements (Sec. 16 of the German Act to improve company pension plans, “BetrAVG”). 30% of the
gross amount of any post-retirement income from an activity of the Management Board member is offset against
the pension obligation. Any amounts to which the Management Board members or their surviving dependents,
respectively, are entitled from other company pension rights of the Management Board member, even from
service agreements with other companies, are also to be set off. If a Management Board member dies, the
surviving spouse receives a pension amounting to 60% of the resulting pension claim at that time. Furthermore,
the deceased Management Board member’s own legitimate children (leibliche eheliche Kinder) receive an
orphan’s pension amounting to 20% of the resulting pension claim at that time, until the completion of their
education or they reach 25 years of age, at the latest. All orphans’ pensions and the spousal pension together
reach a maximum of 90% of the Management Board member’s pension, however. If a Management Board
member leaves the Management Board of Fresenius Medical Care Management AG before he reaches 65 or (in
the case of Dr. Gatti) 60, except in the event of a disability or incapacity to work (Berufs- oder
Erwerbsunfähigkeit), the rights to the aforementioned benefits remain, although the pension to be paid is reduced
in proportion to the ratio of the actual years of service as a Management Board member to the potential years of
service until reaching 65 or (in the case of Dr. Gatti) 60 years of age.
Management Board members Mr. Rice Powell, Mr. Michael Brosnan, Mr. Ronald Kuerbitz and Mr. Kent
Wanzek participated in the U.S.-based 401(k) savings plan in the fiscal year. This plan generally allows
employees in the U.S. to invest a portion of their gross salaries in retirement pension programs. The Company
supports this investment, for full-time employees with at least one year of service, with a contribution of 50% of
the investment made, up to a limit of 6% of income - whereupon the allowance paid by the Company is limited
to 3% of the income - or a maximum of $17,500 ($23,000 for employees 50 years of age or older). The
aforementioned Management Board members were each contractually enabled to participate in this plan; in the
past fiscal year the Company paid out $8.800 million (2012: $9.239 million) respectively in this regard.
Furthermore, the Management Board members Mr. Rice Powell, Mr. Michael Brosnan and Mr. Ronald
Kuerbitz have acquired non-forfeitable benefits from participation in employee pension plans of Fresenius
Medical Care North America, which provide payment of pensions as of the age of 65 and the payment of
reduced benefits as of the age of 55. In March 2002, the rights to receive benefits from the pension plans were
frozen at the level then applicable.
Additions to pension provisions in the fiscal year amounted to $5.678 million (2012: $10.893 million). The
pension commitments are shown in the following table:

91
Development and status of pension commitments
As of January 1,
2013 increase
As of December 31,
2013
in thousands
Rice Powell $ 5,048 $ 1,148 $ 6,196
Michael Brosnan 1,742 654 2,396
Roberto Fusté 3,978 934 4,912
Dr. Emanuele Gatti 6,597 2,055 8,652
Ronald Kuerbitz 209 (20) 189
Dr. Rainer Runte 1,672 494 2,166
Dr. Olaf Schermeier - - -
Kent Wanzek 763 413 1,176
Total $ 20,009 $ 5,678 $ 25,687
A post-employment non-competition covenant was agreed upon with all Management Board members. If
such covenant becomes applicable, the Management Board members receive compensation amounting to half
their annual base salaries for each year of respective application of the non-competition covenant, up to a
maximum of two years. The employment contracts of the Management Board members contain no express
provisions that are triggered by a change of control of the Company.
Miscellaneous
All members of the Management Board have received individual contractual commitments for the
continuation of their compensation in cases of sickness for a maximum of 12 months, although after six months
of sick leave, insurance benefits may be set off against such payments. If a Management Board member dies, the
surviving dependents will be paid three more monthly instalments after the month of death, not to exceed,
however, the amount due between the time of death and the scheduled expiration of the agreement.
With Dr. Ben Lipps, the Chairman of the Management Board until December 31, 2012, there is an
individual agreement instead of a pension provision, to the effect that, upon termination of his employment
contract/service agreement with Fresenius Medical Care Management AG, he will be retained to render
consulting services to the Company for a period of ten years. Accordingly, Fresenius Medical Care Management
AG and Dr. Ben Lipps entered into a consulting agreement for the period January 1, 2013 to December 31, 2022.
By this consulting agreement Dr. Ben Lipps will provide consulting services on certain fields and within a
specified time frame as well as complying with a non-compete covenant. The annual consideration to be granted
by Fresenius Medical Care Management AG for such services amounts for the fiscal year $730,000 (including
reimbursement of expenses, temporary reimbursement of property expenses, company car provided temporarily).
The present value of this agreement (including pension payments for the surviving spouse in case of death)
amounted to $4.872 million as at December 31 of the fiscal year.
In the fiscal year, no loans or advance payments of future compensation components were made to members
of the Management Board of Fresenius Medical Care Management AG.
The payments to U.S. Management Board members Mr. Rice Powell, Mr. Michael Brosnan and Mr. Kent
Wanzek were paid in part in the U.S. (USD) and in part in Germany (EUR). For the part paid in Germany, the
Company has agreed that due to varying tax rates in both countries, the increased tax burden to such
Management Board members arising from German tax rates in comparison to U.S. tax rates will be balanced (net
compensation). Pursuant to a modified net compensation agreement, these Management Board members will be
treated as if they were taxed in their home country, the United States, only. Therefore the gross amounts may be
retroactively changed. Since the actual tax burden can only be calculated in connection with the preparation of
the Board members' tax returns, subsequent adjustments may have to be made, which will then be retroactively
covered in future compensation reports.
To the extent permitted by law, Fresenius Medical Care Management AG undertook to indemnify the
members of the Management Board against claims against them arising out of their work for the Company and
its affiliates, if such claims exceed their liability under German law. To secure such obligations, the Company
has obtained directors & officers liability insurance carrying a deductible which complies with the requirements
of the German Stock Corporation Act (AktG). The indemnity applies for the time in which each member of the
Management Board is in office and for claims in this connection after termination of membership on the
Management Board in each case.

92
Former members of the Management Board did not receive any compensation in the fiscal year other than
that mentioned under section II. above and in the present section III. As of December 31 of the fiscal year,
pension obligations to these members exist in an amount of $2 million (2012: $852,000).
Compensation of the Supervisory Board of Fresenius Medical Care & Co. KGaA and Supervisory Board of
Management AG
The compensation of the FMC-AG & Co. KGaA Supervisory Board is set out in clause 13 of the Articles of
Association.
In accordance with this provision, the members of the Supervisory Board are to be reimbursed for the
expenses incurred in the exercise of their offices, which also include the applicable VAT.
As compensation, each Supervisory Board member receives in the first instance a fixed salary of $80,000
per respective complete fiscal year, payable in four equal instalments at the end of a calendar quarter. Should the
General Meeting resolve on a higher compensation, with a majority of three-fourths of the votes cast and taking
the annual results into account, such compensation shall apply.
The chairman of the Supervisory Board receives additional compensation of $80,000 and his deputy
additional compensation of $40,000 per respective complete fiscal year. In addition, each member of the
Supervisory Board shall also receive as a variable performance-related compensation component an additional
remuneration which is based upon the respective average growth in basic earnings per share of the Company
(EPS) during the period of the last three fiscal years prior to the payment date (3-year average EPS growth). The
amount of the variable remuneration component is $60,000 in case of achieving a 3-year average EPS growth
corridor from 8.00 to 8.99%, $70,000 in the corridor from 9.00 to 9.99% and $80,000 in case of a growth of
10.00% or more. If the aforementioned targets are reached, the respective variable remuneration amounts are
earned to their full extent, i.e. within these margins there is no pro rata remuneration. In any case, this variable
component is limited to a maximum of $80,000 per annum. Reciprocally, the members of the supervisory board
are only entitled to the variable remuneration component if the 3 year average EPS growth of at least 8.00% is
reached. The variable remuneration component, based on the target achievement, is in principle disbursed on a
yearly basis, namely following approval of the Company’s annual financial statements, this for the fiscal year
2013 based on the 3-year average EPS growth for the fiscal years 2011, 2012 and 2013.
As a member of a committee, a Supervisory Board member of FMC-AG & Co. KGaA additionally annually
receives $40,000, or, as chairman or vice chairman of a committee, $60,000 or $50,000, respectively payable in
identical instalments at the end of a calendar quarter. For memberships in the Nomination Committee and in the
Joint Committee as well as in the capacity of their respective chairmen and deputy chairmen, no separate
remuneration shall be granted. This also applies for the membership in the temporary Ad-hoc Committee in the
fiscal year 2013.
Should a member of the FMC-AG & Co. KGaA Supervisory Board be a member of the Supervisory Board
of the General Partner Fresenius Medical Care Management AG at the same time, and receive compensation for
his work on the Supervisory Board of Fresenius Medical Care Management AG, the compensation for the work
as a FMC-AG & Co. KGaA Supervisory Board member shall be reduced by half. The same applies to the
additional compensation for the chairman of the FMC-AG & Co. KGaA Supervisory Board and his deputy, to
the extent that they are at the same time chairman and deputy, respectively, of the Supervisory Board of
Fresenius Medical Care Management AG. If the deputy chairman of the FMC-AG & Co. KGaA Supervisory
Board is at the same time chairman of the Supervisory Board at Fresenius Medical Care Management AG, he
shall receive no additional compensation for his work as deputy chairman of the FMC-AG & Co. KGaA
Supervisory Board to this extent.
The compensation for the Supervisory Board of Fresenius Medical Care Management AG and the
compensation for its committees were charged to FMC-AG & Co. KGaA in accordance with section 7 paragraph
3 of the Articles of Association of FMC-AG & Co. KGaA.
The total compensation of the Supervisory Board of FMC-AG & Co. KGaA including the amount charged
by Fresenius Medical Care Management AG to FMC-AG & Co. KGaA, is listed in the following tables, with the
table immediately positioned hereinafter displaying the fixed compensation, whilst the subsequent table sets out
the performance related compensation:

93
Fixed compensation
for Supervisory Board
at FMC Management
AG
Fixed compensation
for Supervisory Board
at FMC-AG
& Co. KGaA
Compensation for
committee services at
FMC Management
AG
Compensation for
committee services at
FMC-AG
& Co. KGaA
Non-Performance
Related
Compensation
2013 2012 2013 2012 2013 2012 2013 2012 2013 2012
(in thousands)1) (in thousands)1) (in thousands)1) (in thousands)1) (in thousands)1)
Dr. Gerd Krick $ 40 $ 40 $ 120 $ 120 $ 60 $ 60 $ 47 $ 40 $ 267 $ 260
Dr. Dieter Schenk 60 60 60 60 50 50 0 - 170 170
Dr. Ulf M. Schneider2) 160 160 0 - 70 70 7 - 237 230
Dr. Walter L. Weisman 40 40 40 40 50 50 67 60 197 190
William P. Johnston 40 40 40 40 120 120 47 40 247 240
Prof. Dr. Bernd
Fahrholz3) 0 - 80 80 - - 50 50 130 130
Rolf A. Classon 40 40 40 40 60 60 0 - 140 140
Total $ 380 $ 380 $ 380 $ 380 $ 410 $ 410 $ 218 $ 190 $ 1,388 $ 1,360
1) Shown without VAT and withholding tax
2) Chairman of the supervisory board of FMC Management AG, but not member of the supervisory board of FMC-AG & Co. KGaA; compensation paid by FMC Management AG
3) Member of the supervisory board of FMC-AG & Co. KGaA, but not member of the supervisory board of FMC Management AG; compensation paid by FMC-AG & Co. KGaA
Performance Related
Compensation in FMC
Management AG
Performance Related
Compensation in
FMC-AG & KGaA
Performance Related
Compensation Total compensation
2013 2012 2013 2012 2013 2012 2013 2012
(in thousands) (in thousands) (in thousands) (in thousands)
Dr. Gerd Krick $ - $ 35 $ - $ 35 $ - $ 70 $ 267 $ 400
Dr. Dieter Schenk - 35 - 35 - 70 170 310
Dr. Ulf M. Schneider1) - 70 - - - 70 237 370
Dr. Walter L. Weisman - 35 - 35 - 70 197 330
William P. Johnston - 35 - 35 - 70 247 380
Prof. Dr. Bernd Fahrholz2) - - - 70 - 70 130 270
Rolf A. Classon - 35 - 35 - 70 140 280
Total $ - $ 245 $ - $ 245 $ - $ 490 $ 1,388 $ 2,340
1) Chairman of the supervisory board of FMC Management AG, but not member of the supervisory board of FMC-AG & Co. KGaA
2) Member of the supervisory board of FMC-AG & Co. KGaA, but not member of the supervisory board of FMC Management AG
C. Board Practices
For information relating to the terms of office of the Management Board and the supervisory board of the
General Partner, Management AG, and of the Supervisory Board of FMC-AG & Co. KGaA, and the periods in
which the members of those bodies have served in office, see Item 6.A, “Directors, Senior Management and
Employees – Directors and Senior Management,” above. For information regarding certain compensation
payable to certain members of the General Partner’s Management Board after termination of employment, see
Item 6.B, “Directors, Senior Management and Employees – Compensation – Commitments to Members of
Management for the Event of the Termination of their Employment” above. Determination of the compensation
system and of the compensation to be granted to the members of the Management Board is made by the full
supervisory board of Management AG. It is assisted in these matters, particularly evaluation and assessment of
the compensation of the members of the General Partner’s management board, by the Human Resources
Committee of the General Partner’s supervisory board, the members of which are Dr. Ulf M. Schneider
(Chairman), Dr. Gerd Krick (Vice Chairman), Mr. William P. Johnston and Dr. Walter L. Weisman.
The Audit and Corporate Governance Committee of the Supervisory Board of FMC-AG & Co. KGaA
consisted of Dr. Walter L. Weisman (Chairman), Prof. Dr. Bernd Fahrholz (Vice Chairman), Dr. Gerd Krick and
Mr. William P. Johnston, all of whom are independent directors for purposes of SEC Rule 10A-3. The primary
function of the Audit and Corporate Governance Committee is to assist FMC-AG & Co. KGaA’s Supervisory
Board in fulfilling its oversight responsibilities, primarily through:
overseeing management’s accounting and financial reporting process, the internal performance of the
internal audit function and the effectiveness of the financial control systems;
overseeing the independence and performance of the FMC-AG & Co. KGaA’s outside auditors

94
overseeing the effectiveness of our systems and processes utilized to comply with relevant legal and
regulatory standards for global healthcare companies, including adherence to our Code of Business
Conduct;
overseeing the effectiveness of our internal risk management system;
overseeing our corporate governance performance according to the German Corporate Governance
Code;
providing an avenue of communication among the outside auditors, management and the Supervisory
Board;
overseeing our relationship with Fresenius SE & Co. KGaA and its affiliates and reviewing the report
of our General Partner on relations with related parties and for reporting to the overall Supervisory
Board thereon;
recommending to the Supervisory Board a candidate as independent auditors to audit our German
statutory financial statements (to be proposed by the Supervisory Board for approval by our
shareholders at our AGM) and approval of their fees;
retaining the services of our independent auditors to audit our U.S. GAAP financial statements and
approval of their fees; and
pre-approval of all audit and non-audit services performed by KPMG, our independent auditors.
The Audit and Corporate Governance Committee has also been in charge of conducting the internal
investigation described in Item 15B, “Management’s annual report on internal control over financial reporting.”
In connection with the settlement of the shareholder proceedings contesting the resolutions of the
Extraordinary General Meeting (“EGM”) held August 30, 2005 that approved the transformation, the conversion
of our preference shares into ordinary shares and related matters, we established a joint committee (the “Joint
Committee”) (gemeinsamer Ausschuss) of the supervisory boards of Management AG and FMC-AG & Co.
KGaA consisting of two members designated by each supervisory board to advise and decide on certain
extraordinary management measures, including:
transactions between us and Fresenius SE with a value in excess of 0.25% of our consolidated revenue,
and
acquisitions and sales of significant participations and parts of our business, the spin-off of significant
parts of our business, initial public offerings of significant subsidiaries and similar matters. A matter is
“significant” for purposes of this approval requirement if 40% of our consolidated revenues, our
consolidated balance sheet total assets or consolidated profits, determined by reference to the
arithmetic average of the said amounts shown in our audited consolidated accounts for the previous
three fiscal years, are affected by the matter.
Furthermore, a nomination committee prepares candidate proposals for the supervisory board and suggests
suitable candidates to supervisory board and for its nomination prospects to the General Meeting. The
nomination committee consisted of Dr. Gerd Krick (Chairman), Dr. Walter L. Weisman, Dr. Dieter Schenk.
The supervisory board of our General Partner, Management AG, is supported by a Regulatory and
Reimbursement Assessment Committee (the “RRAC”) whose members were Mr. William P. Johnston
(Chairman), Mr. Rolf A. Classon (Vice-Chairman) and Dr. Dieter Schenk. The primary function of the RRAC is
to assist and to represent the board in fulfilling its responsibilities, primarily through assessing the Company’s
affairs in the area of its regulatory obligations and reimbursement structures for dialysis services. In the United
States, these reimbursement regulations are mandated by the HHS and CMS for dialysis services. Similar
regulatory agencies exist country by country in the International regions to address the conditions for payment of
dialysis treatments. Furthermore, the supervisory board of Management AG has its own nomination committee,
which consisted of Dr. Ulf. M. Schneider (Chairman), Dr. Gerd Krick and Dr. Walter L. Weisman.
We are exempt from the NYSE rule requiring companies listed on that exchange to maintain compensation
committees consisting of independent directors. See Item 16G, “Corporate Governance.”

95
D. Employees
At December 31, 2013, we had 90,690 employees (full-time equivalents) as compared to 86,153 at
December 31, 2012, and 79,159 at December 31, 2011. The 5% increase in 2013 was mainly due to the overall
growth in our business and acquisitions. The following table shows the number of employees by our major
category of activities for the last three fiscal years.
2013 2012 2011
North America
Dialysis Care 45,651 42,767 37,584
Dialysis Products 8,663 8,494 7,904
54,314 51,261 45,488
International
Dialysis Care 24,356 23,529 22,787
Dialysis Products 11,880 11,240 10,697
36,236 34,769 33,484
Corporate 140 123 187
Total Company 90,690 86,153 79,159
We are members of the Chemical Industry Employers Association for most sites in Germany and we are
bound by union agreements negotiated with the respective union representatives. We generally apply the
principles of the association and the related union agreements for those sites where we are not members. We are
also party to additional shop agreements negotiated with works councils at individual facilities that relate to
those facilities. In addition, approximately 3% of our U.S. employees are covered by collective bargaining
agreements. During the last three fiscal years, we have not suffered any labor-related work disruptions.
E. Share ownership
As of December 31, 2013, no member of the Supervisory Board or the Management Board beneficially
owned 1% or more of our outstanding shares. At December 31, 2013, Management Board members of the
General Partner held options to acquire 1,993,305 ordinary shares of which options to purchase 1,136,505
ordinary shares were exercisable at a weighted average exercise price of €35.56 ($49.03). See Item 6.B,
“Directors, Senior Management and Employees – Compensation”. Those options expire at various dates between
2014 and 2021.
Options to Purchase Our Securities
Stock Option and Other Share Based Plans
Fresenius Medical Care AG & Co. KGaA Long Term Incentive Program 2011
On May 12, 2011, the FMC-AG & Co. KGaA Stock Option Plan 2011 (“2011 SOP”) was established by
resolution of the AGM. The 2011 SOP, together with the Phantom Stock Plan 2011, which was established by
resolution of the General Partner’s management and supervisory boards, forms the Company’s Long Term
Incentive Program 2011 (“2011 LTIP”). Under the 2011 LTIP, participants will be granted awards, which will
consist of a combination of stock options and phantom stock. Awards under the 2011 LTIP will be granted over
a five-year period and can be granted on the last Monday in July and/or the first Monday in December each year.
Prior to the respective grant, the participants will be able to choose how much of the granted value is granted in
the form of stock options and phantom stock in a predefined range of 75:25 to 50:50, stock options v. phantom
stock. The amount of phantom stock that plan participants may choose to receive instead of stock options within
the aforementioned predefined range is determined on the basis of a fair value assessment pursuant to a binomial
model. With respect to grants made in July, this fair value assessment will be conducted on the day following the
AGM and with respect to the grants made in December, on the first Monday in October.
Members of the Management Board of the General Partner, members of the management boards of the
Company’s affiliated companies and the managerial staff members of the Company and of certain affiliated
companies are entitled to participate in the 2011 LTIP. With respect to participants who are members of the

96
General Partner’s Management Board, the General Partner’s supervisory board has sole authority to grant awards
and exercise other decision making powers under the 2011 LTIP (including decisions regarding certain
adjustments and forfeitures). The General Partner has such authority with respect to all other participants in the
2011 LTIP.
The awards under the 2011 LTIP are subject to a four-year vesting period. The vesting of the awards granted
is subject to achievement of performance targets measured over a four-year period beginning with the first day of
the year of the grant. For each such year, the performance target is achieved if the Company’s adjusted basic
income per ordinary share (“Adjusted EPS”), as calculated in accordance with the 2011 LTIP, increases by at
least 8% year over year during the vesting period or, if this is not the case, the compounded annual growth rate
of the Adjusted EPS reflects an increase of at least 8% per year of the Adjusted EPS during the four-year vesting
period. At the end of the vesting period, one-fourth of the awards granted is forfeited for each year in which the
performance target is not achieved. All awards are considered vested if the compounded annual growth rate of
the Adjusted EPS reflects an increase of at least 8% per year during the four-year vesting period. Vesting of the
portion or portions of a grant for a year or years in which the performance target is met does not occur until
completion of the four-year vesting period.
The 2011 LTIP was established with a conditional capital increase up to €12,000,000 subject to the issue of
up to twelve million non-par value bearer ordinary shares with a nominal value of €1.00, each of which can be
exercised to obtain one ordinary share. Of these twelve million shares, up to two million stock options are
designated for members of the Management Board of the General Partner, up to two and a half million stock
options are designated for members of management boards of direct or indirect subsidiaries of the Company and
up to seven and a half million stock options are designated for managerial staff members of the Company and
such subsidiaries. The Company may issue new shares to fulfill the stock option obligations or the Company
may issue shares that it has acquired or which the Company itself has in its own possession.
The exercise price of stock options granted under the 2011 LTIP shall be the average stock exchange price
on the Frankfurt Stock Exchange of the Company’s ordinary shares during the 30 calendar days immediately
prior to each grant date. Stock options granted under the 2011 LTIP have an eight-year term and can be
exercised only after a four-year vesting period. Stock options granted under the 2011 LTIP to US participants are
non-qualified stock options under the United States Internal Revenue Code of 1986, as amended. Options under
the 2011 LTIP are not transferable by a participant or a participant’s heirs, and may not be pledged, assigned, or
disposed of otherwise.
Phantom stock under the 2011 LTIP entitles the holders to receive payment in Euro from the Company upon
exercise of the phantom stock. The payment per phantom share in lieu of the issuance of such stock shall be
based upon the stock exchange price on the Frankfurt Stock Exchange of one of the Company’s Ordinary shares
on the exercise date. Phantom stock will have a five-year term and can be exercised only after a four-year
vesting period, beginning with the grant date. For participants who are U.S. tax payers, the phantom stock is
deemed to be exercised in any event in the March following the end of the vesting period.
Incentive plan
In 2013, the Management Board was eligible for performance–related compensation that depended upon
achievement of targets. The targets are measured by reference to operating income margin, net income growth
and free cash flow (net cash provided by operating activities after capital expenditures before acquisitions and
investments) in percentage of revenue, and are derived from the comparison of targeted and actually achieved
current year figures. Targets are divided into Group level targets and those to be achieved in individual regions
and areas of responsibility.
Those performance-related bonuses for fiscal year 2013 will consist proportionately of a cash component
and a share-based component which will be paid in cash. Upon meeting the annual targets, the cash component
will be paid after the end of 2013. The share-based component is subject to a three- or four-year vesting period,
although a shorter period may apply in special cases. The amount of cash for the payment relating to the share-
based component shall be based on the closing share price of Fresenius Medical Care AG & Co. KGaA ordinary
shares upon exercise. The amount of the achievable bonus for each of the members of the Management Board is
capped.
In 2006, Management AG adopted a three-year performance related compensation plan for fiscal years 2008,
2007 and 2006, for the members of its Management Board in the form of a variable bonus. A special bonus
component (award) for some of the management board members consisted in equal parts of cash payments and a
share-based compensation based on development of the share price of FMC-AG & Co. KGaA’s ordinary shares.
The amount of the award in each case depended on the achievement of certain performance targets. The targets

97
were measured by reference to revenue growth, operating income, consolidated net income, and cash flow
development. Annual targets have been achieved and the cash portion of the award has been paid after the end of
the respective fiscal year. The share-based compensation portion of the award has been granted but subject to a
three-year vesting period beginning after the respective fiscal year in which the target has been met and is
amortized over the same three-year vesting period. The payment of the share-based compensation portion
corresponds to the share price of FMC-AG & Co. KGaA’s ordinary shares on exercise, i.e. at the end of the
vesting period, and was also made in cash. The share-based compensation was revalued each reporting period
during the vesting period to reflect the market value of the stock as of the reporting date with any changes in
value recorded in the reporting period. This plan was fully utilized at the end of 2011.
The share-based compensation incurred under these plans for years 2013, 2012 and 2011 was $ 1.1 million,
$ 2.8 million and $ 2.3 million, respectively.
Fresenius Medical Care AG & Co. KGaA Stock Option Plan 2006 and prior plans
On May 9, 2006, as amended on May 15, 2007 for a three-for-one share split (the “Share Split”), the FMC-
AG & Co. KGaA Stock Option Plan 2006 (the “Amended 2006 Plan”) was established by resolution of our
AGM with a conditional capital increase up to €15,000,000 subject to the issue of up to fifteen million no par
value bearer ordinary shares with a nominal value of €1.00 each. Under the Amended 2006 Plan, up to fifteen
million options can be issued, each of which can be exercised to obtain one ordinary share, with up to three
million options designated for members of the management board, up to three million options designated for
members of management boards of direct or indirect subsidiaries of the Company and up to nine million options
designated for managerial staff members of the Company and such subsidiaries. With respect to participants who
are members of the Management Board, the General Partner’s supervisory board has sole authority to grant stock
options and exercise other decision making powers under the Amended 2006 Plan (including decisions regarding
certain adjustments and forfeitures). The Management Board has such authority with respect to all other
participants in the Amended 2006 Plan.
Options under the Amended 2006 Plan were granted the last Monday in July and/or the first Monday in
December. The exercise price of options granted under the Amended 2006 Plan shall be the average closing
price on the Frankfurt Stock Exchange of our ordinary shares during the 30 calendar days immediately prior to
each grant date. Options granted under the Amended 2006 Plan have a seven-year term but can be exercised only
after a three-year vesting period. The vesting of options granted is subject to achievement of performance
targets, measured over a three-year period from the grant date. For each such year, the performance target is
achieved if our adjusted basic income per ordinary share (“EPS”), as calculated in accordance with the Amended
2006 Plan, increases by at least 8% year over year during the vesting period, beginning with EPS for the year of
grant as compared to EPS for the year preceding such grant. Calculation of EPS under the Amended 2006 Plan
excludes, among other items, the costs of the transformation of our legal form to a KGaA and the conversion of
preference shares into ordinary shares. For each grant, one-third of the options granted are forfeited for each year
in which EPS does not meet or exceed the 8% target. The performance targets for 2012, 2011, and 2010 were
met but the options that vested will not be exercisable until expiration of the full 3-year vesting period of each
year’s grants. Vesting of the portion or portions of a grant for a year or years in which the performance target is
met does not occur until completion of the entire three-year vesting period. The last grant under the Amended
2006 Plan took place on December 6, 2010. No further grants are possible under the Amended 2006 Plan. For
information regarding options granted to each member of the Management Board, see Item 6.B, “-
Compensation of the Management Board” above.
Options granted under the Amended 2006 Plan to U.S. participants are non-qualified stock options under the
United States Internal Revenue Code of 1986, as amended. Options under the Amended 2006 Plan are not
transferable by a participant or a participant’s heirs, and may not be pledged, assigned, or otherwise disposed of.
At December 31, 2013, we had awards outstanding under the terms of various prior stock-based
compensation plans, including the 2001 plan. Under the 2001 plan as amended on May 16, 2013 for a
conversion of preference shares to ordinary shares, convertible bonds with a principal of up to €10,240,000 were
issued to the members of the Management Board and other employees of the Company initially representing
grants for up to 4 million non-voting Preference shares. Following the Share Split in 2007 and the conversion of
preference shares into ordinary shares in 2013, the convertible bonds have a par value of €0.85, bear interest at a
rate of 5.5% and are entitled to convert into ordinary shares instead of non-voting preference shares. Except for
the members of the Management Board, eligible employees were able to purchase the bonds by issuing a non-
recourse note with terms corresponding to the terms of and secured by the bond. We have the right to offset our
obligation on a bond against the employee’s obligation on the related note; therefore, the convertible bond
obligations and employee note receivables represent stock options we issued and are not reflected in the

98
consolidated financial statements. The options expire in ten years and one third of each grant can be exercised
beginning after two, three or four years from the date of the grant. Bonds issued to Board members who did not
issue a note to us are recognized as a liability on our balance sheet.
Upon issuance of the option, the employees had the right to choose options with or without a stock price
target. The conversion price of options subject to a stock price target becomes the stock exchange quoted price of
the ordinary shares upon the first time the stock exchange quoted price exceeds the initial value by at least 25%.
The initial value (“Initial Value”) is the average price of the shares during the last 30 trading days prior to the
date of grant. In the case of options not subject to a stock price target, the number of convertible bonds awarded
to the eligible employee would be 15% less than if the employee elected options subject to the stock price target.
The conversion price of the options without a stock price target is the Initial Value, as adjusted in accordance to
the Share Split. Each option entitles the holder thereof, upon payment the respective conversion price, to acquire
one ordinary share. Up to 20% of the total amount available for the issuance of awards under the 2001 plan could
be issued each year through May 22, 2006. Effective May 2006, no further grants could be issued under the 2001
plan.
At December 31, 2013, the Management Board members held 1,993,305 stock options for Ordinary shares
and employees of the Company held 8,797,450 stock options for ordinary shares with an average remaining
contractual life of 4.83 years and 4,711,245 exercisable ordinary options at a weighted average exercise price of
$50.21.
Item 7. Major Shareholders and Related Party Transactions
A. Major Shareholders
Security Ownership of Certain Beneficial Owners of Fresenius Medical Care
Our outstanding share capital consists of ordinary shares issued only in bearer form. Accordingly, unless we
receive information regarding acquisitions of our shares through a filing with the Securities and Exchange
Commission or through the German statutory requirements referred to below, or except as described below with
respect to our shares held in American Depository Receipt ("ADR") form, we face difficulties precisely
determining who our shareholders are at any specified time or how many shares any particular shareholder owns.
Because we are a foreign private issuer under the rules of the Securities and Exchange Commission, our
directors and officers are not required to report their ownership of our equity securities or their transactions in
our equity securities pursuant to Section 16 of the Securities and Exchange Act of 1934. However, persons who
become “beneficial owners” of more than 5% of our ordinary shares are required to report their beneficial
ownership pursuant to Section 13(d) of the Securities and Exchange Act of 1934. In addition, under the German
Securities Trading Act (Wertpapierhandelsgesetz or “WpHG”), persons who discharge managerial
responsibilities within an issuer of shares are obliged to notify the issuer and the German Federal Financial
Supervisory Authority (Bundesanstalt für Finanzdienstleistungsaufsicht or “BaFin”) of their own transactions in
shares of the issuer. This obligation also applies to persons who are closely associated with the persons
discharging managerial responsibility. Additionally, holders of voting securities of a German company listed on
the regulated market (Regulierter Markt) of a German stock exchange or a corresponding trading segment of a
stock exchange within the European Union are obligated to notify the company of the level of their holding
whenever such holding reaches, exceeds or falls below certain thresholds, which have been set at 3%, 5%, 10%,
15%, 20%, 25%, 30%, 50% and 75% of a company's outstanding voting rights. Such notification obligations will
also apply to other financial instruments that result in an entitlement to acquire shares or that causes the hedging
of shares (excluding the 3% threshold).
We have been informed that as of February 19, 2014, Fresenius SE owned 94,380,382, approximately
31.3%, of our ordinary shares.. The following schedule illustrates the latest threshold notifications furnished to
us by third parties pursuant to the German Securities Trading Act:

99
Voting Rights Notifications (Last Reported Status)
Notifiying party
Date of reaching,
exceeding or
falling bellow
Reporting
threshold Reporting criteria
Percentage of
voting rights
Number of
voting rights
BlackRock Financial
Management, Inc.,
New York, USA
September 18, 2012 5% Exceeding
Attribution pursuant
to Section 22 (1)
sentence 1 No. 6 as
well as (1) sentence 2
WpHG
5.002 15,105,551
BlackRock Holdco 2,
Inc.,
Wilmington, USA
September 18, 2012 5% Exceeding
Attribution pursuant
to Section 22 (1)
sentence 1 No. 6 as
well as (1) sentence 2
WpHG
5.002 15,105,551
BlackRock, Inc.,
New York, USA December 19, 2012
5% Falling
below
Attribution pursuant
to Section 22 (1)
sentence 1 No. 6 as
well as (1) sentence 2
WpHG
4.970 15,017,045
British Ministry of
Finance
(HM Treasury),
London, United
Kingdom
May 21, 2013 3% Falling
below
Attribution pursuant
to Section 22 (1)
sentence 1 No. 1
WpHG
1.270 3,847,973
The Royal Bank of
Scotland Group plc,
Edinburgh, United
Kingdom
May 21, 2013 3% Falling
below
Attribution pursuant
to Section 22 (1)
sentence 1 No. 1
WpHG
1.270 3,847,973
The Royal Bank of
Scotland plc,
Edinburgh, United
Kingdom
May 21, 2013 3% Falling
below Section 21 (1) WpHG 1.270 3,847,973
Thornburg
Investment
Management, Inc.,
Santa Fé, USA
January 31, 2014 5% Falling
below
Attribution pursuant
to Section 22 (1)
sentence 1 No. 6
WpHG
4.960 15,321,357
Mr. Garrett
Thornburg, USA January 31, 2014
5% Falling
below
Attribution pursuant
to Section 22 (1)
sentence 1 No. 6 as
well as sentence 2
WpHG
4.960 15,321,357
All of our ordinary shares have the same voting rights. However, as the sole shareholder of our General
Partner, Fresenius SE is barred from voting its ordinary shares on certain matters. See Item 16.G, “Corporate
Governance – Supervisory Board.”
Bank of New York Mellon, our ADR depositary, informed us, that as of December 31, 2013, 25,705,490
ordinary ADSs, each representing one half of an ordinary share, were held of record by 3,713 U.S. holders. For
more information regarding ADRs and ADSs see Item 10.B, "Memorandum and Articles of Association –
Description of American Depositary Receipts."
Security Ownership of Certain Beneficial Owners of Fresenius SE
Fresenius SE’s share capital consists solely of ordinary shares, issued only in bearer form. Accordingly,
Fresenius SE has difficulties precisely determining who its shareholders are at any specified time or how many
shares any particular shareholder owns. However, under the German Securities Trading Act, holders of voting
securities of a German company listed on the regulated market (Regulierter Markt) of a German stock exchange

100
or a corresponding trading segment of a stock exchange within the European Union are obligated to notify the
company of certain levels of holdings, as described above.
The Else Kröner-Fresenius Stiftung is the sole shareholder of Fresenius Management SE, the general partner
of Fresenius SE, and has sole power to elect the supervisory board of Fresenius Management SE. In addition,
based on the most recent information available, Else Kröner-Fresenius Stiftung owns approximately 26.8% of
the Fresenius SE ordinary shares. See Item 7.B, “Related party transactions – Other interests,” below. According
to the last information received from Allianz SE, they hold, indirectly, approximately 4.26% of the Fresenius SE
ordinary shares.
B. Related party transactions
In connection with the formation of FMC-AG & Co. KGaA, and the combination of the dialysis businesses
of Fresenius SE and W.R. Grace & Co. in 1996, Fresenius SE and its affiliates and FMC-AG & Co. KGaA and
its affiliates entered into several agreements for the purpose of giving effect to the Merger and defining our
ongoing relationship. Fresenius SE and W.R. Grace & Co. negotiated these agreements. The information below
summarizes the material aspects of certain agreements, arrangements and transactions between FMC-AG & Co.
KGaA and Fresenius SE and their affiliates. The following descriptions are not complete and are qualified in
their entirety by reference to those agreements, which have been filed with the Securities and Exchange
Commission and the New York Stock Exchange. We believe that the leases, the supply agreements and the
service agreements are no less favorable to us and no more favorable to Fresenius SE than would have been
obtained in arm's-length bargaining between independent parties. The trademark and other intellectual property
agreements summarized below were negotiated by Fresenius SE and W.R. Grace & Co., and, taken
independently, are not necessarily indicative of market terms.
Dr. Gerd Krick, Chairman of our Supervisory Board, is also a member of the supervisory board of our
General Partner as well as Chairman of the supervisory board of Fresenius SE and Chairman of the supervisory
board of its general partner, Fresenius Management SE. Dr. Dieter Schenk, Vice Chairman of the supervisory
board of our General Partner and of the Supervisory Board of FMC-AG & Co. KGaA, is also Vice Chairman of
the supervisory board of Fresenius Management SE, and Dr. Ulf M. Schneider, Chairman of the supervisory
board of our General Partner and a former member of the Management Board of FMC-AG & Co. KGaA, is
Chairman of the management board of Fresenius Management SE. Mr. Rolf A. Classon, Dr. Walter L.
Weisman and Mr. William P. Johnston are members of both our Supervisory Board and our general partner’s
supervisory board.
In the discussion below regarding our contractual and other relationships with Fresenius SE:
the term "we (or us) and our affiliates" refers only to FMC-AG & Co. KGaA and its subsidiaries; and
the term "Fresenius SE and its affiliates" refers only to Fresenius SE and affiliates of Fresenius SE
other than FMC-AG & Co. KGaA and its subsidiaries.
Real Property Lease
We did not acquire the land and buildings in Germany that Fresenius Worldwide Dialysis used when we
were formed in 1996. Fresenius SE or its affiliates have leased part of the real property to us, directly, and
transferred the remainder of that real property to two limited partnerships. Fresenius SE is the sole limited
partner of each partnership, and the sole shareholder of the general partner of each partnership. These limited
partnerships, as landlords, have leased the properties to us and to our affiliates, as applicable, for use in our
respective businesses. The aggregate annual rent payable by us under these leases is approximately €20.3
million, which was approximately $27.0 million as of December 31, 2013, exclusive of maintenance and other
costs, and is subject to escalation, based upon development of the German consumer-price-index determined by
the Federal Statistical Office (Statistisches Bundesamt). The leases for manufacturing facilities have a ten-year
term, followed by two successive optional renewal terms of ten years each at our election. The leases for the
other facilities have a term of ten years. The current option period for the lease agreements is set to expire in
2016. Based upon an appraisal, we believe that the rents under the leases represent fair market value for such
properties. For information with respect to our principal properties in Germany, see "Item 4.D. Property, plants
and equipment."

101
Trademarks
Fresenius SE continues to own the name and mark "Fresenius" and its "F" logo. Fresenius SE and
Fresenius Medical Care Deutschland GmbH, one of our German subsidiaries, have entered into agreements
containing the following provisions. Fresenius SE has granted to our German subsidiary, for our benefit and
that of our affiliates, an exclusive, worldwide, royalty-free, perpetual license to use "Fresenius Medical Care"
in our company names, and to use the Fresenius marks, including some combination marks containing the
Fresenius name that were used by the worldwide dialysis business of Fresenius SE, and the “Fresenius Medical
Care” name as a trade name, in all aspects of the renal business. Our German subsidiary, for our benefit and
that of our affiliates, has also been granted a worldwide, royalty-free, perpetual license:
to use the "Fresenius Medical Care" mark in the then current National Medical Care non-renal
business if it is used as part of "Fresenius Medical Care" together with one or more descriptive words,
such as "Fresenius Medical Care Home Care" or "Fresenius Medical Care Diagnostics";
to use the "F" logo mark in the National Medical Care non-renal business, with the consent of
Fresenius SE. That consent will not be unreasonably withheld if the mark using the logo includes one
or more additional descriptive words or symbols; and
to use "Fresenius Medical Care" as a trade name in the renal business
We and our affiliates have the right to use "Fresenius Medical Care" as a trade name in other medical
businesses only with the consent of Fresenius SE. Fresenius SE may not unreasonably withhold its consent. In
the U.S. and Canada, Fresenius SE will not use "Fresenius" or the "F" logo as a trademark or service mark,
except that it is permitted to use "Fresenius" in combination with one or more additional words such as
"Pharma Home Care" as a service mark in connection with its home care business and may use the "F" logo as
a service mark with the consent of our principal German subsidiary. Our subsidiary will not unreasonably
withhold its consent if the service mark includes one or more additional descriptive words or symbols.
Similarly, in the U.S. and Canada, Fresenius SE has the right to use "Fresenius" as a trade name, but not as a
mark, only in connection with its home care and other medical businesses other than the renal business and
only in combination with one or more other descriptive words, provided that the name used by Fresenius SE is
not confusingly similar to our marks and trade names. Fresenius SE's ten-year covenant not to compete with us,
granted in 1996, has expired, and Fresenius SE may use "Fresenius" in its corporate names if it is used in
combination with one or more additional distinctive word or words, provided that the name used by Fresenius
SE is not confusingly similar to the Fresenius Medical Care marks or corporate or trade names.
Other Intellectual Property
Some of the patents, patent applications, inventions, know-how and trade secrets that Fresenius Worldwide
Dialysis used prior to our formation were also used by other divisions of Fresenius SE. For Biofine®, the
polyvinyl chloride-free packaging material, Fresenius SE has granted to our principal German subsidiary, for
our benefit and for the benefit of our affiliates, an exclusive license for the renal business and a non-exclusive
license for all other fields except other non-renal medical businesses. Our German subsidiary and Fresenius SE
share equally any royalties from licenses of the Biofine® intellectual property by either our German subsidiary
or by Fresenius SE to third parties outside the renal business and the other non-renal medical businesses. In
addition, Fresenius SE transferred to our German subsidiary the other patents, patent applications, inventions,
know-how and trade secrets that were used predominantly in Fresenius SE's dialysis business. In certain cases
Fresenius Worldwide Dialysis and the other Fresenius SE divisions as a whole each paid a significant part of
the development costs for patents, patent applications, inventions, know-how and trade secrets that were used
by both prior to the Merger. Where our German subsidiary acquired those jointly funded patents, patent
applications, inventions, know-how and trade secrets, our subsidiary licensed them back to Fresenius SE
exclusively in the other non-renal medical businesses and non-exclusively in all other fields. Where Fresenius
SE retained the jointly funded patents, patent applications, inventions, know-how and trade secrets, Fresenius
SE licensed them to our German subsidiary exclusively in the renal business and non-exclusively in all other
fields.
Supply Agreements and Arrangements
We produce most of our products in our own facilities. However, Fresenius Kabi AG, a wholly-owned
subsidiary of Fresenius SE, manufactures some of our products for us, principally dialysis concentrates and
other solutions, at facilities located in Germany, Brazil, France and South Africa. Conversely, our facilities in
Germany and Italy produce products for Fresenius Kabi AG.

102
Our local subsidiaries and those of Fresenius SE have entered into supply agreements for the purchase and
sale of products from the above facilities. Prices under the supply agreements are determined by good-faith
negotiation. During 2013, we sold products to Fresenius SE in the amount of $30.1 million. In 2013, we made
purchases from Fresenius SE in the amount of $34.2 million.
The parties may modify existing or enter into additional supply agreements, arrangements and transactions.
Any future modifications, agreements, arrangements and transactions will be negotiated between the parties
and will be subject to the approval provisions of the pooling agreements and the regulatory provisions of
German law regarding dominating enterprises.
On September 10, 2008, Fresenius Kabi AG acquired Fresenius Kabi USA, Inc. (formerly APP
Pharmaceuticals Inc.) (“Kabi USA”), which manufactures and sells sodium heparin. Heparin is a blood
thinning drug that is widely and routinely used in the treatment of dialysis patients to prevent life-threatening
blood clots. FMCH currently purchases heparin supplied by Kabi USA through MedAssets, Inc. MedAssets
Inc. is a publicly-traded U.S. corporation that provides inventory purchasing services to healthcare providers
through a group purchasing organization (“GPO”) structure. The Company has no direct supply agreement with
Kabi USA and does not submit purchase orders directly to Kabi USA. A GPO is an organization that endeavors
to manage supply and service costs for hospitals and healthcare providers by negotiating discounted prices with
manufacturers, distributors and other vendors. Vendors discount their prices and pay administrative fees to
GPOs because GPOs provide access to a large customer base, thus reducing vendors’ sales and marketing costs
and overhead. FMCH is one of many U.S. healthcare providers that participate in the MedAssets GPO. FMCH
purchases pharmaceuticals and supplies used in its dialysis services business through the MedAssets GPO
contract. During 2013, we acquired $17.7 million of heparin from Kabi USA through the GPO.
On July 3, 2013, we entered into an agreement with a Fresenius SE company for the manufacturing of
plasma collection devices. We agreed to produce 3,500 units, with an option to produce a total of 4,550 units.
Production of these units will commence in March of 2014 with an estimated contract value of approximately
$55 million. A fairness opinion was also obtained from a reputable global accounting firm.
Services Agreement
We obtain administrative and other services from Fresenius SE headquarters and from other divisions and
subsidiaries of Fresenius SE. These services relate to, among other things, administrative services, management
information services, employee benefit administration, insurance, IT services, tax services and treasury
services. For 2013, Fresenius SE and its affiliates charged us approximately $103.6 million for these services.
Conversely, we have provided certain services to other divisions and subsidiaries of Fresenius SE relating to
research and development, central purchasing and warehousing. For 2013 we charged approximately $7.6
million to Fresenius SE and its subsidiaries for services we rendered to them.
We and Fresenius SE may modify existing or enter into additional services agreements, arrangements and
transactions. Any such future modifications, agreements, arrangements and transactions will be negotiated
between the parties and will be subject to the approval provisions of the pooling agreements and the regulations
of German law regarding dominating enterprises.
Financing
During 2013, we received advances between €3.2 million and €100 million which carried interest rates
between 1.363% and 1.541%. See Note 10 of the Notes to Consolidated Financial Statements, “Short-Term
Borrowings and Short-Term Borrowings from Related Parties – Short-Term Borrowings from Related Parties.”
As of December 31, 2013, we had loans of CNY 352 million ($58.2 million) outstanding with a subsidiary of
Fresenius SE at a weighted average interest rate of 6.1%, with the majority of the loans due on May 23, 2014.
We also provided a loan of €4.4 million to Fresenius SE at an interest rate of 1.563% which came due and was
paid on January 3, 2014. On August 19, 2009, the Company borrowed €1.5 million ($2.0 million) from the
General Partner at 1.335%. The loan repayment is currently scheduled for August 20, 2014 at an interest rate of
1.796%. On November 28, 2013, the Company borrowed an additional €1.5 million ($2.0 million) from the
General Partner at 1.875%. This loan is due on November 28, 2014.
Other Interests
Dr. Dieter Schenk, Vice Chairman of the supervisory boards of FMC-AG Co. KGaA and of Management
AG and a member of the supervisory board of Fresenius Management SE, is a partner in the law firm of Noerr,
which has provided legal services to Fresenius SE and its subsidiaries and to FMC-AG & Co. KGaA and its

103
subsidiaries. The Company incurred expenses in the amount of $1.268 million, $1.519 million, and $2.120
million for these services during 2013, 2012, and 2011, respectively. Dr. Schenk is one of the executors of the
estate of the late Mrs. Else Kröner. Else Kröner-Fresenius-Stiftung, a charitable foundation established under
the will of the late Mrs. Kröner, is the sole shareholder of the general partner of Fresenius SE and owns
approximately 26.8% of the voting shares of Fresenius SE. Dr. Schenk is also the Chairman of the advisory
board of Else Kröner-Fresenius-Stiftung. See "— Security Ownership of Certain Beneficial Owners of
Fresenius SE."
Under the Articles of Association of FMC AG & Co. KGaA, we will pay Fresenius SE annual
compensation for assuming unlimited liability at 4% of the amount of the General Partner’s share capital. See
Item 16G, “Corporate Governance – The Legal Structure of FMC AG & Co. KGaA,” below.
General Partner Reimbursement
Management AG is a 100% wholly-owned subsidiary of Fresenius SE. The Company’s Articles of
Association provide that the General Partner shall be reimbursed for any and all expenses in connection with
management of the Company’s business, including compensation of the members of the General Partner’s
supervisory board and Management Board. The aggregate amount reimbursed to Management AG for 2013
was approximately $16.3 million for its management services during 2013 including $0.2 million as
compensation for its exposure to risk as general partner. The Company’s Articles of Association fix this
compensation as a guaranteed return of 4% of the amount of the General Partner’s share capital (which is
currently €3.0 million). See Item 16.G “Governance –The Legal Structure of FMC-AG & Co. KGaA” below.
Item 8. Financial information
The information called for by parts 8.A.1 through 8.A.6 of this item is in the section beginning on Page F-1.
8.A.7. Legal Proceedings
The information in Note 20 of the Notes to Consolidated Financial Statements, “Commitments and
Contingencies – Legal and Regulatory Matters,” in Part III, Item 18 of this report is incorporated by this
reference in response to this item. For information regarding certain tax audits and related claims, see Note 18 of
the Notes to Consolidated Financial Statements, “Income Taxes.”
8.A.8. Dividend Policy
We generally pay annual dividends on our shares in amounts that we determine on the basis of FMC-AG &
Co. KGaA’s prior year unconsolidated earnings as shown in the statutory financial statements that we prepare
under German law on the basis of the accounting principles of the German Commercial Code
(Handelsgesetzbuch or HGB), subject to authorization by a resolution to be passed at our general meeting of
shareholders. As of June 28, 2013 we converted all preference shares to ordinary shares and all options for
preference shares to options for ordinary shares. At December 31, 2013 we have only one class of shares
outstanding.
The General Partner and our Supervisory Board propose dividends and the shareholders approve dividends
for payment in respect of a fiscal year at the AGM in the following year. Since all of our shares are in bearer
form, we remit dividends to the depositary bank (Depotbank) on behalf of the shareholders.
Our 2012 Senior Credit Agreement restricts our ability to pay dividends. Item 5.B, “Operating and Financial
Review and Prospects – Liquidity and Capital Resources” and the notes to our consolidated financial statements
appearing elsewhere in this report discuss this restriction.
The table below provides information regarding the annual dividend per share that we paid on our Ordinary
shares. These payments were paid in the years shown for the results of operations in the year preceding the
payment.

104
Per Share Amount 2013 2012 2011
Ordinary share € 0.75 € 0.69 € 0.65
We have announced that the general partner’s Management Board and our Supervisory Board have proposed
dividends for 2013 payable in 2014 of €0.77 per ordinary share. These dividends are subject to approval by our
shareholders at our AGM to be held on May 15, 2014. Our goal is for dividend development to be more closely
aligned with our growth in basic earnings per share, while maintaining dividend continuity.
Except as described herein, holders of ADSs will be entitled to receive dividends on the Ordinary shares
represented by the respective ADSs. We will pay any cash dividends payable to such holders to the depositary in
euros and, subject to certain exceptions, the depositary will convert the dividends into U.S. dollars and distribute
the dividends to ADS holders. See Item 10, “Additional Information – Description of American Depositary
Receipts – Share Dividends and Other Distributions.” Fluctuations in the exchange rate between the U.S. dollar
and the euro will affect the amount of dividends that ADS holders receive. Dividends paid to holders and
beneficial holders of the ADSs will be subject to deduction of German withholding tax. You can find a
discussion of German withholding tax below in "Item 10.E. Taxation".
Item 9. The Offer and Listing Details
A.4. and C. Information regarding the trading markets for price history of our stock
Trading Markets
The principal trading market for our ordinary shares is the Frankfurt Stock Exchange (FWB®
Frankfurter
Wertpapierbörse). All ordinary shares have been issued in bearer form. Accordingly, we face difficulties
determining precisely who our holders of ordinary shares are or how many shares any particular shareholder
owns, with the exception of the number of shares held in ADR form in the United States. For more information
regarding ADRs see Item 10.B., “Memorandum and articles of association – Description of American
Depositary Receipts." However, under the German Securities Trading Act, holders of voting securities of a
German company listed on a stock exchange within the EU are obligated to notify the company of certain levels
of holdings as described in Item 7.A., “Major Shareholders." Additionally, persons discharging managerial
responsibilities and affiliated persons are obliged to notify the supervising authority and the Company of trades
in their shares in excess of €5,000 in any year. The ordinary shares of Fresenius Medical Care AG had been
listed on the Frankfurt Stock Exchange since October 2, 1996. Trading in the ordinary shares of FMC-AG & Co.
KGaA on the Frankfurt Stock Exchange commenced on February 13, 2006.
Our shares have been listed on the Regulated Market (Regulierter Markt) of the Frankfurt Stock Exchange
and on the Prime Standard of the Regulated Market, which is a sub-segment of the Regulated Market with
additional post-admission obligations. Admission to the Prime Standard requires the fulfillment of the following
transparency criteria: publication of quarterly reports; preparation of financial statements in accordance with
international accounting standards (IFRS or U.S. GAAP); publication of a company calendar; convening of at
least one analyst conference per year; and publication of ad-hoc messages (i.e., certain announcements of
material developments and events) in English. Companies aiming to be listed in this segment have to apply for
admission. Listing in the Prime Standard is a prerequisite for inclusion of shares in the selection indices of the
Frankfurt Stock Exchange, such as the DAX®
, the index of 30 major German stocks.
Since October 1, 1996, ADSs representing our ordinary shares (the "Ordinary ADSs"), have been listed and
traded on the New York Stock Exchange ("NYSE") under the symbol FMS. Effective December 3, 2012, we
effected a two-for-one split of our Ordinary ADSs outstanding and our Preference ADSs, which changed the
ratio of each class of ADSs from one ADSs representing one share to two ADSs representing one share. The
Depositary for the Ordinary ADSs is Bank of New York Mellon (the "Depositary").

105
Trading on the Frankfurt Stock Exchange
Deutsche Börse AG operates the Frankfurt Stock Exchange, which is the largest of the six German stock
exchanges by value of shares traded. Our shares are traded on Xetra, the electronic trading system of the
Deutsche Börse. The trading hours for Xetra are between 9:00 a.m. and 5:30 p.m. Central European Time
(“CET”). Only brokers and banks that have been admitted to Xetra by the Frankfurt Stock Exchange have direct
access to the system and may trade on it. Private investors can trade on Xetra through their banks and brokers.
As of March 2012, the most recent figures available, the shares of more than 11,000 companies were traded on
Xetra.
Deutsche Börse AG publishes information for all traded securities on the Internet, http://www.deutsche-
boerse.com.
Transactions on Xetra and the Frankfurt Stock Exchange settle on the second business day following the
trade except for trades executed on Xetra International Markets, the European Blue Chip segment of Deutsche
Börse AG, which settle on the third business day following a trade. The Frankfurt Stock Exchange can suspend a
quotation if orderly trading is temporarily endangered or if a suspension is deemed to be necessary to protect the
public.
The Hessian Stock Exchange Supervisory Authority (Hessische Börsenaufsicht) and the Trading Monitoring
Unit of the Frankfurt Stock Exchange (HÜST Handelsüberwachungsstelle) both monitor trading on the Frankfurt
Stock Exchange.
The Federal Financial Supervisory Authority (Bundesanstalt für Finanzdienstleistungsaufsicht), an
independent federal authority, is responsible for the general supervision of securities trading pursuant to
provisions of the German Securities Trading Act (Wertpapierhandelsgesetz) and other laws.
The table below sets forth for the periods indicated, the high and low closing sales prices in euro for our
Ordinary shares on the Frankfurt Stock Exchange, as reported by the Frankfurt Stock Exchange Xetra system.
All shares on German stock exchanges trade in euro.
As of February 19, 2014, the closing price for shares traded on the Frankfurt Stock Exchange was €53.50.
Price per ordinary
share (€)
High Low
2014 January 54.05 50.64
2013 December 51.86 49.98
November 51.77 47.57
October 49.28 47.00
September 49.55 48.09
August 50.50 47.49
2013 Fourth Quarter 51.86 47.00
Third Quarter 54.44 47.40
Second Quarter 58.06 51.70
First Quarter 58.12 48.21
2012 Fourth Quarter 59.43 51.30
Third Quarter 59.51 54.38
Second Quarter 55.83 51.21
First Quarter 57.03 50.80
2013 Annual 58.12 47.00
2012 Annual 59.51 50.80
2011 Annual 55.13 41.11
2010 Annual 45.79 36.10
2009 Annual 37.71 26.07
The average daily trading volume of the Ordinary shares and traded on the Frankfurt Stock Exchange during
2013 was 820,387 shares. This is based on total yearly turnover statistics supplied by the Frankfurt Stock
Exchange.

106
Trading on the New York Stock Exchange
As of February 19, 2014, the closing price for the ADSs traded on the NYSE was $36.52.
The table below sets forth, for the periods indicated, the high and low closing sales prices for the Ordinary
ADSs on the NYSE. All ADS prices have been adjusted to reflect the two for one split of our ADSs in December
2012.
Price per ordinary
ADS ($)
High Low
2014 January 36.82 34.73
2013 December 35.61 34.27
November 34.99 31.92
October 33.86 31.74
September 32.79 31.88
August 33.54 31.59
2013 Fourth Quarter 35.61 31.74
Third Quarter 35.50 31.02
Second Quarter 36.07 33.40
First Quarter 35.55 32.26
2012 Fourth Quarter 38.90 32.80
Third Quarter 37.10 34.40
Second Quarter 36.40 32.10
First Quarter 37.10 33.30
2013 Annual 36.07 31.02
2012 Annual 38.93 32.13
2011 Annual 39.96 27.88
2010 Annual 32.01 23.79
2009 Annual 27.48 17.83
Item 10. Additional information
B. Articles of Association
FMC-AG & Co. KGaA is a partnership limited by shares (“KGaA”) (Kommanditgesellschaft auf Aktien)
organized under the laws of Germany. FMC-AG & Co. KGaA is registered with the commercial register of the
local court (Amtsgericht) of Hof an der Saale, Germany under HRB 4019. Our registered office (Sitz) is Hof an
der Saale, Germany. Our registered business address is Else Kröner-Strasse 1, 61352 Bad Homburg, Germany,
telephone +49-6172-609-0.
The following summary of the material provisions of our Articles of Association (Satzung) is qualified in its
entirety by reference to the complete text of our Articles of Association. An English convenience translation of
our Articles of Association has been filed with the Securities and Exchange Commission and can also be found
on our website under www.fmc-ag.com. For a summary of certain other provisions of our Articles of
Association relating to management by our General Partner and required ownership of our share capital by the
shareholder of our general partner, See Item 16.G, “Governance – the Articles of Association of FMC-AG & Co.
KGaA” above.
Corporate Purposes
Under our Articles of Association, our business purposes are:
the development, production and distribution of as well as the trading in healthcare products, systems
and procedures, including dialysis;
the projecting, planning, establishment, acquisition and operation of healthcare businesses, including
dialysis centers, also in separate enterprises or through third parties as well as the participation in such
dialysis centers;

107
the development, production and distribution of other pharmaceutical products and the provision of
services in this field;
the provision of advice in the medical and pharmaceutical areas as well as scientific information and
documentation;
the provision of laboratory services for dialysis and non-dialysis patients and homecare medical
services.
We conduct our business directly and through subsidiaries within and outside Germany.
General Information Regarding Our Share Capital
As of February 19, 2014, our share capital consists of 301,491,605 bearer ordinary shares without par value
(Stückaktien). Our share capital has been fully paid in.
All shares of FMC-AG & Co. KGaA are in bearer form. Our shares are deposited as share certificates in
global form (Sammelurkunden) with Clearstream Banking AG, Frankfurt am Main, Germany. Shareholders are
not entitled to have their shareholdings issued in certificated form. All shares of FMC-AG & Co. KGaA are
freely transferable, subject to any restrictions imposed by applicable securities laws.
General provisions on Increasing the Capital of Stock Corporations and Partnerships Limited by Shares
Under the German Stock Corporation Act (Aktiengesetz), the capital of a stock corporation or of a
partnership limited by shares may be increased by a resolution of the general meeting, passed with a majority of
at least three quarters of the capital represented at the vote, unless the articles of association of the stock
corporation or the partnership limited by shares provide for a different majority.
In addition, the general meeting of a stock corporation or a partnership limited by shares may create
authorized capital (also called approved capital) (genehmigtes Kapital). The resolution creating authorized
capital requires the affirmative vote of a majority of at least three quarters of the capital represented at the vote
and may authorize the management board to issue shares up to a stated amount for a period of up to five years.
The nominal value of the authorized capital may not exceed half of the share capital at the time of the
authorization.
In addition, the general meeting of a stock corporation or of a partnership limited by shares may create
conditional capital (bedingtes Kapital) for the purpose of issuing (i) shares to holders of convertible bonds or
other securities which grant a right to shares, (ii) shares as consideration to prepare a merger with another
company, or (iii) shares offered to members of the management board or employees of the company or of an
affiliated company. In each case, the authorizing resolution requires the affirmative vote of a majority of at least
three quarters of the capital represented at the vote. The nominal value of the conditional capital may not exceed
half or, in the case of conditional capital created for the purpose of issuing shares to members of the management
board and employees, 10% of the company’s share capital at the time of the resolution.
In a partnership limited by shares all resolutions increasing the capital of the partnership limited by shares
also require the consent of the General Partner for their effectiveness.
Authorized Capital
By resolution of the AGM of shareholders on May 11, 2010, Management AG was authorized, with the
approval of the Supervisory Board, to increase, on one or more occasions, the Company’s share capital until
May 10, 2015 up to a total of €35,000,000 through issue of new bearer ordinary shares for cash contributions,
“Authorized Capital 2010/I”. The General Partner is entitled, subject to the approval of the Supervisory Board, to
exclude the pre-emption rights of the shareholders. However, such an exclusion of pre-emption rights will be
permissible for fractional amounts. Additionally, the newly issued shares may be taken up by financial
institutions nominated by the General Partner with the obligation to offer them to the shareholders of the
company (indirect pre-emption rights). No Authorized Capital 2010/I has been issued as of December 31, 2013.
In addition, by resolution of the AGM on May 11, 2010, the General Partner was authorized, with the
approval of the Supervisory Board, to increase, on one or more occasions, the share capital of the Company until
May 10, 2015 up to a total of €25,000,000 through the issue of new bearer ordinary shares for cash contributions
or contributions in kind, “Authorized Capital 2010/II”. The General Partner is entitled, subject to the approval of
the Supervisory Board, to exclude the pre-emption rights of the shareholders. However, such exclusion of pre-

108
emption rights will be permissible only if (i) in case of a capital increase against cash contributions, the nominal
value of the issued shares does not exceed 10% of the nominal share value of the Company’s share capital and
the issue price for the new shares is at the time of the determination by the General Partner not significantly
lower than the stock price in Germany of the existing listed shares of the same class and with the same rights or,
(ii) in case of a capital increase against contributions in kind, the purpose of such increase is to acquire an
enterprise, parts of an enterprise or an interest in an enterprise. No Authorized Capital 2010/II has been issued as
of December 31, 2013.
Authorized Capital 2010/I and Authorized Capital 2010/II became effective upon registration with the
commercial register of the local court in Hof an der Saale on May 25, 2010.
Conditional Capital
By resolution of the AGM on May 12, 2011, the Company’s share capital was conditionally increased up to
€12,000,000 subject to the issue of up to twelve million non-par value bearer ordinary shares with no par value
and a nominal value of €1.00 each. This conditional increase can only be affected by the exercise of stock
options under the Company’s Stock Option Plan 2011, with each stock option awarded exercisable for one
ordinary share (see Note 15). The Company has the right to deliver ordinary shares that it owns or purchases in
the market in place of increasing capital by issuing new shares.
Treasury Shares
By resolution of the AGM on May 12, 2011 the Company was authorized to purchase treasury shares up to a
maximum amount of 10% of the registered share capital existing at the time of the shareholder resolution until
May 11, 2016. The shares acquired, together with other treasury shares held by the Company or attributable to
the Company pursuant to Sections 71a et seqq. German Stock Corporation Act (Aktiengesetz or AktG), must at
no time exceed 10% of the registered share capital. The purchase may be limited to one class of shares only. The
authorization must not be used for the purpose of trading in treasury shares. The General Partner is authorized to
use treasury shares purchased on the basis of this authorization for any purpose legally permissible and in
particular for the following purposes:
The authorization entitles the General Partner to acquire and use and to partially or entirely cancel treasury
shares bought back, in accordance with common practice among large publically listed companies in Germany
without a further resolution of the AGM being required. Furthermore, the General Partner is authorized to sell
ordinary treasury shares of the Company also in ways other than via the stock exchange or by means of an offer
made to all shareholders, against payment in cash and to the exclusion of subscription rights. Additionally, it is
also possible to use ordinary treasury shares against contributions in kind within the scope of business
combinations and upon acquisition of companies and other assets, excluding shareholders’ subscription rights.
The authorization further provides that ordinary treasury shares in lieu of the utilization of a conditional
capital of the Company can also be issued, excluding the subscription right of shareholders, to employees of the
Company and its affiliates, including members of the management or employees of affiliates, and used to service
options or obligations to purchase ordinary shares of the Company granted or to be granted to employees of the
Company or its affiliates as well as members of the management of affiliates. The General Partner shall further
be authorized to use ordinary treasury shares to fulfil notes carrying warrant or conversion rights or conversion
obligations, issued by the Company or dependent entities of the Company as defined in Section 17 of the
German Stock Corporation Act and excluding subscription rights according to section 186 (3) sentence 4
German Stock Corporation Act. Finally, the General Partner shall be authorized to exclude fractional amounts, if
any, in an offer made to all shareholders.
In August 2013, we completed a share buy-back program in which we repurchased a total of 7,548,951
ordinary shares for a total of approximately €350 million (approximately $500 million). For a discussion of the
2013 buy-back program, see Item 16E, “Purchase of Equity Securities by the Issuer and Affiliated Purchasers”
and Note 14 of the Notes to the Consolidated Financial Statements, “Shareholders’ Equity.”
Voting Rights
Each ordinary share entitles the holder thereof to one vote at general meetings of shareholders of FMC-AG
& Co. KGaA. Resolutions are passed at an ordinary general or an extraordinary general meeting of our
shareholders by a majority of the votes cast, unless a higher vote is required by law or our Articles of
Association. Fresenius SE as shareholder of the General Partner is not entitled to vote its ordinary shares in the
election or removal of members of the Supervisory Board of FMC-AG & Co. KGaA, the approval of the acts of

109
the General Partners and members of the Supervisory Board, the appointment of special auditors, the assertion of
compensation claims against members of the executive bodies arising out of the management of the Company,
the waiver of compensation claims and the appointment of auditors. In the case of resolutions regarding such
matters Fresenius SE’s voting rights may not be exercised by any other person.
Dividend Rights
The General Partner and our Supervisory Board will propose any dividends for approval at the AGM.
Usually, shareholders vote on a recommendation made by management (i.e. the General Partner) and the
Supervisory Board as to the amount of dividends to be paid. Any dividends are paid once a year, generally,
immediately following our AGM. Our General Partner’s Management Board will propose to the shareholders at
the AGM on May 15, 2014, a dividend with respect to 2013 and payable in 2014, of €0.77 per share. For
information regarding dividends paid in prior years, see Item 3A, "Key Information - Selected Financial Data."
Under German law, dividends may only be paid from our balance sheet profits (Bilanzgewinn) as
determined by our unconsolidated annual financial statements as approved by our AGM and by our General
Partner. Unlike our consolidated annual financial statements, which are prepared on the basis of U.S. GAAP, the
unconsolidated annual financial statements referred to above are prepared on the basis of the accounting
principles of the German Commercial Code (Handelsgesetzbuch or HGB). Since our shares that are entitled to
dividend payments are held in a clearing system, the dividends will be distributed in accordance with the rules of
the individual clearing system. We will publish notice of the dividends paid and the appointment of the paying
agent or agents for this purpose in the German Federal Gazette (Bundesanzeiger).
In the case of holders of ADRs, the depositary will receive all cash dividends and distributions on all
deposited securities and will, as promptly as practicable, distribute the dividends and distributions to the holders
of ADRs entitled to the dividend. See “Description of American Depositary Receipts – Share Dividends and
Other Distributions.”
Liquidation Rights
Our company may be dissolved by a resolution of our general shareholders’ meeting passed with a majority
of at least three quarters of our share capital represented at such general meeting and the approval of the General
Partner. In accordance with the AktG, in such a case, any liquidation proceeds remaining after paying all of our
liabilities will be distributed among our shareholders in proportion to the total number of shares held by each
shareholder.
Pre-emption Rights
Under the German Stock Corporation Act, each shareholder in a stock corporation or partnership limited by
shares has a preferential right to subscribe for any issue by that company of shares, debt instruments convertible
into shares, e.g. convertible bonds or option bonds, and participating debt instruments, e.g. profit participation
rights or participating certificates, in proportion to the number of shares held by that shareholder in the existing
share capital of the company. Basically, such pre-emption rights are freely assignable. These rights may also be
traded on German stock exchanges within a specified period of time prior to the expiration of the subscription
period. Our general shareholders’ meeting may exclude pre-emption rights by passing a resolution with a
majority of at least three quarters of our share capital represented at the general meeting at which the resolution
to exclude the pre-emption rights is passed. In addition, an exclusion of pre-emption rights requires a report by
the General Partner justifying the exclusion by explaining why the interest of FMC-AG & Co. KGaA in
excluding the pre-emption rights outweighs our shareholders’ interests in receiving such rights. However, such
justification is not required for any issue of new shares if:
we increase our share capital against contributions in cash, the amount of the capital increase does not
exceed 10% of our existing share capital, and the issue price of the new shares is not significantly
lower than the price for the shares quoted on a stock exchange, or
we increase our share capital against receipt of a contribution in kind and the purpose of such increase
is to acquire an enterprise, parts of an enterprise or an interest in an enterprise.
Exclusion of Minority Shareholders
Under the provisions of Sections 327a et seq. of the German Stock Corporation Act concerning squeeze-
outs, a shareholder who owns 95% of the issued share capital (a “principal shareholder”) may request that the
shareholders’ general meeting of a stock corporation or a partnership limited by shares resolve to transfer the

110
shares of the other minority shareholders to the principal shareholder in return for adequate cash compensation.
In a partnership limited by shares, the consent of the general partner(s) is not necessary for the effectiveness of
the resolution. The amount of cash compensation to be paid to the minority shareholders must take account of
the issuer’s financial condition at the time the resolution is passed. The full value of the issuer, which is normally
calculated using the capitalization of earnings method (Ertragswertmethode), is decisive for determining the
compensation amount.
In addition to the provisions for squeeze-outs of minority shareholders, Sections 319 et seq. of the German
Stock Corporation Act provides for the integration of stock corporations. In contrast to the squeeze-out of
minority shareholders, integration is only possible when the future principal company is a stock corporation with
a stated domicile in Germany. A partnership limited by shares cannot be integrated into another company in
accordance with Sections 319 et seq. of the German Stock Corporation Act.
General Meeting
Our AGM must be held within the first eight months of each fiscal year at the location of FMC-AG & Co.
KGaA’s registered office, or in a German city where a stock exchange is situated or at the location of a
registered office of a domestic affiliated company. To attend the general meeting and exercise voting rights,
shareholders must register for the general meeting and prove ownership of shares. The relevant reporting date is
the beginning of the 21st day prior to the general meeting.
Amendments to the Articles of Association
An amendment to our Articles of Association requires both a voting majority of at least 75% of the shares
entitled to vote represented at the general meeting and the approval of the General Partner.
Description of American Depositary Receipts
General
The Bank of New York Mellon, a New York banking corporation, is the depositary for American Depositary
Shares (“ADSs”) representing our ordinary shares. Each ADS represents an ownership interest in one-half an
ordinary share. The deposited shares are deposited with a custodian, as agent of the depositary, under the deposit
agreement among ourselves, the depositary and all of the holders and owners of ADSs from time to time (who
become bound by the deposit agreement by their acceptance of American Depositary Receipts, or ADRs,
evidencing their ADSs). Each ADS also represents any securities, cash or other property deposited with the
depositary but not distributed by it directly to ADS holders. The ADSs may be evidenced by certificates or may
also be uncertificated. If ADSs are issued in uncertificated form, owners holding ADSs in book-entry form will
receive periodic statements from the depositary showing their ownership of ADSs. In the case of beneficial
holders of ADSs, owners will receive these periodic statements through their brokers.
Prior to the mandatory conversion of our preference shares into ordinary shares (See item 4A, "History and
Development of the Company"), The Bank of New York Mellon was also the depositary for ADSs representing
our preference shares, with each ADS representing one-half a preference share. In connection with the
mandatory conversion of our preference shares, the preference shares held by the depositary under the deposit
agreement for the preference share ADSs were converted into ordinary shares, and the depositary called for
surrender all of the ADSs representing our preference shares and distributed ADSs representing ordinary shares
to the former preference share ADS holders.
The depositary's office is located at 101 Barclay Street, New York, NY 10286, U.S.A.
An investor may hold ADSs either directly or indirectly through a broker or other financial institution.
Investors who hold ADSs directly, by having ADSs registered in their names on the books of the depositary, are
ADS holders. This description assumes an investor holds ADSs directly. Investors who hold ADSs through their
brokers or financial institution nominees must rely on the procedures of their brokers or financial institutions to
assert the rights of an ADS holder described in this section. Investors should consult with their brokers or
financial institutions to find out what those procedures are.
As an ADS holder, we will not treat you as one of our shareholders and you will not have shareholder rights.
German law governs shareholder rights. The depositary will be the holder of the shares underlying your ADSs.
As a registered holder of ADSs, you will have ADS holder rights. The deposit agreement sets out ADS holder

111
rights as well as the rights and obligations of the depositary. New York law governs the deposit agreement and
the ADSs.
The following is a summary of the material terms of the deposit agreement. Because it is a summary, it does
not contain all the information that may be important to investors. For more complete information, investors
should read the entire deposit agreement and the form of ADR which contains the terms of the ADSs. Investors
may obtain a copy of the deposit agreement at the SEC's Public Reference Room, located at 100 F Street N.E.,
Washington, D.C. 20549. The deposit agreement is also available in electronic form on the website maintained
by the SEC, www.sec.gov.
Share Dividends and Other Distributions
We may make different types of distributions with respect to our ordinary shares. The depositary has agreed
to pay to investors the cash dividends or other distributions it or the custodian receives on the shares or other
deposited securities, after deducting its fees and expenses. Investors will receive these distributions in proportion
to the number of underlying shares their ADSs represent.
Except as stated below, to the extent the depositary is legally permitted it will deliver distributions to ADS
holders in proportion to their interests in the following manner:
Cash. The depositary shall convert cash distributions from foreign currency to U.S. dollars if this is
permissible and can be done on a reasonable basis. The depositary will endeavor to distribute cash in a
practicable manner, and may deduct any taxes or other governmental charges required to be withheld,
any expenses of converting foreign currency and transferring funds to the United States, and certain
other fees and expenses. In addition, before making a distribution the depositary will deduct any taxes
withheld. If exchange rates fluctuate during a time when the depositary cannot convert a foreign
currency, investors may lose some or all of the value of the distribution.
Shares. If we make a distribution in shares, the depositary may deliver additional ADSs to represent
the distributed shares, unless the number of ordinary shares represented by our ADSs is adjusted in
connection with the distribution. Only whole ADSs will be issued. Any shares which would result in
fractional ADSs will be sold and the net proceeds will be distributed to the ADS holders otherwise
entitled to receive fractional ADSs.
Rights to receive additional shares. In the case of a distribution of pre-emptive rights to subscribe for
ordinary shares or other subscription rights, if we provide satisfactory evidence that the depositary may
lawfully distribute the rights, the depositary may arrange for ADS holders to instruct the depositary as
to the exercise of the rights. However, if we do not furnish the required evidence or if the depositary
determines it is not practical to distribute the rights, the depositary may:
allow the rights to lapse, in which case ADS holders will receive nothing, or
sell the rights if practicable and distribute the net proceeds as cash.
We have no obligation to file a registration statement under the U.S. Securities Act of 1933, as amended (the
"Securities Act") in order to make any rights available to ADS holders.
Other Distributions. If we make a distribution of securities or property other than those described
above, the depositary may either:
distribute the securities or property in any manner it deems fair and equitable;
sell the securities or property and distribute any net proceeds in the same way it distributes
cash; or
hold the distributed property in which case the ADSs will also represent the distributed
property.
Any U.S. dollars will be distributed by checks drawn on a bank in the United States for whole dollars and
cents (fractional cents will be rounded to the nearest whole cent). Registered holders will receive the checks
directly, while the distributions for beneficial owners will be first sent to the brokers, who will then distribute the
cash to the rightful owners.
The depositary may choose any practical method of distribution for any specific ADS holder, including the
distribution of foreign currency, securities or property, or it may retain the items, without paying interest on or
investing them, on behalf of the ADS holder as deposited securities.

112
The depositary is not responsible if it decides that it is unlawful or impractical to make a distribution
available to any ADS holders.
There can be no assurance that the depositary will be able to convert any currency at a specified exchange
rate or sell any property, rights, shares or other securities at a specified price, or that any of these transactions can
be completed within a specified time period.
Deposit, Withdrawal and Cancellation
The depositary will deliver ADSs if an investor or his broker deposits ordinary shares or evidence of rights
to receive ordinary shares with the custodian. Shares deposited with the custodian must be accompanied by
certain documents, including instruments showing that such shares have been properly transferred or endorsed to
the person on whose behalf the deposit is being made.
The custodian will hold all deposited shares for the account of the depositary. ADS holders thus have no
direct ownership interest in the shares and only have the rights that are contained in the deposit agreement. The
custodian will also hold any additional securities, property and cash received on or in substitution for the
deposited shares. The deposited shares and any additional items are referred to as "deposited securities."
Upon each deposit of shares, receipt of related delivery documentation and compliance with the other
provisions of the deposit agreement, including the payment of the fees and charges of the depositary and any
taxes or other fees or charges owing, the depositary will deliver ADSs representing the deposited as instructed.
All ADSs issued will, unless specifically requested to the contrary, be delivered through the book-entry
settlement system of The Depository Trust Company, also referred to as DTC, or be uncertificated and held
through the depositary's book-entry direct registration system (“DRS”), and a registered holder will receive
periodic statements from the depositary which will show the number of ADSs registered in the holder's name.
An ADS holder can request that the ADSs not be held through the depositary's DRS and that an ADR be issued
to evidence those ADSs. ADRs will be delivered at the depositary's principal New York office or any other
location that it may designate as its transfer office.
Profile is a required feature of DRS which allows a participant in DTC, claiming to act on behalf of a
registered holder of ADSs, to direct the depositary to register a transfer of those ADSs to DTC or its nominee
and to deliver those ADSs to the DTC account of that DTC participant without receipt by the depositary of prior
authorization from the ADS registered holder to register that transfer.
In connection with and in accordance with the arrangements and procedures relating to DRS/Profile, the
parties to the deposit agreement understand that the depositary will not verify, determine or otherwise ascertain
that the DTC participant which is claiming to be acting on behalf of an ADS registered holder in requesting
registration of transfer and delivery described in the paragraph above has the actual authority to act on behalf of
the ADS registered holder (notwithstanding any requirements under the Uniform Commercial Code). In the
deposit agreement, the parties agree that the depositary’s reliance on and compliance with instructions received
by the depositary through the DRS/Profile System and in accordance with the deposit agreement, shall not
constitute negligence or bad faith on the part of the depositary.
When an investor surrenders ADSs at the depositary's office, the depositary will, upon payment of certain
applicable fees, charges and taxes, and upon receipt of proper instructions, deliver the whole number of ordinary
shares represented by the surrendered ADSs to the account the investor directs within Clearstream Banking AG,
the central German clearing firm.
The depositary may restrict the withdrawal of deposited securities only in connection with:
temporary delays caused by closing our transfer books or those of the depositary, or the deposit of
shares in connection with voting at a shareholders' meeting, or the payment of dividends,
the payment of fees, taxes and similar charges, or
compliance with any U.S. or foreign laws or governmental regulations relating to the ADRs.
This right of withdrawal may not be limited by any other provision of the deposit agreement.

113
Pre-release of ADSs
The deposit agreement permits the depositary to deliver ADSs before deposit of the underlying shares. This
is called a pre-release of the ADSs. The depositary may also deliver shares upon cancellation of pre-released
ADSs (even if the ADSs are canceled before the pre-release transaction has been closed out). A pre-release is
closed out as soon as the underlying shares are delivered to the depositary. The depositary may release ADSs
instead of shares to close out a pre-release. The depositary may pre-release ADSs only under the following
conditions: (1) before or at the time of pre-release, the person to whom the pre-release is being made represents
to the depositary in writing that it is or its customer owns the shares of the ADSs to be deposited; (2) the pre-
release is fully collateralized with cash or other collateral that the depositary considers appropriate; (3) the
depositary must be able to close out the pre-release in not more than five business days’ notice. In addition, the
depositary will limit the number of ADSs that may be outstanding at any time as a result of pre-release, although
the depositary may discard the limit from time to time, if it thinks it is appropriate to do so.
Voting Rights
You may instruct the depositary to vote the number of shares your ADSs represent. The depositary will
notify you of shareholders’ meetings and arrange to deliver our voting materials to you if we ask it to. Those
materials will describe the matters to be voted on and explain how you may instruct the depositary how to vote.
For instructions to be valid, they must reach the depositary by a date set by the depositary.
The depositary will try, as far as practical, subject to German law and the provisions of our constitutive
documents, to vote the number of shares or other deposited securities represented by your ADSs as you instruct.
The depositary will only vote or attempt to vote as you instruct as described below.
We cannot ensure that you will receive voting materials or otherwise learn of an upcoming shareholders’
meeting in time to ensure that you can instruct the depositary to vote the shares represented by your ADSs. In
addition, the depositary and its agents are not responsible for failing to carry out voting instructions or for the
manner of carrying out voting instructions. This means that you may not be able to vote and there may be
nothing you can do if your shares are not voted as you requested.
If (i) we timely asked the depositary to solicit your voting instructions, (ii) the depositary receives a
recommendation as to how to vote from the custodian pursuant to the German Stock Corporation Act before it
mails voting materials to ADS holders and (iii) the depositary does not receive voting instructions from you by
the specified date, it will consider you to have authorized and directed it to give a discretionary proxy to the
custodian to vote the number of deposited securities represented by your ADSs in accordance with the
custodian’s recommendation. The depositary will give a discretionary proxy in those circumstances with respect
to each question covered by the recommendation unless we notify the depositary that:
we do not wish a discretionary proxy to be given;
we think there is substantial shareholder opposition to the particular question; or
we think the particular question would have an adverse impact on our shareholders.
Fees and Expenses
For information regarding fees and expenses payable by holders of ADSs and amounts payable by the
Depository to the Company, see Item 12.D, “American Depositary Shares - Fees and Expenses.”
Payment of Taxes
ADS holders must pay any tax or other governmental charge payable by the custodian or the depositary on
any ADS or ADR, deposited security or distribution. If an ADS holder owes any tax or other governmental
charge, the depositary may (i) deduct the amount thereof from any cash distributions, or (ii) sell deposited
securities and deduct the amount owing from the net proceeds of such sale. In either case the ADS holder
remains liable for any shortfall. Additionally, if any tax or governmental charge is unpaid, the depositary may
also refuse to effect any registration, registration of transfer, split-up or combination of deposited securities or
withdrawal of deposited securities (except under limited circumstances mandated by securities regulations). If
any tax or governmental charge is required to be withheld on any non-cash distribution, the depositary may sell
the distributed property or securities to pay such taxes and distribute any remaining net proceeds to the ADS
holders entitled thereto.

114
Limitations on Obligations and Liability
Limits on our Obligations and the Obligations of the Depositary; Limits on Liability to Holders of ADSs
The deposit agreement expressly limits our obligations and the obligations of the depositary. It also limits
our liability and the liability of the depositary. We and the depositary:
are only obligated to take the actions specifically set forth in the deposit agreement without negligence
or bad faith;
are not liable if we are or it is prevented or delayed by law or circumstances beyond our control from
performing our or its obligations under the deposit agreement;
are not liable if we or it exercises discretion permitted under the deposit agreement;
have no obligation to become involved in a lawsuit or other proceeding related to the ADSs or the
deposit agreement on your behalf or on behalf of any other person; and
may rely upon any documents we believe or it believes in good faith to be genuine and to have been
signed or presented by the proper person.
In the deposit agreement, we and the depositary agree to indemnify each other under certain circumstances.
Requirements for Depositary Actions
Before the depositary will deliver or register a transfer of an ADS, make a distribution on an ADS, or permit
withdrawal of shares, the depositary may require:
payment of stock transfer or other taxes or other governmental charges and transfer or registration fees
charged by third parties for the transfer of any shares or other deposited securities;
satisfactory proof of the identity and genuineness of any signature or other information it deems
necessary; and
compliance with regulations it may establish, from time to time, consistent with the deposit agreement,
including presentation of transfer documents.
The depositary may refuse to deliver ADSs or register transfers of ADSs generally when the transfer books
of the depositary are closed or at any time if the depositary or we think it advisable to do so.
Shareholder Communications; Inspection of Register of Holders of ADSs
The depositary, as a holder of deposited securities, will make available for your inspection at its office all
communications that it receives from us that we make generally available to holders of deposited securities. The
depositary will send you copies of those communications if we ask it to. You have a right to inspect the register
of holders of ADSs, but not for the purpose of contacting those holders about a matter unrelated to our business
or the ADSs.
Amendment of the Deposit Agreement
We may agree with the depositary to amend the deposit agreement and the ADRs without your consent for
any reason. If an amendment adds or increases fees or charges, except for taxes or other governmental charges or
expenses of the depositary for registration fees, facsimile costs, delivery charges or similar items, or prejudices a
substantial right of ADS holders, it will not become effective for outstanding ADSs until 30 days after the
depositary notifies ADS holders of the amendment. At the time the amendment becomes effective, you are
considered, by continuing to hold your ADSs, to agree to the amendment and to be bound by the ADRs and the
deposit agreement as amended.
Termination of the deposit agreement
The depositary will terminate the deposit agreement at our direction by mailing notice of termination to the
ADS holders then outstanding at least 30 days prior to the date fixed in such notice of termination. The
depositary may also terminate the deposit agreement by mailing notice of termination to us and the ADS holders
if 60 days have passed, the depositary told us it wants to resign but a successor depositary has not been
appointed and accepted its appointment.

115
After termination, the depositary and its agents will do the following under the deposit agreement but
nothing else: collect distributions on the deposited securities, sell rights and other property, and deliver shares
and other deposited securities upon cancellation of the ADSs. Four months after termination, the depositary may
sell any remaining deposited securities by public or private sale. After that, the depositary will hold the money it
received on the sale, as well as any other cash it is holding under the deposit agreement for the pro rata benefit of
the ADS holders that have not surrendered their ADSs. It will not invest the money and has no liability for
interest. The depositary’s only obligation will be to account for the money and other cash. After termination our
only obligations will be to indemnify the depositary and to pay fees and expenses of the depositary that we
agreed to pay.
C. Material contracts
For information regarding certain of our material contracts, see "Item 7.B. Major Shareholders and Related
Party Transactions – Related Party Transactions." For a description of our stock option plans, see "Item 6.E.
Directors, Senior Management and Employees – Share Ownership – Options to Purchase our Securities." For a
description of our 2012 Credit Agreement and our agreements relating to our long-term and short-term
indebtedness, see Note 10, “Short-Term Borrowings, Other Financial Liabilities and Short-Term Borrowings
from Related Parties” and Note 11, “Long-Term Debt and Capital Lease Obligations” of the Notes to
Consolidated Financial Statements.
Our material agreements include the settlement agreement that we, FMCH and NMC entered into with the
Official Committee of Asbestos Injury Claimants, and the Official Committee of Asbestos Property Damage
Claimants of W.R. Grace & Co., a description of which appears in Note 20 of the Notes to Consolidated
Financial Statements, “Legal and Regulatory Matters," and the Merger agreement among us, FMCH and RCG.
D. Exchange controls
Exchange Controls and Other Limitations Affecting Security Holders.
At the present time, Germany does not restrict the export or import of capital, except for certain restrictions
on transactions based on international embargo or terror prevention resolutions concerning for example Iraq,
Iran, the People’s Republic of Korea, Sudan or Syria. However, the Federal Ministry of Economics and
Technology (Bundesministerium für Wirtschaft und Technologie) may – in exceptional cases – review and
prohibit the direct or indirect acquisition of 25% or more of the shares or voting rights in a German company by
a person or company resident outside of the European Union or the European Free Trade Area if such acquisition
constitutes a sufficiently serious threat to the public security or order. This provision is also applicable on other
means of acquisition, e.g asset deals, and mergers. Further, for statistical purposes only, every resident individual
or corporation residing in Germany must report to the German Federal Bank (Deutsche Bundesbank), subject
only to certain immaterial exceptions, any payment received from or made to an individual or a corporation
resident outside of Germany if such payment exceeds €12,500 (or the corresponding amount in other currencies).
In addition, residents must report (i) monthly any claims against, or any liabilities payable to, non-residents
individuals or corporations, if such claims or liabilities, in the aggregate exceed €5 million at the end of any
month and (ii) quarterly claims against, or liabilities payable to, non-residents arising under derivative financial
instruments (derivative Finanzinstrumente) if the claims, or liabilities, under (i) exceed €500 million at the end
of the quarter. Further, residents must report yearly the value (Stand) of the assets (Vermögen) of (i) non-resident
companies in which either 10% or more of the shares or of the voting rights in the company are attributed to the
resident, or more than 50% of the shares or of the voting rights are attributed to the resident and/or to one or
more non-resident companies which are controlled by the resident and (ii) of the resident’s non-resident branch
offices and permanent establishments. Likewise, residents must report yearly the value of the assets of (i)
resident companies in which either 10% or more of the shares or of the voting rights in the company are
attributed to a non-resident, or more than 50% of the shares or the voting rights are attributed to a non-resident
and/or to one or more resident companies which are controlled by a non-resident and (ii) of a non-resident’s
resident branch offices and permanent establishments.
There are no limitations imposed by German law or our Articles of Association (Satzung) on the right of a
non-resident to hold the shares or the ADSs evidencing shares.

116
E. Taxation
U.S. and German Tax Consequences of Holding ADSs
The discussion below is not a complete analysis of all of the potential U.S. federal and German tax
consequences of holding ADSs of FMC-AG & Co. KGaA. In addition, the U.S. federal and German tax
consequences to particular U.S. holders, such as insurance companies, tax-exempt entities, investors holding
ADSs through partnerships or other fiscally transparent entities, investors liable for the alternative minimum tax,
investors that hold ADSs as part of a straddle or a hedge, investors whose functional currency is not the U.S.
dollar, financial institutions and dealers in securities, and to non-U.S. holders may be different from that
discussed herein.
Germany and the United States of America have agreed on a Protocol amending the existing Income Tax
Treaty. On December 28, 2007, the Protocol entered into force. The Protocol is effective in respect of
withholding taxes for amounts paid on or after January 1, 2007. Changes related to other taxes on income
became effective on January 1, 2008.
Investors should consult their tax advisors with respect to the particular United States federal and German
tax consequences applicable to holding ADSs of FMC-AG & Co.KGaA.
Tax Treatment of Dividends
German corporations are required to withhold tax on dividends paid to resident and non-resident
shareholders. The German Business Tax Reform 2008 increased the withholding tax rate on dividends to 25%
(plus solidarity surcharges) starting January 1, 2009. Also effective January 1, 2009 for corporate non-German
holders, forty percent (40%) of the withheld and remitted withholding tax may be refunded upon application at
the German Federal Tax Office (at the address noted below), which would generally result in a net withholding
of 15% (plus solidarity surcharge). The entitlement of corporate non-German holders to further reductions of the
withholding tax under an applicable income tax treaty remains unaffected. A partial refund of this withholding
tax can be obtained by U.S. holders under the U.S.-German Tax Treaty (“Treaty”). For U.S. federal income tax
purposes, U.S. holders are taxable on dividends paid by German corporations subject to a foreign tax credit for
certain German income taxes paid. The amount of the refund of German withholding tax and the determination
of the foreign tax credit allowable against U.S. federal income tax depend on whether the U.S. holder is a
corporation owning at least 10% of the voting stock of the German corporation (“Holder 1”).
In the case of any U.S. holder (“Holder 2”) other than a Holder 1, the German withholding tax is partially
refunded under the Treaty to reduce the withholding tax to 15% of the gross amount of the dividend. In this case,
for each $100 of gross dividend that we pay to a Holder 2, the dividend is subject to withholding tax of $26.38,
$11.38 which is refunded, resulting in a net tax of $15. For U.S. foreign tax credit purposes, the U.S. holder
would report dividend income of $100 (to the extent paid out of current and accumulated earnings and profits)
and foreign taxes paid of $15, for purposes of calculating the foreign tax credit or the deduction for taxes paid.
Subject to certain exceptions, dividends received by a non-corporate U.S. holder will be subject to a
maximum U.S. federal income tax rate of 20%. The lower rate applies to dividends only if the ADSs in respect
of which such dividend is paid have been held for at least 61 days during the 121 day period beginning 60 days
before the ex-dividend date. Periods during which you hedge a position in our ADSs or related property may not
count for purposes of the holding period test. The dividends would also not be eligible for the lower rate if you
elect to take dividends into account as investment income for purposes of limitations on deductions for
investment income. U.S. holders should consult their own tax advisors regarding the availability of the reduced
dividend rate in light of their own particular circumstances.
In the case of a Holder 1, the 26.375% German withholding tax is reduced under the Treaty to 5% of the
gross amount of the dividend. Such a holder may, therefore, apply for a refund of German withholding tax in the
amount of 21.375% of the gross amount of the dividends. A corporate U.S. holder will generally not be eligible
for the dividends-received deduction generally allowed to U.S. corporations in respect of dividends received
from other U.S. corporations.
Subject to certain complex limitations, a U.S. holder is generally entitled to a foreign tax credit equal to the
portion of the withholding tax that cannot be refunded under the Treaty.
Dividends paid in Euros to a U.S. holder of ADSs will be included in income in a dollar amount calculated
by reference to the exchange rate in effect on the date the dividends, including the deemed refund of German
withholding tax, are included in income by such a U.S. holder. If dividends paid in Euros are converted into

117
dollars on the date included in income, U.S. holders generally should not be required to recognize foreign
currency gain or loss in respect of the dividend income.
Under the Treaty the refund of German tax, including the withholding tax, Treaty payment and solidarity
surcharge, will not be granted when the ADSs are part of the business property of a U.S. holder’s permanent
establishment located in Germany or are part of the assets of an individual U.S. holder’s fixed base located in
Germany and used for the performance of independent personal services. In this case, however, withholding tax
and solidarity surcharge may be credited against German income tax liability.
Refund Procedures
To claim a refund under the Treaty, the U.S. holder must submit a claim for refund to the German tax
authorities, with the original bank voucher, or certified copy thereof issued by the paying entity documenting the
tax withheld within four years from the end of the calendar year in which the dividend is received. Claims for
refund are made on a special German claim for refund form, which must be filed with the German Federal Tax
Office: Bundeszentralamt für Steuern, An der Küppe 1, D-53225 Bonn, Germany. The claim refund forms may
be obtained from the German Federal Tax Office at the same address where the applications are filed, or from
the Embassy of the Federal Republic of Germany, 4645 Reservoir Road, N.W., Washington, D.C. 20007-1998,
or from the Office of International Operations, Internal Revenue Service, 1325 K Street, N.W., Washington,
D.C. 20225, Attention: Taxpayer Service Division, Room 900 or can be downloaded from the homepage of the
Bundeszentralamt für Steuern (www.bzst.bund.de).
U.S. holders must also submit to the German tax authorities certification of their last filed U.S. federal
income tax return. Certification is obtained from the office of the Director of the Internal Revenue Service
Center by filing a request for certification with the Internal Revenue Service Center, Foreign Certificate Request,
P.O. Box 16347, Philadelphia, PA 19114-0447. Requests for certification are to be made in writing and must
include the U.S. holder’s name, address, phone number, social security number or employer identification
number, tax return form number and tax period for which certification is requested. The Internal Revenue
Service will send the certification back to the U.S. holder for filing with the German tax authorities.
U.S. holders of ADSs who receive a refund attributable to reduced withholding taxes under the Treaty may
be required to recognize foreign currency gain or loss, which will be treated as ordinary income or loss, to the
extent that the dollar value of the refund received by the U.S. holders differs from the dollar equivalent of the
refund on the date the dividend on which such withholding taxes were imposed was received by the depositary
or the U.S. holder, as the case may be.
Taxation of Capital Gains
Under the Treaty, a U.S. holder who is not a resident of Germany for German tax purposes will not be liable
for German tax on capital gains realized or accrued on the sale or other disposition of ADSs unless the ADSs are
part of the business property of a permanent establishment located in Germany or are part of the assets of a fixed
base of an individual located in Germany and used for the performance of independent personal services.
Upon a sale or other disposition of the ADSs, a U.S. holder will recognize gain or loss for U.S. federal
income tax purposes in an amount equal to the difference between the amount realized and the U.S. holder’s tax
basis in the ADSs. Such gain or loss will generally be capital gain or loss if the ADSs are held by the U.S. holder
as a capital asset, and will be long-term capital gain or loss if the U.S. holder’s holding period for the ADSs
exceeds one year. Individual U.S. holders are generally taxed at a maximum 20% rate on net long-term capital
gains.
Gift and Inheritance Taxes
The U.S.-Germany estate, inheritance and gift tax treaty provides that an individual whose domicile is
determined to be in the U.S. for purposes of such treaty will not be subject to German inheritance and gift tax,
the equivalent of the U.S. federal estate and gift tax, on the individual’s death or making of a gift unless the
ADSs are part of the business property of a permanent establishment located in Germany or are part of the assets
of a fixed base of an individual located in Germany and used for the performance of independent personal
services. An individual’s domicile in the U.S., however, does not prevent imposition of German inheritance and
gift tax with respect to an heir, donee, or other beneficiary who is domiciled in Germany at the time the
individual died or the gift was made.

118
Such treaty also provides a credit against U.S. federal estate and gift tax liability for the amount of
inheritance and gift tax paid in Germany, subject to certain limitations, in a case where ADSs are subject to
German inheritance or gift tax and U.S. federal estate or gift tax.
Other German Taxes
There are no German transfer, stamp or other similar taxes that would apply to U.S. holders who purchase or
sell ADSs.
United States Information Reporting and Backup Withholding
Dividends and payments of the proceeds on a sale of ADSs, paid within the United States or through U.S.-
related financial intermediaries are subject to information reporting and may be subject to backup withholding
unless you (1) are a corporation or other exempt recipient or (2) provide a taxpayer identification number and
certify (on Internal Revenue Service Form W-9) that no loss of exemption from backup withholding has
occurred.
Non-U.S. shareholders are not U.S. persons generally subject to information reporting or backup
withholding. However, a non-U.S. holder may be required to provide a certification (generally on Internal
Revenue Service Form W-8BEN) of its non-U.S. status in connection with payments received in the United
States or through a U.S.-related financial intermediary.
H. Documents on display
We file periodic reports and information with the Securities and Exchange Commission and the New York
Stock Exchange. You may inspect a copy of these reports without charge at the Public Reference Room of the
Securities and Exchange Commission at 100 F Street N.E., Washington, D.C. 20549 or at the Securities and
Exchange Commission's regional offices 233 Broadway, New York, New York 10279 and 500 West Madison
Street, Suite 1400, Chicago, Illinois 60661. The public may obtain information on the operation of the Public
Reference Room by calling the Securities and Exchange Commission at 1-800-SEC-0330. The Securities and
Exchange Commission also maintains an Internet site that contains reports, proxy and information statements
and other information regarding registrants that file electronically with the Securities and Exchange
Commission. The Securities and Exchange Commission's World Wide Web address is http://www.sec.gov.
The New York Stock Exchange currently lists American Depositary Shares representing our Ordinary
shares. As a result, we are subject to the periodic reporting requirements of the Exchange Act and we file reports
and other information with the Securities and Exchange Commission. These reports, proxy statements and other
information and the registration statement and exhibits and schedules thereto may be inspected without charge
at, and copies thereof may be obtained at prescribed rates from, the public reference facilities of the Securities
and Exchange Commission and the electronic sources listed in the preceding paragraph. In addition, these
materials are available for inspection and copying at the offices of the New York Stock Exchange, 20 Broad
Street, New York, New York 10005, USA.
We prepare annual and quarterly reports. Our annual reports contain financial statements examined and
reported upon, with opinions expressed by our independent auditors. Our consolidated financial statements
included in these annual reports are prepared in conformity with U.S. GAAP. Our annual and quarterly reports to
our shareholders are posted under “Publications” on the “Investor Relations” page of our website at
http://www.fmc-ag.com. In furnishing our web site address in this report, however, we do not intend to
incorporate any information on our web site into this report, and any information on our web site should not be
considered to be part of this report.
We will also furnish the depositary with all notices of shareholder meetings and other reports and
communications that are made generally available to our shareholders. The depositary, to the extent permitted by
law, shall arrange for the transmittal to the registered holders of American Depositary Receipts of all notices,
reports and communications, together with the governing instruments affecting our shares and any amendments
thereto. Such documents are also available for inspection by registered holders of American Depositary Receipts
at the principal office of the depositary.
Documents referred to in this report which relate to us as well as future annual and interim reports prepared
by us may also be inspected at our offices, Else-Kröner-Strasse 1, 61352 Bad Homburg.

119
Item 11. Quantitative and Qualitative Disclosures About Market Risk
Market Risk
Our businesses operate in highly competitive markets and are subject to changes in business, economic and
competitive conditions. Our business is subject to:
changes in reimbursement rates;
intense competition;
foreign exchange rate and interest rate fluctuations;
varying degrees of acceptance of new product introductions;
technological developments in our industry;
uncertainties in litigation or investigative proceedings and regulatory developments in the healthcare
sector; and
the availability of financing.
Our business is also subject to other risks and uncertainties that we describe from time to time in our public
filings. See Item 3.D, “Key Information – Risk Factors.” Developments in any of these areas could cause our
results to differ materially from the results that we or others have projected or may project.
Reimbursement Rates
Approximately 32% of our worldwide revenue for 2013 was for services rendered to patients covered by
Medicare’s ESRD program and Medicaid. In order to be eligible for reimbursement by Medicare, ESRD facilities
must meet conditions for coverage established by CMS. Additionally, government agencies may make changes
in program interpretations, requirements or conditions of participation, and retain the right to audit the accuracy
of our computations of rebates and pricing, some of which may result in implications (such as recoupment) for
amounts previously estimated or paid which may have a material adverse effect on the Company’s revenues,
profitability and financial condition. See Item 4.B, “Information on the Company – Business Overview –
Regulatory and Legal Matters – Reimbursement” and “– Health Care Reform.”
We also obtain a significant portion of our net revenues from reimbursement by non-government payors.
Historically, these payors' reimbursement rates generally have been higher than government program rates in
their respective countries. However, non-governmental payors are imposing cost containment measures that are
creating significant downward pressure on reimbursement levels that we receive for our services and products.
Inflation
The effects of inflation during the periods covered by the consolidated financial statements have not been
significant to our results of operations. However, a major portion of our net revenues from dialysis care are
subject to reimbursement rates regulated by governmental authorities, and a significant portion of other
revenues, especially revenues from the U.S., is received from customers whose revenues are subject to these
regulated reimbursement rates. Non-governmental payors are also exerting downward pressure on
reimbursement rates. Increased operation costs that are subject to inflation, such as labor and supply costs, may
not be recoverable through price increases in the absence of a compensating increase in reimbursement rates
payable to us and our customers, and could materially adversely affect our business, financial condition and
results of operations.
Management of Foreign Exchange and Interest Rate Risks
We are primarily exposed to market risk from changes in foreign exchange rates and changes in interest
rates. In order to manage the risks from these foreign exchange rate and interest rate fluctuations, we enter into
various hedging transactions, as authorized by the Management Board of the general partner, with banks which
generally have ratings in the “A” Category or better. We do not use financial instruments for trading or other
speculative purposes.

120
Fresenius SE, as provided for under a service agreement, conducts financial instrument activity for us and its
other subsidiaries under the control of a single centralized department. Fresenius SE has established guidelines,
that we have agreed to, for risk assessment procedures and controls for the use of financial instruments. They
include a clear segregation of duties with regard to execution on one side and administration, accounting and
controlling on the other.
Foreign Exchange Risk
We conduct our business on a global basis in various currencies, although our operations are located
principally in the United States and Germany. For financial reporting purposes, we have chosen the U.S. dollar
as our reporting currency. Therefore, changes in the rate of exchange between the U.S. dollar and the local
currencies in which the financial statements of our international operations are maintained, affect our results of
operations and financial position as reported in our consolidated financial statements. We have consolidated the
balance sheets of our non-U.S. dollar denominated operations into U.S. dollars at the exchange rates prevailing
at the balance sheet date. Revenues and expenses are translated at the average exchange rates for the period.
Our exposure to market risk for changes in foreign exchange rates relates to transactions such as sales and
purchases. We have significant amounts of sales of products invoiced in euro from our European manufacturing
facilities to our other international operations. This exposes our subsidiaries to fluctuations in the rate of
exchange between the euro and the currency in which their local operations are conducted. For the purpose of
hedging existing and foreseeable foreign exchange transaction exposures we enter into foreign exchange forward
contracts and, on a small scale, foreign exchange options. Our policy, which has been consistently followed, is
that foreign exchange rate derivatives be used only for purposes of hedging foreign currency exposures. We have
not used such instruments for purposes other than hedging.
In connection with intercompany loans in foreign currency, we normally use foreign exchange swaps thus
assuring that no foreign exchange risks arise from those loans.
The Company is exposed to potential losses in the event of non-performance by counterparties to financial
instruments. We do not expect any counterparty to fail to meet its obligations. The current credit exposure of
foreign exchange derivatives is represented by the fair value of those contracts with a positive fair value at the
reporting date. The table below provides information about our foreign exchange forward contracts at December
31, 2013. The information is provided in U.S. dollar equivalent amounts. The table presents the notional
amounts by year of maturity, the fair values of the contracts, which show the unrealized net gain (loss) on
existing contracts as of December 31, 2013, and the credit risk inherent to those contracts with positive market
values as of December 31, 2013. All contracts expire within 23 months after the reporting date.
Foreign Currency Risk Management
December 31, 2013
(USD in millions)
Nominal amount
2014 2015 2016 2017 2018 Total
Fair
value
Credit
risk
Purchase of EUR against US$ $ 74 5 - - - $ 79 $ 4 $ 3
Sale of EUR against US$ 840 - - - - 840 (18) -
Purchase of EUR against others 557 63 - - - 620 8 14
Sale of EUR against others 147 30 - - - 177 (2) 1
Others 36 0 - - - 36 (0) 0
Total $ 1,654 98 - - - $ 1,752 $ (8) $ 18
A summary of the high and low exchange rates for the euro to U.S. dollars and the average exchange rates
for the last five years is set forth below. The European Central Bank (“ECB”) determines such rates (“Reference
Rates”) based on the regular daily averaging of rates between central banks within and outside the European
banking system. The ECB normally publishes the Reference Rates daily at 2:15 p.m. (CET). In preparing our
consolidated financial statements and in converting certain U.S. dollar amounts in this report, we have used the
Year’s Average Reference Rate of $1.3281 or Year’s Close Reference Rate of $1.3791 per €1.00.

121
Year ending Year's Year's Year's Year's
December 31, High Low Average Close
2009 US$ per EUR 1.5120 1.2555 1.3948 1.4406
2010 US$ per EUR 1.4563 1.1942 1.3259 1.3362
2011 US$ per EUR 1.4882 1.2889 1.3920 1.2939
2012 US$ per EUR 1.3454 1.2089 1.2848 1.3194
2013 US$ per EUR 1.3814 1.2768 1.3281 1.3791
The Reference Rate on February 19, 2014 was $1.3745 per €1.00.
Cash-Flow-at-Risk Model
We use a Cash-Flow-at-Risk (CFaR) model in order to estimate and quantify transaction risks from foreign
currencies. The basis for the analysis of the currency risk is the foreign currency cash flows that are reasonably
expected to arise within the following twelve months, less any hedges. As of December 31, 2013, the
Company’s cash flow at risk amounts to $50.5 million; this means the potential loss in relation to the forecasted
foreign exchange cash flows of the next twelve months has a 95% probability of not being higher than $50.5
million.
Significant influence on the Company's foreign currency risk is exerted by the Chinese renminbi, the U.S.
dollar, the Russian ruble, the South Korean Won, and the Turkish lira. The following table shows the Company’s
most significant net positions in foreign currencies.
Year ending
December 31,
Net Positions in Foreign Currencies 2013
(in millions)
CNY $ 232
USD 133
RUB 102
KRW 67
TRY 52
Interest Rate Exposure
We are exposed to changes in interest rates that affect our variable-rate borrowings. We enter into debt
obligations including accounts receivable securitizations to support our general corporate purposes such as
capital expenditures and working capital needs. Consequently, we enter into derivatives, particularly interest rate
swaps to protect interest rate exposures arising from borrowings at floating rates by effectively swapping them
into fixed rates.
These interest rate derivatives are designated as cash flow hedges and have been entered into in order to
effectively convert payments based on variable interest rates into payments at a fixed rate. The euro-
denominated interest rate swaps expire in 2016 and have an interest rate of 1.73%.
As of December 31, 2013, the notional amount of euro-denominated interest rate swaps in place was €100
million ($138 million). Interest payable and interest receivable under the swap agreements are accrued and
recorded as an adjustment to interest expense at each reporting date. At December 31, 2013, the negative fair
value of our interest rate agreements is $4 million.
The table below presents principal amounts and related weighted average interest rates by year of maturity
for interest rate swaps and for our significant debt obligations.

122
Interest Rate Exposure
December 31, 2013
(in millions)
Fair
Value
There- Dec. 31,
2014 2015 2016 2017 2018 after Totals 2013
FLOATING RATE US$ DEBT
Principal payments on Senior Credit
Agreement $ 200 200 200 2,038 $ 2,638 $ 2,641
Variable interest rate = 2.00%
Accounts receivable securitization program $ 351 $ 351 $ 351
Variable interest rate = 0.22%
FLOATING RATE € DEBT
Principal payments on Senior Credit
Agreement $ 69 $ 69 $ 69
Variable interest rate = 1.95%
Euro Notes 2009/2014 $ 32 $ 32 $ 32
Variable interest rate = 5.843%
EIB loan $ 193 $ 193 $ 193
Variable interest rate = 1.00%
Senior Notes 2011/2016 $ 138 $ 138 $ 144
Variable interest rate = 3.73%
FIXED RATE US$ DEBT
Senior Notes 2007/2017;
Fixed interest rate = 6.875% $ 497 $ 497 $ 569
Senior Notes 2011/2018;
Fixed interest rate = 6.50% $ 396 $ 396 $ 453
Senior Notes 2011/2021;
Fixed interest rate = 5.75% $ 646 $ 646 $ 691
Senior Notes 2012/2019;
Fixed interest rate = 5.625% $ 800 $ 800 $ 864
Senior Notes 2012/2022;
Fixed interest rate = 5.875% $ 700 $ 700 $ 742
FIXED RATE € DEBT
Euro Notes 2009/2014 $ 15 $ 15 $ 15
Fixed interest rate = 8.3835%
Senior Notes 2010/2016 $ 343 $ 343 $ 381
Fixed interest rate = 5.50%
Senior Notes 2011/2018 $ 547 $ 547 $ 650
Fixed interest rate = 6.50%
Senior Notes 2011/2021 $ 414 $ 414 $ 465
Fixed interest rate = 5.25%
Senior Notes 2012/2019 $ 345 $ 345 $ 390
Fixed interest rate = 5.25%
INTEREST RATE DERIVATIVES
€ Payer Swaps Notional Amount $ 138 $ 138 $ (4)
Average fixed pay rate = 1.73% 1.73%
Receive rate = 3-month EURIBOR
All variable interest rates depicted above are as of December 31, 2013

123
Interest Rate Sensitivity Analysis
For purposes of analyzing the impact of changes in the relevant reference interest rates on the Company’s
results of operations, the Company calculates the portion of financial debt which bears variable interest and
which has not been hedged by means of interest rate swaps or options against rising interest rates. For this
particular portion of its liabilities, the Company assumes an increase in the reference rates of 0.5% compared to
the actual rates as of reporting date. The corresponding additional annual interest expense is then compared to
the Company’s net income. This analysis shows that an increase of 0.5% in the relevant reference rates would
have an effect of approximately 1% on the consolidated net income of the Company.
Item 12. Description of Securities other than Equity Securities
D. American Depositary Shares
For a description of our American Depositary Shares, see Item 10.B, “Additional Information – Articles of
Association – Description of American Depositary Receipts.”
D.3. Fees and expenses
ADS holders will be charged a fee for each issuance of ADSs, including issuances resulting from
distributions of shares, rights and other property, and for each surrender of ADSs in exchange for deposited
securities. The fee in each case is up to $5.00 for each 100 ADSs (or any portion thereof) issued or surrendered.
The following additional charges shall be incurred by the ADS holders, by any party depositing or
withdrawing shares or by any party surrendering ADSs or to whom ADSs are issued (including, without
limitation, issuance pursuant to a stock dividend or stock split declared by the Company or an exchange of stock
regarding the ADSs or the deposited securities or a distribution of ADRs), whichever is applicable:
a fee of $0.02 or less per ADS (or portion thereof) for any cash distribution made pursuant to the
deposit agreement;
a fee of $0.02 per ADS (or portion thereof) per year for services performed by the depositary in
administering our ADS program (which fee shall be assessed against holders of ADSs as of the record
date set by the depositary not more than once each calendar year and shall be payable in the manner
described in the next succeeding provision);
any other charge payable by any of the depositary, any of the depositary's agents, including, without
limitation, the custodian, or the agents of the depositary's agents in connection with the servicing of
our shares or other deposited securities (which charge shall be assessed against registered holders of
our ADSs as of the record date or dates set by the depositary and shall be payable at the sole discretion
of the depositary by billing such registered holders or by deducting such charge from one or more cash
dividends or other cash distributions);
a fee for the distribution of securities (or the sale of securities in connection with a distribution), such
fee being in an amount equal to the fee for the execution and delivery of ADSs which would have been
charged as a result of the deposit of such securities (treating all such securities as if they were shares)
but which securities or the net cash proceeds from the sale thereof are instead distributed by the
depositary to those holders entitled thereto;
stock transfer or other taxes and other governmental charges;
cable, telex and facsimile transmission and delivery charges incurred at the request of holders of our
shares;
transfer or registration fees for the registration of transfer of deposited securities on any applicable
register in connection with the deposit or withdrawal of deposited securities; and
expenses of the depositary in connection with the conversion of foreign currency into U.S. dollars.
We will pay all other charges and expenses of the depositary and any agent of the depositary (except the
custodian) pursuant to agreements from time to time between us and the depositary. The fees described above
may be amended from time to time.

124
D.4. Amounts payable by the depositary to the Company
Fees Incurred in Past Annual Period
Under the fee agreement between us and the depositary, the depositary agrees to pay certain fees relating to
the maintenance of the ADRs. Certain fees we encounter related to our ADRs are reimbursed to us by the
depositary. For 2013, we received from the depositary $0.4 million in aggregate payments for continuing annual
stock exchange listing fees, standard out-of-pocket maintenance costs for the ADRs (consisting of the expenses
of postage and envelopes for mailing annual and interim financial reports, printing and distributing dividend
checks, electronic filing of U.S. Federal tax information, mailing required tax forms, stationary, postage,
facsimile, and telephone calls), any applicable performance indicators relating to the ADR facility and legal fees.
In addition, in connection with the mandatory conversion of our preference shares into ordinary shares (see
Item 4A, "History and Development of the Company" and Item 10, “Additional Information – Description of
American Depositary Receipts – General”), the depositary waived its customary fees in connection with the
deposit of the ordinary shares into which the preference shares held by the depositary had been converted, the
surrender of preference share ADSs by the holders and the issuance of ordinary shares ADSs to former
preference share ADS holders.
Fees to be Paid in the Future
The Bank of New York Mellon, as depositary, has agreed to reimburse us for expenses we incur that are
related to establishment and maintenance expenses of the ADS program. The depositary has agreed to reimburse
us for its continuing annual stock exchange listing fees. The depositary has also agreed to pay the standard out-
of-pocket maintenance costs for the ADRs, which consist of the expenses of postage and envelopes for mailing
annual and interim financial statements, printing and distributing dividend checks, electronic filing of U.S.
Federal tax information, mailing required tax forms, stationary, postage, facsimile, and telephone calls. It has
also agreed to reimburse us annually for certain investor relations programs or special investor relations
promotion activities. In certain instances, the depositary has agreed to provide additional payments to us based
on any applicable performance indicators relating to the ADR facility. There are limits on the amount of
expenses for which the depositary will reimburse the Company, but the amount of reimbursement available to us
is not necessarily tied to the amount of fees the depositary collects from investors.
The depositary collects its fees for delivery and surrender of ADSs directly from investors depositing shares
or surrendering ADSs for the purpose of withdrawal or from intermediaries acting for them. The depositary
collects fees from the amounts distributed or by selling a portion of distributable property to pay the fees. The
depositary may collect its annual fee for depositary services by deduction from cash distributions or by directly
billing investors or by charging the book-entry system accounts of participants acting for them. The depositary
may generally refuse to provide fee-attracting services until its fees for those services are paid.
PART II
Item 13. Defaults, Dividend Arrearages and Delinquencies
None
Item 14. Material Modifications to the Rights of Security Holders and Use of Proceeds
Not applicable
Item 15A. Disclosure Controls and Procedures
The Company's management, including the members of the Management Board of our general partner
performing the functions Chief Executive Officer and Chief Financial Officer, has conducted an evaluation of
the effectiveness of the Company's disclosure controls and procedures as of the end of the period covered by this
report, as contemplated by Exchange Act Rule 13a-15. Based on that evaluation, the persons performing the
functions of Chief Executive Officer and Chief Financial Officer concluded in connection with the filing of this
report that the disclosure controls and procedures are designed to ensure that the information the Company is
required to disclose in the reports filed or furnished under the Exchange Act is recorded, processed, summarized

125
and reported within the time periods specified in the Commission’s rules and forms and are effective to ensure
that the information the Company is required to disclose in its reports is accumulated and communicated to the
general partner’s Management, including the general partner’s Chief Executive Officer and the Chief Financial
Officer, as appropriate to allow timely decisions regarding required disclosure. During the past fiscal quarter,
there have been no significant changes in internal controls, or in factors that could significantly affect internal
controls.
Item 15B. Management’s annual report on internal control over financial reporting
Management of the Company is responsible for establishing and maintaining adequate internal control over
financial reporting, as such term is defined in Exchange Act Rules 13a-15(f). The Company’s internal control
over financial reporting is a process designed by or under the supervision of the Chief Executive Officer of our
general partner and Chief Financial Officer of our general partner, to provide reasonable assurance regarding the
reliability of financial reporting and the preparation of the Company’s financial statements for external reporting
purposes in accordance with U.S. generally accepted accounting principles.
As of December 31, 2013, management conducted an assessment of the effectiveness of the Company’s
internal control over financial reporting based on the criteria established in Internal Control – Integrated
Framework (1992) issued by the Committee of Sponsoring Organizations of the Treadway Commission
(COSO). Based on this assessment, management has determined that the Company’s internal control over
financial reporting as of December 31, 2013 is effective.
The Company’s internal control over financial reporting includes policies and procedures that (1) pertain to
the maintenance of records that, in reasonable detail, accurately and fairly reflect transactions and dispositions of
our assets; (2) provide reasonable assurances that the Company’s transactions are recorded as necessary to
permit preparation of financial statements in accordance with U.S. generally accepted accounting principles, and
that the Company’s receipts and expenditures are being made only in accordance with authorizations of
management; and (3) provide reasonable assurance regarding prevention or timely detection of unauthorized
acquisition, use or disposition of the Company’s assets that could have a material effect on the Company’s
financial statements.
Because of its inherent limitation, internal control over financial reporting, no matter how well designed,
cannot provide absolute assurance of achieving financial reporting objectives and may not prevent or detect
misstatements. Therefore, even if the internal control over financial reporting is determined to be effective it can
provide only reasonable assurance with respect to financial statement preparation and presentation. Also,
projections of any evaluation of effectiveness to future periods are subject to the risk that controls may become
inadequate because of changes in conditions, or that the degree of compliance with the policies or procedures
may deteriorate.
The Company has received communications alleging certain conduct in certain countries outside the U.S.
and Germany that may violate the U.S. Foreign Corrupt Practices Act (“FCPA”) or other anti-bribery laws. The
Audit and Corporate Governance Committee of the Company's Supervisory Board is conducting an internal
review with the assistance of independent counsel retained for such purpose. The Company voluntarily advised
the U.S. Securities and Exchange Commission ( “SEC”) and the U.S. Department of Justice (“DOJ”) that
allegations have been made and of the Company's internal review. The Company’s review and dialogue with the
SEC and DOJ are ongoing.
The review has identified conduct that raises concerns under the FCPA or other anti-bribery laws that may
result in monetary penalties or other sanctions. In addition, the Company’s ability to conduct business in certain
jurisdictions could be negatively impacted. Given the current status of the internal review, the Company cannot
reasonably estimate the possible loss or range of possible loss that may result from the identified matters or from
the final outcome of the continuing internal review. Accordingly, no provision with respect to these matters has
been made in the accompanying consolidated financial statements.
The Company’s independent counsel, in conjunction with the Company’s Compliance Department, have
reviewed the Company’s anti-corruption compliance program, including internal controls related to compliance
with international anti-bribery laws, and appropriate enhancements are being implemented. The Company is
fully committed to FCPA compliance.

126
Management’s assessment of the effectiveness of its internal control over financial reporting as of December
31, 2013, is stated in its report included on page F-2.
Item 15C. Attestation report of the registered public accounting firm
The effectiveness of our internal control over financial reporting as of December 31, 2013, has been audited
by KPMG, an independent registered public accounting firm, as stated in their report included on page F-5.
Item 15D. Changes in Internal Control over Financial Reporting
There have been no changes in the Company’s internal control over financial reporting that occurred during
fiscal year 2013, which have materially affected or are reasonably likely to materially affect the Company’s
internal control over financial reporting.
Item 16A. Audit Committee Financial Expert
Our Supervisory Board has determined that each of Prof. Dr. Bernd Fahrholz, Dr. Walter L. Weisman and
Mr. William P. Johnston qualify as an audit committee financial expert and is “independent” as defined in Rule
10A-3 under the Exchange Act, in accordance with the instructions in Item 16A of Form 20-F.
Item 16B. Code of Ethics
In 2003, our Management Board adopted through our worldwide compliance program a code of ethics, titled
the Code of Business Conduct, which as adopted applied to members of the Management Board, including its
chairman and the responsible member for Finance & Controlling, other senior officers and all Company
employees. After the transformation of legal form, our Code of Business Conduct applies to the members of the
Management Board of our general partner and all Company employees, including senior officers. A copy of the
Company’s Code of Business Conduct is available on our website under “Our Company – Compliance” at:
http://www.fmc-ag.com/Code_of_Conduct.htm
Item 16C. Principal Accountant Fees and Services.
In the AGM held on May 16, 2013, our shareholders approved the appointment of KPMG to serve as our
independent auditors for the 2013 fiscal year. KPMG billed the following fees to us for professional services in
each of the last two years:
2013 2012
(in thousands)
Audit fees $ 10,062 $ 11,208
Audit related fees 32 424
Tax fees 578 443
Other fees 3,904 1,536
Total $ 14,576 $ 13,611
"Audit Fees" are the aggregate fees billed by KPMG for the audit of our German statutory and U.S. GAAP
consolidated and annual financial statements, reviews of interim financial statements and attestation services that
are provided in connection with statutory and regulatory filings or engagements. Fees related to the audit of
internal control are included in Audit Fees. "Audit-Related Fees" are fees charged by KPMG for assurance and
related services that are reasonably related to the performance of the audit or review of our financial statements
and are not reported under "Audit Fees." This category comprises fees billed for comfort letters, consultation on
accounting issues, the audit of employee benefit plans and pension schemes, agreed-upon procedure
engagements and other attestation services subject to regulatory requirements. ”Other fees” include amounts

127
related to supply chain consulting fees. "Tax Fees" are fees for professional services rendered by KPMG for tax
compliance, tax advice on implications for actual or contemplated transactions, tax consulting associated with
international transfer prices, and expatriate employee tax services.
Audit Committee's pre-approval policies and procedures
As a German company, we prepare statutory financial statements under German law on the basis of the
accounting principles of the German Commercial Code (Handelsgesetzbuch or HGB) and consolidated financial
statements in accordance with International Financial Reporting Standards. Our supervisory board engages our
independent auditors to audit these financial statements, in consultation with our Audit and Corporate
Governance Committee and subject to approval by our shareholders at our AGM in accordance with German
law.
We also prepare financial statements in accordance with U.S. GAAP, which are included in registration
statements and reports that we file with the Securities and Exchange Commission. Our Audit and Corporate
Governance Committee engages our independent auditors to audit these financial statements in accordance with
Rule 10A-3 under the Exchange Act and Rule 303A.06 of the NYSE Governance Rules. See also the description
in "Item 6C. Directors, Senior Management and Employees - Board Practices."
In 2003, Fresenius Medical Care AG’s audit committee also adopted a policy requiring management to
obtain the committee's approval before engaging our independent auditors to provide any audit or permitted non-
audit services to us or our subsidiaries. Pursuant to this policy, which is designed to assure that such
engagements do not impair the independence of our auditors, the Audit and Corporate Governance Committee
pre-approves a catalog of specific audit and non-audit services in the categories Audit Services, Audit-Related
Services, Tax Services, and Other Services that may be performed by our auditors as well as additional approval
requirements based on fee amount and nature.
The general partner’s Chief Financial Officer reviews all individual management requests to engage our
auditors as a service provider in accordance with this catalog and, if the requested services are permitted
pursuant to the catalog, fee level, and fee structure, approves the request accordingly. Services that are not
included in the catalog exceed applicable fee levels or fee structure are passed on either to the chair of the Audit
and Corporate Governance Committee or to the full committee, for approval on a case by case basis.
Additionally we inform the Audit and Corporate Governance Committee about all approvals on an annual basis.
Neither the chairman of our Audit and Corporate Governance Committee nor the full committee is permitted to
approve any engagement of our auditors if the services to be performed either fall into a category of services that
are not permitted by applicable law or the services would be inconsistent with maintaining the auditors'
independence.
During 2013, the total fees paid to the Audit and Corporate Governance Committee members for service on
the committee were $0.190 million.
Item 16D. Exemptions from the Listing Standards for Audit Committees
Not applicable
Item 16E. Purchase of Equity Securities by the Issuer and Affiliated Purchasers
Under the share buyback program announced by the Company in its ad hoc disclosure on April 4, 2013 the
Company repurchased 7,548,951 bearer ordinary shares in the period from May 20, 2013 until the completion of
the program on August 14, 2013. The Company thereby made use of the authorization pursuant to Section 71
para. 1 no. 8 of the German Stock Corporation Act to acquire treasury shares as granted by the Company's AGM
on May 12, 2011.The treasury shares acquired by the Company will be used to serve the sole purposes of either
reducing the registered share capital of the company by cancellation of the acquired treasury shares, or fulfilling
employee participation programs of the Company. The share buyback was affected in accordance with the safe
harbor provisions pursuant to Sections 14 para. 2.20a paragraph 3 of the German Securities Trading Act in
conjunction with the provisions of the Commission Regulation (EC) No 2273/2003 of December 22, 2003
implementing Directive 2003/6/EC of the European Parliament and of the Council with regard to exemptions for
buyback programs and stabilization of financial instruments (EC-Reg). As of December 31, 2013, all purchased
shares are still being held by the Company and represent €384,966 million or 2.4% percent of the Company's
share capital.

128
See Note 14 for information in the columnar format required by Item 16E regarding the share buyback
program completed during the fiscal year covered by this report.
Item 16F. Change in Registrant’s Certifying Accountant
Not applicable
Item 16G. Corporate Governance
Introduction
ADSs representing our ordinary shares are listed on the New York Stock Exchange (“NYSE”). However,
because we are a “foreign private issuer,” as defined in the rules of the Securities and Exchange Commission
(“SEC”), we are exempt from substantially all of the governance rules set forth in Section 303A of the NYSE’s
Listed Companies Manual, other than the obligation to maintain an audit committee in accordance with Rule
10A-3 under the Exchange Act the obligation to notify the NYSE if any of our executive officers becomes aware
of any material non-compliance with any applicable provisions of Section 303A, and the obligation to file annual
and interim written affirmations, on forms mandated by the NYSE, relating to our compliance with applicable
NYSE governance rules. Many of the governance reforms instituted by the Dodd-Frank Wall Street Reform and
Consumer Protection Act of 2010, including the requirements to provide shareholders with “say-on-pay” and
“say-on-when” advisory votes related to the compensation of certain executive officers, are implemented
through the SEC’s proxy rules. Because foreign private issuers are exempt from the proxy rules, these
governance rules are also not applicable to us. However, the compensation system for our Management Board
was reviewed by an independent external compensation expert at the beginning of 2013. See Item 6B,
“Directors, Senior Management and Employees – Compensation – Compensation of the Management Board.”
Similarly, the more detailed disclosure requirements regarding management compensation applicable to U.S.
domestic companies (including, if it is adopted as proposed, the requirement to disclose the ratio of the median
of the total compensation of all employees of an issuer to the total compensation of the issuer's chief executive
officer) are found in SEC Regulation S-K, whereas compensation disclosure requirements for foreign private
issuers are set forth in the Form 20-F and generally limit our disclosure to the information we disclose under
German law. Subject to the exceptions noted above, instead of applying their governance and disclosure
requirements to foreign private issuers, the rules of both the SEC and the NYSE require that we disclose the
significant ways in which our corporate practices differ from those applicable to U.S. domestic companies under
NYSE listing standards.
As a German company FMC-AG & Co. KGaA follows German corporate governance practices. German
corporate governance practices generally derive from the provisions of the German Stock Corporation Act
(Aktiengesetz, or “AktG”) including capital market related laws, the German Codetermination Act
(Mitbestimmungsgesetz, or “MitBestG”) and the German Corporate Governance Code. Our Articles of
Association also include provisions affecting our corporate governance. German standards differ from the
corporate governance listing standards applicable to U.S. domestic companies which have been adopted by the
NYSE. The discussion below provides certain information regarding our organizational structure, management
arrangements and governance, including information regarding the legal structure of a KGaA, management by a
general partner, certain provisions of our Articles of Association and the role of the Supervisory Board in
monitoring the management of our company by our General Partner. It includes a brief, general summary of the
principal differences between German and U.S. corporate governance practices, together with, as appropriate, a
comparison to U.S. principles or practices.
The Legal Structure of FMC-AG & Co. KGaA
A partnership limited by shares (Kommanditgesellschaft, or “KGaA”) is a mixed form of entity under
German corporate law, which has elements of both a partnership and a corporation. Like a stock corporation
(Aktiengesellschaft, or “AG”), the share capital of a KGaA is held by its shareholders. A KGaA is similar to a
limited partnership because there are two groups of owners, the general partner on the one hand, and the KGaA
shareholders on the other hand. Our General Partner, Management AG, is a wholly-owned subsidiary of
Fresenius SE. KGaAs and AGs are the only legal forms provided by German law for entities whose shares trade
on a German stock exchange.
A KGaA’s corporate bodies are its general partner, its supervisory board and the general meeting of
shareholders. A KGaA may have one or more general partners who conduct the business of the KGaA. However,
unlike an AG, in which the supervisory board appoints the management board, the supervisory board of a KGaA

129
has no influence on appointment of the managing body – the general partner. Likewise, the removal of the
general partner from office is subject to very strict conditions. General partners may, but are not required to,
purchase shares of the KGaA. General partners are personally liable for the liabilities of the KGaA in relations
with third parties subject, in the case of corporate general partners, to applicable limits on liability of
corporations generally.
Management and Oversight
The management structure of FMC-AG & Co. KGaA is illustrated as follows:
General Partner
Management AG, an AG and a wholly owned subsidiary of Fresenius SE, is the sole General Partner of
FMC-AG & Co. KGaA and will conduct its business and represent it in external relations. Use of an AG as the
legal form of the general partner enables the Company to maintain a management structure substantially similar
to FMC-AG & Co. KGaA’s management structure prior to the transformation into a KGaA. Management AG
was incorporated on April 8, 2005 and registered with the commercial register in Hof an der Saale on May 10,
2005. The registered share capital of Management AG is €3.0 million.
The General Partner has not made a capital contribution to the Company and, therefore, will not participate
in its assets or its profits and losses. However, the General Partner will be compensated or reimbursed for all
outlays in connection with conducting the business of the Company, including the remuneration of members of
the general partner’s Management Board and its supervisory board. See “The Articles of Association of FMC-
AG & Co. KGaA – Organization of the Company” below and Item 7.B., “Major Shareholders and Related Party
Transactions”. FMC-AG & Co. KGaA itself will bear all expenses of its administration. Management AG will
devote itself exclusively to the management of FMC-AG & Co. KGaA. The General Partner will receive annual
compensation amounting to 4% of its capital for assuming the liability and the management of FMC-AG & Co.
AG & Co. KGaA. In case of a capital increase of the capital of the General Partner during the year the annual
compensation must be calculated pro rata subject to the registration of such capital increase. This payment of the
annual compensation constitutes a guaranteed compensation for undertaking liability and an indirect return on
Fresenius SE’s investment in the share capital of Management AG. This payment is also required for tax reasons,
to avoid a constructive dividend by the General Partner to Fresenius SE in the amount of reasonable
compensation for undertaking liability for the obligations of FMC AG & Co. KGaA. FMC AG & Co. KGaA will
also reimburse the General Partner for the remuneration paid to the members of the Management Board and its
supervisory board.
Outside Shareholders
Appointment Appointment
Supervisory Board of
Management AG
Monitoring/
Appointment of
Management Board
100%
shares
Management AG
Supervisory Board of
Fresenius Medical Care
AG &Co. KGaA
Monitoring
Fresenius Medical Care
AG & Co. KGaA
Management
31%
shares
(approx)
69%
shares
(approx)
Fresenius SE & Co.
KGaA

130
The position of the general partners in a KGaA is different and in part stronger than that of the shareholders
based on: (i) the management powers of the general partners, (ii) the existing de facto veto rights regarding
material resolutions adopted by the KGaA’s general meeting and (iii) the independence of general partners from
the influence of the KGaA shareholders as a collective body (See “General Meeting”, below). Because Fresenius
SE is the sole shareholder of Management AG, Fresenius SE has the sole power to elect the supervisory board of
Management AG which appoints the members of the Management Board of Management AG, who act on behalf
of the General Partner in the conduct of the company’s business and in relations with third parties. In accordance
to §76 AktG the management of an AG in principle is not bound by instructions of its supervisory board or of
Fresenius SE as sole shareholder.
The statutory provisions governing a partnership, including a KGaA, provide that the consent of the KGaA
shareholders at a general meeting is required for transactions that are not in the ordinary course of business.
However, as permitted by statute, our Articles of Association permit such decisions to be made by Management
AG as General Partner without the consent of the FMC-AG & Co. KGaA shareholders. This does not affect the
general meeting’s right of approval with regard to measures of unusual significance, such as a spin-off of a
substantial part of a company’s assets, as developed in German Federal Supreme Court (Bundesgerichtshof)
decisions.
The General Partner's supervisory board appoints the members of the General Partner’s Management Board
and supervises and advises them in managing Management AG and the Company. The Management Board
conducts the business activities of our Company in accordance with the rules of procedure adopted by the
General Partner's supervisory board pursuant to the German Corporate Governance Code. Under these rules of
procedure, certain transactions are subject to the consent of the supervisory board of Management AG. These
transactions include, among others:
The taking on lease of Management AG, FMC-AG & Co. KGaA and its subsidiaries (“Enterprises”)
or for the lease of affiliated Enterprises or substantial parts thereof;
The acquisition, formation, elimination and encumbrance of an equity participation in other
Enterprises as far as a value of twenty million EUR is exceeded in individual cases;
The adoption of new or the abandonment of existing lines of business or establishments;
Certain transactions with or towards affiliated.
Five of the six members of the Supervisory Board are also members of the supervisory board of
Management AG. The Company and Fresenius SE have entered into a pooling agreement requiring that at least
one-third (and not less than two) members of the General Partner’s supervisory board be “independent directors”
– i.e., persons without a substantial business or professional relationship with the Company, Fresenius SE, or any
affiliate of either, other than as a member of the supervisory boards of the Company or the General Partner. See
below, “Description of the Pooling Arrangements.”
Fresenius SE’s de facto control of the Company through ownership of the General Partner is conditioned
upon its ownership of a substantial amount of the Company’s share capital (see “The Articles of Association of
FMC-AG & Co. KGaA – Organization of the Company”, below).
Supervisory Board
The supervisory board of a KGaA is similar in certain respects to the supervisory board of an AG. Like the
supervisory board of an AG, the supervisory board of a KGaA is under an obligation to oversee the management
of the business of the Company. The members of the supervisory board are elected by the KGaA shareholders at
the general meeting. Our most recent Supervisory Board elections occurred in May of 2011. Shares in the KGaA
held by the general partner or its affiliated companies are not entitled to vote for the election of the supervisory
board members of the KGaA. Accordingly, Fresenius SE is not entitled to vote its shares for the election of
FMC-AG & Co. KGaA’s Supervisory Board members.
Although Fresenius SE will not be able to vote in the election of FMC-AG & Co. KGaA’s Supervisory
Board, Fresenius SE will nevertheless retain influence on the composition of the Supervisory Board. Because (i)
four of the six former members of the FMC-AG Supervisory Board continue to hold office as four of the six
current members of the Supervisory Board of FMC-AG & Co. KGaA (except for Rolf A. Classon and Mr.
William P. Johnston) and (ii) in the future, the FMC-AG & Co. KGaA Supervisory Board will propose future
nominees for election to its Supervisory Board (subject to the right of shareholders to make nominations),
Fresenius SE is likely to retain de facto influence over the selection of the Supervisory Board of FMC-AG & Co.
KGaA. However, under our recent Articles of Association, a resolution for the election of members of the

131
Supervisory Board requires the affirmative vote of 75% of the votes cast at the general meeting. Such a high vote
requirement could be difficult to achieve, which could result in the need to apply for court appointment of
members to the Supervisory Board after the end of the terms of the members in office.
The Supervisory Board of FMC-AG & Co. KGaA has less power and scope for influence than a supervisory
board of an AG. The Supervisory Board is not entitled to appoint the General Partner or its executive bodies. Nor
may the Supervisory Board subject the management measures of the General Partner to its consent, or issue rules
of procedure for the General Partner. Management of the Company will be conducted by the Management Board
of the General Partner and only the supervisory board of the General Partner (all of whose members will be
elected solely by Fresenius SE) has the authority to appoint or remove the members of the Management Board.
FMC-AG & Co. KGaA’s Supervisory Board will represent FMC-AG & Co. KGaA in transactions with the
General Partner.
FMC-AG & Co. KGaA’s annual financial statements are submitted to the Company’s shareholders for
approval at the AGM. Except for making a recommendation to the general meeting regarding such approval, this
matter is not within the competence of the Supervisory Board.
Under certain conditions supervisory boards of large German AGs will include both shareholder
representatives and a certain percentage of labor representatives, referred to as “co-determination.” Depending
on the company’s total number of employees, up to one half of the supervisory board members are being elected
by the company’s employees. In these cases traditionally the chairman is a representative of the shareholders. In
case of a tie vote, the supervisory board chairman may cast the decisive tie-breaking vote. We are not currently
subject to German co-determination law requirements.
In recent history, there has been a trend towards selecting shareholder representatives for supervisory boards
from a wider spectrum of candidates, including representatives from non-German companies, in an effort to
introduce a broader range of experience and expertise and a larger degree of independence. In this regard, see the
discussion of the German Corporate Governance Code recommendations regarding the composition of
supervisory boards in Item 16G, “Corporate Governance – Comparison with U.S. and NYSE Governance
Standards and Practices.” German regulations also have several rules applicable to supervisory board members
which are designed to ensure that the supervisory board members as a group possess the knowledge, ability and
expert experience to properly complete their tasks as well as to ensure a certain degree of independence of the
board’s members. In addition to prohibiting members of the management board from serving on the supervisory
board, German law requires members of the supervisory board to act in the best interest of the company. They do
not have to follow direction or instruction from third parties. Any service, consulting or similar agreements
between the company and any of its supervisory board members must be approved by the supervisory board.
General Meeting
The general meeting is the resolution body of the KGaA shareholders. Shareholders can exercise their voting
rights at the general meeting themselves, by proxy via a representative of their choice, or by a Company-
nominated proxy acting on their instructions. Among other matters, the annual general meeting (“AGM”) of a
KGaA approves its annual financial statements. The internal procedure of the general meeting of a KGaA
corresponds to that of the general meeting of a stock corporation. The agenda for the general meeting is fixed by
the general partner and the KGaA supervisory board except that the general partner cannot propose nominees for
election as members of the KGaA supervisory board or proposals for the Company auditors.
KGaA shareholders exercise influence in the general meeting through their voting rights but, in contrast to
an AG, the general partner of a KGaA has a de facto veto right with regard to material resolutions. The members
of the supervisory board of a KGaA are elected by the general meeting as in an AG. Although Fresenius SE, as
sole shareholder of the General Partner of the Company is not entitled to vote its shares in the election of the
Supervisory Board of FMC-AG & Co. KGaA, Fresenius SE retains a degree of influence on the composition of
the Supervisory Board of FMC-AG & Co. KGaA due to the overlapping membership on the FMC-AG & Co.
KGaA Supervisory Board and the Management AG supervisory board (see “The Supervisory Board”, above).
Fresenius SE is subject to various bans on voting at general meetings due to its ownership of the shares of
the General Partner. Fresenius SE is banned from voting on resolutions concerning the election to and removal
from office of the FMC-AG & Co. KGaA Supervisory Board, ratification or discharge of the actions of the
General Partner and members of the Supervisory Board, the appointment of special auditors, the assertion of
claims for damages against members of the executive bodies, the waiver of claims for damages, and the selection
of auditors of the annual financial statements.

132
Certain matters requiring a resolution at the general meeting will also require the consent of the General
Partner, such as amendments to the Articles of Association, dissolution of the Company, mergers, a change in
the legal form of the partnership limited by shares and other fundamental changes. The General Partner therefore
has a de facto veto right on these matters. Annual financial statements are subject to approval by both the KGaA
shareholders and the General Partner.
The Articles of Association of FMC-AG & Co. KGaA
The following is a summary of certain material provisions of our Articles of Association. This summary is
not complete and is qualified in its entirety by reference to the complete form of Articles of Association of FMC-
AG & Co. KGaA, a convenience English translation of which is on file with the SEC. In addition, it can be
found on the Company’s website under www.fmc-ag.com.
Organization of the Company
The Articles of Association contain several provisions relating to the General Partner.
Under the Articles of Association, possession of the power to control management of the Company through
ownership of the General Partner is conditioned upon ownership of a specific minimum portion of the
Company’s share capital. Under German law, Fresenius SE could significantly reduce its holdings in the
Company’s share capital while at the same time retaining its de facto control over the Company’s management
through its ownership of the shares of the General Partner. The Articles of Association of FMC-AG & Co.
KGaA required that a parent company shall hold an interest of more than 25% of the share capital of FMC-AG
& Co. KGaA. As a result, the General Partner will be required to withdraw from FMC-AG & Co. KGaA if its
shareholder no longer holds, directly or indirectly, more than 25% of the Company’s share capital. The effect of
this provision is that Fresenius SE may not reduce its capital participation in FMC-AG & Co. KGaA below such
amount without causing the withdrawal of the General Partner. The Articles of Association also permit a transfer
of all shares in the General Partner to the Company, which would have the same effect as withdrawal of the
General Partner.
The Articles of Association also provide that the General Partner must withdraw if the shares of the General
Partner are acquired by a person who does not make an offer under the German Securities Acquisition and
Takeover Act (Wertpapiererwerbs- und Übernahmegesetz or WpÜG) to acquire the shares of the Company’s
other shareholders within three months of the acquisition of the General Partner. The consideration to be offered
to shareholders must include any portion of the consideration paid for the General Partner’s shares in excess of
the General Partner’s equity capital, even if the parties to the sale allocate the premium solely to the General
Partner’s shares. These provisions would therefore trigger a takeover offer at a lower threshold than the German
Securities Acquisition and Takeover Act, which requires that a person who acquires at least 30% of a company’s
shares make an offer to all shareholders. The provisions will enable shareholders to participate in any potential
control premium payable for the shares of the General Partner, although the obligations to make the purchase
offer and extend the control premium to outside shareholders could also discourage an acquisition of the General
Partner, thereby discouraging a change of control.
In the event that the General Partner withdraws from FMC-AG & Co. KGaA as described above or for other
reasons, the Articles of Association provide for continuation of the Company as a so-called “unified KGaA”
(Einheits-KGaA), i.e., a KGaA in which the general partner is a wholly-owned subsidiary of the KGaA. Upon
the coming into existence of a “unified KGaA”, the shareholders of FMC-AG & Co. KGaA would effectively be
restored to the status as shareholders in an AG, since the control over the General Partner would be exercised by
FMC-AG & Co. KGaA’s Supervisory Board pursuant to the Articles of Association. If the KGaA is continued as
a “unified KGaA,” an extraordinary general meeting or the next AGM would vote on a change in the legal form
of the partnership limited by shares into a stock corporation. In such a case, the change of legal form back to the
stock corporation would be facilitated by provisions of the Articles of Association requiring only a simple
majority vote and that the General Partner consent to the transformation of legal form.
The Articles of Association provide that to the extent legally required, the General Partner must declare or
refuse its consent to resolutions adopted by the meeting directly at the general meeting.
The articles of association of a KGaA may be amended only through a resolution of the general meeting
adopted by a qualified majority (in excess of 75% of the voting shares) and with the consent of the general
partner. Therefore, neither group (i.e., the KGaA shareholders nor the general partner(s)) can unilaterally amend
the articles of association without the consent of the other group. Fresenius SE will, however, continue to be able
to exert significant influence over amendments to the Articles of Association through its ownership of a

133
significant percentage of the Company’s ordinary shares, since such amendments require a qualified majority (in
excess of 75%) of the shares present at the meeting rather than three quarters of the outstanding shares.
Description of the Pooling Arrangements
Prior to the transformation of legal form of FMC-AG to FMC-AG & Co. KGaA, FMC-AG, Fresenius SE
and the independent directors (as defined in the pooling agreements referred to below) of FMC-AG were parties
to two pooling agreements for the benefit of the holders of our ordinary shares and the holders of our preference
shares (other than Fresenius SE and its affiliates). Upon consummation of the transformation in February 2006
and completion of the conversion offer made to holders of our preference shares in connection with the
transformation, we entered into pooling arrangements that we believe provide similar benefits for the holders of
the ordinary shares (and, until the mandatory conversion of our preference shares in June 2013, the preference
shares) of FMC-AG & Co. KGaA. The following is a summary of the material provisions of the pooling
arrangements which we have entered into with Fresenius SE and our independent directors.
General
The pooling arrangements have been entered into for the benefit of all persons who, from time to time,
beneficially own our ordinary shares, including owners of ADSs evidencing our ordinary shares, other than
Fresenius SE and its affiliates or their agents and representatives. Beneficial ownership is determined in
accordance with the beneficial ownership rules of the SEC.
Independent Directors
Under the pooling arrangements, no less than one-third of the supervisory board of Management AG, the
general partner of FMC-AG & Co. KGaA, must be independent directors, and there must be at least two
independent directors. Independent directors are persons without a substantial business or professional
relationship with us, Fresenius SE, or any affiliate of either, other than as a member of the Supervisory Board of
FMC-AG & Co. KGaA or as a member of the supervisory board of Management AG. If an independent director
resigns, is removed, or is otherwise unable or unwilling to serve in that capacity, a new person shall be appointed
to serve as an independent director in accordance with the provisions of the articles of association of the General
Partner, and the pooling arrangements, if as a result of the resignation or removal the number of independent
directors falls below the required minimum. The provisions of the pooling agreement relating to independent
directors are in addition to the functions of the joint committee established in connection with the transformation
of our legal form (See Item 6C, "Directors, Senior Management and Employees-Board Practices"), and are also
in addition to the requirement of Rule 10A-3 under the Exchange Act that our audit committee be composed
solely of independent directors as defined in that rule. We have identified the members of Management AG’s
supervisory board who are independent for purposes of our pooling arrangements in Item 6.B., “Directors,
Senior Management and Employees – The General Partner’s Supervisory Board.”
Extraordinary Transactions
Under the pooling arrangements, we and our affiliates on the one hand, and Management AG and Fresenius
SE and their affiliates on the other hand, must comply with all provisions of German law regarding: any merger,
consolidation, sale of all or substantially all assets, recapitalization, other business combination, liquidation or
other similar action not in the ordinary course of our business, any issuance of shares of our voting capital stock
representing more than 10% of our total voting capital stock outstanding, and any amendment to our articles of
association which adversely affects any holder of ordinary shares.
Interested Transactions
We and Management AG and Fresenius SE have agreed that while the pooling arrangements are in effect, a
majority of the independent directors must approve any transaction or contract, or any series of related
transactions or contracts, between Fresenius SE, Management AG or any of their affiliates (other than us or our
controlled affiliates), on the one hand, and us or our controlled affiliates, on the other hand, which involves
aggregate payments in any calendar year in excess of €5 million for each individual transaction or contract, or a
related series of transactions or contracts. However, approval is not required if the transaction or contract, or
series of related transactions or contracts, has been described in a business plan or budget that a majority of the
independent directors has previously approved. In any year in which the aggregate amount of transactions that
require approval (or that would have required approval in that calendar year but for the fact that such payment or
other consideration did not exceed €5 million) has exceeded €25 million, a majority of the independent directors
must approve all further interested transactions involving more than €2.5 million. However, approval is not

134
required if the transaction or contract, or series of related transactions or contracts, has been described in a
business plan or budget that a majority of independent directors has previously approved.
Listing of American Depositary Shares; SEC Filings
During the term of the pooling agreement, Fresenius SE has agreed to use its best efforts to exercise its
rights as the direct or indirect holder of the general partner interest in Fresenius Medical Care AG & Co. KGaA
to cause us to, and we have agreed to:
maintain the effectiveness of the deposit agreement for the ordinary shares, or a similar agreement,
and to assure that the ADSs evidencing the ordinary shares are listed on either the New York Stock
Exchange or the Nasdaq Stock Market;
file all reports, required by the New York Stock Exchange or the Nasdaq Stock Market, as applicable,
the Securities Act, the Exchange Act and all other applicable laws;
prepare all financial statements required for any filing in accordance with generally accepted
accounting principles of the U.S. (“U.S. GAAP”);
on an annual basis, prepare audited consolidated financial statements in accordance with U.S. GAAP,
and, on a quarterly basis, prepare and furnish to the SEC consolidated financial statements prepared in
accordance with U.S. GAAP under cover of form 6-K or a comparable successor form;
furnish materials to the SEC with respect to annual and special shareholder meetings under cover of
Form 6-K and make the materials available to the depositary for distribution to holders of ordinary
share ADSs; and
make available to the depositary for distribution to holders of ADSs representing our ordinary shares
on an annual basis, a copy of any report prepared by the supervisory board or the supervisory board of
the general partner and provided to our shareholders generally pursuant to Section 314(2) of the
German Stock Corporation Act, or any successor provision. These reports concern the results of the
supervisory board’s examination of the managing board’s report on our relation with affiliated
enterprises.
We undertook similar commitments with respect to the listing of the preference share ADSs and distribution
of voting materials, reports and other information to the holders of such ADSs until the preference share ADSs
were delisted from the New York Stock Exchange in connection with the mandatory conversion of our
preference shares into ordinary shares. The provisions of the pooling agreement relating to our ordinary shares
(including ordinary shares represented by ordinary share ADSs) continue in effect following the mandatory
conversion of our preference shares.
Term
The pooling arrangements will terminate if:
Fresenius SE or its affiliates acquire all our voting shares;
Fresenius SE’s beneficial ownership of our outstanding share capital is reduced to less than 25%;
Fresenius SE or an affiliate of Fresenius SE ceases to own the general partner interest in FMC-AG &
Co. KGaA; or
we no longer meet the minimum threshold for obligatory registration of the ordinary shares or ADSs
representing our ordinary shares under Section 12(g)(1) of the Exchange Act and Rule 12g-1
thereunder.
Amendment
Fresenius SE and a majority of the independent directors may amend the pooling arrangements, provided,
that beneficial owners of 75% of the ordinary shares held by shareholders other than Fresenius SE and its
affiliates at a general meeting of shareholders approve such amendment.

135
Enforcement; Governing Law
The pooling arrangements are governed by New York law and may be enforced in the state and federal
courts of New York. The Company and Fresenius SE have confirmed their intention to abide by the terms of the
pooling arrangements as described above.
Directors and Officers Insurance
Subject to any mandatory restrictions imposed by German law, FMC-AG has obtained and FMC-AG & Co.
KGaA will continue to maintain directors and officers insurance in respect of all liabilities arising from or
relating to the service of the members of the supervisory board and our officers, subject to legally mandated
deductibles. We believe that our acquisition of that insurance is in accordance with customary and usual policies
followed by public corporations in the U.S.
Annual Financial Statement and Allocation of Profits
The Articles of Association on rendering of accounts require that the annual financial statement and
allocation of profits of FMC-AG & Co. KGaA be submitted for approval to the AGM of the Company.
The Articles of Association of FMC-AG & Co. KGaA provide that Management AG is authorized to
transfer up to a maximum of half of the annual profits of FMC-AG & Co. KGaA to other retained earnings in
preparing the annual financial statements.
Articles of Association of Management AG
As a separate corporation, Management AG, has its own articles of association.
The amount of Management AG’s share capital is €3,000,000, issued as 3,000,000 registered shares without
par value.
Directors’ Share Dealings
According to Section 15a of the German Securities Trading Act (Wertpapierhandelsgesetz,), members of the
management and supervisory boards or other employees in management positions and their close associates are
required to inform the Company within five business days when buying or selling our shares and financial
instruments based on them if the volume exceeds € 5,000 within a single year. We publish the information
received in these reports on our web site in accordance with the regulations as well as in our Annual Report to
Shareholders. The members of the management and supervisory boards of the General Partner and of the
Company are not subject to the reporting requirements of Section 16 of the Exchange Act with respect to their
transactions in our shares.
Comparison with U.S. and NYSE Governance Standards and Practices
The listing standards of the NYSE require that a U.S. domestic listed company have a majority of
independent board members and that the independent directors meet in regularly scheduled sessions without
management. U.S. listed companies also must adopt corporate governance guidelines that address director
qualification standards, director responsibilities, director access to management and independent advisors,
director compensation, director orientation and continuing education, management succession, and an annual
performance evaluation of the board. Although, as noted above, our status as a foreign private issuer exempts us
from these NYSE requirements, several of these concepts are addressed (but not mandated) by the German
Corporate Governance Code. The most recent version of the German Corporate Governance Code is dated May
13, 2013. While the German Corporate Governance Code’s governance rules applicable to German corporations
are not legally binding, companies failing to comply with the German Corporate Governance Code’s
recommendations must disclose publicly how and for what reason their practices differ from those recommended
by the German Corporate Governance Code. A convenience translation of our most recent annual “Declaration
of Compliance” will be posted on our web site, www.fmc-ag.com on the Investor Relations page under
“Corporate Governance/Declaration of Compliance” together with our declarations for prior years.
Some of the German Corporate Governance Code’s recommendations address the independence and
qualifications of supervisory board members. Specifically, the German Corporate Governance Code
recommends that the supervisory board should specify concrete objectives regarding its composition which -inter
alia- shall also take into account potential conflicts of interest and what the Supervisory Board considers as an

136
adequate number of independent members. Similarly, if a substantial and not merely temporary conflict of
interest arises during the term of a member of the supervisory board, the German Corporate Governance Code
recommends that the term of that member be terminated. The German Corporate Governance Code further
recommends that at any given time not more than two former members of the management board should serve
on the supervisory board. The Company’s Supervisory Board includes three members who also serve on the
supervisory board of the General Partner and who serve on our Audit and Governance Committee and are
independent under SEC Rule 10A-3 and NYSE Rule 303A.06 (the audit committee rules of the SEC and the
NYSE, respectively), and our pooling agreement requires that at least one-third (but not less than two) members
of the General Partner’s supervisory board be “independent” within the meaning of that pooling agreement. See
Item 6A, “Directors, Senior Management and Employees – Directors and Senior Management – the General
Partner’s Supervisory Board” and “Description of the Pooling Arrangements:” above. Any supervisory board
must be composed of members who have the required knowledge, abilities and expert experience to properly
complete their tasks.
Recommendations of the German Corporate Governance Code with which we do not currently comply are
the requirement to agree severance payment caps with specified limits in contracts with the members of the
Management Board to cap the amount of compensation for the Management Board, both overall and for variable
compensation components, and to present the compensation for each individual member of the Management
Board in the compensation report for fiscal years starting after December 31, 2013 by using corresponding
model tables. Additionally the recommendations of the German Corporate Governance Code regarding
specification of concrete objectives in terms of composition of the Supervisory Board (taking into account the
international activities of the enterprise, potential conflicts of interest, Supervisory Board age limits, what the
Supervisory Board considers as an adequate number of independent members and diversity (including
stipulation of an appropriate degree of female representation)), which shall be published and taken into account
in recommendations made by the Supervisory Board to the competent election bodies have not been met and will
not be met. The Company’s deviations from the recommendations of the German Corporate Governance Code
are reviewed annually in preparation for the publication of the current year’s Declaration of Compliance.
Furthermore, the status of the implementation of specified objections shall be annually published in the
Corporate Governance Report. These recommendations are not adhered to. The employment contracts with the
members of the Management Board do not contain severance payment arrangements for the case of premature
termination of the contract and consequentially do not contain a limitation on any severance payment amount.
Uniform severance payment arrangements of this kind would contradict the concept practiced by FMC-AG &
Co. KGaA in accordance with the German Stock Corporation Act according to which employment contracts of
the members of the Management Board are, in principle, concluded for the period of their appointment. They
would also not allow for well-balanced assessment in an individual case. The service agreements also do not
provide for caps regarding specific amounts for all compensation components and accordingly not for caps
regarding specific amounts for the overall compensation. Introducing caps regarding specific amounts in relation
to stock-based compensation elements would contradict the basic idea of the members of the Management Board
participating appropriately in the economic opportunities and risks of the Company. Instead, FMC-AG & Co.
KGaA pursues a flexible concept considering each individual case. Since FMC-AG & Co. KGaA does not
provide for caps regarding specific amounts for all compensation elements and, therefore, does not provide for
caps regarding specific amounts for the overall compensation, the compensation report cannot meet all
recommendations of the Code in the future and in particular cannot use the corresponding model tables. We
further believe that as composition of the Supervisory Board needs to be aligned to the enterprise’s interest and
has to ensure the effective supervision and consultation of the Management Board it is a matter of principle and
of prime importance that each member is suitably qualified. Therefore, when discussing its recommendations to
the competent election bodies, the Supervisory Board will take into account the international activities of the
enterprise, potential conflicts of interest, what the Supervisory Board consider as an adequate number of
independent directors and diversity. This includes the aim to establish an appropriate female representation on a
long-term basis. However, as we believe it to be in the enterprise’s interest not to limit the selection of qualified
candidates in a general way, the Supervisory Board confines itself to a general declaration of intent and
particularly refrains from fixed diversity quotas and from an age limit. The next regular elections of the
Supervisory Board will take place in the year 2016. Therefore, as a practical matter, a report on implementation
of the general declaration of intent cannot be made until then.
As noted in the Introduction, as a company listed on the NYSE, we are required to maintain an audit
committee in accordance with Rule 10A-3 under the Exchange Act. The NYSE’s listing standards applicable to
U.S. domestic listed companies require that such companies also maintain a nominating committee to select
nominees to the board of directors and a compensation committee, each consisting solely of directors who are
“independent” as defined in the NYSE’s governance rules.
In contrast to U.S. practice, with one exception, German corporate law does not mandate the creation of
specific supervisory board committees, independent or otherwise. In certain cases, German corporations are

137
required to establish what is called a mediation committee with a charter to resolve any disputes among the
members of the supervisory board that may arise in connection with the appointment or dismissal of members of
the management board. The German Stock Corporation Act provides that the supervisory board may establish,
and the German Corporate Governance Code recommends that a supervisory board establish an audit committee
to handle the formal engagement of the company’s independent auditors once they have been approved by the
general meeting of shareholders. Under the German Corporate Governance Code, the audit committee would
also handle inter alia the monitoring of the accounting process, the effectiveness of the internal control system,
the audit of the annual financial statements, here, in particular, the independence of the auditor, the services
rendered additionally by the auditor, the issuing of the audit mandate to the auditor, the determination of auditing
focal points and the fee arrangement, and – unless another committee is entrusted therewith – compliance. Under
the Stock Corporation Act, an audit committee should supervise the effectiveness of the internal control system,
the risk management system and the internal audit function. Our Audit and Corporate Governance Committee
within the Supervisory Board functions in each of these areas and also serves as our audit committee as required
by Rule 10A-3 under the Exchange Act and the NYSE rules. As sole shareholder of our General Partner,
Fresenius SE elects the supervisory board of our general partner (subject to the requirements of our pooling
agreement discussed above).
In practice, the supervisory boards of many German companies have also constituted other committees to
facilitate the work of the supervisory board. For example, a presidential committee is frequently constituted to
deal with executive compensation and nomination issues as well as service agreements with members of the
supervisory board. SEC Rule 10C-1, adopted pursuant to the Dodd-Frank Act, requires that national securities
exchanges revise their listing rules to prohibit the listing of the equity securities of a company that does not
maintain a compensation committee consisting solely of independent directors, with independence to be
determined considering all relevant factors. The NYSE has amended its compensation committee rule to
implement SEC Rule 10C-1 and, under those amendments, foreign private issuers, we continue to be exempt
from all requirements to maintain an independent compensation committee. At the present time, we do not
maintain a compensation committee and these functions are carried out by our General Partner’s supervisory
board, as a whole assisted, with respect to compensation matters, by its Human Resources Committee. See
“Directors, Senior Management and Employees – Compensation – Compensation of the Management Board”
and “Directors – Senior Management and Employees – Board Committees.” We have also established a
nomination committee and we have established a joint committee (the “Joint Committee”) (gemeinsamer
Ausschuss) together with Management AG, of the supervisory boards of Management AG and FMC-AG & Co.
KGaA consisting of two members designated by each supervisory board to advise and decide on certain
extraordinary management measures.
For information regarding the members of our Audit and Corporate Governance Committee as well as the
functions of the Audit and Corporate Governance Committee, the Joint Committee, the Nominating Committee,
and our General Partner’s Regulatory and Reimbursement Assessment Committee, see Item 6.C, “Directors,
Senior Management and Employees – Board Practices.”
PART III
Item 17. Financial Statements
Not applicable. See "Item 18. Financial Statements."
Item 18. Financial Statements
The information called for by this item commences on Page F-1.
Item 19. Exhibits
Pursuant to the provisions of the Instructions for the filings of Exhibits to Annual Reports on Form 20-F,
Fresenius Medical Care AG & Co. KGaA (the “Registrant”) is filing the following exhibits
1.1 Articles of Association (Satzung) of the Registrant (filed herewith).

138
2.1 Amended and Restated Deposit Agreement dated as of February 26, 2007 between The Bank
of New York (now The Bank of New York Mellon) and the Registrant relating to Ordinary Share ADSs
(incorporated by reference to Exhibit 1 to the Registrant’s Registration Statement on Form F-6, Registration
No. 333-140664, filed February 13, 2007).
2.2 Amendment to the form of American Depositary Receipt for American Depositary Shares
representing Ordinary Shares (incorporated by reference to the amended prospectus filed May 16, 2013).
2.3 Pooling Agreement dated February 13, 2006 by and between Fresenius AG, Fresenius Medical
Care Management AG and the individuals acting from time to time as Independent Directors. (incorporated by
reference to Exhibit 2.3 to the Registrant’s Annual Report on Form 20-F for the year ended December 31, 2005,
filed March 2, 2006).
2.4 Indenture dated as of July 2, 2007 by and among FMC Finance III S.A., the Registrant and the
other Guarantors party thereto and U.S. Bank National Association, as Trustee, related to the 6 7/8% Senior
Notes due 2017 of FMC Finance III S.A. (incorporated by reference to Exhibit 4.3 to the Registrant’s Report on
Form 6-K for the month of August 2007, furnished August 2, 2007).
2.5 Form of Note Guarantee for 6 7/8% Senior Notes due 2017 (Included in Exhibit 2.4)
(incorporated by reference to Exhibit 4.3 to the Registrant’s Report on Form 6-K for the month of August 2007,
furnished August 2, 2007).
2.6 Supplemental Indenture dated as of June 20, 2011 to Indenture dated as of July 2, 2007
(incorporated by reference to Exhibit 10.4 to the Registrant’s Report on Form 6-K for the month of August 2011,
furnished August 2, 2011).
2.7 Indenture dated as of January 20, 2010 by and among FMC Finance VI S.A., the Registrant
and the other Guarantors party thereto and U.S. Bank National Association, as Trustee, and Deutsche Bank
Aktiengesellschaft, as Paying Agent, related to the 5.50% Senior Notes due 2016 of FMC Finance VI S.A.
(incorporated by reference to Exhibit 10.1 to the Registrant’s Report on Form 6-K for the month of May 2010,
furnished May 5, 2010).
2.8 Form of Note Guarantee for 5.50% Senior Notes due 2016 (Included in Exhibit 2.8)
(incorporated by reference to Exhibit 10.2 to the Registrant’s Report on Form 6-K for the month of May 2010,
furnished May 5, 2010).
2.9 Indenture (Euro denominated) dated as of February 2, 2011 by and among FMC Finance VII
S.A., the Registrant and the other Guarantors party thereto and U.S. Bank National Association, as Trustee, and
Deutsche Bank Aktiengesellschaft, as Paying Agent, related to the 5.25% Senior Notes due 2021 of FMC
Finance VII S.A. (incorporated by reference to Exhibit 2.20 to the Registrant’s Annual Report on Form 20-F for
the year ended December 31, 2010, filed February 23, 2011).
2.10 Form of Note Guarantee for 5.25% Senior Notes due 2021 (included in Exhibit 2.9)
(incorporated by reference to Exhibit 2.21 to the Registrant’s Annual Report on Form 20-F for the year ended
December 31, 2010, filed February 23, 2011).
2.11 Indenture (Dollar denominated) dated as of February 2, 2011 by and among Fresenius Medical
Care US Finance, Inc., the Registrant and the other Guarantors party thereto and U.S. Bank National
Association, as Trustee, related to the 5.75% Senior Notes due 2021 of Fresenius Medical Care US Finance, Inc.
(incorporated by reference to Exhibit 2.22 to the Registrant’s Annual Report on Form 20-F for the year ended
December 31, 2010, filed February 23, 2011).
2.12 Form of Note Guarantee for 5.75% Senior Notes due 2021 (included in Exhibit 2.11)
(incorporated by reference to Exhibit 2.23 to the Registrant’s Annual Report on Form 20-F for the year ended
December 31, 2010, filed February 23, 2011).
2.13 Indenture (Euro-denominated) dated as of September 14, 2011 by and among FMC Finance
VIII S.A., the Registrant and the other Guarantors party thereto and U.S. Bank National Association, as Trustee,
and Deutsche Bank Aktiengesellschaft, as Paying Agent, related to the 6.50% Euro-denominated Senior Notes
due 2018 of FMC Finance VIII S.A. (incorporated by reference to Exhibit 10.1 to the Registrant’s Report on
Form 6-K for the month of November 2011, furnished November 3, 2011).

139
2.14 Form of Note Guarantee for 6.50% Euro-denominated Senior Notes due 2018 (included in
Exhibit 2.25) (incorporated by reference to Exhibit 10.1 to the Registrant’s Report on Form 6-K for the month of
November 2011, furnished November 3, 2011).
2.15 Indenture (Dollar-denominated) dated as of September 14, 2011 by and among Fresenius
Medical Care US Finance II, Inc., the Registrant and the other Guarantors party thereto and U.S. Bank National
Association, as Trustee, related to the 6.50% Dollar-denominated Senior Notes due 2018 of Fresenius Medical
Care US Finance II, Inc. (incorporated by reference to Exhibit 10.2 to the Registrant’s Report on Form 6-K for
the month of November 2011, furnished November 3, 2011).
2.16 Form of Note Guarantee for 6.50% Dollar-denominated Senior Notes due 2018 (included in
Exhibit 2.15) (incorporated by reference to Exhibit 10.2 to the Registrant’s Report on Form 6-K for the month of
November 2011, furnished November 3, 2011).
2.17 Indenture dated as of October 17, 2011 by and among FMC Finance VIII S.A., the Registrant
and the other Guarantors party thereto and U.S. Bank National Association, as Trustee, and Deutsche Bank
Aktiengesellschaft, as Paying Agent, related to the Floating Rate Senior Notes due 2016 of FMC Finance VIII
S.A. (incorporated by reference to Exhibit 10.3 to the Registrant’s Report on Form 6-K for the month of
November 2011, furnished November 3, 2011).
2.18 Form of Note Guarantee for Floating Rate Senior Notes due 2016 (included in Exhibit 2.17)
(incorporated by reference to Exhibit 10.2 to the Registrant’s Report on Form 6-K for the month of November
2011, furnished November 3, 2011).
2.19 Indenture (Dollar-denominated) dated as of January 26, 2012 by and among Fresenius Medical
Care US Finance II, Inc., the Registrant and the other Guarantors party thereto and U.S. Bank National
Association, as Trustee, related to the 5 5/8% Senior Notes due 2019 of Fresenius Medical Care US Finance II,
Inc. (incorporated by reference to Exhibit 2.19 to the Registrant’s Annual Report on Form 20-F for the year
ended December 31, 2011, filed February 23, 2012).
2.20 Form of Note Guarantee for 5 5/8% Senior Notes due 2019 (included in Exhibit 2.19)
(incorporated by reference to Exhibit 2.20 to the Registrant’s Annual Report on Form 20-F for the year ended
December 31, 2011, filed February 23, 2012).
2.21 Indenture (Dollar-denominated) dated as of January 26, 2012 by and among Fresenius Medical
Care US Finance II, Inc., the Registrant and the other Guarantors party thereto and U.S. Bank National
Association, as Trustee, related to the 5 7/8% Senior Notes due 2022 of Fresenius Medical Care US Finance II,
Inc. (incorporated by reference to Exhibit 2.21 to the Registrant’s Annual Report on Form 20-F for the year
ended December 31, 2011, filed February 23, 2012).
2.22 Form of Note Guarantee for 5 7/8% Senior Notes due 2022 (included in Exhibit 2.21)
(incorporated by reference to Exhibit 2.22 to the Registrant’s Annual Report on Form 20-F for the year ended
December 31, 2011, filed February 23, 2012).
2.23 Indenture (Euro-denominated) dated as of January 26, 2012 by and among FMC Finance VIII
S.A., the Registrant and the other Guarantors party thereto and U.S. Bank National Association, as Trustee, and
Deutsche Bank Aktiengesellschaft, as Paying Agent, related to the 5.25% Euro-denominated Senior Notes due
2019 of FMC Finance VIII S.A. (incorporated by reference to Exhibit 2.23 to the Registrant’s Annual Report on
Form 20-F for the year ended December 31, 2011, filed February 23, 2012).
2.24 Form of Note Guarantee for 5.25% Euro-denominated Senior Notes due 2019 (included in
Exhibit 2.23) (incorporated by reference to Exhibit 2.24 to the Registrant’s Annual Report on Form 20-F for the
year ended December 31, 2011, filed February 23, 2012).
2.25 Credit Agreement dated as of October 30, 2012 among the Registrant, Fresenius Medical Care
Holdings, Inc., and certain subsidiaries of the Registrant as borrowers and guarantors, Bank of America N.A., as
administrative agent, Deutsche Bank AG New York Branch, as sole syndication agent, Commerzbank AG, New
York Branch, JPMorgan Chase Bank, National Association, The Bank of Nova Scotia, Suntrust Bank, Unicredit
Bank AG, New York Branch, and Wells Fargo Bank, National Association, as co-documentation agents, and the
lenders named therein (incorporated by reference to Exhibit 2.25 to the Registrant’s Annual Report on Form 20-
F for the year ended December 31, 2012, filed February 26, 2013).

140
2.26 Sixth Amended and Restated Transfer and Administration Agreement dated as of January 17,
2013 by and among NMC Funding Corporation, as Transferor, National Medical Care, Inc., as initial collection
agent, Liberty Street Funding LLC, and other conduit investors party thereto, the financial institutions party
thereto, The Bank of Tokyo-Mitsubishi UFJ, Ltd., New York Branch, Barclays Bank PLC, Credit Agricole
Corporate and Investment Bank, New York, PNC Bank, National Association, Royal Bank of Canada, as
administrative agents, and The Bank of Nova Scotia, as an administrative agent and as agent (incorporated by
reference to Exhibit 2.35 to the Registrant’s Annual Report on Form 20-F for the year ended December 31, 2012,
filed February 26, 2013).
2.27 Second Amended and Restated Receivables Purchase Agreement dated January 17, 2013
between National Medical Care, Inc. and NMC Funding Corporation (incorporated by reference to Exhibit 2.39
to the Registrant’s Annual Report on Form 20-F for the year ended December 31, 2012, filed February 26,
2013).
4.1 Agreement and Plan of Reorganization dated as of February 4, 1996 between W.R. Grace &
Co. and Fresenius AG. (incorporated by reference to Appendix A to the Joint Proxy Statement-Prospectus of
FMC-AG, W.R. Grace & Co. and Fresenius USA, Inc., dated August 2, 1996).
4.2 Distribution Agreement dated as of February 4, 1996 by and among W.R. Grace & Co., W.R.,
Grace & Co. — Conn. and Fresenius AG (incorporated by reference to Appendix A to the Joint Proxy
Statement-Prospectus of FMC-AG, W.R. Grace & Co. and Fresenius USA, Inc., dated August 2, 1996).
4.3 Contribution Agreement dated as of February 4, 1996 by and among Fresenius AG,
Sterilpharma GmbH and W.R. Grace & Co. — Conn. (incorporated by reference to Appendix E to the Joint
Proxy Statement-Prospectus of FMC-AG, W.R. Grace & Co. and Fresenius USA, Inc., dated August 2, 1996).
4.4 Renewed Post-Closing Covenants Agreement effective January 1, 2007 between Fresenius AG
and Registrant (incorporated by reference to Exhibit 4.4 to the Registrant’s Amended Annual Report on Form
20-F/A for the year ended December 31, 2006, filed February 26, 2007).
4.5 Lease Agreement for Office Buildings dated September 30, 1996 by and between Fresenius
AG and Fresenius Medical Care Deutschland GmbH. (Incorporated by reference to Exhibit 10.3 to the
Registration Statement on Form F-1 of FMC-AG, Registration No. 333-05922, filed November 18, 1996).
4.6 Amendment for Lease Agreement for Office Buildings dated December 19, 2006 by and
between Fresenius AG and Fresenius Medical Care Deutschland GmbH (incorporated by reference to Exhibit 4.5
to the Registrant’s Amended Annual Report on Form 20-F/A for the year ended December 31, 2006, filed
February 26, 2007).
4.7 Lease Agreement for Manufacturing Facilities dated September 30, 1996 by and between
Fresenius Immobilien-Verwaltungs-GmbH & Co. Objekt Schweinfurt KG and Fresenius Medical Care
Deutschland GmbH (incorporated by reference to Exhibit 10.4.1 to the Registration Statement on Form F-1 of
FMC-AG, Registration No. 333-05922, filed November 16, 1996).
4.8 Amendment for Lease Agreement for Manufacturing Facilities dated December 19, 2006 by
and between Fresenius Immobilien-Verwaltungs-GmbH & Co. Objekt Schweinfurt KG and Fresenius Medical
Care Deutschland GmbH (incorporated by reference to Exhibit 4.6 to the Registrant’s Amended Annual Report
on Form 20-F/A for the year ended December 31, 2006, filed on February 26, 2007).
4.9 English Convenience translation of Amendment for Lease Agreement for Manufacturing
Facilities dated February 8, 2011 by and between Fresenius Immobilien-Verwaltungs-GmbH & Co. Objekt
Schweinfurt KG and Fresenius Medical Care Deutschland GmbH (incorporated by reference to Exhibit 4.9 to the
Registrant’s Annual Report on Form 20-F for the year ended December 31, 2012, filed February 26, 2013).
4.10 Schweinfurt facility rental agreement between Fresenius Immobilien-Verwaltungs-GmbH &
Co, Objekt Schweinfurt KG, as Lessor, and Fresenius Medical Care Deutschland GmbH, as Lessee, dated
February 6, 2008 and effective October 1, 2007, supplementing the Principal Lease dated December 18, 2006
(incorporated by reference to Exhibit 10.1 to the Report of Form 6-K for the month of April 2008, furnished
April 30, 2008).
4.11 Lease Agreement for Manufacturing Facilities dated September, 1996 by and between
Fresenius Immobilien-Verwaltungs-GmbH & Co. Objekt St. Wendel KG and Fresenius Medical Care

141
Deutschland GmbH (incorporated by reference to Exhibit 10.4.2 to the Registration Statement on Form F-1 of
FMC-AG, Registration No. 333-05922, filed November 16, 1996).
4.12 Lease Agreement for Manufacturing Facilities dated September 30, 1996 by and between
Fresenius AG and Fresenius Medical Care Deutschland GmbH (Ober-Erlenbach) (incorporated by reference to
Exhibit 10.5 to the Registration Statement on Form F-1 of FMC-AG, Registration No. 333-05922, filed
November 18, 1996).
4.13 Amendment for Lease Agreement for Manufacturing Facilities dated December 19, 2006 by
and between Fresenius Immobilien-Verwaltungs-GmbH & Co. Objekt St. Wendel KG and Fresenius Medical
Care Deutschland GmbH (incorporated by reference to Exhibit 4.7 to the Registrant’s Amended Annual Report
on Form 20-F/A for the year ended December 31, 2006 filed on February 26, 2007).
4.14 English Convenience translation of Amendment for Lease Agreement for Manufacturing
Facilities dated February 8, 2011, by and between Fresenius Immobilien-Verwaltungs-GmbH & Co. Objekt St.
Wendel KG and Fresenius Medical Care Deutschland GmbH (incorporated by reference to Exhibit 4.14 to the
Registrant’s Annual Report on Form 20-F for the year ended December 31, 2012, filed February 26, 2013).
4.15 Amendment for Lease Agreement for Manufacturing Facilities dated December 19, 2006 by
and between Fresenius AG and Fresenius Medical Care Deutschland GmbH (Ober-Erlenbach) (incorporated by
reference to Exhibit 4.8 to the Registrant’s Amended Annual Report on Form 20-F/A for the year ended
December 31, 2006 filed on February 26, 2007).
4.16 Trademark License Agreement dated September 27, 1996 by and between Fresenius AG and
FMC-AG. (Incorporated by reference to Exhibit 10.8 to FMC-AG’s Registration Statement on Form F-1,
Registration No. 333-05922, filed November 16, 1996).
4.17 Technology License Agreement (Biofine) dated September 27, 1996 by and between Fresenius
AG and FMC-AG (incorporated by reference to Exhibit 10.9 to the Registration Statement on Form F-1 of FMC-
AG, Registration No. 333-05922, filed November 16, 1996).
4.18 Cross-License Agreement dated September 27, 1996 by and between Fresenius AG and FMC-
AG (incorporated by reference to Exhibit 10.10 to the Registration Statement on Form F-1 of FMC-AG,
Registration No. 333-05922, filed November 16, 1996).
4.19 Lease Agreement for Office Buildings dated September 30, 1996 by and between Fresenius
AG and Fresenius Medical Care Deutschland GmbH (Daimler Str.) (incorporated by reference to Exhibit 2.8 to
the Annual Report on Form 20-F of FMC-AG for the year ended December 31, 1996, filed April 7, 1997).
4.20 Amendment for Lease Agreement for Office Buildings dated December 19, 2006 by and
between Fresenius AG and Fresenius Medical Care Deutschland GmbH (Daimler Str.) (incorporated by
reference to Exhibit 4.12 to the Registrant’s Amended Annual Report on Form 20-F/A for the year ended
December 31, 2006, filed on February 26, 2007).
4.21 FMC-AG 1998 Stock Incentive Plan adopted effective as of April 6, 1998 (incorporated by
reference to Exhibit 4.8 to the Report on Form 6-K of FMC-AG for the month of May 1998, furnished May 14,
1998).
4.22 FMC-AG Stock Option Plan of June 10, 1998 (for non-North American employees)
(incorporated by reference to Exhibit 1.2 to the Annual Report on Form 20-F of FMC-AG, for the year ended
December 31, 1998, filed March 24, 1999).
4.23 Fresenius Medical Care Aktiengesellschaft 2001 International Stock Incentive Plan
(incorporated by reference to Exhibit 10.17 to the Registration Statement on Form F-4 of FMC-AG et al,
Registration No. 333-66558, filed August 2, 2001).
4.24 Stock Option Plan 2006 of Fresenius Medical Care AG & Co. KGaA (incorporated by
reference to Exhibit 10.2 to the Registrant’s Amended Report on Form 6-K/A for the month of August 2006,
furnished August 11, 2006).

142
4.25 English convenience translation of the Stock Option Plan 2011 of Fresenius Medical Care AG
& Co. KGaA (incorporated by reference to Exhibit 10.2 to the Registrant’s Report on Form 6-K for the month of
August 2011, furnished August 2, 2011).
4.26 English convenience translation of the Phantom Stock Plan 2011 of Fresenius Medical Care
AG & Co. KGaA (incorporated by reference to Exhibit 10.5 to the Registrant’s Report on Form 6-K for the
month of August 2011, furnished August 2, 2011).
4.27 Amended and Restated Subordinated Loan Note dated as of March 31, 2006, among National
Medical Care, Inc. and certain of its subsidiaries as Borrowers and Fresenius AG as Lender (incorporated herein
by reference to Exhibit 4.3 to the Registrant’s Report on Form 6-K for the month of May 2006, furnished May
17, 2006). (1)
4.28 Allonge dated September 29, 2010 to Amended and Restated Subordinated Loan Note dated as
of March 31, 2006 (incorporated by reference to Exhibit 10.5 to the Registrant’s Amended Report on Form 6-
K/A for the month of November 2010, furnished April 8, 2011).(1)
4.29 Agreement and Plan of Merger by and among Bio-Medical Applications Management
Company, Inc., PB Merger Sub, Inc., Liberty Dialysis Holdings, Inc., certain stockholders of Liberty Dialysis
Holdings, Inc., LD Stockholder Representative, LLC, and Fresenius Medical Care Holdings, Inc. dated as of
August 1, 2011(incorporated by reference to Exhibit 10.5 to the Registrant’s Report of Form 6 K for the month
of November 2011, furnished November 3, 2011). (1)
4.30 Dialysis Organization Agreement effective January 1, 2012 by and among Amgen Inc., Amgen
USA Inc., and Fresenius Medical Care Holdings Inc. (incorporated by reference to Exhibit 4.32 to the
Registrant’s Annual Report on Form 20-F for the year ended December 31, 2011, filed February 23, 2012) (1)
4.31 General Agreement 2013 (mainly related to information technology services) dated May 8,
2013 by and between FMC-AG and Fresenius Netcare GmbH. (incorporated by reference to Exhibit 4.32 to the
Registrant’s Report on Form 6-K for the month of July 2013, filed July 30, 2013).
8.1 List of Significant Subsidiaries. Our significant subsidiaries are identified in “Item 4.C.
Information on the Company — Organizational Structure.”
11.1 Code of Business Conduct. A copy of the Registrant’s Code of Business Conduct is available
on the Registrant’s web site at: http://www.fmc-ag.com/Code_of_Conduct.htm.
12.1 Certification of Chief Executive Officer of the general partner of the Registrant Pursuant to
Section 302 of the Sarbanes-Oxley Act of 2002 (filed herewith).
12.2 Certification of Chief Financial Officer of the general partner of the Registrant Pursuant to
Section 302 of the Sarbanes-Oxley Act of 2002 (filed herewith).
13.1 Certification of Chief Executive Officer and Chief Financial Officer of the general partner of
the Registrant Pursuant to 18 U.S.C. Section 1350, as Adopted Pursuant to Section 906 of the Sarbanes-Oxley
Act of 2002 (furnished herewith). (This Exhibit is furnished herewith, but not deemed “filed” for purposes of
Section 18 of the Securities Exchange Act of 1934, as amended, or otherwise subject to liability under that
section. Such certification will not be deemed to be incorporated by reference into any filing under the Securities
Act or the Exchange Act, except to the extent that we explicitly incorporate it by reference.)
14.1 Consent of KPMG, independent registered public accounting firm (filed herewith).
101 The following financial statements as of and for the twelve-month period ended December 31,
2011 from the Company’s Annual Report on Form 20-F for the month of February 2012, formatted in XBRL
(eXtensible Business Reporting Language): (i) Consolidated Statements of Income, (ii) Consolidated Statements
of Comprehensive Income, (iii) Consolidated Balance Sheets, (iv) Consolidated Statements of Cash Flows, (v)
Consolidated Statements of Shareholders’ Equity and (vi) Notes to Consolidated Financial Statements. (filed
herewith).
___________
(1) Confidential treatment has been granted as to certain portions of this document in accordance with the applicable
rules of the Securities and Exchange Commission.

143
SIGNATURES
Pursuant to the requirements of the Securities Exchange Act of 1934, the Registrant has duly caused this
report to be signed on its behalf by the undersigned thereunto duly authorized.
DATE: February 25, 2014
FRESENIUS MEDICAL CARE AG & Co. KGaA
a partnership limited by shares, represented by:
FRESENIUS MEDICAL CARE MANAGEMENT AG,
its general partner
By: /s/ RICE POWELL
Name: Rice Powell
Title: Chief Executive Officer and
Chairman of the Management Board of the
General Partner
By: /s/ MICHAEL BROSNAN
Name: Michael Brosnan
Title: Chief Financial Officer and
member of the Management Board of the
General Partner

F-1
INDEX OF FINANCIAL STATEMENTS
Audited Consolidated Financial Statements
Management’s Annual Report on Internal Control over Financial Reporting ........................................................... F-2
Report of Independent Registered Public Accounting Firm ...................................................................................... F-3
Report of Independent Registered Public Accounting Firm
on Internal Control over Financial Reporting ............................................................................................................ F-4
Consolidated Statements of Income for the years ended December 31, 2013, 2012 and 2011 .................................. F-5
Consolidated Statements of Comprehensive Income for the years ended December 31, 2013, 2012 and 2011 ........ F-6
Consolidated Balance Sheets as of December 31, 2013 and 2012 ............................................................................. F-7
Consolidated Statements of Cash Flows for the years ended December 31, 2013, 2012 and 2011 ........................... F-8
Consolidated Statements of Shareholders' Equity for the years ended December 31, 2013, 2012 and 2011 ............. F-9
Notes to Consolidated Financial Statements .............................................................................................................. F-10
Financial Statement Schedule .................................................................................................................................... S-II

F-2
MANAGEMENT’S ANNUAL REPORT ON INTERNAL CONTROL OVER FINANCIAL REPORTING
Management of the Company is responsible for establishing and maintaining adequate internal control over
financial reporting, as such term is defined in Exchange Act Rule 13a-15(f). The Company’s internal control
over financial reporting is a process designed by or under the supervision of the Company’s chief executive
officer and chief financial officer to provide reasonable assurance regarding the reliability of financial reporting
and the preparation of the Company’s financial statements for external reporting purposes in accordance with
U.S. generally accepted accounting principles.
As of December 31, 2013, management conducted an assessment of the effectiveness of the Company’s
internal control over financial reporting based on the criteria established in Internal Control–Integrated
Framework (1992) issued by the Committee of Sponsoring Organizations of the Treadway Commission
(COSO). Management’s assessment follows the guidance for management of the evaluation of internal controls
over financial reporting released by the Securities and Exchange Commission on May 23, 2007. Based on this
assessment, management has determined that the Company’s internal control over financial reporting is effective
as of December 31, 2013.
The Company’s internal control over financial reporting includes policies and procedures that (1) pertain to
the maintenance of records that in reasonable detail accurately and fairly reflect transactions and dispositions of
assets; (2) provide reasonable assurance that the Company’s transactions are recorded as necessary to permit
preparation of financial statements in accordance with U.S. generally accepted accounting principles, and that
the Company’s receipts and expenditures are being made only in accordance with authorizations of the
Company’s management and directors; and (3) provide reasonable assurance regarding prevention or timely
detection of unauthorized acquisition, use or disposition of the Company’s assets that could have a material
effect on the Company’s financial statements.
Because of its inherent limitation, internal control over financial reporting, no matter how well designed,
cannot provide absolute assurance of achieving financial reporting objectives and may not prevent or detect
misstatements. Therefore, even if the internal control over financial reporting is determined to be effective it can
provide only reasonable assurance with respect to financial statement preparation and presentation. Also,
projections of any evaluation of effectiveness to future periods are subject to the risk that controls may become
inadequate because of changes in conditions, or that the degree of compliance with the policies or procedures
may deteriorate.
The Company’s internal control over financial reporting as of December 31, 2013 has been audited by
KPMG AG Wirtschaftsprüfungsgesellschaft, an independent registered public accounting firm, as stated in their
report included on page F-4.
Date: February 25, 2014 FRESENIUS MEDICAL CARE AG & CO. KGaA,
a partnership limited by shares, represented by:
FRESENIUS MEDICAL CARE MANAGEMENT AG, its
General Partner
By: /s/ RICE POWELL
Name: Rice Powell
Title: Chief Executive Officer and Chairman
of the Management Board of the
General Partner
By: /s/ MICHAEL BROSNAN
Name: Michael Brosnan
Title: Chief Financial Officer and member
of the Management Board of the
General Partner

F-3
REPORT OF INDEPENDENT REGISTERED PUBLIC ACCOUNTING FIRM
The Supervisory Board
Fresenius Medical Care AG & Co. KGaA:
We have audited the accompanying consolidated balance sheets of Fresenius Medical Care AG & Co.
KGaA and subsidiaries (“Fresenius Medical Care” or the “Company”) as of December 31, 2013 and 2012 and
the related consolidated statements of income, comprehensive income, shareholders’ equity and cash flows for
each of the years in the three-year period ended December 31, 2013. In connection with our audits of the
consolidated financial statements, we have also audited the financial statement schedule as listed in the
accompanying index. These consolidated financial statements and the financial statement schedule are the
responsibility of the Company’s management. Our responsibility is to express an opinion on these consolidated
financial statements and the financial statement schedule based on our audits.
We conducted our audits in accordance with the standards of the Public Company Accounting Oversight
Board (United States). Those standards require that we plan and perform the audit to obtain reasonable assurance
about whether the financial statements are free of material misstatement. An audit includes examining, on a test
basis, evidence supporting the amounts and disclosures in the financial statements. An audit also includes
assessing the accounting principles used and significant estimates made by management, as well as evaluating
the overall financial statement presentation. We believe that our audits provide a reasonable basis for our
opinion.
In our opinion, the consolidated financial statements referred to above present fairly, in all material respects,
the financial position of Fresenius Medical Care as of December 31, 2013 and 2012, and the results of their
operations and their cash flows for each of the years in the three-year period ended December 31, 2013, in
conformity with U.S. generally accepted accounting principles. Also in our opinion, the related financial
statement schedule, when considered in relation to the consolidated financial statements taken as a whole,
presents fairly, in all material respects, the information set forth therein.
We also have audited, in accordance with the standards of the Public Company Accounting Oversight Board
(United States), Fresenius Medical Care’s internal control over financial reporting as of December 31, 2013,
based on criteria established in Internal Control—Integrated Framework (1992) issued by the Committee of
Sponsoring Organizations of the Treadway Commission (COSO), and our report dated February 25, 2014
expressed an unqualified opinion on the effectiveness of the Company’s internal control over financial reporting.
Frankfurt am Main, Germany
February 25, 2014
/s/ KPMG AG
Wirtschaftsprüfungsgesellschaft

F-4
REPORT OF INDEPENDENT REGISTERED PUBLIC ACCOUNTING FIRM
ON INTERNAL CONTROL OVER FINANCIAL REPORTING
The Supervisory Board
Fresenius Medical Care AG & Co. KGaA:
We have audited the internal control over financial reporting of Fresenius Medical Care AG & Co. KGaA
and subsidiaries (“Fresenius Medical Care” or the “Company”) as of December 31, 2013, based on criteria
established in Internal Control-Integrated Framework (1992) issued by the Committee of Sponsoring
Organizations of the Treadway Commission (COSO). Fresenius Medical Care’s management is responsible for
maintaining effective internal control over financial reporting and its assessment of the effectiveness of internal
control over financial reporting included in the accompanying Management’s Annual Report on Internal Control
over Financial Reporting. Our responsibility is to express an opinion on the Company’s internal control over
financial reporting based on our audit.
We conducted our audit in accordance with the standards of the Public Company Accounting Oversight
Board (United States). Those standards require that we plan and perform the audit to obtain reasonable assurance
about whether effective internal control over financial reporting was maintained in all material respects. Our
audit included obtaining an understanding of internal control over financial reporting, assessing the risk that a
material weakness exists, and testing and evaluating the design and operating effectiveness of internal control
based on the assessed risk. Our audit also included performing such other procedures as we considered necessary
in the circumstances. We believe that our audit provides a reasonable basis for our opinion.
A company's internal control over financial reporting is a process designed to provide reasonable assurance
regarding the reliability of financial reporting and the preparation of financial statements for external purposes in
accordance with generally accepted accounting principles. A company's internal control over financial reporting
includes those policies and procedures that (1) pertain to the maintenance of records that, in reasonable detail,
accurately and fairly reflect the transactions and dispositions of the assets of the company; (2) provide
reasonable assurance that transactions are recorded as necessary to permit preparation of financial statements in
accordance with generally accepted accounting principles, and that receipts and expenditures of the company are
being made only in accordance with authorizations of management and directors of the company; and (3)
provide reasonable assurance regarding prevention or timely detection of unauthorized acquisition, use, or
disposition of the company’s assets that could have a material effect on the financial statements.
Because of its inherent limitations, internal control over financial reporting may not prevent or detect
misstatements. Also, projections of any evaluation of effectiveness to future periods are subject to the risk that
controls may become inadequate because of changes in conditions, or that the degree of compliance with the
policies or procedures may deteriorate.
In our opinion, Fresenius Medical Care maintained, in all material respects, effective internal control over
financial reporting as of December 31, 2013, based on criteria established in Internal Control-Integrated
Framework (1992) issued by the Committee of Sponsoring Organizations of the Treadway Commission
(COSO).
We also have audited, in accordance with the standards of the Public Company Accounting Oversight Board
(United States), the consolidated balance sheets of Fresenius Medical Care as of December 31, 2013 and 2012,
and the related consolidated statements of income, comprehensive income, shareholders’ equity and cash flows
for each of the years in the three-year period ended December 31, 2013, and our report dated February 25, 2014
expressed an unqualified opinion on those consolidated financial statements.
Frankfurt am Main, Germany
February 25, 2014
/s/ KPMG AG
Wirtschaftsprüfungsgesellschaft

FRESENIUS MEDICAL CARE AG & Co. KGaA
Consolidated Statements of Income
For the years ended December 31,
(in thousands, except share data)
F-5
2013 2012 2011
Net revenue:
Dialysis Care $ 11,414,734 $ 10,772,124 $ 9,507,173
Less: Patient service bad debt provision 284,648 280,365 224,545
Net Dialysis Care 11,130,086 10,491,759 9,282,628
Dialysis Products 3,479,641 3,308,523 3,287,887
14,609,727 13,800,282 12,570,515
Costs of revenue:
Dialysis Care 8,266,635 7,649,514 6,861,197
Dialysis Products 1,604,695 1,549,515 1,557,277
9,871,330 9,199,029 8,418,474
Gross profit 4,738,397 4,601,253 4,152,041
Operating (income) expenses:
Selling, general and administrative 2,391,927 2,224,715 2,001,825
Gain on sale of dialysis clinics (9,426) (36,224) (4,551)
Research and development 125,805 111,631 110,834
Income from equity method investees (26,105) (17,442) (30,959)
Other operating expenses - 100,000 -
Operating income 2,256,196 2,218,573 2,074,892
Other (income) expense:
Investment Gain - (139,600) -
Interest income (38,942) (44,474) (59,825)
Interest expense 447,503 470,534 356,358
Income before income taxes 1,847,635 1,932,113 1,778,359
Income tax expense 592,012 605,136 601,097
Net income 1,255,623 1,326,977 1,177,262
Less: Net income attributable to noncontrolling interests 145,733 140,168 106,108
Net income attributable to shareholders of FMC - AG & Co.
KGaA $ 1,109,890 $ 1,186,809 $ 1,071,154
Basic earnings per share $ 3.65 $ 3.89 $ 3.54
Fully diluted earnings per share $ 3.65 $ 3.87 $ 3.51
See accompanying notes to consolidated financial statements.

FRESENIUS MEDICAL CARE AG & Co. KGaA
Consolidated Statements of Comprehensive Income
For the years ended December 31,
(in thousands, except share data)
F-6
2013 2012 2011
Net Income $ 1,255,623 $ 1,326,977 $ 1,177,262
Gain (loss) related to cash flow hedges 22,532 24,019 (102,446)
Actuarial gains (losses) on defined benefit pension plans 64,989 (103,178) (81,906)
Gain (loss) related to foreign currency translation (114,439) 63,803 (181,234)
Income tax (expense) benefit related to components of other
comprehensive income (33,600) 8,831 72,617
Other comprehensive income (loss), net of tax (60,518) (6,525) (292,969)
Total comprehensive income $ 1,195,105 $ 1,320,452 $ 884,293
Comprehensive income attributable to noncontrolling
interests 143,689 139,989 104,861
Comprehensive income attributable to shareholders of FMC-
AG & Co. KGaA $ 1,051,416 $ 1,180,463 $ 779,432
See accompanying notes to consolidated financial statements.

FRESENIUS MEDICAL CARE AG & Co. KGaA
Consolidated Balance Sheets
(in thousands, except share data)
F-7
December 31, December 31,
2013 2012
Assets
Current assets:
Cash and cash equivalents $ 682,777 $ 688,040
Trade accounts receivable less allowance for doubtful
accounts of $413,165 in 2013 and $328,893 in 2012 3,037,274 3,019,424
Accounts receivable from related parties 153,118 137,809
Inventories 1,097,104 1,036,809
Prepaid expenses and other current assets 1,037,391 977,537
Deferred taxes 279,052 267,837
Total current assets 6,286,716 6,127,456
Property, plant and equipment, net 3,091,954 2,940,603
Intangible assets 757,876 710,116
Goodwill 11,658,187 11,421,889
Deferred taxes 104,167 89,152
Investment in equity method investees 664,446 637,373
Other assets and notes receivables 556,560 399,409
Total assets $ 23,119,906 $ 22,325,998
Liabilities and shareholders' equity
Current liabilities:
Accounts payable $ 542,597 $ 622,294
Accounts payable to related parties 123,929 123,350
Accrued expenses and other current liabilities 2,012,533 1,787,471
Short-term borrowings and other financial liabilities 96,648 117,850
Short-term borrowings from related parties 62,342 3,973
Current portion of long-term debt and capital lease obligations 511,370 334,747
Income tax payable 170,360 150,003
Deferred taxes 34,194 30,303
Total current liabilities 3,553,973 3,169,991
Long-term debt and capital lease obligations, less current portion 7,746,920 7,785,740
Long-term debt from related parties - 56,174
Other liabilities 329,561 260,257
Pension liabilities 435,858 457,673
Income tax payable 176,933 201,642
Deferred taxes 743,390 664,001
Total liabilities 12,986,635 12,595,478
Noncontrolling interests subject to put provisions 648,251 523,260
Shareholders' equity:
Preference shares, no par value, €1.00 nominal value (see Note 14) - 4,462
Ordinary shares, no par value, €1.00 nominal value, 392,462,972 shares authorized, 308,995,730
issued and 301,446,779 outstanding 382,411 374,915
Treasury stock, at cost (505,014) -
Additional paid-in capital 3,530,337 3,491,581
Retained earnings 6,377,417 5,563,661
Accumulated other comprehensive (loss) income (550,587) (492,113)
Total FMC-AG & Co. KGaA shareholders' equity 9,234,564 8,942,506
Noncontrolling interests not subject to put provisions 250,456 264,754
Total equity 9,485,020 9,207,260
Total liabilities and equity $ 23,119,906 $ 22,325,998
See accompanying notes to consolidated financial statements.

FRESENIUS MEDICAL CARE AG & Co. KGaA
Consolidated Statements of Cash Flows
For the years ended December 31,
(in thousands)
F-8
2013 2012 2011
Operating Activities:
Net income $ 1,255,623 $ 1,326,977 $ 1,177,262
Adjustments to reconcile net income to net cash provided by
operating activities:
Depreciation and amortization 648,225 602,896 557,283
Change in deferred taxes, net 15,913 75,170 159,181
(Gain) loss on sale of investments (9,426) (36,224) (7,679)
(Gain) loss on sale of fixed assets (23,558) 6,700 (1,306)
Investment (gain) - (139,600) -
Compensation expense related to stock options 13,593 26,476 29,071
Cash inflow (outflow) from hedging (4,073) (13,947) (58,113)
Investments in equity method investees, net 2,335 22,512 (30,959)
Changes in assets and liabilities, net of amounts from businesses acquired:
Trade accounts receivable, net (41,280) (43,344) (252,794)
Inventories (54,918) (48,279) (151,890)
Prepaid expenses, other current and non-current assets 67,875 88,413 (130,858)
Accounts receivable from related parties (10,968) (25,859) (11,669)
Accounts payable to related parties (3,743) 10,064 (4,495)
Accounts payable, accrued expenses and other current and non-
current liabilities 215,264 225,586 132,406
Income tax payable (36,057) (38,478) 41,042
Net cash provided by (used in) operating activities 2,034,805 2,039,063 1,446,482
Investing Activities:
Purchases of property, plant and equipment (747,938) (675,310) (597,855)
Proceeds from sale of property, plant and equipment 19,847 9,667 27,325
Acquisitions and investments, net of cash acquired, and purchases
of intangible assets (495,725) (1,878,908) (1,785,329)
Proceeds from divestitures 18,276 263,306 9,990
Net cash provided by (used in) investing activities (1,205,540) (2,281,245) (2,345,869)
Financing Activities:
Proceeds from short-term borrowings 381,603 174,391 189,987
Repayments of short-term borrowings (397,682) (163,059) (248,821)
Proceeds from short-term borrowings from related parties 18,593 39,829 146,872
Repayments of short-term borrowings from related parties (18,228) (64,112) (127,015)
Proceeds from long-term debt and capital lease obligations (net of
debt issuance costs and other hedging costs of $178,593 in 2012
and $127,854 in 2011) 441,278 4,750,730 2,706,105
Repayments of long-term debt and capital lease obligations (617,499) (3,589,013) (957,235)
Redemption of trust preferred securities - - (653,760)
Increase (decrease) of accounts receivable securitization program 189,250 (372,500) 24,500
Proceeds from exercise of stock options 111,300 121,126 94,893
Proceeds from conversion of preference shares into ordinary shares 34,784 - -
Purchase of treasury stock (505,014) - -
Dividends paid (296,134) (271,733) (280,649)
Distributions to noncontrolling interests (216,758) (195,023) (129,542)
Contributions from noncontrolling interests 66,467 37,704 27,824
Net cash provided by (used in) financing activities (808,040) 468,340 793,159
Effect of exchange rate changes on cash and cash equivalents (26,488) 4,590 40,650
Cash and Cash Equivalents:
Net increase (decrease) in cash and cash equivalents (5,263) 230,748 (65,578)
Cash and cash equivalents at beginning of period 688,040 457,292 522,870
Cash and cash equivalents at end of period $ 682,777 $ 688,040 $ 457,292
See accompanying notes to consolidated financial statements.

FRESENIUS MEDICAL CARE AG & Co. KGaA Consolidated Statement of Shareholders´ Equity
For the years ended December 31, 2013, 2012 and 2011
(in thousands, except share data)
F-9
Preference Shares Ordinary Shares Treasury Stock Additional
paid in
capital
Retained
earnings
Accumulated
Other
comprehensive
income (loss)
Total
FMC-AG &
Co. KGaA
shareholders'
equity
Noncontrolling
interests not
subject to put
provisions
Total Equity Number of
shares
No par
value
Number of
shares
No par
value
Number of
shares Amount Balance at December 31, 2010 3,957,168 $ 4,440 298,279,001 $ 369,002 - $ - $ 3,339,781 $ 3,858,080 $ (194,045) $ 7,377,258 $ 146,653 $ 7,523,911
Proceeds from exercise of options and related tax
effects 8,523 12 1,885,921 2,647 - - 85,887 - - 88,546 - 88,546
Compensation expense related to stock options - - - - - - 29,071 - - 29,071 - 29,071
Dividends paid - - - - - - - (280,649) - (280,649) - (280,649)
Purchase/ sale of noncontrolling interests - - - - - - (5,873) - - (5,873) 9,662 3,789
Contributions from/ to noncontrolling interests - - - - - - - - - - (59,066) (59,066)
Changes in fair value of noncontrolling interests
subject to put provisions - - - - - - (86,233) - - (86,233) - (86,233)
Net income - - - - - - - 1,071,154 - 1,071,154 63,251 1,134,405
Other comprehensive income (loss) - - - - - - - - (291,722) (291,722) (1,035) (292,757)
Comprehensive income - - - - - - - - - 779,432 62,216 841,648
Balance at December 31, 2011 3,965,691 $ 4,452 300,164,922 $ 371,649 - $ - $ 3,362,633 $ 4,648,585 $ (485,767) $ 7,901,552 $ 159,465 $ 8,061,017
Proceeds from exercise of options and related tax
effects 7,642 10 2,574,836 3,266 - - 110,510 - - 113,786 - 113,786
Compensation expense related to stock options - - - - - - 26,476 - - 26,476 - 26,476
Dividends paid - - - - - - - (271,733) - (271,733) - (271,733)
Purchase/ sale of noncontrolling interests - - - - - - (26,918) - - (26,918) 86,705 59,787
Contributions from/ to noncontrolling interests - - - - - - - - - - (26,428) (26,428)
Changes in fair value of noncontrolling interests
subject to put provisions - - - - - - 18,880 - - 18,880 - 18,880
Net income - - - - - - - 1,186,809 - 1,186,809 45,450 1,232,259
Other comprehensive income (loss) - - - - - - - - (6,346) (6,346) (438) (6,784)
Comprehensive income - - - - - - - - - 1,180,463 45,012 1,225,475
Balance at December 31, 2012 3,973,333 $ 4,462 302,739,758 $ 374,915 - $ - $ 3,491,581 $ 5,563,661 $ (492,113) $ 8,942,506 $ 264,754 $ 9,207,260
Proceeds from exercise of options and related tax
effects 2,200 3 2,280,439 3,031 - - 102,520 - - 105,554 - 105,554
Proceeds from conversion of preference shares
into ordinary shares (3,975,533) (4,465) 3,975,533 4,465 - - 34,784 - - 34,784 - 34,784
Compensation expense related to stock options - - - - - - 13,593 - - 13,593 - 13,593
Purchase of treasury stock - - - - (7,548,951) (505,014) - - - (505,014) - (505,014)
Dividends paid - - - - - - - (296,134) - (296,134) - (296,134)
Purchase/ sale of noncontrolling interests - - - - - - (3,566) - - (3,566) (11,607) (15,173)
Contributions from/ to noncontrolling interests - - - - - - - - - - (32,275) (32,275)
Changes in fair value of noncontrolling interests
subject to put provisions - - - - - - (108,575) - - (108,575) - (108,575)
Net income - - - - - - - 1,109,890 - 1,109,890 32,577 1,142,467
Other comprehensive income (loss) - - - - - - - - (58,474) (58,474) (2,993) (61,467)
Comprehensive income - - - - - - - - - 1,051,416 29,584 1,081,000
Balance at December 31, 2013 - $ - 308,995,730 $ 382,411 (7,548,951) $ (505,014) $ 3,530,337 $ 6,377,417 $ (550,587) $ 9,234,564 $ 250,456 $ 9,485,020
See accompanying notes to consolidated financial statements.

FRESENIUS MEDICAL CARE AG & Co. KGaA
NOTES TO CONSOLIDATED FINANCIAL STATEMENTS
(in thousands, except share data)
F-10
1. The Company and Basis of Presentation
The Company
Fresenius Medical Care AG & Co. KGaA (“FMC-AG & Co. KGaA” or the “Company”), a German
partnership limited by shares (Kommanditgesellschaft auf Aktien), is the world’s largest kidney dialysis
company, operating in both the field of dialysis care and the field of dialysis products for the treatment of end-
stage renal disease (“ESRD”). The Company’s dialysis care business, in addition to providing dialysis
treatments, includes pharmacy services and vascular access surgery services (together, the “Expanded
Services”). The Company’s dialysis products business includes manufacturing and distributing products for the
treatment of ESRD. The Company’s dialysis business is vertically integrated, providing dialysis treatment at
dialysis clinics it owns or operates and supplying these clinics with a broad range of products. In addition, the
Company sells dialysis products to other dialysis service providers. In the United States (“U.S.”) the Company
also provides laboratory testing services, and inpatient dialysis services as well as other services under contract
to hospitals.
In these Notes, “FMC-AG & Co. KGaA,” or the “Company,” “we,” “us” or “our” refers to the Company or
the Company and its subsidiaries on a consolidated basis, as the context requires. The term “North America
Segment” refers to the North America operating segment. The term “International Segment” refers to the
combined Europe, Middle East, Africa and Latin America (“EMEALA”) operating segment and the Asia-Pacific
operating segment. For further discussion of our operating segments, see Note 24 “Segment and Corporate
Information”.
Basis of Presentation
The accompanying consolidated financial statements have been prepared in accordance with the United
States’ generally accepted accounting principles (“U.S. GAAP”).
The preparation of consolidated financial statements in conformity with U.S. GAAP requires management to
make estimates and assumptions that affect the reported amounts of assets and liabilities and disclosure of
contingent assets and liabilities at the date of the consolidated financial statements and the reported amounts of
revenues and expenses during the reporting period. Actual results could differ from those estimates. Such
financial statements reflect all adjustments that, in the opinion of management, are necessary for a fair
presentation of the results of the periods presented. All such adjustments are of a normal recurring nature.
Certain items in the prior years’ comparative consolidated financial statements have been reclassified to
conform to the current year’s presentation. Pension liabilities in the amount of $34,312 for the year ended
December 31, 2012 have been reclassified from “Other liabilities” to “Pension liabilities” within the
Consolidated Balance Sheet to appropriately depict the Company’s pension plans outside of Germany and the
US (see Note 12). Deferred tax assets in the amount of $39,776 and $44,601 for the current and non-current
portions of deferred taxes have also been reclassified from “Deferred taxes (current)” and “Deferred taxes (non-
current)” to “Prepaids and other current assets” and “Other assets and notes receivable”, respectively, for the
year ended December 31, 2012 to conform to the current year’s presentation for the deferred tax effects on
intercompany sales and purchases of assets (see Note 18).
Summary of Significant Accounting Policies
a) Principles of Consolidation
The consolidated financial statements include the earnings of all companies in which the Company has legal
or effective control. This includes variable interest entities (“VIEs”) for which the Company is deemed the
primary beneficiary. In accordance with current accounting principles, the Company also consolidates certain
clinics that it manages and financially controls. Noncontrolling interests represent the proportionate equity
interests in the Company’s consolidated entities that are not wholly owned by the Company. Noncontrolling
interests of acquired entities are valued at fair value. The equity method of accounting is used for investments in
associated companies over which the Company has significant exercisable influence, even when the Company
holds 50% or less of the common stock of the entity. All significant intercompany transactions and balances
have been eliminated.

FRESENIUS MEDICAL CARE AG & Co. KGaA
NOTES TO CONSOLIDATED FINANCIAL STATEMENTS
(in thousands, except share data)
F-11
The Company has entered into various arrangements with certain dialysis clinics and a dialysis product
distributor to provide management services, financing and product supply. The dialysis clinics and the dialysis
product distributor have either negative equity or are unable to provide their own funding for their operations.
Therefore, the Company has agreed to fund their operations through loans. The compensation for the funding
can carry interest, exclusive product supply agreements, or entitle the Company to a pro rata share of profits, if
any. The Company has a right of first refusal in the event the owners sell the business or assets. These clinics and
the dialysis product distributor are VIEs in which the Company has been determined to be the primary
beneficiary and which therefore have been fully consolidated. All VIEs generated approximately $203,333,
$205,858 and $195,296 in revenue in 2013, 2012, and 2011, respectively. The Company provided funding to
VIEs through loans and accounts receivable of $150,300 and $146,500 in 2013 and 2012, respectively. The table
below shows the carrying amounts of the assets and liabilities of VIEs at December 31, 2013 and 2012:
2013 2012
Trade accounts receivable, net $ 102,549 $ 99,061
Other current assets 59,695 57,741
Property, plant and equipment, intangible assets & other non-current assets 26,274 26,823
Goodwill 32,759 31,678
Accounts payable, accrued expenses and other liabilities 133,977 122,891
Non-current loans from related parties 12,998 12,998
Equity 74,302 79,414
b) Cash and Cash Equivalents
Cash and cash equivalents comprise cash funds and all short-term, liquid investments with original
maturities of up to three months.
c) Inventories
Inventories are stated at the lower of cost (determined by using the average or first-in, first-out method) or
market value (see Note 4). Costs included in inventories are based on invoiced costs and/or production costs or
the marked to market valuation, as applicable. Included in production costs are material, direct labor and
production overhead, including depreciation charges.
d) Property, Plant and Equipment
Property, plant, and equipment are stated at cost less accumulated depreciation (see Note 6). Significant
improvements are capitalized; repairs and maintenance costs that do not extend the useful lives of the assets are
charged to expense as incurred. Property and equipment under capital leases are stated at the present value of
future minimum lease payments at the inception of the lease, less accumulated depreciation. Depreciation on
property, plant and equipment is calculated using the straight-line method over the estimated useful lives of the
assets ranging from 3 to 40 years for buildings and improvements with a weighted average life of 13 years and 3
to 15 years for machinery and equipment with a weighted average life of 10 years. Equipment held under capital
leases and leasehold improvements are amortized using the straight-line method over the shorter of the lease
term or the estimated useful life of the asset. Internal use platform software that is integral to the computer
equipment it supports is included in property, plant and equipment. The Company capitalizes interest on
borrowed funds during construction periods. Interest capitalized during 2013, 2012, and 2011 was $7,358,
$3,952 and $3,784, respectively.
e) Intangible Assets and Goodwill
Intangible assets such as non-compete agreements, technology, distribution rights, patents, licenses to treat,
licenses to manufacture, distribute and sell pharmaceutical drugs, exclusive contracts and exclusive licenses,
trade names, management contracts, application software, acute care agreements, customer relationships, lease
agreements, and licenses acquired in a business combination are recognized and reported apart from goodwill
(see Note 7).

FRESENIUS MEDICAL CARE AG & Co. KGaA
NOTES TO CONSOLIDATED FINANCIAL STATEMENTS
(in thousands, except share data)
F-12
Goodwill and identifiable intangibles with indefinite useful lives are not amortized but tested for impairment
annually or when an event becomes known that could trigger an impairment. The Company identified trade
names and certain qualified management contracts as intangible assets with indefinite useful lives because, based
on an analysis of all of the relevant factors, there is no foreseeable limit to the period over which those assets are
expected to generate net cash inflows for the Company. Intangible assets with finite useful lives are amortized
over their respective useful lives to their residual values. The Company amortizes non-compete agreements over
their useful life which on average is 8 years. Technology is amortized over its useful life of 16 years. Licenses to
manufacture, distribute and sell pharmaceutical drugs, exclusive contracts and exclusive licenses are amortized
over their useful life which on average is 9 years. Customer relationships are amortized over their useful life of
15 years. All other intangible assets are amortized over their weighted average useful lives of 7 years. The
weighted average useful life of all amortizable intangible assets is 9 years. Intangible assets with finite useful
lives are evaluated for impairment when events have occurred that may give rise to an impairment.
To perform the annual impairment test of goodwill, the Company identified its reporting units and
determined their carrying value by assigning the assets and liabilities, including the existing goodwill and
intangible assets, to those reporting units. One reporting unit was identified in the North America Segment. The
EMEALA operating segment is divided into two reporting units (Europe and Latin America), while only one
reporting unit exists in the operating segment Asia-Pacific. For the purpose of goodwill impairment testing, all
corporate assets are allocated to the reporting units.
In a first step, the Company compares the fair value of a reporting unit to its carrying amount. Fair value is
determined using estimated future cash flows for the unit discounted by an after-tax weighted average cost of
capital (“WACC”) specific to that reporting unit. Estimating the future cash flows involves significant
assumptions, especially regarding future reimbursement rates and sales prices, number of treatments, sales
volumes and costs. In determining discounted cash flows, the Company utilizes for every reporting unit, its
three-year budget, projections for years 4 to 10 and a representative growth rate for all remaining years.
Projections for up to ten years are possible due to the stability of the Company’s business which, results from the
non-discretionary nature of the healthcare services we provide, the need for products utilized to provide such
services and the availability of government reimbursement for a substantial portion of our services. The
reporting units’ respective expected growth rates for the period beyond ten years are: North America Segment
1%, Europe 0%, Latin America 4%, and Asia-Pacific 4%. The discount factor is determined by the WACC of
the respective reporting unit. The Company’s WACC consisted of a basic rate of 6.17% for 2013. The basic rate
is then adjusted by a country-specific risk rate and, if appropriate, by a factor to reflect higher risks associated
with the cash flows from recent material acquisitions, until they are appropriately integrated, within each
reporting unit. In 2013, WACCs for the reporting units ranged from 6.12% to 13.83%.
In the case that the fair value of the reporting unit is less than its carrying value, a second step would be
performed which compares the implied fair value of the reporting unit's goodwill to the carrying value of its
goodwill. If the fair value of the goodwill is less than the carrying value, the difference is recorded as an
impairment.
To evaluate the recoverability of intangible assets with indefinite useful lives, the Company compares the
fair values of intangible assets with their carrying values. An intangible asset's fair value is determined using a
discounted cash flow approach or other methods, if appropriate.
f) Derivative Financial Instruments
Derivative financial instruments, which primarily include foreign currency forward contracts and interest
rate swaps, are recognized as assets or liabilities at fair value in the balance sheet (see Note 21). Changes in the
fair value of derivative financial instruments classified as fair value hedges and in the corresponding underlying
assets and liabilities are recognized periodically in earnings, while the effective portion of changes in fair value
of derivative financial instruments classified as cash flow hedges is recognized in accumulated other
comprehensive income (loss) (“AOCI”) in shareholders’ equity. The ineffective portion is recognized in current
net earnings. The change in fair value of derivatives that do not qualify for hedge accounting are recorded in the
income statement and usually offset the changes in value recorded in the income statement for the underlying
asset or liability.

FRESENIUS MEDICAL CARE AG & Co. KGaA
NOTES TO CONSOLIDATED FINANCIAL STATEMENTS
(in thousands, except share data)
F-13
g) Foreign Currency Translation
For purposes of these consolidated financial statements, the U.S. dollar is the reporting currency.
Substantially all assets and liabilities of the parent company and all non-U.S. subsidiaries are translated at year-
end exchange rates, while revenues and expenses are translated at average exchange rates. Adjustments for
foreign currency translation fluctuations are excluded from net earnings and are reported in AOCI. In addition,
the translation adjustments of certain intercompany borrowings, which are of a long-term nature, are reported in
AOCI.
h) Revenue Recognition and Allowance for Doubtful Accounts
Revenue Recognition
Dialysis care revenues are recognized on the date the patient receives treatment and includes amounts related
to certain services, products and supplies utilized in providing such treatment. The patient is obligated to pay for
dialysis care services at amounts estimated to be receivable based upon the Company’s standard rates or at rates
determined under reimbursement arrangements. In the U.S., these arrangements are generally with third party
payors, like Medicare, Medicaid or commercial insurers. Outside the U.S., the reimbursement is usually made
through national or local government programs with reimbursement rates established by statute or regulation.
Dialysis product revenues are recognized upon transfer of title to the customer, either at the time of
shipment, upon receipt or upon any other terms that clearly define passage of title. Product revenues are
normally based upon pre-determined rates that are established by contractual arrangement.
For both dialysis care revenues and dialysis product revenues, patients, third party payors and customers are
billed at our standard rates net of contractual allowances, discounts or rebates to reflect the estimated amounts to
be receivable from these payors.
As of January 1, 2012, the Company adopted ASU 2011-07, Health Care Entities-Presentation and
Disclosure of Patient Service Revenue, Provision for Bad Debts, and the Allowance for Doubtful Accounts and
as a result, for services performed for patients where the collection of the billed amount or a portion of the billed
amount cannot be determined at the time services are performed, the difference between the receivable recorded
and the amount estimated to be collectible must be recorded as a provision and the expense is presented as a
reduction of dialysis care revenue. The provision includes such items as amounts due from patients without
adequate insurance coverage and patient co-payment and deductible amounts due from patients with health care
coverage. The Company bases the provision mainly on past collection history and reports it as “Patient service
bad debt provision” on the Consolidated Statements of Income.
A minor portion of International Segment product revenues is generated from arrangements which give the
customer, typically a healthcare provider, the right to use dialysis machines. In the same contract the customer
agrees to purchase the related treatment disposables at a price marked up from the standard price list. If the right
to use the machine is conveyed through an operating lease, FMC-AG & Co. KGaA does not recognize revenue
upon delivery of the dialysis machine but recognizes revenue on the sale of disposables. If the lease of the
machines is a sales type lease, ownership of the dialysis machine is transferred to the user upon installation of
the dialysis machine at the customer site. In this type of contract, revenue is recognized in accordance with the
accounting principles for sales type leases.
Any tax assessed by a governmental authority that is incurred as a result of a revenue transaction (e.g. sales
tax) is excluded from revenues and the related revenue is reported on a net basis.
Allowance for doubtful accounts
In the North America Segment for receivables generated from dialysis care services, the accounting for the
allowance for doubtful accounts is based on an analysis of collection experience and recognizing the differences
between payors. The Company also performs an aging of accounts receivable which enables the review of each
customer and their payment pattern. From time to time, accounts receivable are reviewed for changes from the
historic collection experience to ensure the appropriateness of the allowances.
The allowance for doubtful accounts in the International Segment and the North America Segment dialysis
products business is an estimate comprised of customer specific evaluations regarding their payment history,

FRESENIUS MEDICAL CARE AG & Co. KGaA
NOTES TO CONSOLIDATED FINANCIAL STATEMENTS
(in thousands, except share data)
F-14
current financial stability, and applicable country specific risks for receivables that are overdue more than one
year. The changes in the allowance for these receivables are recorded in Selling, general and administrative as an
expense.
When all efforts to collect a receivable, including the use of outside sources where required and allowed,
have been exhausted, and after appropriate management review, a receivable deemed to be uncollectible is
considered a bad debt and written off.
i) Research and Development expenses
Research and development expenses are expensed as incurred.
j) Income Taxes
Current taxes are calculated based on the profit (loss) of the fiscal year and in accordance with local tax
rules of the respective tax jurisdictions. Expected and executed additional tax payments and tax refunds for prior
years are also taken into account. Benefits from income tax positions have been recognized only when it was
more likely than not that the Company would be entitled to the economic benefits of the tax positions. The more-
likely-than-not threshold has been determined based on the technical merits that the position will be sustained
upon examination. If a tax position meets the more-likely-than-not recognition threshold, management estimates
the largest amount of tax benefit that is more than fifty percent likely to be realized upon settlement with a taxing
authority, which becomes the amount of benefit recognized. If a tax position is not considered more likely than
not to be sustained based solely on its technical merits, no benefits are recognized.
The Company recognizes deferred tax assets and liabilities for future consequences attributable to temporary
differences between the financial statement carrying amounts of existing assets and liabilities and their
respective tax basis, tax credits and tax loss carryforwards which are more likely than not to be utilized. Deferred
tax assets and liabilities are measured using the respective countries enacted tax rates to be applied to taxable
income in the years in which those temporary differences are expected to be recovered or settled. In addition, the
recognition of deferred tax assets considers the budget planning of the Company and implemented tax strategies.
A valuation allowance is recorded to reduce the carrying amount of the deferred tax assets unless it is more
likely than not that such assets will be realized (see Note 18).
It is the Company’s policy that assets on uncertain tax positions are recognized to the extent it is more likely
than not the tax will be recovered. It is also the Company’s policy to recognize interest and penalties related to
its tax positions as income tax expense.
k) Impairment
The Company reviews the carrying value of its long-lived assets or asset groups with definite useful lives to
be held and used for impairment whenever events or changes in circumstances indicate that the carrying value of
these assets may not be recoverable. Recoverability of these assets is measured by a comparison of the carrying
value of an asset to the future net cash flows directly associated with the asset. If assets are considered to be
impaired, the impairment recognized is the amount by which the carrying value exceeds the fair value of the
asset. The Company uses a discounted cash flow approach or other methods, if appropriate, to assess fair value.
Long-lived assets to be disposed of by sale are reported at the lower of carrying value or fair value less cost
to sell and depreciation is ceased. Long-lived assets to be disposed of other than by sale are considered to be held
and used until disposal.
For the Company’s policy related to goodwill impairment, see 1e) above.
l) Debt Issuance Costs
Certain costs related to the issuance of debt are amortized over the term of the related obligation (see Note
11).

FRESENIUS MEDICAL CARE AG & Co. KGaA
NOTES TO CONSOLIDATED FINANCIAL STATEMENTS
(in thousands, except share data)
F-15
m) Self-Insurance Programs
Under the insurance programs for professional, product and general liability, auto liability and worker’s
compensation claims, the Company's largest subsidiary is partially self-insured for professional liability claims.
For all other coverage, the Company assumes responsibility for incurred claims up to predetermined amounts
above which third party insurance applies. Reported liabilities for the year represent estimated future payments
of the anticipated expense for claims incurred (both reported and incurred but not reported) based on historical
experience and existing claim activity. This experience includes both the rate of claims incidence (number) and
claim severity (cost) and is combined with individual claim expectations to estimate the reported amounts.
n) Concentration of Risk
The Company is engaged in the manufacture and sale of products for all forms of kidney dialysis,
principally to healthcare providers throughout the world, and in providing kidney dialysis treatment, clinical
laboratory testing, and other medical ancillary services. The Company performs ongoing evaluations of its
customers' financial condition and, generally, requires no collateral.
Approximately 32%, 32% and 30% of the Company's worldwide revenues were earned and subject to
regulations under Medicare and Medicaid, governmental healthcare programs administered by the United States
government in 2013, 2012, and 2011, respectively.
No single debtor other than U.S. Medicaid and Medicare accounted for more than 5% of total trade accounts
receivable in any of these years. Trade accounts receivable in the International Segment are for a large part due
from government or government-sponsored organizations that are established in the various countries within
which we operate. Amounts pending approval from third party payors represent less than 3% at December 31,
2013.
See Note 4 for discussion of suppliers with long-term purchase commitments.
o) Legal Contingencies
From time to time, during the ordinary course of the Company's operations, the Company is party to
litigation and arbitration and is subject to investigations relating to various aspects of its business (see Note 20).
The Company regularly analyzes current information about such claims for probable losses and provides
accruals for such matters, including the estimated legal expenses and consulting services in connection with
these matters, as appropriate. The Company utilizes its internal legal department as well as external resources for
these assessments. In making the decision regarding the need for loss accrual, the Company considers the degree
of probability of an unfavorable outcome and its ability to make a reasonable estimate of the amount of loss.
The filing of a suit or formal assertion of a claim or assessment, or the disclosure of any such suit or
assertion, does not necessarily indicate that accrual of a loss is appropriate.
p) Earnings per Share
Basic earnings per share is calculated by dividing net income attributable to shareholders by the weighted
average number of shares outstanding during the year. Prior to the conversion of preference shares to ordinary
shares during the second quarter of 2013, basic earnings per share was computed according to the two-class
method by dividing net income attributable to shareholders, less preference amounts, by the weighted number of
ordinary and preference shares outstanding during the year. Diluted earnings per share include the effect of all
potentially dilutive instruments on ordinary shares and previously outstanding preference shares that would have
been outstanding during the years presented had the dilutive instruments been issued.
Equity-settled awards granted under the Company's stock incentive plans (see Note 17), are potentially
dilutive equity instruments.

FRESENIUS MEDICAL CARE AG & Co. KGaA
NOTES TO CONSOLIDATED FINANCIAL STATEMENTS
(in thousands, except share data)
F-16
q) Treasury Stock
The Company may, from time to time, acquire its own shares (“Treasury Stock”) as approved by its
shareholders. The acquisition, sale or retirement of its Treasury Stock is recorded separately in equity. For the
calculation of basic earnings per share, treasury stock is not considered outstanding and is therefore deducted
from the number of shares outstanding with the value of such Treasury Stock shown as a reduction of the
Company’s equity.
r) Employee Benefit Plans
For the Company’s funded benefit plans, the defined benefit obligation is offset against the fair value of plan
assets (funded status). A pension liability is recognized in the Consolidated Balance Sheets if the defined benefit
obligation exceeds the fair value of plan assets. A pension asset is recognized (and reported under other assets in
the balance sheet) if the fair value of plan assets exceeds the defined benefit obligation and if the Company has a
right of reimbursement against the fund or a right to reduce future payments to the fund. Changes in the funded
status of a plan resulting from actuarial gains or losses and prior service costs or credits that are not recognized
as components of the net periodic benefit cost are recognized through accumulated other comprehensive income,
net of tax, in the year in which they occur. Actuarial gains or losses and prior service costs are subsequently
recognized as components of net periodic benefit cost when realized. The Company uses December 31 as the
measurement date when measuring the funded status of all plans.
s) Recent Pronouncements
Recently Implemented Accounting Pronouncements
On January 31, 2013, FASB issued Accounting Standards Update 2013-01 (“ASU 2013-01”) an update to
Balance Sheet (Topic 210), Clarifying the Scope of Disclosures about Offsetting Assets and Liabilities (“Topic
210”). The main purpose of ASU 2013-01 is to clarify the scope of balance sheet offsetting under Topic 210 to
include derivatives, repurchase agreements and reverse repurchase agreements, and securities borrowing and
securities lending transactions that are offset or subject to master netting agreements. The disclosures required
under Topic 210 would apply to these transactions and other types of financial assets or liabilities will no longer
be subject to Topic 210. The update is effective for fiscal years and interim periods within those years beginning
on or after January 1, 2013. The Company does not utilize balance sheet offsetting for its derivative transactions.
See Note 21 of the Notes to the Consolidated Financial Statements, “Financial Instruments,” included in this
report for more information.
Recent Accounting Pronouncements Not Yet Adopted
On February 28, 2013 FASB issued Accounting Standards Update 2013-04 (“ASU 2013-04”) Liabilities
(Topic 405), Obligations Resulting from Joint and Several Liability Arrangements for which the Total Amount of
the Obligations is Fixed at the Reporting Date.” ASU 2013-04’s objective is to provide guidance and
clarification on the recognition, measurement and disclosure of obligations resulting from joint and several
liability arrangements such as debt arrangements, other contractual obligations and settled litigation and judicial
rulings. The update is effective for fiscal years and interim periods within those years beginning on or after
December 15, 2013. The Company will adopt ASU 2013-04 as of January 1, 2014. The Company has
determined that the impact will be the inclusion of a disclosure within the Notes to the Consolidated Financial
Statements.
On March 4, 2013 FASB issued Accounting Standards Update 2013-05 (“ASU 2013-05”) Foreign Currency
Matters (Topic 830), Parent’s Accounting for the Cumulative Translation Adjustment upon Derecognition of
Certain Subsidiaries or Groups of Assets within a Foreign Entity or of an Investment in a Foreign Entity. The
purpose of ASU 2013-05 is to provide clarification and further refinement regarding the treatment of the release
of a cumulative translation adjustment into net income. This occurs in instances where the parent sells either a
part or all of its investment in a foreign entity, as well as when a company ceases to hold a controlling interest in
a subsidiary or group of assets that is a nonprofit activity or business within a foreign entity. The update is
effective for fiscal years and interim periods within those years beginning on or after December 15, 2013. The
Company will adopt ASU 2013-05 as of January 1, 2014. ASU 2013-05 will not have a material impact on the
Company and its consolidated financial statements.

FRESENIUS MEDICAL CARE AG & Co. KGaA
NOTES TO CONSOLIDATED FINANCIAL STATEMENTS
(in thousands, except share data)
F-17
On July 17, 2013, FASB issued Accounting Standards Update 2013-10 (“ASU 2013-10”) Derivatives and
Hedging (Topic 815), Inclusion of the Fed Funds Effective Swap Rate (or Overnight Index Swap Rate) as a
Benchmark Interest Rate for Hedge Accounting Purposes. The purpose of 2013-10 is to provide the inclusion of
the Fed Funds Effective Swap Rate as a U.S. benchmark interest rate for hedge accounting purposes. This rate
will now be available to use along with U.S. government interest rates and the London Interbank Offered Rate.
This update is effective prospectively for new or designated hedging relationships entered into on or after July
17, 2013. Currently, we do not intend to utilize the newly available Fed Funds Effective Swap Rate for our
hedge accounting.
On July 18, 2013, FASB issued Accounting Standards Update 2013-11 (“ASU 2013-11”) Income Taxes
(Topic 740) Presentation of an Unrecognized Tax Benefit When a Net Operating Loss Carryforward, a Similar
Tax Loss, or a Tax Credit Carryforward Exists. The purpose of ASU 2013-11 is to align the financial statement
presentation of an unrecognized tax benefit when a net operating loss carryforward, a similar tax loss or a tax
credit carryforward exists. In most cases, the unrecognized tax benefit should be presented as a reduction to a
deferred tax asset for a net operating loss carryforward, a similar tax loss or a tax credit carryforward. The update
is effective for fiscal years and interim periods within those years beginning on or after December 15, 2013. The
Company will adopt ASU 2013-11 as of January 1, 2014. ASU 2013-11 will not have a material impact on the
Company and its consolidated financial statements.
2. Acquisition of Liberty Dialysis Holdings
On February 28, 2012, the Company acquired 100% of the equity of Liberty Dialysis Holdings, Inc. (“LD
Holdings”), the owner of Liberty Dialysis and owner of a 51% stake in Renal Advantage Partners, LLC (the
“Liberty Acquisition”). The Company accounted for this transaction as a business combination and finalized the
acquisition accounting on February 28, 2013.
Total consideration for the Liberty Acquisition was $2,181,358, consisting of $1,696,659 cash, net of cash
acquired and $484,699 non-cash consideration. Accounting standards for business combinations require
previously held equity interests to be fair valued at the time of acquisition with the difference to book value to be
recognized as a gain or loss in income. Prior to the Liberty Acquisition, the Company had a 49% equity
investment in Renal Advantage Partners, LLC, the fair value of which, $ 201,915, was included as part of the
non-cash consideration. The fair value was determined based on the discounted cash flow method, utilizing a
discount rate of approximately 13%. In addition to the Company’s investment, it also had a loan receivable from
Renal Advantage Partners, LLC of $279,793, at a fair value of $ 282,784, which was retired as part of the
transaction.
The following table summarizes the final fair values of assets acquired and liabilities assumed at the date of
the acquisition. Any adjustments to acquisition accounting from December 31, 2012 until finalization on
February 28, 2013, net of related income tax effects, were recorded with a corresponding adjustment to goodwill:

FRESENIUS MEDICAL CARE AG & Co. KGaA
NOTES TO CONSOLIDATED FINANCIAL STATEMENTS
(in thousands, except share data)
F-18
Assets held for sale $ 164,068
Trade accounts receivable 149,219
Other current assets 17,458
Deferred tax assets 14,932
Property, plant and equipment 168,335
Intangible assets and other assets 84,556
Goodwill 2,003,465
Accounts payable, accrued expenses and other current liabilities (105,403)
Income tax payable and deferred taxes (33,597)
Short-term borrowings, other financial liabilities, long-term debt and capital lease obligations (72,101)
Other liabilities (39,923)
Noncontrolling interests (subject and not subject to put provisions) (169,651)
Total acquisition cost $ 2,181,358
Less non-cash contributions at fair value
Investment at acquisition date (201,915)
Long-term Notes Receivable (282,784)
Total non-cash items (484,699)
Net Cash paid $ 1,696,659
The amortizable intangible assets acquired in this acquisition have weighted average useful lives of 6-8
years.
Goodwill, in the amount of $2,003,465 was acquired as part of the Liberty Acquisition and was allocated to
the North America Segment. Goodwill is an asset representing the future economic benefits arising from other
assets acquired in a business combination that are not individually identified and separately recognized.
Goodwill arises principally due to the fair value placed on an estimated stream of future cash flows versus
building a similar franchise. Of the goodwill recognized in this acquisition, approximately $436,000 is
deductible for tax purposes and is being amortized over a 15 year period which began on the date of the
acquisition.
The noncontrolling interests acquired as part of the acquisition are stated at fair value based upon contractual
multiples typically utilized by the Company for such arrangements as well as the Company’s overall experience.
The fair valuation of the Company’s investment at the time of the Liberty Acquisition resulted in a non-
taxable gain of $139,600. The retirement of the loan receivable resulted in a benefit of $8,501.
Divestitures
In connection with the Federal Trade Commission’s consent order relating to regulatory clearance of the
Liberty Acquisition under the Hart-Scott-Rodino Antitrust Improvements Act, the Company agreed to divest a
total of 62 renal dialysis centers. During 2012, 61 clinics were sold, 24 of which were FMC-AG & Co. KGaA
legacy clinics which generated a gain of $33,455. During 2013, the remaining clinic required to be sold was sold
for a gain of $7,705. The 38 clinics acquired and subsequently sold were categorized as Assets held for sale in
the table above at the time of the Liberty Acquisition.
Pro Forma Financial Information
The following financial information, on a pro forma basis, reflects the consolidated results of operations as if
the Liberty Acquisition and the divestitures described above had been consummated on January 1, 2011. The pro
forma information includes adjustments primarily for elimination of the investment gain and the gain from the
retirement of debt. The pro-forma financial information is not necessarily indicative of the results of operations
as it would have been had the transactions been consummated on January 1, 2011.

FRESENIUS MEDICAL CARE AG & Co. KGaA
NOTES TO CONSOLIDATED FINANCIAL STATEMENTS
(in thousands, except share data)
F-19
For the years ended
December 31,
2012 2011
Pro forma net revenue $ 13,900,540 $ 13,215,111
Pro forma net income attributable to shareholders of FMC - AG & Co. KGaA 1,054,872 1,077,218
Pro forma income per ordinary share
Basic $ 3.46 $ 3.56
Fully diluted $ 3.44 $ 3.53
3. Related Party Transactions
The Company’s parent, Fresenius SE & Co. KGaA (“Fresenius SE”), a German partnership limited by
shares owns 100% of the share capital of Fresenius Medical Care Management AG, the Company’s general
partner (“General Partner”). Fresenius SE is also the Company’s largest shareholder and owned approximately
31.3% of the Company’s shares at December 31, 2013, excluding the shares purchased through the Company’s
share buyback program as they are not considered to be outstanding shares (see Note 14). The Company has
entered into certain arrangements for the purchase and sale of products and services with Fresenius SE or its
subsidiaries and with certain of the Company’s joint ventures as described in items a), b) and d) below. The
Company’s terms related to the receivables or payables for these products and services are generally consistent
with the normal terms of the Company’s business. Financing arrangements as described in item c) below
normally have agreed upon terms which are determined at the time such financing transactions occur and usually
reflect market rates at the time of the transaction. Our related party transactions are settled through Fresenius
SE’s cash management system where appropriate.
a) Service and Lease Agreements
The Company is party to service agreements with Fresenius SE and certain of its affiliates (collectively the
“Fresenius SE Companies”) to receive services, including, but not limited to: administrative services,
management information services, employee benefit administration, insurance, information technology services,
tax services and treasury management services. In 2013, the Company entered into a new five year information
technology services agreement, expiring in 2018, which has an automatic continuation for an additional 5 year
period with short-term continuations thereafter unless either party terminates the agreement at the end of the
then-current term. The Company has complied with all corporate governance procedures for this agreement.
During 2013, 2012 and 2011, amounts charged by Fresenius SE Companies to the Company under the terms of
these agreements were $103,577, $80,778 and $75,969, respectively. The Company also provides certain
services to the Fresenius SE Companies, including research and development, central purchasing and
warehousing. The Company charged $7,550, $5,810, $6,555 for services rendered to the Fresenius SE
Companies during 2013, 2012 and 2011, respectively.
Under real estate operating lease agreements entered into with the Fresenius SE Companies, which are
leases for the corporate headquarters in Bad Homburg, Germany and production sites in Schweinfurt and St.
Wendel, Germany, the Company paid the Fresenius SE Companies $26,976, $25,179 and $25,833 during 2013,
2012 and 2011, respectively. The majority of the leases expire in 2016 and contain renewal options.
The Company’s Articles of Association provide that the General Partner shall be reimbursed for any and all
expenses in connection with management of the Company’s business, including remuneration of the members of
the General Partner’s supervisory board and the members of the General Partner’s management board
(“Management Board”). The aggregate amount reimbursed to the General Partner was $16,327, $18,995 and
$13,511, respectively, for its management services during 2013, 2012 and 2011 and included $159, $94 and $84,
respectively, as compensation for its exposure to risk as general partner. The Company’s Articles of Association
set the annual compensation for assuming unlimited liability at 4% of the amount of the General Partner’s share
capital (€3,000).

FRESENIUS MEDICAL CARE AG & Co. KGaA
NOTES TO CONSOLIDATED FINANCIAL STATEMENTS
(in thousands, except share data)
F-20
b) Products
During 2013, 2012 and 2011 the Company sold products to the Fresenius SE Companies for $30,062,
$22,098 and $20,220 respectively. During the same periods, the Company made purchases from the Fresenius
SE Companies in the amount of $34,201, $46,072 and $52,587 respectively.
In addition to the purchases noted above, Fresenius Medical Care Holdings, Inc. (“FMCH”) currently
purchases heparin supplied by Fresenius Kabi USA, Inc. (“Kabi USA”), through an independent group
purchasing organization (“GPO”). Kabi USA is wholly-owned by Fresenius Kabi AG, a wholly-owned
subsidiary of Fresenius SE. The Company has no direct supply agreement with Kabi USA and does not submit
purchase orders directly to Kabi USA. During 2013, 2012 and 2011, FMCH acquired approximately $17,700,
$14,136 and $24,106, respectively, of heparin from Kabi USA through the GPO contract, which was negotiated
by the GPO at arm’s length on behalf of all members of the GPO.
c) Financing Provided by and to Fresenius SE and the General Partner
The Company receives short-term financing from and provides short-term financing to Fresenius SE. In
addition, the Company utilizes Fresenius SE’s cash management system for the settlement of certain
intercompany receivables and payables with its subsidiaries and other related parties. As of December 31, 2013
and December 31, 2012, the Company had accounts receivables from Fresenius SE in the amount of $112,568
and $120,071, respectively. As of December 31, 2013 and December 31, 2012, the Company had accounts
payables to Fresenius SE in the amount of $102,731 and $82,029, respectively. The interest rates for these cash
management arrangements are set on a daily basis and are based on the then-prevailing overnight reference rate
for the respective currencies.
At December 31, 2013, the Company provided a loan to Fresenius SE of €4,400 ($6,068 at December 31,
2013) at an interest rate of 1.563%. This loan was repaid on January 3, 2014.
On August 19, 2009, the Company borrowed €1,500 ($2,069 at December 31, 2013) from the General
Partner at 1.335%. The loan repayment has been extended periodically and is currently due August 20, 2014
with an interest rate of 1.796%. On November 28, 2013, the Company borrowed an additional €1,500 ($2,069 at
December 31, 2013) from the General Partner at 1.875%. This loan is due on November 28, 2014.
At December 31, 2013, the Company borrowed CNY 352,372 ($58,204 at December 31, 2013) from a
subsidiary of Fresenius SE at an interest rate of 6.1% and a maturity date of May 23, 2014.
For further information about short-term borrowings from and short-term financing provided to related
parties at December 31, 2013, see Note 10.
d) Other
The Company performs clinical studies for certain of its joint ventures for which services the Company
received $2,106, $7,432 and $9,355 in 2013, 2012, and 2011 respectively. In addition, the Company also
performs marketing and distribution services for a joint venture for which services the Company received
$19,541, $19,170 and $4,018 for 2013, 2012 and 2011, respectively.
At December 31, 2013 and 2012, a subsidiary of Fresenius SE held Senior Notes issued by the Company in
the amount of €11,800 and €12,800 ($16,273 and $16,888), respectively. The respective Senior Notes have a
coupon rate of 5.25% interest and were issued in 2011 and 2012. See Note 11 “Long-term Debt and Capital
Lease Obligations and Long-term Debt from Related Parties-Senior Notes”. The Company paid interest related
to these holdings in the amount of €678, €790, and €620 ($900, $1,015, and $863) during 2013, 2012 and 2011,
respectively.
The Chairman of the Company’s Supervisory Board is also the Chairman of the Supervisory Board of
Fresenius SE and of the general partner of Fresenius SE. He is also a member of the Supervisory Board of the
Company’s General Partner.
The Vice Chairman of the Company's Supervisory Board is a member of the Supervisory Board of the
general partner of Fresenius SE and Vice Chairman of the Supervisory Board of the Company’s General Partner.

FRESENIUS MEDICAL CARE AG & Co. KGaA
NOTES TO CONSOLIDATED FINANCIAL STATEMENTS
(in thousands, except share data)
F-21
He is also Chairman of the Advisory Board of a charitable foundation that is the sole shareholder of the general
partner of Fresenius SE. He is also a partner in a law firm which provided services to the Company and certain
of its subsidiaries. The Company incurred expenses in the amount of $1,268, $ 1,519, and $2,120 for these
services during 2013, 2012, and 2011, respectively. Five of the six members of the Company’s Supervisory
Board, including the Chairman and Vice Chairman, are also members of the Supervisory Board of the
Company’s General Partner.
The Chairman of the Supervisory Board of the Company’s general partner is also the Chairman of the
Management Board of the general partner of Fresenius SE, and the Chairman and Chief Executive Officer of the
Management Board of the Company’s general partner is a member of the Management Board of the general
partner of Fresenius SE.
4. Inventories
At December 31, 2013 and December 31, 2012, inventories consisted of the following:
2013 2012
Finished goods $ 640,355 $ 627,338
Health care supplies 195,519 154,840
Raw materials and purchased components 185,146 171,373
Work in process 76,084 83,258
Inventories $ 1,097,104 $ 1,036,809
Under the terms of certain unconditional purchase agreements, the Company is obligated to purchase
approximately $612,925 of materials, of which $337,027 is committed at December 31, 2013 for 2014. The
terms of these agreements run 1 to 7 years.
Healthcare supplies inventories at December 31, 2013 and 2012 included $33,294 and $29,704, respectively,
of Erythropoietin ("EPO"). On January 1, 2012, the Company entered into a three-year sourcing and supply
agreement with its EPO supplier.

FRESENIUS MEDICAL CARE AG & Co. KGaA
NOTES TO CONSOLIDATED FINANCIAL STATEMENTS
(in thousands, except share data)
F-22
5. Prepaid Expenses and Other Current Assets
At December 31, 2013 and 2012, prepaid expenses and other current assets consisted of the following:
2013 2012
Taxes Refundable $ 133,673 $ 149,536
Cost Report Receivable from Medicare and Medicaid 130,236 86,566
Receivables for supplier rebates 105,994 61,248
Other deferred charges 62,555 53,517
Prepaid rent 49,409 44,894
Leases receivable 48,538 46,198
Prepaid insurance 41,039 24,935
Payments on account 33,934 35,660
Amounts due from managed locations 22,676 17,298
Receivable for sale of investment to third party 21,846 16,527
Deposit / Guarantee / Security 19,212 20,903
Derivatives 16,664 31,235
Other 351,615 389,020
Total prepaid expenses and other current assets $ 1,037,391 $ 977,537
The other item in the table above includes interest receivables, notes receivables and loans to customers.
6. Property, Plant and Equipment
At December 31, 2013 and 2012, property, plant and equipment consisted of the following:
2013 2012
Land $ 46,689 $ 54,775
Buildings and improvements 2,432,824 2,257,002
Machinery and equipment 3,808,356 3,470,972
Machinery, equipment and rental equipment under capitalized leases 43,239 36,316
Construction in progress 267,653 256,401
6,598,761 6,075,466
Accumulated depreciation (3,506,807) (3,134,863)
Property, plant and equipment, net $ 3,091,954 $ 2,940,603
Depreciation expense for property, plant and equipment amounted to $555,125, $515,455 and $479,438 for
the years ended December 31, 2013, 2012, and 2011, respectively.
Included in machinery and equipment at December 31, 2013 and 2012 were $597,024 and $532,088,
respectively, of peritoneal dialysis cycler machines which the Company leases to customers with end-stage renal
disease on a month-to-month basis and hemodialysis machines which the Company leases to physicians under
operating leases.
Accumulated depreciation related to machinery, equipment and rental equipment under capital leases was
$21,201 and $19,027 at December 31, 2013 and 2012, respectively.

FRESENIUS MEDICAL CARE AG & Co. KGaA
NOTES TO CONSOLIDATED FINANCIAL STATEMENTS
(in thousands, except share data)
F-23
7. Intangible Assets and Goodwill
At December 31, 2013 and 2012, the carrying value and accumulated amortization of intangible assets other
than goodwill consisted of the following:
2013 2012
Gross Gross
Carrying Accumulated Carrying Accumulated
Amount Amortization Amount Amortization
Amortizable Intangible Assets
Non-compete agreements $ 325,335 $ (240,412) $ 317,080 $ (213,639)
Technology 106,510 (44,584) 107,696 (40,849)
Licenses and distribution
agreements 223,701 (112,697) 225,393 (98,757)
Customer Relationships 98,000 (650) - -
Self-developed software 105,087 (46,097) 72,328 (32,496)
Other 350,475 (264,031) 343,867 (246,239)
Construction in progress 39,570 - 57,677 -
$ 1,248,678 $ (708,471) $ 1,124,041 $ (631,980)
At December 31, 2013 and 2012 the carrying value of non-amortizable intangible assets other than goodwill
consisted of the following:
2013 2012
Carrying Carrying
Amount Amount
Non-amortizable Intangible Assets
Tradename $ 210,630 $ 209,712
Management contracts 7,039 8,343
$ 217,669 $ 218,055
Total Intangible Assets $ 757,876 $ 710,116
The amortization on intangible assets amounted to $93,100, $87,441 and $77,845 for the years ended
December 31, 2013, 2012, and 2011, respectively. The table shows the estimated amortization expense of these
assets for the following five years.
Estimated Amortization Expense
2014 $ 79,830
2015 $ 76,717
2016 $ 74,303
2017 $ 70,362
2018 $ 67,793
Goodwill
In 2013 and 2012, goodwill related to general manufacturing operations was reclassified from the North
America and International Segments to Corporate (see Note 24). For the purpose of goodwill impairment testing,
all corporate assets are allocated to the reporting units (see Note 1 e).
Changes in the carrying amount of goodwill are mainly a result of acquisitions and the impact of foreign
currency translations. During 2013 and 2012, the Company’s acquisitions consisted primarily of the acquisition

FRESENIUS MEDICAL CARE AG & Co. KGaA
NOTES TO CONSOLIDATED FINANCIAL STATEMENTS
(in thousands, except share data)
F-24
of clinics in the normal course of operations, the expansion of the laboratory business in 2013 and in 2012, the
Liberty Acquisition. The changes to goodwill in 2013 and 2012 are as follows:
North Segment
America International Total Corporate Total
Balance as of December 31, 2011 $ 7,314,622 $ 1,464,089 $ 8,778,711 $ 407,939 $ 9,186,650
Goodwill acquired, net of divestitures 2,172,181 21,106 2,193,287 - 2,193,287
Reclassifications - (5,188) (5,188) 5,188 -
Foreign Currency Translation
Adjustment 210 41,352 41,562 390 41,952
Balance as of December 31, 2012 $ 9,487,013 $ 1,521,359 $ 11,008,372 $ 413,517 $ 11,421,889
Goodwill acquired, net of divestitures 158,582 99,634 258,216 - 258,216
Reclassifications - (3,807) (3,807) 4,226 419
Foreign Currency Translation
Adjustment 52 (23,029) (22,977) 640 (22,337)
Balance as of December 31, 2013 $ 9,645,647 $ 1,594,157 $ 11,239,804 $ 418,383 $ 11,658,187
8. Other Assets and Notes Receivables
On August 12, 2013, FMCH made an investment-type transaction by providing a credit facility to a middle-
market dialysis provider in the amount of up to $200,000 to fund general corporate purposes. The transaction is
in the form of subordinated notes with a maturity date of July 4, 2020 (unless prepaid) and a payment-in-kind
(“PIK”) feature that will allow interest payments in the form of cash (at 10.75%) or PIK (at 11.75%). The PIK
feature, if used, allows for the addition of the accrued interest to the then outstanding principal. The collateral for
this loan is 100% of the equity interest in this middle-market dialysis provider. The availability period for
drawdowns on this loan is 18 months ending on February 12, 2015 and amounts drawn, whether repaid or
prepaid, cannot be re-borrowed. The Company assesses the recoverability of this investment based on quarterly
financial statements and other information obtained, used for an assessment of profitability and business plan
objectives, as well as by analyzing general economic and market conditions in which the provider operates. At
December 31, 2013, $170,000 had been drawn ($165,542, net of commitment and closing fees) with $3,097 of
interest income accrued. Interest is payable on a semi-annual basis for the length of the loan. The first interest
payment was due and received on October 31, 2013.
9. Accrued Expenses and Other Current Liabilities
At December 31, 2013 and 2012, accrued expenses and other current liabilities consisted of the following:
2013 2012
Accrued salaries, wages and incentive plan compensations $ 542,230 $ 481,920
Unapplied cash and receivable credits 302,337 198,834
Accrued insurance 201,346 187,254
Accrued interest 122,166 111,532
Special charge for legal matters 115,000 115,000
Accrued operating expenses 102,914 91,529
Withholding tax and VAT 93,407 96,157
Derivative financial instruments 25,701 26,578
Other 507,432 478,667
Total accrued expenses and other current liabilities $ 2,012,533 $ 1,787,471
In 2001, the Company recorded a $258,159 special charge to address legal matters relating to transactions
pursuant to the Agreement and Plan of Reorganization dated at February 4, 1996 by and between W.R. Grace &

FRESENIUS MEDICAL CARE AG & Co. KGaA
NOTES TO CONSOLIDATED FINANCIAL STATEMENTS
(in thousands, except share data)
F-25
Co. and Fresenius SE (the “Merger”), estimated liabilities and legal expenses arising in connection with the
W.R. Grace & Co. Chapter 11 proceedings (the “Grace Chapter 11 Proceedings”) and the cost of resolving
pending litigation and other disputes with certain commercial insurers. During the second quarter of 2003, the
court supervising the Grace Chapter 11 Proceedings approved a definitive settlement agreement entered into
among the Company, the committees representing the asbestos creditors and W.R. Grace & Co. Under the
settlement agreement, the Company had agreed to pay $115,000, without interest, upon plan confirmation. On
February 3, 2014, the plan was confirmed and became effective. The Company paid the $115,000 at that time.
All other matters included in the special charge have now been resolved (see Note 20).
Included in the other item in the table above are accruals for legal and compliance costs, physician
compensation, commissions, short-term portion of pension liabilities, bonuses and rebates, accrued rents, and
pending payments for purchase considerations for certain acquisitions.
10. Short-Term Borrowings and Short-Term Borrowings from Related Parties
Short-term Borrowings under lines of credit
Short-term borrowings of $96,648 and $117,850 at December 31, 2013 and 2012, respectively, represented
amounts borrowed by the Company’s subsidiaries under lines of credit with commercial banks. The average
interest rates on these borrowings at December 31, 2013 and 2012 were 4.00% and 4.93%, respectively.
Excluding amounts available under the 2012 Credit Agreement (see Note 11 below), at December 31, 2013
and 2012, the Company had $232,943 and $261,825 available under other commercial bank agreements. In some
instances, lines of credit are secured by assets of the Company’s subsidiary that is party to the agreement or may
require the Company’s guarantee. In certain circumstances, the subsidiary may be required to meet certain
covenants.
Short-term Borrowings from related parties
From time to time during each of the years presented, the Company received advances under the existing
loan agreements with Fresenius SE for those years. During the year ended December 31, 2013, the Company
received advances ranging from €3,200 to €99,946 with interest rates ranging from 1.363% to 1.541%. During
the year ended December 31, 2012, the Company received advances ranging from €8,300 to €196,400 with
interest rates ranging from 1.365% to 1.838%. For further information on short-term borrowings from related
party outstanding at December 31, 2013 and 2012, see Note 3 c. Annual interest expense on these borrowings
during the years presented was $547, $1,458 and $2,362 for the years 2013, 2012 and 2011, respectively.

FRESENIUS MEDICAL CARE AG & Co. KGaA
NOTES TO CONSOLIDATED FINANCIAL STATEMENTS
(in thousands, except share data)
F-26
11. Long-term Debt and Capital Lease Obligations and Long-term Debt from Related Parties
As of December 31, 2013 and December 31, 2012, long-term debt and capital lease obligations and long-
term debt from related parties consisted of the following:
December 31,
2013
December 31,
2012
2012 Credit Agreement $ 2,707,145 $ 2,659,340
Senior Notes 4,824,753 4,743,442
Euro Notes 46,545 51,951
European Investment Bank Agreements 193,074 324,334
Accounts receivable facility 351,250 162,000
Capital lease obligations 24,264 15,618
Other 111,259 163,802
Long-term debt and capital lease obligations 8,258,290 8,120,487
Less current maturities (511,370) (334,747)
Long-term debt and capital lease obligations, less current portion 7,746,920 7,785,740
Long-term debt from related parties - 56,174
Long-term debt and capital lease obligations and long-term debt from
related parties $ 7,746,920 $ 7,841,914
The Company’s long-term debt, all of which ranks equally in rights of payment, consists mainly of
borrowings related to its 2012 Credit Agreement, its Senior Notes, its Euro Notes, borrowings under its
European Investment Bank Agreements, borrowings under its accounts receivable facility (“A/R Facility”) and
certain other borrowings as follows:
2012 Credit Agreement
The Company entered into a $3,850,000 syndicated credit facility (the “2012 Credit Agreement”) with a
large group of banks and institutional investors (collectively, the “Lenders”) on October 30, 2012 which replaced
a prior credit agreement. The credit facility consists of:
a 5-year revolving credit facility of approximately $1,250,000 comprising a $400,000 multicurrency
revolving facility, a $200,000 revolving facility and a €500,000 revolving facility which will be due and
payable on October 30, 2017.
a 5-year term loan facility of originally $2,600,000, also scheduled to mature on October 30, 2017,
requiring 17 quarterly payments of $50,000 each, which began in the third quarter of 2013 that
permanently reduce the term loan facility. The remaining balance is due on October 30, 2017.
Interest on the credit facilities is, at the Company’s option, at a rate equal to either (i) LIBOR or EURIBOR
(as applicable) plus an applicable margin or (ii) the Base Rate as defined in the 2012 Credit Agreement plus an
applicable margin. At December 31, 2013, the dollar-denominated tranches outstanding under the 2012 Credit
Agreement had a weighted average interest rate of 2.00%. The euro-denominated tranche had an interest rate of
1.95%.
The applicable margin is variable and depends on the Company’s Consolidated Leverage Ratio which is a
ratio of its Consolidated Funded Debt less cash and cash equivalents held by the Consolidated Group to
Consolidated EBITDA (as these terms are defined in the 2012 Credit Agreement).
In addition to scheduled principal payments, indebtedness outstanding under the 2012 Credit Agreement
will be reduced by portions of the net cash proceeds received from certain sales of assets and the issuance of
certain additional debt.
Obligations under the 2012 Credit Agreement are secured by pledges of capital stock of certain material
subsidiaries in favor of the Lenders.

FRESENIUS MEDICAL CARE AG & Co. KGaA
NOTES TO CONSOLIDATED FINANCIAL STATEMENTS
(in thousands, except share data)
F-27
The 2012 Credit Agreement contains affirmative and negative covenants with respect to the Company and
its subsidiaries and other payment restrictions. Certain of the covenants limit indebtedness of the Company and
investments by the Company, and require the Company to maintain certain financial ratios defined in the
agreement. Additionally, the 2012 Credit Agreement provides for a limitation on dividends and other restricted
payments which is €330,000 ($455,103 based upon the December 31, 2013 spot rate) for dividends to be paid in
2014, and increases in subsequent years. In default, the outstanding balance under the 2012 Credit Agreement
becomes immediately due and payable at the option of the Lenders. The Company was in compliance with all
covenants at December 31, 2013.
The following table shows the available and outstanding amounts under the 2012 Credit Agreement at
December 31, 2013 and 2012:
Maximum Amount
Available
December 31, 2013
Balance Outstanding
December 31, 2013
Revolving Credit USD $ 600,000 $ 600,000 $ 138,190 $ 138,190
Revolving Credit EUR € 500,000 $ 689,550 € 50,000 $ 68,955
Term Loan A $ 2,500,000 $ 2,500,000 $ 2,500,000 $ 2,500,000
$ 3,789,550 $ 2,707,145
Maximum Amount
Available
December 31, 2012
Balance Outstanding
December 31, 2012
Revolving Credit USD $ 600,000 $ 600,000 $ 59,340 $ 59,340
Revolving Credit EUR € 500,000 $ 659,700 € - $ -
Term Loan A $ 2,600,000 $ 2,600,000 $ 2,600,000 $ 2,600,000
$ 3,859,700 $ 2,659,340
In addition, at December 31, 2013 and December 31, 2012, the Company had letters of credit outstanding in
the amount of $9,444 and $77,188, respectively, under the revolving credit facility, which are not included above
as part of the balance outstanding at those dates but which reduce available borrowings under the respective
revolving credit facility.

FRESENIUS MEDICAL CARE AG & Co. KGaA
NOTES TO CONSOLIDATED FINANCIAL STATEMENTS
(in thousands, except share data)
F-28
Senior Notes
At December 31, 2013, the Company’s Senior Notes consisted of the following:
Issuer/Transaction Face Amount Maturity Coupon Book value
FMC Finance VI S.A. 2010 € 250,000 July 15, 2016 5.50% $ 342,944
FMC Finance VIII S.A. 2011(1) € 100,000 October 15, 2016 3.73% $ 137,910
FMC US Finance, Inc. 2007 $ 500,000 July 15, 2017 6 7/8% $ 496,894
FMC Finance VIII S.A. 2011 € 400,000 September 15, 2018 6.50% $ 546,531
FMC US Finance II, Inc. 2011 $ 400,000 September 15, 2018 6.50% $ 396,297
FMC US Finance II, Inc. 2012 $ 800,000 July 31, 2019 5.625% $ 800,000
FMC Finance VIII S.A. 2012 € 250,000 July 31, 2019 5.25% $ 344,775
FMC US Finance, Inc. 2011 $ 650,000 February 15, 2021 5.75% $ 645,672
FMC Finance VII S.A. 2011 € 300,000 February 15, 2021 5.25% $ 413,730
FMC US Finance II, Inc. 2012 $ 700,000 January 31, 2022 5.875% $ 700,000
$ 4,824,753
(1) This note carries a variable interest rate which was 3.73% at December 31, 2013.
In January 2012, $800,000 and $700,000 of dollar-denominated senior notes and €250,000 ($344,775 at
December 31, 2013) of euro-denominated notes were issued at par. Both the $800,000 Senior Notes and the
€250,000 euro-denominated Senior Notes are due July 31, 2019 while the $700,000 Senior Notes are due
January 31, 2022. The proceeds were used for acquisitions and for general corporate purposes.
In October 2011, €100,000 ($137,910 at December 31, 2013) of floating rate senior notes were issued at par.
These floating rate senior notes are due October 15, 2016. Proceeds were used for acquisitions, to refinance
indebtedness and for general corporate purposes.
In September 2011, $400,000 of dollar-denominated senior notes and €400,000 ($546,531, net of discount,
at December 31, 2013) of euro-denominated senior notes were issued at an issue price of 98.623%. Both the
dollar- and euro-denominated senior notes have a coupon of 6.50% and a yield to maturity of 6.75% and mature
on September 15, 2018. Proceeds were used for acquisitions, to refinance indebtedness and for general corporate
purposes.
In February 2011, $650,000 of dollar-denominated senior notes and €300,000 ($413,730 at December 31,
2013) of euro-denominated senior notes were issued with coupons of 5.75% and 5.25%, respectively, at an issue
price of 99.060% and par, respectively. The dollar-denominated senior notes had a yield to maturity of 5.875%.
Both the dollar- and euro-denominated senior notes mature on February 15, 2021. Proceeds were used to repay
indebtedness for acquisitions and for general corporate purposes.
In January 2010, €250,000 ($342,944, net of discount, at December 31, 2013) of senior notes were issued
with a coupon of 5.50% at an issue price of 98.6636%. These senior notes had a yield to maturity of 5.75% and
are due July 15, 2016. Proceeds were used to repay short-term indebtedness and for general corporate purposes.
In June 2007, FMC Finance III S.A. (“FMC Finance III”) issued $500,000 6 7/8% Senior Notes due 2017
(the “6 7/8% Senior Notes”). The 6 7/8% Notes were issued with a coupon of 6 7/8% at a discount, resulting in
an effective interest rate of 7 1/8%. In June 2011, Fresenius Medical Care US Finance, Inc. acquired
substantially all of the assets of FMC Finance III and assumed all obligations of FMC Finance III under the 6
7/8% Notes and the related indenture. The guarantees of the Company and its subsidiaries, FMCH and Fresenius
Medical Care Deutschland GmbH (“D-GmbH”), (together, the “Guarantor Subsidiaries”) for the 6 7/8% Senior
Notes have not been amended and remain in full force and effect.
All Senior Notes are unsecured and guaranteed on a senior basis jointly and severally by the Company and
the Guarantor Subsidiaries. The issuers may redeem the Senior Notes (except for the Floating Rate Senior Notes)

FRESENIUS MEDICAL CARE AG & Co. KGaA
NOTES TO CONSOLIDATED FINANCIAL STATEMENTS
(in thousands, except share data)
F-29
at any time at 100% of principal plus accrued interest and a premium calculated pursuant to the terms of the
indenture. The holders have the right to request that the issuers repurchase the Senior Notes at 101% of principal
plus accrued interest upon the occurrence of a change of control of the Company followed by a decline in the
ratings of the respective Senior Notes.
The Company has agreed to a number of covenants to provide protection to the holders which, under certain
circumstances, limit the ability of the Company and its subsidiaries to, among other things, incur debt, incur
liens, engage in sale-leaseback transactions and merge or consolidate with other companies or sell assets. At
December 31, 2013, the Company was in compliance with all of its covenants under the Senior Notes.
Euro Notes
In April 2009, the Company issued euro-denominated notes (“Euro Notes”) totaling €200,000, which are
senior, unsecured and guaranteed by FMCH and D-GmbH, which originally consisted of 4 tranches having terms
of 3.5 and 5.5 years with floating and fixed interest rate tranches. At December 31, 2013, only 2 tranches remain
outstanding, which are due on April 27, 2014 and October 27, 2014. At December 31, 2013, the Company was
in compliance with all of its covenants under the Euro Notes. At December 31, 2013, the Euro Notes had an
outstanding balance of €33,750 ($46,545).
European Investment Bank Agreements
The Company entered into various credit agreements with the European Investment Bank (“EIB”) in 2005,
2006 and 2009. The EIB is a not-for-profit long-term lending institution of the European Union and lends funds
at favourable rates for the purpose of capital investment and R&D projects, normally for up to half of the funds
required for such projects.
Borrowings under the four EIB credit facilities available at December 31, 2013 and 2012 are shown below:
Balance outstanding
December 31,
Maturity 2013 2012
Revolving Credit 2013 $ - $ 90,812
Loan 2005 2013 - 48,806
Loan 2006 2014 124,119 118,746
Loan 2009 2014 68,955 65,970
$ 193,074 $ 324,334
While the EIB agreements were granted in euro, advances under the Revolving Credit, Loan 2005 and Loan
2006 could be denominated in certain foreign currencies, including U.S. dollars. As a result, the borrowings
under the Revolving Credit and Loan 2005 were drawn down in U.S. dollars, while the borrowings under Loan
2006 and Loan 2009 were drawn down in euro.
In 2013, both the Revolving Credit and Loan 2005 matured and have been repaid. The balances of the
remaining two loans outstanding on December 31, 2013 had been classified as Current portion of Long-term
debt and capital lease obligations and were repaid on their maturity on February 3, 2014 for the Loan 2006 and
February 17, 2014 for the Loan 2009.
Loans 2006 and 2009 had variable interest rates that changed quarterly. The borrowings under these loan
agreements had interest rates of 0.201% and 2.426% at December 31, 2013. At December 31, 2012, the dollar
borrowings had an interest rate of 0.438% and the euro borrowings had interest rates of 0.171% and 2.40%,
respectively.
Borrowings under the 2006 agreement were secured by bank guarantees while the 2009 agreement was
guaranteed by FMCH and D-GmbH. EIB agreements had customary covenants. At December 31, 2013, the
Company was in compliance with the respective covenants.
FRESENIUS MEDICAL CARE AG & Co. KGaA
NOTES TO CONSOLIDATED FINANCIAL STATEMENTS
(in thousands, except share data)
F-30
Accounts Receivable Facility
The Company refinanced the A/R Facility on January 17, 2013 for a term expiring on January 15, 2016 with
the available borrowings at $800,000. At December 31, 2013 there were outstanding borrowings under the A/R
Facility of $351,250. The Company also had letters of credit outstanding under the A/R Facility in the amount of
$65,622 at December 31, 2013. These letters of credit were not included above as part of the balance outstanding
at December 31, 2013; however, they reduced available borrowings under the A/R Facility.
Under the A/R Facility, certain receivables are sold to NMC Funding Corporation (“NMC Funding”), a
wholly-owned subsidiary. NMC Funding then assigns percentage ownership interests in the accounts receivable
to certain bank investors. Under the terms of the A/R Facility, NMC Funding retains the right, at any time, to
recall all the then outstanding transferred interests in the accounts receivable. Consequently, the receivables
remain on the Company’s Consolidated Balance Sheet and the proceeds from the transfer of percentage
ownership interests are recorded as long-term debt.
NMC Funding pays interest to the bank investors calculated based on the commercial paper rates for the
particular tranches selected. The average interest rate during 2013 was 1.044%. Refinancing fees, which include
legal costs and bank fees, are amortized over the term of the facility.
Other
At December 31, 2013 and 2012, in conjunction with certain acquisitions and investments, the Company had
pending payments of purchase considerations totaling approximately $94,084 and $142,229, respectively, of
which $60,036 and $75,266, respectively, were classified as the current portion of long-term debt.
Annual Payments
Aggregate annual payments applicable to the 2012 Credit Agreement, Senior Notes, Euro Notes, EIB
agreements, capital leases, the A/R Facility and other borrowings for the five years subsequent to December 31,
2013 and thereafter are:
2014 $ 511,370
2015 233,589
2016 1,038,599
2017 2,613,096
2018 953,423
Thereafter 2,926,290
$ 8,276,367
12. Employee Benefit Plans
General
FMC-AG & Co. KGaA recognizes pension costs and related pension liabilities for current and future
benefits to qualified current and former employees of the Company. The Company’s pension plans are structured
in accordance with the differing legal, economic and fiscal circumstances in each country. The Company
currently has two types of plans, defined benefit and defined contribution plans. In general, plan benefits in
defined benefit plans are based on all or a portion of the employees’ years of services and final salary. Plan
benefits in defined contribution plans are determined by the amount of contribution by the employee and the
employer, both of which may be limited by legislation, and the returns earned on the investment of those
contributions.
Upon retirement under defined benefit plans, the Company is required to pay defined benefits to former
employees when the defined benefits become due. Defined benefit plans may be funded or unfunded. The
Company has two major defined benefit plans, one funded plan in the U.S. and an unfunded plan in Germany.

FRESENIUS MEDICAL CARE AG & Co. KGaA
NOTES TO CONSOLIDATED FINANCIAL STATEMENTS
(in thousands, except share data)
F-31
Actuarial assumptions generally determine benefit obligations under defined benefit plans. The actuarial
calculations require the use of estimates. The main factors used in the actuarial calculations affecting the level of
the benefit obligations are: assumptions on life expectancy, the discount rate and future salary and benefit levels.
Under the Company’s funded plans, assets are set aside to meet future payment obligations. An estimated return
on the plan assets is recognized as income in the respective period. Actuarial gains and losses are generated
when there are variations in the actuarial assumptions and by differences between the actual and the estimated
projected benefits obligations and the return on plan assets for that year. The Company’s pension liability is
impacted by these actuarial gains or losses.
Under defined contribution plans, the Company pays defined contributions to an independent third party as
directed by the employee during the employee’s service life, which satisfies all obligations of the Company to
the employee. The employee retains all rights to the contributions made by the employee and to the vested
portion of the Company paid contributions upon leaving the Company. The Company has a defined contribution
plan in the U.S.
Defined Benefit Pension Plans
During the first quarter of 2002 FMCH, the Company’s U.S. subsidiary, curtailed its defined benefit and
supplemental executive retirement plans. Under the curtailment amendment for substantially all employees
eligible to participate in the plan, benefits have been frozen as of the curtailment date and no additional defined
benefits for future services will be earned. The Company has retained all employee benefit obligations as of the
curtailment date. Each year FMCH contributes at least the minimum amount required by the Employee
Retirement Income Security Act of 1974, as amended. In 2013, FMCH’s minimum funding requirement was
$6,100. In addition to the compulsory contributions, the Company voluntarily provided $5,239 to the defined
benefit plan. Expected funding for 2014 is $42,585.
The benefit obligation for all defined benefit plans at December 31, 2013, was $660,860 (2012: $655,447)
which consists of the gross benefit obligation of $378,170 (2012: $423,509) for the U.S. plan, which is funded
by plan assets, and the benefit obligation of $282,690 (2012: $231,938) for the German unfunded plan.
The following table shows the changes in benefit obligations, the changes in plan assets, the funded status of
the pension plans and the net pension liability. Benefits paid as shown in the changes in benefit obligations
represent payments made from both the funded and unfunded plans while the benefits paid as shown in the
changes in plan assets include only benefit payments from the Company’s funded benefit plan.

FRESENIUS MEDICAL CARE AG & Co. KGaA
NOTES TO CONSOLIDATED FINANCIAL STATEMENTS
(in thousands, except share data)
F-32
2013 2012
Change in benefit obligation:
Benefit obligation at beginning of year $ 655,447 $ 512,745
Foreign currency translation 11,998 4,955
Other Adjustments 2,203 -
Service cost 15,900 10,704
Interest cost 26,859 26,194
Transfer of plan participants (32) (68)
Actuarial (gain) loss (34,698) 122,800
Benefits paid (16,817) (21,883)
Benefit obligation at end of year $ 660,860 $ 655,447
Change in plan assets:
Fair value of plan assets at beginning of year $ 228,393 $ 218,990
Actual return on plan assets 23,058 18,356
Employer contributions 11,339 10,804
Benefits paid (14,295) (19,757)
Fair value of plan assets at end of year $ 248,495 $ 228,393
Funded status at end of year $ 412,365 $ 427,054
Benefit plans offered by other subsidiaries $ 29,321 $ 35,798
Net Pension Liability $ 441,686 $ 462,852
The Company had a pension liability of $412,365 and $427,054 at December 31, 2013 and 2012,
respectively. The pension liability consists of a current portion of $4,221 (2012: $3,693) which is recognized as a
current liability in the line item “Accrued expenses and other current liabilities” in the balance sheet. The non-
current portion of $408,144 (2012: $423,361) is recorded as non-current pension liability in the balance sheet.
Approximately 80% of the beneficiaries are located in the U.S. with the majority of the remaining 20% located
in Germany.
The accumulated benefit obligation for all defined benefit pension plans was $614,576 and $616,572 at
December 31, 2013 and 2012, respectively. The accumulated benefit obligation for all defined benefit pension
plans with an obligation in excess of plan assets was $614,576 and $616,572 at December 31, 2013 and 2012,
respectively; the related plan assets had a fair value of $248,495 and $228,393 at December 31, 2013 and 2012,
respectively.
Benefit plans offered by other subsidiaries outside of the U.S. and Germany contain separate benefit
obligations. The total net pension liability for these other plans was $29,321 and $35,798 at December 31, 2013 and 2012 respectively and consists of a pension asset of $77 (2012: $74) recognized as “Other non-current assets
and notes receivables” and a current pension liability of $1,684 (2012: $1,560), which is recognized as a current
liability in the line item “Accrued expenses and other current liabilities”. The non-current pension liability of
$27,714 (2012: $34,312) for these plans is recorded as “non-current pension liability” in the balance sheet.
At December 31, 2013 the weighted average duration of the defined benefit obligation was 18 years (2012:
18 years).
The table below reflects pre-tax effects of actuarial losses (gains) in other comprehensive income (“OCI”)
relating to pension liabilities. At December 31, 2013, there are no cumulative effects of prior service costs
included in other comprehensive income.

FRESENIUS MEDICAL CARE AG & Co. KGaA
NOTES TO CONSOLIDATED FINANCIAL STATEMENTS
(in thousands, except share data)
F-33
Actuarial
(gains) losses
Actuarial (gains) losses recognized in OCI at December 31, 2010 $ 102,872
Actuarial (gain) loss for the year 91,693
Amortization of unrealized losses (8,737)
Foreign currency translation (1,050)
Actuarial (gains) losses recognized in OCI at December 31, 2011 $ 184,778
Actuarial (gain) loss for the year $ 119,685
Amortization of unrealized losses (18,334)
Foreign currency translation 1,827
Actuarial (gains) losses recognized in OCI at December 31, 2012 $ 287,956
Actuarial (gain) loss for the year $ (44,118)
Other Adjustments 563
Amortization of unrealized losses (25,418)
Foreign currency translation 3,984
Actuarial (gains) losses recognized in OCI at December 31, 2013 $ 222,967
The actuarial loss expected to be amortized from other comprehensive income into net periodic pension cost
over the next year is $16,541.
The discount rates for all plans are based upon yields of portfolios of equity and highly rated debt
instruments with maturities that mirror the plan’s benefit obligation. The Company’s discount rates at December
31, 2012 and at December 31, 2013 are the weighted average of these plans based upon their benefit obligations.
The following weighted-average assumptions were utilized in determining benefit obligations at December 31:
in % 2013 2012
Discount rate 4.55 4.14
Rate of compensation increase 3.29 3.32
Sensitivity analysis
Increases and decreases in principal actuarial assumptions by 0,5 percentage points would affect the pension
liability at December 31, 2013 as follows:
0.5% increase 0.5% decrease
Discount rate $ (54,247) $ 62,866
Rate of compensation increase 7,230 (7,159)
Rate of pensions increase 18,573 (16,893)
The sensitivity analysis was calculated based on the average duration of the pension obligations determined
at December 31, 2013. The calculations were performed isolated for each significant actuarial parameter, in
order to show the effect on the fair value of the pension liability separately.
The sensitivity analysis for compensation increases and for pension increases excludes the U.S. pension plan
because it is frozen and therefore is not affected by changes from these two actuarial assumptions.
The defined benefit pension plans’ net periodic benefit costs are comprised of the following components for
each of the years ended December 31:

FRESENIUS MEDICAL CARE AG & Co. KGaA
NOTES TO CONSOLIDATED FINANCIAL STATEMENTS
(in thousands, except share data)
F-34
2013 2012 2011
Components of net periodic benefit cost:
Service cost $ 15,900 $ 10,704 $ 10,625
Interest cost 26,859 26,194 24,822
Expected return on plan assets (13,638) (15,241) (17,750)
Amortization of unrealized losses 25,418 18,334 8,737
Net periodic benefit costs $ 54,539 $ 39,991 $ 26,434
Net periodic benefit cost is allocated as personnel expense within costs of revenues, selling, general and
administrative expense or research and development expense. This is depending upon the area in which the
beneficiary is employed.
The following weighted-average assumptions were used in determining net periodic benefit cost for the year
ended December 31:
in % 2013 2012 2011
Discount rate 4.14 5.10 5.70
Expected return of plan assets 6.00 7.00 7.50
Rate of compensation increase 3.32 3.69 4.00
Expected benefit payments for the next five years and in the aggregate for the five years thereafter are as
follows:
2014 $ 17,824
2015 19,294
2016 21,041
2017 22,963
2018 24,542
2019 - 2023 156,106

FRESENIUS MEDICAL CARE AG & Co. KGaA
NOTES TO CONSOLIDATED FINANCIAL STATEMENTS
(in thousands, except share data)
F-35
Plan Assets
The following table presents the fair values of the Company´s pension plan assets at December 31, 2013 and
2012.
Fair Value Measurements at
December 31, 2013 Fair Value Measurements at
December 31, 2012
Quoted
Prices in
Active
Markets for
Identical
Assets
Significant
Observable
Inputs
Quoted
Prices in
Active
Markets for
Identical
Assets
Significant
Observable
Inputs
Asset Category Total (Level 1) (Level 2) Total (Level 1) (Level 2)
Equity Investments
Index Funds(1) $ 62,003 $ 205 $ 61,798 $ 58,511 $ - $ 58,511
Fixed Income Investments
Government Securities(2) 4,913 3,735 1,178 9,859 8,504 1,355
Corporate Bonds(3) 155,389 - 155,389 152,332 - 152,332
Other Bonds(4) 1,437 - 1,437 457 - 457
U.S. Treasury Money Market Funds(5) 19,150 19,150 - 2,975 2,975 -
Other types of investments
Cash, Money Market and Mutual
Funds(6) 5,603 5,603 - 4,259 4,259 -
Total $ 248,495 $ 28,693 $ 219,802 $ 228,393 $ 15,738 $ 212,655
(1) This category comprises low-cost equity index funds not actively managed that track the S&P 500, S&P 400, Russell 2000, MSCI Emerging Markets Index
and the Morgan Stanley International EAFE Index
(2) This Category comprises fixed income investments by the U.S. government and government sponsored entities
(3) This Category primarily represents investment grade bonds of U.S. issuers from diverse industries
(4) This Category comprises private placement bonds as well as collateralized mortgage obligations
(5) This Category represents funds that invest in treasury obligations directly or in treasury backed obligations
(6) This Category represents cash, money market funds as well as mutual funds comprised of high grade corporate bonds
The methods and inputs used to measure the fair value of plan assets are as follows:
Common stocks are valued at their market prices at the balance sheet date.
Index funds are valued based on market quotes.
Government bonds are valued based on both market prices and market quotes.
Corporate bonds and other bonds are valued based on market quotes at the balance sheet date.
Cash is stated at nominal value which equals the fair value.
U.S. Treasury money market funds as well as other money market and mutual funds are valued at their
market price.
Plan Investment Policy and Strategy
For the U.S. funded plan, the Company periodically reviews the assumption for long-term expected return
on pension plan assets. As part of the assumptions review, a range of reasonable expected investment returns for
the pension plan as a whole was determined based on an analysis of expected future returns for each asset class
weighted by the allocation of the assets. The range of returns developed relies both on forecasts, which include
the actuarial firm's expected long-term rates of return for each significant asset class or economic indicator, and
on broad-market historical benchmarks for expected return, correlation, and volatility for each asset class. As a
result, the Company’s expected rate of return on pension plan assets was 6.00% for 2013.

FRESENIUS MEDICAL CARE AG & Co. KGaA
NOTES TO CONSOLIDATED FINANCIAL STATEMENTS
(in thousands, except share data)
F-36
The Company´s overall investment strategy is to achieve a mix of approximately 96% of investments for
long-term growth and 4% for near-term benefit payments with a wide diversification of asset types, fund
strategies and fund managers.
The investment policy, utilizing a revised target investment allocation of 30% equity and 70% long-term
U.S. bonds, considers that there will be a time horizon for invested funds of more than 5 years. The total
portfolio will be measured against a policy index that reflects the asset class benchmarks and the target asset
allocation. The Plan policy does not allow investments in securities of the Company or other related party
securities. The performance benchmarks for the separate asset classes include: S&P 500 Index, S&P 400 Index,
Russell 2000 Growth Index, MSCI EAFE Index, MSCI Emerging Markets Index, Barclays Capital Long Term
Government Index and Barclays Capital US Strips 20+ Year Index.
Defined Contribution Plans
Most FMCH employees are eligible to join a 401(k) savings plan. Employees can deposit up to 75% of their
pay up to a maximum of $17.5 if under 50 years old ($23 if 50 or over) under this savings plan. The Company
will match 50% of the employee deposit up to a maximum Company contribution of 3% of the employee’s pay.
The Company’s total expense under this defined contribution plan for the years ended December 31, 2013, 2012,
and 2011, was $38,999, $38,582 and $33,741, respectively.
13. Noncontrolling Interests Subject to Put Provisions
The Company has potential obligations to purchase the noncontrolling interests held by third parties in
certain of its consolidated subsidiaries. These obligations are in the form of put provisions and are exercisable
at the third-party owners’ discretion within specified periods as outlined in each specific put provision. If these
put provisions were exercised, the Company would be required to purchase all or part of third -party owners’
noncontrolling interests at the appraised fair value at the time of exercise. The methodology the Company
uses to estimate the fair values of the noncontrolling interest subject to put provisions assumes the greater of net
book value or a multiple of earnings, based on historical earnings, development stage of the underlying business
and other factors. The estimated fair values of the noncontrolling interests subject to these put provisions can
also fluctuate and the implicit multiple of earnings at which these noncontrolling interest obligations may ultimately
be settled could vary significantly from our current estimates depending upon market conditions.
At December 31, 2013 and December 31, 2012 the Company’s potential obligations under these put options
were $648,251 and $523,260, respectively, of which, at December 31, 2013, put options with an aggregate
purchase obligation of $275,468 were exercisable. In the last three fiscal years ending December 31, 2013, three
such put provisions have been exercised for a total consideration of $7,105.
The following is a roll forward of noncontrolling interests subject to put provisions for the years ended
December 31, 2013, 2012 and 2011:
2013 2012 2011
Beginning balance at January 1, $ 523,260 $ 410,491 $ 279,709
Contributions to noncontrolling interests (122,179) (114,536) (43,104)
Purchase/ sale of noncontrolling interests 6,723 134,643 37,786
Contributions from noncontrolling interests 17,767 16,565 7,222
Changes in fair value of noncontrolling interests 108,575 (18,880) 86,233
Net income 113,156 94,718 42,857
Other comprehensive income (loss) 949 259 (212)
Ending balance at December 31, $ 648,251 $ 523,260 $ 410,491

FRESENIUS MEDICAL CARE AG & Co. KGaA
NOTES TO CONSOLIDATED FINANCIAL STATEMENTS
(in thousands, except share data)
F-37
14. Shareholders' Equity
Capital Stock
The General Partner has no equity interest in the Company and, therefore, does not participate in either the
assets or the profits and losses of the Company. However, the General Partner is compensated for all outlays in
connection with conducting the Company's business, including the remuneration of members of the management
board and the supervisory board (see Note 3).
The general meeting of a partnership limited by shares may approve Authorized Capital (genehmigtes
Kapital). The resolution creating Authorized Capital requires the affirmative vote of a majority of three quarters
of the capital represented at the vote and may authorize the management board to issue shares up to a stated
amount for a period of up to five years. The nominal value of any proposed increase of the Authorized Capital
may not exceed half of the issued capital stock at the time of the authorization.
In addition, the general meeting of a partnership limited by shares may create Conditional Capital (bedingtes
Kapital) for the purpose of issuing (i) shares to holders of convertible bonds or other securities which grant a
right to shares, (ii) shares as the consideration in a merger with another company, or (iii) shares offered to
management or employees. In each case, the authorizing resolution requires the affirmative vote of a majority of
three quarters of the capital represented at the vote. The nominal value for any proposed increase of the
Conditional Capital may not exceed half or, in the case of Conditional Capital created for the purpose of issuing
shares to management and employees, 10% of the Company’s issued capital at the time of the resolution.
All resolutions increasing the capital of a partnership limited by shares also require the consent of the
General Partner for their effectiveness.
During the Annual General Meeting (“AGM”) and the Preference Shareholder Meeting held on May 16,
2013, resolutions were passed on the conversion of the Company’s preference shares to ordinary shares. The
preference share conversion was effected on June 28, 2013 with 3,975,533 preference shares in the amount of
€3,976 ($4,465) converted on a 1:1 basis to ordinary shares. In addition, 32,006 options associated with the
preference shares were converted into options associated with ordinary shares. At the time of preference share
conversion, there were no dividend arrearages.
On July 5, 2013, the Company received a €27,000 ($34,784) premium from the largest former preference
shareholder, a European financial institution, for the conversion of their preference shares to ordinary shares.
This amount was recorded as an increase in equity.
Authorized Capital
By resolution of the AGM on May 11, 2010, the General Partner was authorized, with the approval of the
supervisory board, to increase, on one or more occasions, the Company’s share capital until May 10, 2015 up to
a total of €35,000 through issue of new bearer ordinary shares for cash contributions, “Authorized
Capital 2010/I”. Additionally, the newly issued shares may be taken up by financial institutions nominated by
the General Partner with the obligation to offer them to the shareholders of the Company (indirect pre-emption
rights). The General Partner is entitled, subject to the approval of the supervisory board, to exclude the pre-
emption rights of the shareholders. However, such an exclusion of pre-emption rights will be permissible for
fractional amounts. No Authorized Capital 2010/I has been issued at December 31, 2013.
In addition, by resolution of the AGM of shareholders on May 11, 2010, the General Partner was authorized,
with the approval of the supervisory board, to increase, on one or more occasions, the share capital of the
Company until May 10, 2015 up to a total of €25,000 through the issue of new bearer ordinary shares for cash
contributions or contributions in kind, “Authorized Capital 2010/II”. The General Partner is entitled, subject to
the approval of the supervisory board, to exclude the pre-emption rights of the shareholders. However, such
exclusion of pre-emption rights will be permissible only if (i) in case of a capital increase against cash
contributions, the nominal value of the issued shares does not exceed 10% of the nominal share value of the
Company’s share capital and the issue price for the new shares is at the time of the determination by the General
Partner not significantly lower than the stock price in Germany of the existing listed shares of the same class and
with the same rights or, (ii) in case of a capital increase against contributions in kind, the purpose of such

FRESENIUS MEDICAL CARE AG & Co. KGaA
NOTES TO CONSOLIDATED FINANCIAL STATEMENTS
(in thousands, except share data)
F-38
increase is to acquire an enterprise, parts of an enterprise or an interest in an enterprise. No Authorized Capital
2010/II has been issued at December 31, 2013.
Authorized Capital 2010/I and Authorized Capital 2010/II became effective upon registration with the
commercial register of the local court in Hof an der Saale on May 25, 2010.
Conditional Capital
By resolution of the Company’s AGM on May 12, 2011, the Company’s share capital was conditionally
increased with regards to the 2011 Stock Option Plan (“2011 SOP”) by up to €12,000 subject to the issue of up
to twelve million non-par value bearer ordinary shares with a nominal value of €1.00 each. For further
information, see Note 17.
By resolution of the Company’s AGM on May 9, 2006, as amended by the AGM on May 15, 2007,
resolving a three-for-one share split, the Company’s share capital was conditionally increased by up to €15,000
corresponding to 15 million ordinary shares with no par value and a nominal value of €1.00. This Conditional
Capital increase can only be effected by the exercise of stock options under the Company’s Stock Option Plan
2006 with each stock option awarded exercisable for one ordinary share (see Note 17). The Company has the
right to deliver ordinary shares that it owns or purchases in the market in place of increasing capital by issuing
new shares.
Through the Company’s other employee participation programs, the Company has issued convertible bonds
and stock option/subscription rights (Bezugsrechte) to employees and the members of the Management Board of
the General Partner and employees and members of management of affiliated companies that entitle these
persons to receive shares. At December 31, 2013, 10,790,755 convertible bonds or options remained outstanding
with a remaining average term of 4.83 years under these programs. For the year ending December 31, 2013,
2,282,639 options had been exercised under these employee participation plans (see Note 17).
As the result of the Company’s three-for-one stock split for both then-outstanding preference and ordinary
shares, which was approved by the shareholders at the AGM on May 15, 2007, on June 15, 2007 the Company’s
Conditional Capital was increased by $6,557 (€4,454). Conditional Capital available for all programs at
December 31, 2013 is $32,364 (€23,467) which includes $16,549 (€12,000) for the 2011 SOP, $10,425 (€7,559)
for the 2006 Plan and $5,390 (€3,908) for the 2001 Plan (see Note 17).
Treasury Stock
By resolution of the Company’s AGM on May 12, 2011, the Company was authorized to conduct a share
buy-back program to repurchase ordinary shares. On April 4, 2013, the Company issued an ad hoc
announcement of a share buy-back program in the aggregate value of up to €385,000 (approximately $500,000).
The buy-back started on May 20, 2013 and was completed on August 14, 2013 after 7,548,951 shares had been
repurchased in the amount of €384,966 ($505,014). These shares are restricted treasury stock which means there
are no associated dividends or voting rights. These treasury shares will be used solely to either reduce the
registered share capital of the Company by cancellation of the acquired shares, or to fulfill employee
participation programs of the Company.
The following tabular disclosure provides the monthly detail of shares repurchased during the buy-back
program, which ended on August 14, 2013:

FRESENIUS MEDICAL CARE AG & Co. KGaA
NOTES TO CONSOLIDATED FINANCIAL STATEMENTS
(in thousands, except share data)
F-39
Period
Average price paid per
share
Total number of shares
purchased as part of
publicly announced
plans or programs
Total Value of Shares
Repurchased
in € in $(1)
in €(3)
in $(2), (3)
in thousands
May 2013 52.96 68.48 1,078,255 57,107 73,842
June 2013 53.05 69.95 2,502,552 132,769 175,047
July 2013 49.42 64.63 2,972,770 146,916 192,124
August 2013 48.40 64.30 995,374 48,174 64,001
Total 51.00 66.90 7,548,951 384,966 505,014
(1) The dollar value is calculated using the daily exchange rate for the share repurchases made during the month.
(2) The value of the shares repurchased in Dollar is calculated using the total value of the shares purchased in Euro converted using the daily
exchange rate for the transactions.
(3) This amount is inclusive of fees (net of taxes) paid in the amount of approximately $106 (€81) for services rendered.
Dividends
Under German law, the amount of dividends available for distribution to shareholders is based upon the
unconsolidated retained earnings of Fresenius Medical Care AG & Co. KGaA as reported in its balance sheet
determined in accordance with the German Commercial Code (Handelsgesetzbuch). In addition, the payment of
dividends by FMC-AG & Co. KGaA is subject to limitations under the 2012 Credit Agreement (see Note 11).
Cash dividends of $296,134 for 2012 in the amount of €0.77 per then-outstanding preference share and
€0.75 per ordinary share were paid on May 17, 2013.
Cash dividends of $271,733 for 2011 in the amount of €0.71 per preference share and €0.69 per ordinary
share were paid on May 11, 2012.
Cash dividends of $280,649 for 2010 in the amount of €0.67 per preference share and €0.65 per ordinary
share were paid on May 13, 2011.
15. Sources of Revenue
Below is a table showing the sources of our U.S. patient service revenue (net of contractual allowance and
discounts but before patient service bad debt provision), included in the Company’s dialysis care revenue, for the
years ended December 31, 2013 and 2012. Outside of the U.S., the Company does not recognize patient service
revenue at the time the services are rendered without assessing the patient’s ability to pay. Accordingly, the
additional disclosure requirements introduced with ASU 2011-07 only apply to the U.S. patient service revenue.
2013 2012
Medicare ESRD program $ 4,411,285 $ 4,029,773
Private/alternative payors 3,841,473 3,605,081
Medicaid and other government sources 392,908 474,520
Hospitals 411,340 400,791
Total patient service revenue $ 9,057,006 $ 8,510,165

FRESENIUS MEDICAL CARE AG & Co. KGaA
NOTES TO CONSOLIDATED FINANCIAL STATEMENTS
(in thousands, except share data)
F-40
16. Earnings Per Share
The following table contains reconciliations of the numerators and denominators of the basic and diluted
earnings per ordinary share computations for 2013, 2012 and 2011:
2013 2012 2011
Numerators:
Net income attributable to shareholders of FMC-AG & Co.
KGaA $ 1,109,890 $ 1,186,809 $ 1,071,154
less:
Dividend preference on Preference shares(a) - 102 110
Income available to all classes of shares $ 1,109,890 $ 1,186,707 $ 1,071,044
Denominators:
Weighted average number of:
Ordinary shares outstanding 301,877,303 301,139,652 299,012,744
Preference shares outstanding 1,937,819 3,969,307 3,961,617
Total weighted average shares outstanding 303,815,122 305,108,959 302,974,361
Potentially dilutive Ordinary shares 673,089 1,761,064 1,795,743
Potentially dilutive Preference shares(a) - 16,851 20,184
Total weighted average Ordinary shares outstanding
assuming dilution 302,550,392 302,900,716 300,808,487
Total weighted average Preference shares outstanding
assuming dilution 1,937,819 3,986,158 3,981,801
Basic earnings per share $ 3.65 $ 3.89 $ 3.54
Fully diluted earnings per share $ 3.65 $ 3.87 $ 3.51
(a) As of the preference share conversion on June 28th, 2013, the Company no longer has two classes of shares.
17. Stock Options
In connection with its equity-settled stock option programs, the Company incurred compensation expense of
$13,593, $26,476 and $29,071 for the years ending December 31, 2013, 2012, and 2011, respectively. There
were no capitalized compensation costs in any of the three years presented. The Company also recorded a related
deferred income tax of $3,828, $6,854 and $8,195 for the years ending December 31, 2013, 2012, and 2011,
respectively.
Stock Options and other Share-Based Plans
At December 31, 2013, the Company has various stock-based compensation plans as follows:
Fresenius Medical Care AG & Co. KGaA Long Term Incentive Program 2011
On May 12, 2011, the Fresenius Medical Care AG & Co. KGaA Stock Option Plan 2011 (“2011 SOP”) was
established by resolution of the Company’s AGM. The 2011 SOP, together with the Phantom Stock Plan 2011,
which was established by resolution of the General Partner’s Management and Supervisory Boards, forms the
Company’s Long Term Incentive Program 2011 (“2011 Incentive Program”). Under the 2011 Incentive
Program, participants may be granted awards, which will consist of a combination of stock options and phantom
stock. Awards under the 2011 Incentive Program will be granted over a five year period and can be granted on
the last Monday in July and/or the first Monday in December each year. Prior to the respective grants,
participants will be able to choose how much of the granted value is granted in the form of stock options and

FRESENIUS MEDICAL CARE AG & Co. KGaA
NOTES TO CONSOLIDATED FINANCIAL STATEMENTS
(in thousands, except share data)
F-41
phantom stock in a predefined range of 75:25 to 50:50, stock options vs. phantom stock. The number of phantom
shares that plan participants may choose to receive instead of stock options within the aforementioned predefined
range is determined on the basis of a fair value assessment pursuant to a binomial model. With respect to grants
made in July, this fair value assessment will be conducted on the day following the Company’s AGM and with
respect to the grants made in December, on the first Monday in October. Awards under the 2011 Incentive
Program are subject to a four-year vesting period. Vesting of the awards granted is subject to achievement of
performance targets. The 2011 Incentive Program was established with a conditional capital increase up to
€12,000 subject to the issue of up to twelve million non-par value bearer ordinary shares with a nominal value of
€1.00, each of which can be exercised to obtain one ordinary share.
The Management Board, members of the management boards of the Company’s affiliated companies and
the managerial staff members of the Company and of certain affiliated companies are entitled to participate in
the 2011 Incentive Program. With respect to participants who are members of the Management Board, the
General Partner’s Supervisory Board has sole authority to grant awards and exercise other decision making
powers under the 2011 Incentive Program (including decisions regarding certain adjustments and forfeitures).
The General Partner has such authority with respect to all other participants in the 2011 Incentive Program.
The exercise price of stock options granted under the 2011 Incentive Program shall be the average stock
exchange price on the Frankfurt Stock Exchange of the Company’s shares during the 30 calendar days
immediately prior to each grant date. Stock options granted under the 2011 Incentive Program have an eight-year
term and can be exercised only after a four-year vesting period. Stock options granted under the 2011 Incentive
Program to U.S. participants are non-qualified stock options under the United States Internal Revenue Code of
1986, as amended. Options under the 2011 Incentive Program are not transferable by a participant or a
participant’s heirs, and may not be pledged, assigned, or disposed of otherwise.
Phantom stock awards under the 2011 Incentive Program entitle the holders to receive payment in Euro from
the Company upon exercise of the phantom stock. The payment per phantom share in lieu of the issuance of such
stock shall be based upon the share price on the Frankfurt Stock Exchange of one of the Company’s shares on
the exercise date. Phantom stock awards have a five-year term and can be exercised only after a four-year
vesting period, beginning with the grant date, however a shorter period may apply for certain exceptions. For
participants who are U.S. tax payers, the phantom stock is deemed to be exercised in any event in the month of
March following the end of the vesting period.
During 2013, under the 2011 Incentive Program, the Company awarded 2,141,076 stock options, including
328,680 stock options granted to the Management Board, at an average exercise price of $68.61 (€49.75), an
average fair value of $11.88 each and a total fair value of $25,431 which will be amortized over the four-year
vesting period. The Company also awarded 186,392 shares of phantom stock, including 25,006 shares of
phantom stock granted to members of the Management Board at a measurement date average fair value of
$66.50 (€48.22) each and a total fair value of $12,395, which will be revalued if the fair value changes, and
amortized over the four-year vesting period.
During 2012, the Company awarded 2,166,035 stock options under the 2011 Incentive Program, including
310,005 stock options granted to the Management Board at an average exercise price of $75.41 (€57.15), an
average fair value of $15.48 each and a total fair value of $33,538, which will be amortized over the four-year
vesting period. The Company awarded 178,729 phantom shares, including 23,407 phantom shares granted to the
Management Board at a measurement date average fair value of $64.58 (€48.95) each and a total fair value of
$11,543 which will be revalued if the fair value changes, and amortized over the four year vesting period.
Incentive plan
In 2013, the Management Board was eligible for performance–related compensation that depended upon
achievement of targets. The targets are measured by reference to operating income margin, net income growth
and free cash flow (net cash provided by operating activities after capital expenditures before acquisitions and
investments) in percentage of revenue, and are derived from the comparison of targeted and actually achieved
current year figures. Targets are divided into Group level targets and those to be achieved in individual regions
and areas of responsibility.
Performance-related bonuses for fiscal year 2013 will consist proportionately of a cash component and a
share-based component which will be paid in cash. Upon meeting the annual targets, the cash component will be
paid after the end of 2013. The share-based component is subject to a three- or four-year vesting period, although

FRESENIUS MEDICAL CARE AG & Co. KGaA
NOTES TO CONSOLIDATED FINANCIAL STATEMENTS
(in thousands, except share data)
F-42
a shorter period may apply in special cases. The amount of cash for the payment relating to the share-based
component shall be based on the closing share price of Fresenius Medical Care AG & Co. KGaA ordinary shares
upon exercise. The amount of the achievable bonus for each of the members of the Management Board is
capped.
Share-based compensation incurred under this plan for years 2013, 2012 and 2011 was $1,110, $2,751 and
$2,306, respectively.
Fresenius Medical Care AG & Co. KGaA Stock Option Plan 2006
The Fresenius Medical Care AG & Co. KGaA Stock Option Plan 2006 (“Amended 2006 Plan”) was
established with a conditional capital increase up to €12,800, subject to the issue of up to five million non-par
value bearer ordinary shares with a nominal value of €1.00, each of which can be exercised to obtain one
ordinary share. In connection with the share split affected in 2007, the principal amount was adjusted to the same
proportion as the share capital out of the capital increase up to €15,000 by the issue of up to 15 million new non-
par value bearer ordinary shares. After December 2010, no further grants were issued under the Amended 2006
Plan. Options granted under this plan are exercisable through December 2017.
Options granted under the Amended 2006 Plan to US participants are non-qualified stock options under the
United States Internal Revenue Code of 1986, as amended. Options under the Amended 2006 Plan are not
transferable by a participant or a participant’s heirs, and may not be pledged, assigned, or otherwise disposed of.
Fresenius Medical Care 2001 International Stock Option Plan
Under the Fresenius Medical Care 2001 International Stock Incentive Plan (the “2001 Plan”), options in the
form of convertible bonds with a principal of up to €10,240 were issued to the Management Board and other
employees of the Company representing grants for up to 4 million non-voting preference shares. The convertible
bonds originally had a par value of €2.56 and bear interest at a rate of 5.5%. In connection with the share split
affected in 2007, the principal amount was adjusted in the same proportion as the share capital out of the capital
increase and the par value of the convertible bonds was adjusted to €0.85 without affecting the interest rate.
Based on the resolution of the Annual General Meeting and the separate Meeting of the Preference
Shareholders on May 16, 2013 regarding the conversion of all preference shares into ordinary shares, the 2001
Plan was amended accordingly. The partial amount of the capital increase which was formerly referred to as the
issuance of bearer preference shares will now be referred exclusively to the issuance of bearer ordinary shares.
Effective May 2006, no further grants can be issued under the 2001 Plan and no options were granted under
this plan after 2005. The outstanding options will expire before 2016.
Additional stock option plans information
At December 31, 2013, the Management Board held 1,993,305 stock options and employees of the
Company held 8,797,450 stock options under the various stock-based compensation plans of the Company. No
stock options for preference shares were outstanding, due to the preference share conversion during the second
quarter of 2013.
At December 31, 2013, the Management Board held 77,886 phantom shares and employees of the Company
held 474,901 phantom shares under the 2011 Incentive Plan.
The table below provides reconciliations for stock options outstanding at December 31, 2013, as compared
to December 31, 2012.

FRESENIUS MEDICAL CARE AG & Co. KGaA
NOTES TO CONSOLIDATED FINANCIAL STATEMENTS
(in thousands, except share data)
F-43
Weighted Weighted
average average
Options exercise exercise
(in thousands) price price
Stock options for ordinary shares € $
Balance at December 31, 2012 11,147 42.66 58.83
Granted 2,141 49.75 68.61
Exercised 2,280 33.76 46.56
Converted from preference
shares 32 18.86 26.01
Forfeited 249 44.75 61.71
Balance at December 31, 2013 10,791 45.83 63.20
Stock options for preference shares
Balance at December 31, 2012 38 19.26 26.56
Exercised 2 18.35 25.31
Forfeited 4 23.56 32.49
Converted into ordinary
shares 32 18.86 26.01
Balance at December 31, 2013 0 0.00 0.00
The following table provides a summary of fully vested options outstanding and exercisable at December
31, 2013:
Fully Vested Outstanding and Exercisable Options
Weighted
average Weighted Weighted
Number remaining average average Aggregate Aggregate
of contractual exercise exercise intrinsic intrinsic
Options life in years price price value value
(in thousands) € US$ € US$
Options for ordinary
shares 4,711 2.51 36.41 50.21 72,198 99,568
At December 31, 2013, there was $48,355 of total unrecognized compensation costs related to non-vested
options granted under all plans. These costs are expected to be recognized over a weighted-average period of
2.00 years.
During the years ended December 31, 2013, 2012, and 2011, the Company received cash of $102,418,
$100,118 and $81,883, respectively, from the exercise of stock options (see Note 14). The intrinsic value of
convertible bonds and stock options exercised for the twelve-month periods ending December 31, 2013, 2012,
and 2011 was $52,203, $83,690 and $50,687, respectively. The Company recorded a related tax benefit of
$8,882, $21,008 and $13,010 for the years ending December 31, 2013, 2012, and 2011, respectively.
In connection with cash-settled share based payment transactions under the 2011 Incentive Program the
Company recognized expense of $3,559, $5,144 and $1,859 for the years ending December 31, 2013, 2012 and
2011, respectively.
Fair Value Information
The Company used a binomial option-pricing model in determining the fair value of the awards under the
2011 SOP and the Amended 2006 Plan. Option valuation models require the input of subjective assumptions
including expected stock price volatility. The Company’s assumptions are based upon its past experiences,

FRESENIUS MEDICAL CARE AG & Co. KGaA
NOTES TO CONSOLIDATED FINANCIAL STATEMENTS
(in thousands, except share data)
F-44
market trends and the experiences of other entities of the same size and in similar industries. Expected volatility
is based on historical volatility of the Company’s shares. To incorporate the effects of expected early exercise in
the model, an early exercise of vested options was assumed as soon as the share price exceeds 155% of the
exercise price. The Company’s stock options have characteristics that vary significantly from traded options and
changes in subjective assumptions can materially affect the fair value of the option. The assumptions used to
determine the fair value of the 2013 and 2012 grants are as follows:
2013 2012
Expected dividend yield 2.02% 1.61%
Risk-free interest rate 1.33% 1.09%
Expected volatility 22.44% 22.20%
Expected life of options 8 years 8 years
Weighted average exercise price (in €) 49.75 57.15
Weighted average exercise price (in US-$) 68.61 75.41
18. Income Taxes
Income before income taxes is attributable to the following geographic locations:
2013 2012 2011
Germany $ 234,336 $ 263,651 $ 344,267
United States 1,254,690 1,356,094 1,122,800
Other 358,609 312,368 311,292
$ 1,847,635 $ 1,932,113 $ 1,778,359
Income tax expense (benefit) for the years ended December 31, 2013, 2012, and 2011, consisted of the
following:
2013 2012 2011
Current:
Germany $ 81,117 $ 52,862 $ 67,484
United States 387,017 342,250 278,634
Other 116,186 139,136 106,087
584,320 534,248 452,205
Deferred:
Germany (33,106) 10,478 14,565
United States 47,298 98,200 139,282
Other (6,500) (37,790) (4,955)
7,692 70,888 148,892
$ 592,012 $ 605,136 $ 601,097
In 2013, 2012 and 2011, the Company was subject to German federal corporation income tax at a base rate
of 15% plus a solidarity surcharge of 5.5% on federal corporation taxes payable and a trade tax rate of 13.34%,
12.88% and 12.64% for the fiscal years ended December 31, 2013, 2012 and 2011, respectively.
A reconciliation between the expected and actual income tax expense is shown below. The expected
corporate income tax expense is computed by applying the German corporation tax rate (including the solidarity
surcharge) and the trade tax rate on income before income taxes. The combined tax rates were 29.16%, 28.71%
and 28.46% for the fiscal years ended December 31, 2013, 2012, and 2011, respectively.

FRESENIUS MEDICAL CARE AG & Co. KGaA
NOTES TO CONSOLIDATED FINANCIAL STATEMENTS
(in thousands, except share data)
F-45
2013 2012 2011
Expected corporate income tax expense $ 538,770 $ 554,613 $ 506,121
Tax free income (64,141) (90,943) (38,926)
Income from at equity investments (4,869) (2,133) (6,883)
Tax rate differentials 132,977 137,527 140,079
Non-deductible expenses 20,564 19,961 4,536
Taxes for prior years (6,389) 22,420 144
Change in valuation allowance 3,154 (19,680) 5,544
Noncontrolling partnership interests (55,023) (49,081) (31,300)
Other 26,969 32,452 21,782
Actual income tax expense $ 592,012 $ 605,136 $ 601,097
Effective tax rate 32.0% 31.3% 33.8%
The tax effects of the temporary differences that give rise to deferred tax assets and liabilities at December
31, 2013 and 2012, are presented below:
2013 2012
Deferred tax assets:
Accounts receivable $ 8,789 $ 5,847
Inventory 9,731 9,434
Property, plant and equipment, intangible and other non-current assets 20,093 28,470
Accrued expenses and other liabilities 305,664 318,827
Pensions 97,958 123,363
Net operating loss carryforwards, tax credit carryforwards and interest
carryforwards 141,727 107,595
Derivatives 2,169 4,856
Stock-based compensation 22,710 24,758
Other 13,632 13,136
Total deferred tax assets $ 622,473 $ 636,286
Less: valuation allowance (48,563) (44,191)
Net deferred tax assets $ 573,910 $ 592,095
Deferred tax liabilities:
Accounts receivable $ 43,031 $ 17,036
Inventory 12,264 11,847
Property, plant and equipment, intangible and other non-current assets 776,254 748,271
Accrued expenses and other liabilities 17,197 21,651
Derivatives 2,274 2,202
Other 117,255 128,403
Total deferred tax liabilities 968,275 929,410
Net deferred tax assets (liabilities) $ (394,365) $ (337,315)
The valuation allowance increased by $4,372 in 2013 and decreased by $36,227 in 2012.

FRESENIUS MEDICAL CARE AG & Co. KGaA
NOTES TO CONSOLIDATED FINANCIAL STATEMENTS
(in thousands, except share data)
F-46
The expiration of net operating losses is as follows:
2014 $ 38,550
2015 38,134
2016 54,139
2017 55,956
2018 50,907
2019 39,707
2020 33,619
2021 34,042
2022 34,046
2023 and thereafter 34,676
Without expiration date 92,906
Total $ 506,682
In assessing the realizability of deferred taxes, management considers whether it is more-likely-than-not that
some portion or all of a deferred tax asset will be realized. The ultimate realization of deferred tax assets is
dependent upon the generation of future taxable income during the periods in which those temporary differences
become deductible. Management considers the scheduled reversal of deferred tax liabilities and projected future
taxable income in making this assessment. Based upon the level of historical taxable income and projections for
future taxable income over the periods in which the deferred tax assets are deductible, management believes it is
more-likely-than-not the Company will realize the benefits of these deductible differences, net of the existing
valuation allowances at December 31, 2013.
The Company provides for income taxes and foreign withholding taxes on the cumulative earnings of
foreign subsidiaries that will not be reinvested. At December 31, 2013, the Company provided for $8,396 of
deferred tax liabilities associated with earnings that are likely to be distributed in 2014 and the following years.
Provision has not been made for additional taxes on $6,269,794 undistributed earnings of foreign subsidiaries as
these earnings are considered indefinitely reinvested. The earnings could become subject to additional tax if
remitted or deemed remitted as dividends; however calculation of such additional tax is not practicable. These
taxes would predominantly comprise foreign withholding tax on dividends of foreign subsidiaries, and German
income tax of approximately 1.4% on all dividends and capital gains.
FMC-AG & Co. KGaA companies are subject to tax audits in Germany and the U.S. on a regular basis and
on-going tax audits in other jurisdictions.
In Germany, the tax years 2002 through 2009 are currently under audit by the tax authorities. The Company
recognized and recorded the current proposed adjustments of this audit period in the financial statements. All
proposed adjustments are deemed immaterial. Fiscal years 2010 until 2013 are open to audit.
In the U.S., the tax years 2009 and 2010 are currently under audit by the tax authorities. Fiscal years 2011
until 2013 are open to audit. FMCH is also subject to audit in various state jurisdictions. A number of these
audits are in progress and various years are open to audit in various state jurisdictions. All expected results for
both federal and state income tax audits have been recognized in the financial statements.
The Company filed claims for refunds contesting the Internal Revenue Service’s (“IRS”) disallowance of
FMCH’s deductions for civil settlement payments taken by FMCH in prior year tax returns. As a result of a
settlement agreement with the IRS, the Company received a partial refund in September 2008 of $37,000,
inclusive of interest and preserved its right to pursue claims in the United States Courts for refunds of all other
disallowed deductions, which totaled approximately $126,000. On December 22, 2008, the Company filed a
complaint for complete refund in the United States District Court for the District of Massachusetts, styled as
Fresenius Medical Care Holdings, Inc. v. United States. On August 15, 2012, a jury entered a verdict for FMCH
granting additional deductions of $95,000. On May 31, 2013, the District Court entered final judgment for
FMCH in the amount of $50,400. On September 18, 2013, the IRS appealed the District Court’s ruling to the
United States Court of Appeals for the First Circuit (Boston).

FRESENIUS MEDICAL CARE AG & Co. KGaA
NOTES TO CONSOLIDATED FINANCIAL STATEMENTS
(in thousands, except share data)
F-47
Subsidiaries of FMC-AG & Co. KGaA in a number of countries outside of Germany and the U.S. are also
subject to tax audits. The Company estimates that the effects of such tax audits are not material to these
consolidated financial statements.
The following table shows the reconciliation of the beginning and ending amounts of unrecognized tax
benefits:
Unrecognized tax benefits (net of interest) 2013 2012 2011
Balance at January 1, $ 225,198 $ 223,829 $ 405,900
Increases in unrecognized tax benefits prior periods 25,260 13,232 24,046
Decreases in unrecognized tax benefits prior periods (11,445) (5,913) (24,897)
Increases in unrecognized tax benefits current period 10,062 17,903 16,157
Changes related to settlements with tax authorities (52,325) (14,763) (208,484)
Reductions as a result of a lapse of the statute of limitations - - (3,100)
Foreign currency translation 3,174 (9,090) 14,207
Balance at December 31, $ 199,924 $ 225,198 $ 223,829
Included in the balance at December 31, 2013 were $203,497 of unrecognized tax benefits which would
affect the effective tax rate if recognized. The Company is currently not in a position to forecast the timing and
magnitude of changes in other unrecognized tax benefits.
During the years ended December 31, 2013, 2012 and 2011 the Company recognized $2,155, $11,071 and
$20,494 in interest and penalties, respectively. At December 31, 2013 and December 31, 2012 the Company had
a total accrual of tax related interest and penalties of $17,580 and $33,749, respectively.
19. Operating Leases
The Company leases buildings and machinery and equipment under various lease agreements expiring on
dates through 2039. Rental expense recorded for operating leases for the years ended December 31, 2013, 2012
and 2011 was $670,963, $617,195 and $601,070, respectively. For information regarding intercompany
operating leases, see Note 3 a).
Future minimum rental payments under noncancelable operating leases for the five years succeeding
December 31, 2013 and thereafter are:
2014 $ 609,521
2015 524,898
2016 456,143
2017 354,705
2018 277,940
Thereafter 1,002,340
3,225,547
20. Commitments and Contingencies
Legal and Regulatory Matters
The Company is routinely involved in numerous claims, lawsuits, regulatory and tax audits, investigations
and other legal matters arising, for the most part, in the ordinary course of its business of providing healthcare
services and products. Legal matters that the Company currently deems to be material are described below. For
the matters described below in which the Company believes a loss is both reasonably possible and estimable, an

FRESENIUS MEDICAL CARE AG & Co. KGaA
NOTES TO CONSOLIDATED FINANCIAL STATEMENTS
(in thousands, except share data)
F-48
estimate of the loss or range of loss exposure is provided. For the other matters described below, the Company
believes that the loss probability is remote and/or the loss or range of possible losses cannot be reasonably
estimated at this time. The outcome of litigation and other legal matters is always difficult to predict accurately
and outcomes that are not consistent with the Company’s view of the merits can occur. The Company believes
that it has valid defenses to the legal matters pending against it and is defending itself vigorously. Nevertheless,
it is possible that the resolution of one or more of the legal matters currently pending or threatened could have a
material adverse effect on its business, results of operations and financial condition.
Commercial Litigation
The Company was originally formed as a result of a series of transactions it completed pursuant to the
Agreement and Plan of Reorganization dated as of February 4, 1996, by and between W.R. Grace & Co. and
Fresenius SE (the "Merger"). At the time of the Merger, a W.R. Grace & Co. subsidiary known as W.R. Grace &
Co.-Conn. had significant liabilities arising out of product-liability related litigation (including asbestos-related
actions), pre-Merger tax claims and other claims unrelated to National Medical Care, Inc. (“NMC”), which was
W.R. Grace & Co.’s dialysis business prior to the Merger. In connection with the Merger, W.R. Grace & Co.-
Conn. agreed to indemnify the Company, FMCH, and NMC against all liabilities of W.R. Grace & Co., whether
relating to events occurring before or after the Merger, other than liabilities arising from or relating to NMC’s
operations. W.R. Grace & Co. and certain of its subsidiaries filed for reorganization under Chapter 11 of the U.S.
Bankruptcy Code (the “Grace Chapter 11 Proceedings”) on April 2, 2001.
Prior to and after the commencement of the Grace Chapter 11 Proceedings, class action complaints were
filed against W.R. Grace & Co. and FMCH by plaintiffs claiming to be creditors of W.R. Grace & Co.-Conn.,
and by the asbestos creditors’ committees on behalf of the W.R. Grace & Co. bankruptcy estate in the Grace
Chapter 11 Proceedings, alleging, among other things that the Merger was a fraudulent conveyance, violated the
uniform fraudulent transfer act and constituted a conspiracy. All such cases have been dismissed as part of the
Grace Chapter 11 Proceedings.
In 2003, the Company reached agreement with the asbestos creditors’ committees on behalf of the W.R.
Grace & Co. bankruptcy estate and W.R. Grace & Co. in the matters pending in the Grace Chapter 11
Proceedings for the settlement of all fraudulent conveyance and tax claims against it and other claims related to
the Company that arise out of the bankruptcy of W.R. Grace & Co. The District Court approved the terms of the
settlement agreement as amended (the “Settlement Agreement”), in 2003, and included the terms of the
Settlement Agreement within the First Amended Plan of reorganization (“the Grace Bankruptcy Plan”) that was
ultimately approved and confirmed by the District Court. On February 3, 2014, the Court of Appeals dismissed
the last of the appeals of the District Court order confirming the plan of reorganization, and the Grace
Bankruptcy Plan went effective on that date. Pursuant to the terms of the Settlement Agreement and the Grace
Bankruptcy Plan, all actions asserting fraudulent conveyance and other claims raised on behalf of asbestos
claimants were dismissed with prejudice and the Company received protection against existing and potential
future W.R. Grace & Co. related claims, including fraudulent conveyance and asbestos claims by operation of
injunctions and releases and the Company also received indemnification against income tax claims related to the
non-NMC members of the W.R. Grace & Co. consolidated tax group. Also, pursuant to the Settlement
Agreement on February 3, 2014, the Company paid a total of $115,000, which had previously been accrued and
is included on the Company’s Consolidated Balance Sheets, to the asbestos personal injury and property damage
trusts created under the Grace Bankruptcy Plan. No admission of liability was made.
On April 4, 2003, FMCH filed a suit in the U. S. District Court for the Northern District of California, styled
Fresenius USA, Inc., et al., v. Baxter International Inc., et al., Case No. C 03-1431, seeking a declaratory
judgment that FMCH does not infringe patents held by Baxter International Inc. and its subsidiaries and affiliates
(“Baxter”), that the patents are invalid, and that Baxter is without right or authority to threaten or maintain suit
against FMCH for alleged infringement of Baxter's patents. In general, the asserted patents concern the use of
touch screen interfaces for hemodialysis machines. Baxter filed counterclaims against FMCH seeking more than
$140,000 in monetary damages and injunctive relief, and alleging that FMCH willfully infringed on Baxter's
patents. On July 17, 2006, the court entered judgment on a jury verdict in favor of FMCH finding all asserted
claims of Baxter patents invalid as obvious and/or anticipated in light of prior art.
On February 13, 2007, the court granted Baxter's motion to set aside the jury's verdict in favor of FMCH and
reinstated the patents and entered judgment of infringement. Following a trial on damages, the court entered
judgment on November 6, 2007 in favor of Baxter on a jury award of $14,300. On April 4, 2008, the court

FRESENIUS MEDICAL CARE AG & Co. KGaA
NOTES TO CONSOLIDATED FINANCIAL STATEMENTS
(in thousands, except share data)
F-49
denied Baxter’s motion for a new trial, established a royalty payable to Baxter of 10% of the sales price for
continuing sales of FMCH’s 2008K hemodialysis machines and 7% of the sales price of related disposables,
parts and service beginning November 7, 2007, and enjoined sales of the touchscreen-equipped 2008K machine
effective January 1, 2009. The Company appealed the court's rulings to the United States Court of Appeals for
the Federal Circuit (“Federal Circuit”). On September 10, 2009, the Federal Circuit reversed the district court's
decision and determined that the asserted claims in two of the three patents at issue are invalid. As to the third
patent, the Federal Circuit affirmed the district court's decision; however, the Court also vacated the injunction
and award of damages. These issues were remanded to the District Court for reconsideration in light of the
invalidity ruling on most of the claims. Upon remand, the district court reduced the post-verdict damages award
to $10,000. Separately, the U.S. Patent and Trademark Office (“USPTO”) and the Board of Patent Appeals and
Interferences ruled that the remaining Baxter patent is invalid. On May 17, 2012 the Federal Circuit affirmed the
USPTO’s ruling and invalidated the final remaining Baxter patent. Baxter appealed to the Federal Circuit
claiming that approximately $20,000 of damages awarded to it by the District Court before the Federal Circuit
affirmed the USPTO ruling constituted a final judgment that may be collected. On July 2, 2013, the Federal
Circuit denied Baxter’s appeal and ordered the District Court to dismiss the case. The court-approved escrow
account has been terminated and the escrow funds have been returned to FMCH.
On August 27, 2012, Baxter filed suit in the U.S. District Court for the Northern District of Illinois, styled
Baxter International Inc., et al., v. Fresenius Medical Care Holdings, Inc., Case No. 12-cv-06890, alleging that
the Company’s LibertyTM cycler infringes certain U.S. patents that were issued to Baxter between October 2010
and June 2012. The Company believes it has valid defenses to these claims, and will defend this litigation
vigorously.
On April 5, 2013, the U.S. Judicial Panel on Multidistrict Litigation ordered that the numerous lawsuits filed
and anticipated to be filed in various federal courts alleging wrongful death and personal injury claims against
FMCH and certain of its affiliates relating to FMCH’s acid concentrate products NaturaLyte® and Granuflo® be
transferred and consolidated for pretrial management purposes into a consolidated multidistrict litigation in the
United States District Court for the District of Massachusetts, styled In Re: Fresenius Granuflo/Naturalyte
Dialysate Products Liability Litigation, Case No. 2013-md-02428. The Massachusetts state courts subsequently
established a similar consolidated litigation for such cases filed in Massachusetts county courts, styled In Re:
Consolidated Fresenius Cases, Case No. MICV 2013-03400-O (Massachusetts Superior Court, Middlesex
County). These lawsuits allege generally that inadequate labeling and warnings for these products caused harm
to patients. In addition, similar cases have been filed in several state courts that may or may not eventually be
formally consolidated with the federal multidistrict litigation. FMCH believes that these lawsuits are without
merit, and will defend them vigorously.
Other Litigation and Potential Exposures
On February 15, 2011, a qui tam relator’s complaint under the False Claims Act against FMCH was
unsealed by order of the United States District Court for the District of Massachusetts and served by the relator.
The United States has not intervened in the case United States ex rel. Chris Drennen v. Fresenius Medical Care
Holdings, Inc., 2009 Civ. 10179 (D. Mass.). The relator’s complaint, which was first filed under seal in February
2009, alleges that the Company seeks and receives reimbursement from government payors for serum ferritin
and hepatitis B laboratory tests that are medically unnecessary or not properly ordered by a physician. On March
6, 2011, the United States Attorney for the District of Massachusetts issued a subpoena seeking the production of
documents related to the same laboratory tests that are the subject of the relator’s complaint. FMCH has
cooperated fully in responding to the subpoena, and will vigorously contest the relator’s complaint.
Subpoenas or search warrants have been issued by federal and state law enforcement authorities under the
supervision of the United States Attorneys for the Districts of Connecticut, Southern Florida, Southern New
York, Eastern Virginia and Rhode Island to American Access Care LLC (AAC), which the Company acquired in
October 2011, and to the Company’s Fresenius Vascular Access subsidiary which now operates former AAC
centers as well as its own original facilities. Subpoenas have also been issued to certain of the Company’s
outpatient hemodialysis facilities for records relating to vascular access treatment and monitoring. The Company
is cooperating fully in these investigations. Communications with certain of the investigating United States
Attorney Offices indicate that the inquiry encompasses invoicing and coding for procedures commonly
performed in vascular access centers and the documentary support for the medical necessity of such procedures.
The AAC acquisition agreement contains customary indemnification obligations with respect to breaches of
representations, warranties or covenants and certain other specified matters. As of October 18, 2013, a group of

FRESENIUS MEDICAL CARE AG & Co. KGaA
NOTES TO CONSOLIDATED FINANCIAL STATEMENTS
(in thousands, except share data)
F-50
the prior owners of AAC exercised their right pursuant to the terms of the acquisition agreement to assume
responsibility for responding to certain of the subpoenas. Pursuant to the AAC acquisition agreement the prior
owners are obligated to indemnify the Company for certain liabilities that might arise from those subpoenas.
The Company has received communications alleging certain conduct in certain countries outside the U.S.
and Germany that may violate the U.S. Foreign Corrupt Practices Act (“FCPA”) or other anti-bribery laws. The
Audit and Corporate Governance Committee of the Company's Supervisory Board is conducting an internal
review with the assistance of independent counsel retained for such purpose. The Company voluntarily advised
the U.S. Securities and Exchange Commission (“SEC”) and the U.S. Department of Justice (“DOJ”) that
allegations have been made and of the Company's internal review. The Company’s review and dialogue with the
SEC and DOJ are ongoing.
The review has identified conduct that raises concerns under the FCPA or other anti-bribery laws that may
result in monetary penalties or other sanctions. In addition, the Company’s ability to conduct business in certain
jurisdictions could be negatively impacted. Given the current status of the internal review, the Company cannot
reasonably estimate the possible loss or range of possible loss that may result from the identified matters or from
the final outcome of the continuing internal review. Accordingly, no provision with respect to these matters has
been made in the accompanying consolidated financial statements.
The Company’s independent counsel, in conjunction with the Company’s Compliance Department, have
reviewed the Company’s anti-corruption compliance program, including internal controls related to compliance
with international anti-bribery laws, and appropriate enhancements are being implemented. The Company is
fully committed to FCPA compliance.
In December 2012 and January 2013, FMCH received subpoenas from the United States Attorneys for the
District of Massachusetts and the Western District of Louisiana requesting production of a broad range of
documents. Communications with the investigating United States Attorney Offices indicate that the inquiry
relates to products manufactured by FMCH, which encompasses the Granuflo® and Naturalyte® acid concentrate
products that are also the subject of personal injury litigation described above, as well as electron-beam
sterilization of dialyzers, the Liberty peritoneal dialysis cycler, and 2008 series hemodialysis machines as related
to the use of Granuflo® and Naturalyte®. FMCH is cooperating fully in the government’s investigation.
The Company filed claims for refunds contesting the Internal Revenue Service’s (“IRS”) disallowance of
FMCH’s deductions for civil settlement payments taken by FMCH in prior year tax returns. As a result of a
settlement agreement with the IRS, the Company received a partial refund in September 2008 of $37,000,
inclusive of interest and preserved its right to pursue claims in the United States Courts for refunds of all other
disallowed deductions, which totaled approximately $126,000. On December 22, 2008, the Company filed a
complaint for complete refund in the United States District Court for the District of Massachusetts, styled as
Fresenius Medical Care Holdings, Inc. v. United States. On August 15, 2012, a jury entered a verdict for FMCH
granting additional deductions of $95,000. On May 31, 2013, the District Court entered final judgment for
FMCH in the amount of $50,400. On September 18, 2013, the IRS appealed the District Court’s ruling to the
United States Court of Appeals for the First Circuit (Boston).
From time to time, the Company is a party to or may be threatened with other litigation or arbitration, claims
or assessments arising in the ordinary course of its business. Management regularly analyzes current information
including, as applicable, the Company’s defenses and insurance coverage and, as necessary, provides accruals
for probable liabilities for the eventual disposition of these matters.
The Company, like other healthcare providers, conducts its operations under intense government regulation
and scrutiny. It must comply with regulations which relate to or govern the safety and efficacy of medical
products and supplies, the marketing and distribution of such products, the operation of manufacturing facilities,
laboratories and dialysis clinics, and environmental and occupational health and safety. With respect to its
development, manufacture, marketing and distribution of medical products, if such compliance is not
maintained, the Company could be subject to significant adverse regulatory actions by the FDA and comparable
regulatory authorities outside the U.S. These regulatory actions could include warning letters or other
enforcement notices from the FDA, and/or comparable foreign regulatory authority which may require the
Company to expend significant time and resources in order to implement appropriate corrective actions. If the
Company does not address matters raised in warning letters or other enforcement notices to the satisfaction of
the FDA and/or comparable regulatory authorities outside the U.S., these regulatory authorities could take
additional actions, including product recalls injunctions against the distribution of products or operation of

FRESENIUS MEDICAL CARE AG & Co. KGaA
NOTES TO CONSOLIDATED FINANCIAL STATEMENTS
(in thousands, except share data)
F-51
manufacturing plants, civil penalties, seizures of the Company's products and/or criminal prosecution. The
Company must also comply with the laws of the United States, including the federal Anti-Kickback Statute, the
federal False Claims Act, the federal Stark Law and the federal Foreign Corrupt Practices Act as well as other
federal and state fraud and abuse laws. Applicable laws or regulations may be amended, or enforcement agencies
or courts may make interpretations that differ from the Company’s interpretations or the manner in which it
conducts its business. Enforcement has become a high priority for the federal government and some states. In
addition, the provisions of the False Claims Act authorizing payment of a portion of any recovery to the party
bringing the suit encourage private plaintiffs to commence “qui tam” or “whistle blower” actions. In May 2009,
the scope of the False Claims Act was expanded and additional protections for whistle blowers and procedural
provisions to aid whistle blowers’ ability to proceed in a False Claims Act case were added. By virtue of this
regulatory environment, the Company’s business activities and practices are subject to extensive review by
regulatory authorities and private parties, and continuing audits, subpoenas, other inquiries, claims and litigation
relating to the Company’s compliance with applicable laws and regulations. The Company may not always be
aware that an inquiry or action has begun, particularly in the case of “whistle blower” actions, which are initially
filed under court seal.
The Company operates many facilities throughout the United States and other parts of the world. In such a
decentralized system, it is often difficult to maintain the desired level of oversight and control over the thousands
of individuals employed by many affiliated companies. The Company relies upon its management structure,
regulatory and legal resources, and the effective operation of its compliance program to direct, manage and
monitor the activities of these employees. On occasion, the Company may identify instances where employees or
other agents deliberately, recklessly or inadvertently contravene the Company’s policies or violate applicable
law. The actions of such persons may subject the Company and its subsidiaries to liability under the Anti-
Kickback Statute, the Stark Law, the False Claims Act and the Foreign Corrupt Practices Act, among other laws
and comparable laws of other countries.
Physicians, hospitals and other participants in the healthcare industry are also subject to a large number of
lawsuits alleging professional negligence, malpractice, product liability, worker’s compensation or related
claims, many of which involve large claims and significant defense costs. The Company has been and is
currently subject to these suits due to the nature of its business and expects that those types of lawsuits may
continue. Although the Company maintains insurance at a level which it believes to be prudent, it cannot assure
that the coverage limits will be adequate or that insurance will cover all asserted claims. A successful claim
against the Company or any of its subsidiaries in excess of insurance coverage could have a material adverse
effect upon it and the results of its operations. Any claims, regardless of their merit or eventual outcome, could
have a material adverse effect on the Company’s reputation and business.
The Company has also had claims asserted against it and has had lawsuits filed against it relating to alleged
patent infringements or businesses that it has acquired or divested. These claims and suits relate both to
operation of the businesses and to the acquisition and divestiture transactions. The Company has, when
appropriate, asserted its own claims, and claims for indemnification. A successful claim against the Company or
any of its subsidiaries could have a material adverse effect upon its business, financial condition, and the results
of its operations. Any claims, regardless of their merit or eventual outcome, could have a material adverse effect
on the Company’s reputation and business.

FRESENIUS MEDICAL CARE AG & Co. KGaA
NOTES TO CONSOLIDATED FINANCIAL STATEMENTS
(in thousands, except share data)
F-52
21. Financial Instruments
Non-derivative Financial Instruments
The following table presents the carrying amounts and fair values of the Company’s non-derivative financial
instruments at December 31, 2013, and December 31, 2012.
2013 2012
Fair
Value Carrying Fair Carrying Fair
Hierarchy Amount Value Amount Value
Assets
Cash and cash equivalents 1 $ 682,777 $ 682,777 $ 688,040 $ 688,040
Accounts Receivable(1) 2 3,190,392 3,190,392 3,157,233 3,157,233
Long-term Notes Receivable 3 165,807 175,768 - -
Liabilities
Accounts payable(1) 2 $ 666,526 $ 666,526 $ 745,644 $ 745,644
Short-term borrowings(1) 2 158,990 158,990 121,823 121,823
Long term debt, excluding 2012 Credit
Agreement, Euro Notes and Senior
Notes 2 679,847 679,847 721,928 721,928
2012 Credit Agreement 2 2,707,145 2,710,270 2,659,340 2,652,840
Senior Notes 2 4,824,753 5,348,679 4,743,442 5,296,325
Euro Notes 2 46,545 47,423 51,951 54,574
Noncontrolling interests subject to put
provisions 3 648,251 648,251 523,260 523,260
(1) Also includes amounts from related parties.
The carrying amounts in the table are included in the consolidated balance sheet under the indicated captions
or in the case of long-term debt, in the captions shown in Note 11.
The significant methods and assumptions used in estimating the fair values of non-derivative financial
instruments are as follows:
Cash and cash equivalents are stated at nominal value which equals the fair value.
Short-term financial instruments such as accounts receivable, accounts payable and short-term borrowings
are valued at their carrying amounts, which are reasonable estimates of the fair value due to the relatively short
period to maturity of these instruments.
The valuation of long-term notes receivable was determined using significant unobservable inputs. They
were valued using a constructed index based upon similar instruments with comparable credit ratings, terms,
tenor, interest rates and that are within the Company’s industry. The Company tracked the prices of the
constructed index from the note issuance date to the reporting date to determine fair value. See Note 8 for further
information on the long-term notes receivable.
The fair values of major long-term financial liabilities are calculated on the basis of market information.
Instruments for which market quotes are available are measured using these quotes. The fair values of the other
long-term financial liabilities are calculated at the present value of the respective future cash flows. To determine
these present values, the prevailing interest rates and credit spreads for the Company as of the balance sheet date
are used.

FRESENIUS MEDICAL CARE AG & Co. KGaA
NOTES TO CONSOLIDATED FINANCIAL STATEMENTS
(in thousands, except share data)
F-53
The valuation of noncontrolling interests subject to put provisions is determined using significant
unobservable inputs. See Note 13 for a discussion of the Company’s methodology for estimating the fair value
of these noncontrolling interests subject to put obligations.
Currently, there is no indication that a decrease in the value of the Company’s financing receivables is
probable. Therefore, the allowances on credit losses of financing receivables are immaterial.
Derivative Financial Instruments
The Company is exposed to market risk from changes in foreign exchange rates and interest rates. In order
to manage the risk of currency exchange rate and interest rate fluctuations, the Company enters into various
hedging transactions by means of derivative instruments with highly rated financial institutions as authorized by
the Company’s General Partner. On a quarterly basis, the Company performs an assessment of its counterparty
credit risk. The Company currently considers this risk to be low. The Company’s policy, which has been
consistently followed, is that financial derivatives be used only for the purpose of hedging foreign currency and
interest rate exposure.
In certain instances, the Company enters into derivative contracts that do not qualify for hedge accounting
but are utilized for economic purposes (“economic hedges”). The Company does not use financial instruments
for trading purposes.
The Company established guidelines for risk assessment procedures and controls for the use of financial
instruments. They include a clear segregation of duties with regard to execution on one side and administration,
accounting and controlling on the other.
To reduce the credit risk arising from derivatives the Company concluded Master Netting Agreements with
banks. Through such agreements, positive and negative fair values of the derivative contracts could be offset
against one another if a partner becomes insolvent. This offsetting is valid for transactions where the aggregate
amount of obligations owed to and receivable from are not equal. If insolvency occurs, the party which owes the
larger amount is obliged to pay the other party the difference between the amounts owed in the form of one net
payment.
The Company elects not to offset the fair values of derivative financial instruments subject to master netting
agreements in the Consolidated Balance Sheets.
At December 31, 2013 and December 31, 2012, the Company had $18,334 and $32,044 of derivative
financial assets subject to netting arrangements and $16,371 and $19,193 of derivative financial liabilities
subject to netting arrangements. Offsetting these derivative financial instruments would have resulted in net
assets of $12,169 and $20,773 as well as net liabilities of $10,207 and $7,922 at December 31, 2013 and
December 31, 2012, respectively.
Foreign Exchange Risk Management
The Company conducts business on a global basis in various currencies, though a majority of its operations
are in Germany and the United States. For financial reporting purposes, the Company has chosen the U.S. dollar
as its reporting currency. Therefore, changes in the rate of exchange between the U.S. dollar and the local
currencies in which the financial statements of the Company’s international operations are maintained affect its
results of operations and financial position as reported in its consolidated financial statements.
The Company’s exposure to market risk for changes in foreign exchange rates relates to transactions such as
sales and purchases. The Company has significant amounts of sales of products invoiced in euro from its
European manufacturing facilities to its other international operations and, to a lesser extent, sales of products
invoiced in other non-functional currencies. This exposes the subsidiaries to fluctuations in the rate of exchange
between the euro and the currency in which their local operations are conducted. For the purpose of hedging
existing and foreseeable foreign exchange transaction exposures the Company enters into foreign exchange
forward contracts and, on a small scale, foreign exchange options. At December 31, 2013 the Company had no
foreign exchange options.
Changes in the fair value of the effective portion of foreign exchange forward contracts designated and
qualifying as cash flow hedges of forecasted product purchases and sales are reported in AOCI. Additionally, in
connection with intercompany loans in foreign currency, the Company uses foreign exchange swaps thus

FRESENIUS MEDICAL CARE AG & Co. KGaA
NOTES TO CONSOLIDATED FINANCIAL STATEMENTS
(in thousands, except share data)
F-54
assuring that no foreign exchange risks arise from those loans, which, if they qualify for cash flow hedge
accounting, are also reported in AOCI. These amounts recorded in AOCI are subsequently reclassified into
earnings as a component of cost of revenues for those contracts that hedge product purchases or as an adjustment
of interest income/expense for those contracts that hedge loans, in the same period in which the hedged
transaction affects earnings. The notional amounts of foreign exchange contracts in place that are designated and
qualify as cash flow hedges totaled $238,983 and $611,488 at December 31, 2013 and December 31, 2012,
respectively.
The Company also enters into derivative contracts for forecasted product purchases and sales and for
intercompany loans in foreign currency that do not qualify for hedge accounting but are utilized for economic
hedges as defined above. In these cases, the change in value of the economic hedge is recorded in the income
statement and usually offsets the change in value recorded in the income statement for the underlying asset or
liability. The notional amounts of economic hedges that do not qualify for hedge accounting totaled $1,512,559
and $1,574,667 at December 31, 2013 and December 31, 2012, respectively.
Interest Rate Risk Management
The Company enters into derivatives, particularly interest rate swaps and to a certain extent, interest rate
options, to protect against the risk of rising interest rates. These interest rate derivatives are designated as cash
flow hedges and have been entered into in order to effectively convert payments based on variable interest rates
into payments at a fixed interest rate. The euro-denominated interest rate swaps expire in 2016 and have an
interest rate of 1.73%. Interest payable and receivable under the swap agreements is accrued and recorded as an
adjustment to interest expense.
At December 31, 2013 and December 31, 2012, the notional amount of the euro-denominated interest rate
swaps in place was €100,000 and €100,000 ($137,910 and $131,940 at December 31, 2013 and December 31,
2012, respectively).
In addition, the Company also enters into interest rate hedges (“pre-hedges”) in anticipation of future debt
issuance to effectively convert the variable interest rate related to the future debt to a fixed interest rate. These
pre-hedges are settled at the issuance date of the corresponding debt with the settlement amount recorded in
AOCI amortized to interest expense over the life of the pre-hedges. At December 31, 2013 and December 31,
2012, the Company had $118,844 and $132,881, respectively, related to such settlements of pre-hedges deferred
in AOCI, net of tax.
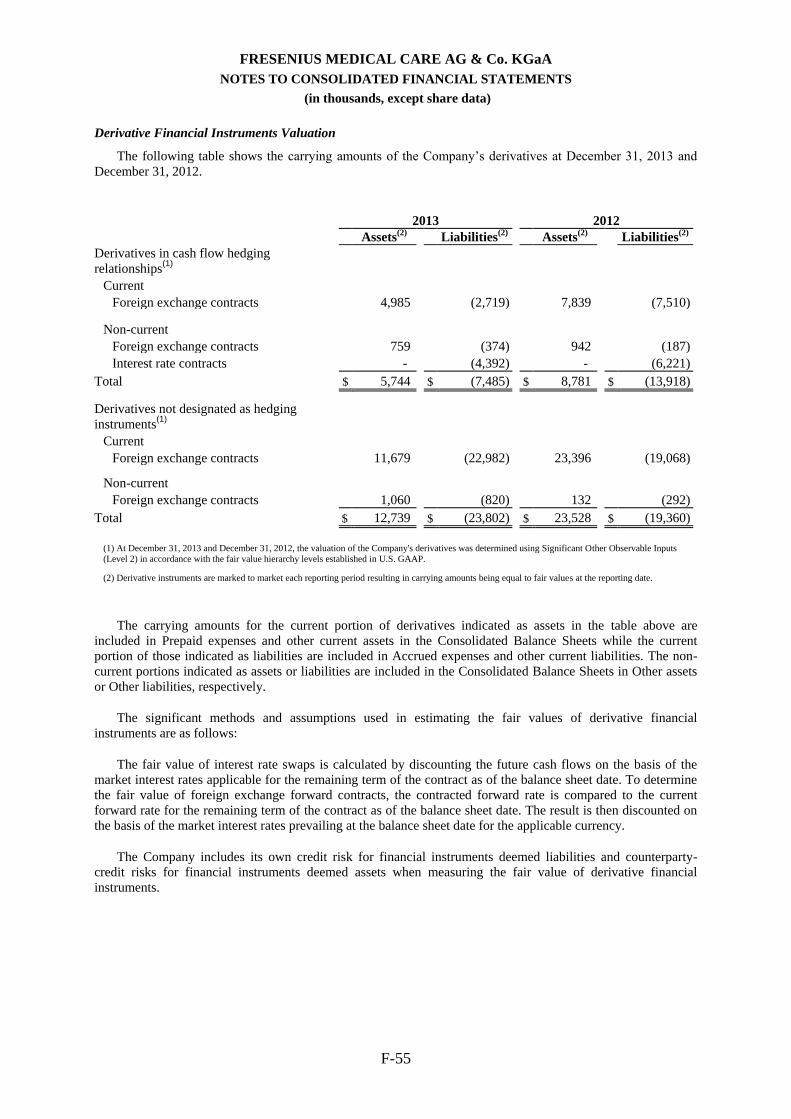
FRESENIUS MEDICAL CARE AG & Co. KGaA
NOTES TO CONSOLIDATED FINANCIAL STATEMENTS
(in thousands, except share data)
F-55
Derivative Financial Instruments Valuation
The following table shows the carrying amounts of the Company’s derivatives at December 31, 2013 and
December 31, 2012.
2013
2012
Assets(2)
Liabilities(2)
Assets(2)
Liabilities(2)
Derivatives in cash flow hedging
relationships(1)
Current
Foreign exchange contracts 4,985 (2,719) 7,839 (7,510)
Non-current
Foreign exchange contracts 759 (374) 942 (187)
Interest rate contracts - (4,392) - (6,221)
Total $ 5,744 $ (7,485) $ 8,781 $ (13,918)
Derivatives not designated as hedging
instruments(1)
Current
Foreign exchange contracts 11,679 (22,982) 23,396 (19,068)
Non-current
Foreign exchange contracts 1,060 (820) 132 (292)
Total $ 12,739 $ (23,802) $ 23,528 $ (19,360)
(1) At December 31, 2013 and December 31, 2012, the valuation of the Company's derivatives was determined using Significant Other Observable Inputs
(Level 2) in accordance with the fair value hierarchy levels established in U.S. GAAP.
(2) Derivative instruments are marked to market each reporting period resulting in carrying amounts being equal to fair values at the reporting date.
The carrying amounts for the current portion of derivatives indicated as assets in the table above are
included in Prepaid expenses and other current assets in the Consolidated Balance Sheets while the current
portion of those indicated as liabilities are included in Accrued expenses and other current liabilities. The non-
current portions indicated as assets or liabilities are included in the Consolidated Balance Sheets in Other assets
or Other liabilities, respectively.
The significant methods and assumptions used in estimating the fair values of derivative financial
instruments are as follows:
The fair value of interest rate swaps is calculated by discounting the future cash flows on the basis of the
market interest rates applicable for the remaining term of the contract as of the balance sheet date. To determine
the fair value of foreign exchange forward contracts, the contracted forward rate is compared to the current
forward rate for the remaining term of the contract as of the balance sheet date. The result is then discounted on
the basis of the market interest rates prevailing at the balance sheet date for the applicable currency.
The Company includes its own credit risk for financial instruments deemed liabilities and counterparty-
credit risks for financial instruments deemed assets when measuring the fair value of derivative financial
instruments.

FRESENIUS MEDICAL CARE AG & Co. KGaA
NOTES TO CONSOLIDATED FINANCIAL STATEMENTS
(in thousands, except share data)
F-56
The Effect of Derivatives on the Consolidated Financial Statements
Amount of Gain or (Loss) Recognized in AOCI on
Derivatives
Location of (Gain) or
Loss Reclassified from
AOCI in Income
Amount of (Gain) or Loss
Reclassified from AOCI in
Income
Derivatives in Cash Flow
Hedging Relationships
(Effective Portion)
for the year ended December 31,
(Effective Portion)
for the year ended
December 31,
2013 2012 (Effective Portion) 2013 2012
Interest rate contracts $ (6,601) $ (16,762) Interest income/expense $ 28,111 $ 23,779
Foreign exchange contracts 3,684 21,834 Costs of Revenue (3,251) (5,414)
Foreign exchange contracts Interest income/expense 589 582
$ (2,917) $ 5,072 $ 25,449 $ 18,947
Derivatives not Designated
as Hedging Instruments
Amount of (Gain) or Loss Recognized in Income on
Derivatives
for the year ended December 31,
Location of (Gain) or
Loss Recognized in
Income on Derivatives
2013 2012
Foreign exchange contracts Selling, general and
administrative expense
$ (15,190) $ (8,804)
Foreign exchange contracts Interest income/expense 7,161 8,033
$ (8,029) $ (771)
For foreign exchange derivatives, the Company expects to recognize $2,351 of losses deferred in AOCI at
December 31, 2013, in earnings during the next twelve months.
The Company expects to incur additional interest expense of $22,927 over the next twelve months which is
currently deferred in AOCI. This amount reflects the projected amortization of the settlement amount of the
terminated swaps and the current fair value of the additional interest payments resulting from the remaining
interest rate swap maturing in 2016 at December 31, 2013.
At December 31, 2013, the Company had foreign exchange derivatives with maturities of up to 23 months
and interest rate swaps with maturities of up to 34 months.

FRESENIUS MEDICAL CARE AG & Co. KGaA
NOTES TO CONSOLIDATED FINANCIAL STATEMENTS
(in thousands, except share data)
F-57
22. Other Comprehensive Income (Loss)
The changes in the components of other comprehensive income (loss) for the years ended December 31,
2013, 2012, and 2011 are as follows:
Pretax Tax effect
Net, before non-
controlling
interests
Non-
controlling
interests
Other
comprehensive
income (loss),
net of tax
Year ended December 31, 2011
Other comprehensive income (loss) relating to cash flow hedges:
Changes in fair value of cash flow hedges during the period $ (104,130) $ 41,825 $ (62,305) $ - $ (62,305)
Reclassification adjustments 1,684 (796) 888 - 888
Total other comprehensive income (loss) relating to cash flow
hedges (102,446) 41,029 (61,417) - (61,417)
Foreign-currency translation adjustment (179,987) - (179,987) (1,247) (181,234)
Defined benefit pension plans:
Actuarial (loss) gain on defined benefit pension plans (90,643) 34,930 (55,713) - (55,713)
Reclassification adjustments 8,737 (3,342) 5,395 - 5,395
Total other comprehensive income (loss) relating to defined
benefit pension plans (81,906) 31,588 (50,318) - (50,318)
Other comprehensive income (loss) $ (364,339) $ 72,617 $ (291,722) $ (1,247) $ (292,969)
Year ended December 31, 2012
Other comprehensive income (loss) relating to cash flow hedges:
Changes in fair value of cash flow hedges during the period $ 5,072 $ (21,171) $ (16,099) $ - $ (16,099)
Reclassification adjustments 18,947 (4,968) 13,979 - 13,979
Total other comprehensive income (loss) relating to cash flow
hedges 24,019 (26,139) (2,120) - (2,120)
Foreign-currency translation adjustment 63,982 - 63,982 (179) 63,803
Defined benefit pension plans:
Actuarial (loss) gain on defined benefit pension plans (121,512) 42,159 (79,353) - (79,353)
Reclassification adjustments 18,334 (7,189) 11,145 - 11,145
Total other comprehensive income (loss) relating to defined
benefit pension plans (103,178) 34,970 (68,208) - (68,208)
Other comprehensive income (loss) $ (15,177) $ 8,831 $ (6,346) $ (179) $ (6,525)
Year ended December 31, 2013
Other comprehensive income (loss) relating to cash flow hedges:
Changes in fair value of cash flow hedges during the period $ (2,917) $ 1,346 $ (1,571) $ - $ (1,571)
Reclassification adjustments 25,449 (7,393) 18,056 - 18,056
Total other comprehensive income (loss) relating to cash flow
hedges 22,532 (6,047) 16,485 - 16,485
Foreign-currency translation adjustment (112,395) - (112,395) (2,044) (114,439)
Defined benefit pension plans:
Actuarial (loss) gain on defined benefit pension plans 39,571 (17,828) 21,743 - 21,743
Reclassification adjustments 25,418 (9,725) 15,693 - 15,693
Total other comprehensive income (loss) relating to defined
benefit pension plans 64,989 (27,553) 37,436 - 37,436
Other comprehensive income (loss) $ (24,874) $ (33,600) $ (58,474) $ (2,044) $ (60,518)

FRESENIUS MEDICAL CARE AG & Co. KGaA
NOTES TO CONSOLIDATED FINANCIAL STATEMENTS
(in thousands, except share data)
F-58
Changes in AOCI by component for the years ended December 31, 2013, 2012, and 2011 are as follows:
Gain (Loss)
related to
cash flow
hedges
Actuarial
gain (loss) on
defined
benefit
pension plans
Gain (Loss)
related to
foreign-
currency
translation
Total, before
non-
controlling
interests
Non-
controlling
interests Total
Balance at December 31, 2010 $ (74,804) $ (60,897) $ (58,344) $ (194,045) $ 4,295 $ (189,750)
Other comprehensive income before
reclassifications (62,305) (55,713) (179,987) (298,005) (1,247) (299,252)
Amounts reclassified from AOCI 888 5,395 - 6,283 - 6,283
Net current-period other comprehensive income (61,417) (50,318) (179,987) (291,722) (1,247) (292,969)
Balance at December 31, 2011 $ (136,221) $ (111,215) $ (238,331) $ (485,767) $ 3,048 $ (482,719)
Other comprehensive income before
reclassifications (16,099) (79,353) 63,982 (31,470) (179) (31,649)
Amounts reclassified from AOCI 13,979 11,145 - 25,124 - 25,124
Net current-period other comprehensive income (2,120) (68,208) 63,982 (6,346) (179) (6,525)
Balance at December 31, 2012 $ (138,341) $ (179,423) $ (174,349) $ (492,113) $ 2,869 $ (489,244)
Other comprehensive income before
reclassifications (1,571) 21,743 (112,395) (92,223) (2,044) (94,267)
Amounts reclassified from AOCI 18,056 15,693 - 33,749 - 33,749
Net current-period other comprehensive income 16,485 37,436 (112,395) (58,474) (2,044) (60,518)
Balance at December 31, 2013 $ (121,856) $ (141,987) $ (286,744) $ (550,587) $ 825 $ (549,762)
Reclassifications out of AOCI for the years ended December 31, 2013, 2012, and 2011 are as follows:
Details about AOCI Components
Amount of (Gain) Loss reclassified from AOCI in
Income
Location of (Gain) Loss
reclassified from AOCI
in Income
For the years ended December 31,
2013 2012 2011
(Gain) Loss related to cash flow hedges
Interest rate contracts $ 28,111 $ 23,779 $ 5,946 Interest income/expense
foreign exchange contracts (3,251) (5,414) (4,262) Costs of Revenue
foreign exchange contracts 589 582 - Interest income/expense
25,449 18,947 1,684 Total before tax
(7,393) (4,968) (796) Tax expense or benefit
$ 18,056 $ 13,979 $ 888 Net of tax
Actuarial (Gain) Loss on defined benefit
pension plans
Actuarial (gains) losses $ 25,418 $ 18,334 $ 8,737 (1)
25,418 18,334 8,737 Total before tax
(9,725) (7,189) (3,342) Tax expense or benefit
$ 15,693 $ 11,145 $ 5,395 Net of tax
Total reclassifications for the period $ 33,749 $ 25,124 $ 6,283 Net of tax
(1) Included in the computation of net periodic pension cost (see Note 12 for additional details).

FRESENIUS MEDICAL CARE AG & Co. KGaA
NOTES TO CONSOLIDATED FINANCIAL STATEMENTS
(in thousands, except share data)
F-59
23. Supplementary Cash Flow Information
The following additional information is provided with respect to the consolidated statements of cash flows:
2013 2012 2011
Supplementary cash flow information:
Cash paid for interest $ 374,648 $ 349,415 $ 259,835
Cash paid for income taxes(1) $ 542,625 $ 552,711 $ 455,805
Cash inflow for income taxes from stock option exercises $ 8,882 $ 21,008 $ 13,010
Supplemental disclosures of cash flow information:
Details for acquisitions:
Assets acquired $ (417,669) $ (2,519,189) $ (1,684,630)
Liabilities assumed 31,335 241,342 215,253
Noncontrolling interest subject to put provisions 15,460 123,210 26,684
Noncontrolling interest 9,104 104,947 20,983
Obligations assumed in connection with acquisition 66,917 6,624 20,016
Cash paid (294,853) (2,043,066) (1,401,694)
Less cash acquired 6,858 173,278 47,461
Net cash paid for acquisitions (287,995) (1,869,788) (1,354,233)
Cash paid for investments (195,921) (387) (419,040)
Cash paid for intangible assets (11,809) (8,733) (12,056)
Total cash paid for acquisitions and investments, net of cash
acquired, and purchases of intangible assets $ (495,725) $ (1,878,908) $ (1,785,329)
(1) Net of tax refund.

F-60
24. Segment and Corporate Information
The Company has identified three operating segments, North America Segment, EMEALA, and Asia-
Pacific, which were determined based upon how the Company manages its businesses. All segments are
primarily engaged in providing dialysis care services and the distribution of products and equipment for the
treatment of ESRD. The Company has aggregated the EMEALA and Asia-Pacific operating segments as the
“International Segment”. The segments are aggregated due to their similar economic characteristics. These
characteristics include same services provided and same products sold, the same type of patient population,
similar methods of distribution of products and services and similar economic environments. The General
Partner’s management board member responsible for the profitability and cash flow of each segment’s various
businesses supervises the management of each operating segment. The accounting policies of the segments are
the same as those the Company applies in preparing the consolidated financial statements under U.S. GAAP.
Management evaluates each segment using a measure that reflects all of the segment’s controllable revenues
and expenses. With respect to the performance of business operations, management believes that the most
appropriate measure in this regard is operating income which measures the Company’s source of earnings. The
Company does not include the effects of certain transactions, such as the investment gain resulting from the 2012
Liberty Acquisition nor income taxes as it believes these items to be outside the segments’ control. Financing is
a corporate function, which the Company’s segments do not control. Therefore, the Company does not include
interest expense relating to financing as a segment measurement. Similarly, the Company does not allocate
certain costs which relate primarily to certain headquarters overhead charges, including accounting and finance,
global research and development, etc. (“Corporate”), because the Company believes that these costs are also not
within the control of the individual segments. Production of products, production asset management, quality
management and procurement are centrally managed at Corporate by Global Manufacturing Operations. These
Corporate activities do not fulfill the definition of a segment. Products are transferred to the segments at cost;
therefore no internal profit is generated. The associated internal revenues for the product transfers and their
elimination are recorded as Corporate activities. Capital expenditures for production are based on the expected
demand of the segments and consolidated profitability considerations. In addition, certain revenues, investments
and intangible assets, as well as any related expenses, are not allocated to a segment but are accounted for as
Corporate.
Information pertaining to the Company’s segment and Corporate activities for the twelve-month periods
ended December 31, 2013, 2012 and 2011 is set forth below.

F-61
North
America
Segment
International
Segment Segment Total Corporate Total
2013
Net revenue external customers $ 9,606,111 $ 4,970,319 $ 14,576,430 $ 33,297 $ 14,609,727
Inter - segment revenue 7,045 - 7,045 (7,045) -
Revenue 9,613,156 4,970,319 14,583,475 26,252 14,609,727
Depreciation and amortization (330,371) (185,570) (515,941) (132,284) (648,225)
Operating Income 1,623,984 858,308 2,482,292 (226,096) 2,256,196
Income (loss) from equity method investees 19,297 1,672 20,969 5,136 26,105
Segment assets 14,698,039 6,177,482 20,875,521 2,244,385 23,119,906
thereof investments in equity method
investees 268,370 396,524 664,894 (448) 664,446
Capital expenditures, acquisitions and
investments (1) 789,340 286,420 1,075,760 167,903 1,243,663
2012
Net revenue external customers $ 9,031,108 $ 4,740,132 $ 13,771,240 $ 29,042 $ 13,800,282
Inter - segment revenue 10,072 - 10,072 (10,072) -
Revenue 9,041,180 4,740,132 13,781,312 18,970 13,800,282
Depreciation and amortization (310,216) (175,504) (485,720) (117,176) (602,896)
Operating Income 1,615,348 809,269 2,424,617 (206,044) 2,218,573
Income (loss) from equity method investees 23,408 919 24,327 (6,885) 17,442
Segment assets 14,170,453 5,892,477 20,062,930 2,263,068 22,325,998
thereof investments in equity method
investees 266,521 378,626 645,147 (7,774) 637,373
Capital expenditures, acquisitions and
investments (2) 2,147,522 230,888 2,378,410 175,808 2,554,218
2011
Net revenue external customers $ 7,925,472 $ 4,627,950 $ 12,553,422 $ 17,093 $ 12,570,515
Inter - segment revenue 9,196 - 9,196 (9,196) -
Revenue 7,934,668 4,627,950 12,562,618 7,897 12,570,515
Depreciation and amortization (269,055) (173,600) (442,655) (114,628) (557,283)
Operating Income 1,435,450 807,437 2,242,887 (167,995) 2,074,892
Income (loss) from equity method investees 32,387 69 32,456 (1,497) 30,959
Segment assets 11,761,777 5,589,421 17,351,198 2,181,652 19,532,850
thereof investments in equity method
investees 322,990 370,447 693,437 (1,412) 692,025
Capital expenditures, acquisitions and
investments (3) 1,055,183 1,161,825 2,217,008 166,176 2,383,184
(1) North America and International acquisitions exclude $48,231 and $18,686, respectively, of non-cash acquisitions and investments for 2013.
(2) North America and International acquisitions exclude $484,699 and $6,624, respectively, of non-cash acquisitions and investments for 2012.
(3) North America and International acquisitions exclude $6,000 and $225,034, respectively, of non-cash acquisitions and investments for 2011.
For the geographic presentation, revenues are attributed to specific countries based on the end user's location
for products and the country in which the service is provided. Information with respect to the Company's
geographic operations is set forth in the table below:
Germany
North
America
Rest of
the World Total
2013
Net revenue $ 437,459 $ 9,606,111 $ 4,566,157 $ 14,609,727
Long-lived assets 609,040 12,891,384 3,226,779 16,727,203
2012
Net revenue $ 409,195 $ 9,031,108 $ 4,359,979 $ 13,800,282
Long-lived assets 493,782 12,428,762 3,185,773 16,108,317
2011
Net revenue $ 422,476 $ 7,925,472 $ 4,222,567 $ 12,570,515
Long-lived assets 420,573 10,326,615 3,040,872 13,788,060

F-62
25. Supplemental Condensed Combining Information
FMC Finance III, a former wholly-owned subsidiary of the Company, issued 6⅞% Senior Notes due 2017 in
July 2007. On June 20, 2011, Fresenius Medical Care US Finance, Inc. (“US Finance”) acquired substantially all
of the assets of FMC Finance III and assumed its obligations, including the 6⅞% Senior Notes and the related
indenture. The 6⅞% Senior Notes are fully and unconditionally guaranteed, jointly and severally on a senior
basis, by the Company and by the Guarantor Subsidiaries. The 6⅞% Senior Notes and related guarantees were
issued in an exchange offer registered under the Securities Act of 1933. The financial statements in this report
present the financial condition of the Company, on a consolidated basis at December 31, 2013 and December 31,
2012 and its results of operations and cash flows for the periods ended December 31, 2013, 2012 and 2011. The
following combining financial information for the Company is at December 31, 2013 and December 31, 2012
and for the periods ended December 31, 2013, 2012 and 2011, segregated between FMC US Finance as issuer,
the Company, D-GmbH and FMCH as guarantors, and the Company’s other businesses (the “Non-Guarantor
Subsidiaries”). For purposes of the condensed combining information, the Company and the guarantors carry
their investments under the equity method. Other (income) expense includes income (loss) related to investments
in consolidated subsidiaries recorded under the equity method for purposes of the condensed combining
information. In addition, other (income) expense includes income and losses from profit and loss transfer
agreements as well as dividends received.
For the year ended December 31, 2013
Issuer Guarantors
FMC US
Finance
FMC - AG &
Co. KGaA D-GmbH FMCH
Non-Guarantor
Subsidiaries
Combining
Adjustment
Combined
Total
Net revenue $ - $ - $ 2,084,014 $ - $ 15,825,782 $ (3,300,069) $ 14,609,727
Cost of revenue - - 1,356,114 - 11,789,397 (3,274,181) 9,871,330
Gross profit - - 727,900 - 4,036,385 (25,888) 4,738,397
Operating expenses (income):
Selling, general and
administrative(1) - 184,054 284,589 (128,356) 2,150,296 (134,187) 2,356,396
Research and development - - 72,638 - 53,336 (169) 125,805
Operating (loss) income - (184,054) 370,673 128,356 1,832,753 108,468 2,256,196
Other (income) expense:
Interest, net (6,871) 210,759 5,922 176,643 22,108 - 408,561
Other, net - (1,545,184) 259,165 (824,853) - 2,110,872 -
Income (loss) before income taxes 6,871 1,150,371 105,586 776,566 1,810,645 (2,002,404) 1,847,635
Income tax expense (benefit) 2,494 40,481 108,837 (19,049) 652,672 (193,423) 592,012
Net Income (loss) 4,377 1,109,890 (3,251) 795,615 1,157,973 (1,808,981) 1,255,623
Net Income attributable to
noncontrolling interests - - - - 145,733 - 145,733
Net income (loss) attributable to
shareholders of FMC-AG & Co.
KGaA $ 4,377 $ 1,109,890 $ (3,251) $ 795,615 $ 1,012,240 $ (1,808,981) $ 1,109,890
(1) Selling, general and administrative is presented net of gain on sale of dialysis clinics and net of income from equity method investees.

F-63
For the year ended December 31, 2012
Issuer Guarantors
FMC US
Finance
FMC - AG &
Co. KGaA D-GmbH FMCH
Non-Guarantor
Subsidiaries
Combining
Adjustment
Combined
Total
Net revenue $ - $ - $ 1,884,622 $ - $ 14,806,815 $ (2,891,155) $ 13,800,282
Cost of revenue - - 1,197,337 - 10,876,513 (2,874,821) 9,199,029
Gross profit - - 687,285 - 3,930,302 (16,334) 4,601,253
Operating expenses (income):
Selling, general and
administrative (1) - 59,222 203,284 (51,963) 2,030,970 29,536 2,271,049
Research and development - - 69,025 - 42,442 164 111,631
Operating (loss) income - (59,222) 414,976 51,963 1,856,890 (46,034) 2,218,573
Other (income) expense:
Investment gain - - - - (139,600) - (139,600)
Interest, net (6,839) 216,914 2,682 156,794 71,797 (15,288) 426,060
Other, net - (1,531,505) 261,505 (921,180) - 2,191,180 -
Income (loss) before income taxes 6,839 1,255,369 150,789 816,349 1,924,693 (2,221,926) 1,932,113
Income tax expense (benefit) 2,482 68,560 119,255 (41,356) 698,353 (242,158) 605,136
Net Income (loss) 4,357 1,186,809 31,534 857,705 1,226,340 (1,979,768) 1,326,977
Net Income attributable to
noncontrolling interests - - - - 140,168 - 140,168
Net income (loss) attributable to
shareholders of FMC-AG & Co.
KGaA $ 4,357 $ 1,186,809 $ 31,534 $ 857,705 $ 1,086,172 $ (1,979,768) $ 1,186,809
(1) Selling, general and administrative is presented net of gain on sale of dialysis clinics, net of income from equity method investees and net of other operating expenses.
For the year ended December 31, 2011
Issuer Guarantors
FMC US
Finance
FMC - AG &
Co. KGaA D-GmbH FMCH
Non-Guarantor
Subsidiaries
Combining
Adjustment
Combined
Total
Net revenue $ - $ - $ 1,931,016 $ - $ 13,498,566 $ (2,859,067) $ 12,570,515
Cost of revenue - - 1,210,733 - 10,020,572 (2,812,831) 8,418,474
Gross profit - - 720,283 - 3,477,994 (46,236) 4,152,041
Operating expenses (income):
Selling, general and
administrative (1) 1 158,222 208,022 67,587 1,611,194 (78,711) 1,966,315
Research and development - - 68,876 - 41,958 - 110,834
Operating (loss) income (1) (158,222) 443,385 (67,587) 1,824,842 32,475 2,074,892
Other (income) expense:
Interest, net (5,351) 90,148 6,867 82,205 140,567 (17,903) 296,533
Other, net - (1,379,577) 297,281 (691,312) - 1,773,608 -
Income (loss) before income taxes 5,350 1,131,207 139,237 541,520 1,684,275 (1,723,230) 1,778,359
Income tax expense (benefit) 2,016 60,053 124,322 (59,093) 685,166 (211,367) 601,097
Net Income (loss) 3,334 1,071,154 14,915 600,613 999,109 (1,511,863) 1,177,262
Net Income attributable to
noncontrolling interests - - - - - 106,108 106,108
Net income (loss) attributable to
shareholders of FMC-AG & Co.
KGaA $ 3,334 $ 1,071,154 $ 14,915 $ 600,613 $ 999,109 $ (1,617,971) $ 1,071,154
(1) Selling, general and administrative is presented net of gain on sale of dialysis clinics and net of income from equity method investees.

F-64
For the year ended December 31, 2013
Issuer Guarantors
Non-Guarantor
Subsidiaries
Combining
Adjustment
Combined
Total FMC
US Finance
FMC - AG &
Co. KGaA D-GmbH FMCH
Net Income $ 4,377 $ 1,109,890 $ (3,251) $ 795,615 $ 1,157,973 $ (1,808,981) $ 1,255,623
Gain (loss) related to cash flow
hedges - 21,020 - - 1,512 - 22,532
Actuarial gain (loss) on defined
benefit pension plans - (971) (15,150) 83,597 (2,487) - 64,989
Gain (loss) related to foreign
currency translation - (158,328) 32,934 - (12,896) 23,851 (114,439)
Income tax (expense) benefit
related to components of other
comprehensive income - (6,317) (4,418) 32,979 (55,844) - (33,600)
Other comprehensive income (loss),
net of tax - (144,596) 13,366 116,576 (69,715) 23,851 (60,518)
Total comprehensive income $ 4,377 $ 965,294 $ 10,115 $ 912,191 $ 1,088,258 $ (1,785,130) $ 1,195,105
Comprehensive income attributable
to noncontrolling interests - - - - - 143,689 143,689
Comprehensive income attributable to
shareholders of FMC-AG & Co.
KGaA $ 4,377 $ 965,294 $ 10,115 $ 912,191 $ 1,088,258 $ (1,928,819) $ 1,051,416
For the year ended December 31, 2012
Issuer Guarantors
Non-Guarantor
Subsidiaries
Combining
Adjustment
Combined
Total FMC
US Finance
FMC - AG &
Co. KGaA D-GmbH FMCH
Net Income $ 4,357 $ 1,186,809 $ 31,534 $ 857,705 $ 1,226,340 $ (1,979,768) $ 1,326,977
Gain (loss) related to cash flow
hedges - (4,465) (9) 11,725 16,768 - 24,019
Actuarial gain (loss) on defined
benefit pension plans - (2,091) (46,830) (49,796) (4,461) - (103,178)
Gain (loss) related to foreign
currency translation - (84,026) 18,540 - 132,627 (3,338) 63,803
Income tax (expense) benefit
related to components of other
comprehensive income - 3,615 13,447 15,019 (23,250) - 8,831
Other comprehensive income (loss),
net of tax - (86,967) (14,852) (23,052) 121,684 (3,338) (6,525)
Total comprehensive income $ 4,357 $ 1,099,842 $ 16,682 $ 834,653 $ 1,348,024 $ (1,983,106) $ 1,320,452
Comprehensive income attributable
to noncontrolling interests - - - - - 139,989 139,989
Comprehensive income attributable to
shareholders of FMC-AG & Co.
KGaA $ 4,357 $ 1,099,842 $ 16,682 $ 834,653 $ 1,348,024 $ (2,123,095) $ 1,180,463
For the year ended December 31, 2011
Issuer Guarantors Non-
Guarantor
Subsidiaries
Combining
Adjustment
Combined
Total FMC
US Finance
FMC - AG &
Co. KGaA D-GmbH FMCH
Net Income $ 3,334 $ 1,071,154 $ 14,915 $ 600,613 $ 999,109 $ (1,511,863) $ 1,177,262
Gain (loss) related to cash flow
hedges - (124,662) (269) 49,857 (27,372) - (102,446)
Actuarial gain (loss) on defined
benefit pension plans - (174) (6,457) (74,921) (354) - (81,906)
Gain (loss) related to foreign currency
translation - (9,754) (7,047) - (165,371) 938 (181,234)
Income tax (expense) benefit related
to components of other
comprehensive income - 36,864 1,966 9,964 23,823 - 72,617
Other comprehensive income (loss), net
of tax - (97,726) (11,807) (15,100) (169,274) 938 (292,969)
Total comprehensive income $ 3,334 $ 973,428 $ 3,108 $ 585,513 $ 829,835 $ (1,510,925) $ 884,293
Comprehensive income attributable to
noncontrolling interests - - - - - 104,861 104,861
Comprehensive income attributable to
shareholders of FMC-AG & Co.
KGaA $ 3,334 $ 973,428 $ 3,108 $ 585,513 $ 829,835 $ (1,615,786) $ 779,432

F-65
At December 31, 2013
Issuer Guarantors
Non-Guarantor
Subsidiaries
Combining
Adjustment
Combined
Total FMC US
Finance
FMC - AG &
Co. KGaA D-GmbH FMCH
Current assets:
Cash and cash equivalents $ 0 $ 13 $ 4,490 $ - $ 672,206 $ 6,068 $ 682,777
Trade accounts receivable, less
allowance for doubtful accounts - - 152,480 - 2,882,736 2,058 3,037,274
Accounts receivable from related
parties 1,269,092 960,137 815,748 1,643,394 4,073,975 (8,609,228) 153,118
Inventories - - 287,625 - 946,790 (137,311) 1,097,104
Prepaid expenses and other current
assets - 71,939 41,240 167 879,085 44,960 1,037,391
Deferred taxes - - - - 322,337 (43,285) 279,052
Total current assets 1,269,092 1,032,089 1,301,583 1,643,561 9,777,129 (8,736,738) 6,286,716
Property, plant and equipment, net - 734 238,469 - 2,980,268 (127,517) 3,091,954
Intangible assets - 501 73,166 - 684,290 (81) 757,876
Goodwill - - 62,829 - 11,595,358 - 11,658,187
Deferred taxes - 80,931 14,209 - 118,306 (109,279) 104,167
Other assets (1) - 13,955,933 47,661 12,583,246 5,234,132 (30,599,966) 1,221,006
Total assets $ 1,269,092 $ 15,070,188 $ 1,737,917 $ 14,226,807 $ 30,389,483 $ (39,573,581) $ 23,119,906
Current liabilities:
Accounts payable $ - $ 2,193 $ 28,689 $ - $ 511,715 $ - $ 542,597
Accounts payable to related parties - 1,896,712 522,719 1,600,480 4,931,344 (8,827,326) 123,929
Accrued expenses and other current
liabilities 29,770 45,897 129,727 9,403 1,786,709 11,027 2,012,533
Short-term borrowings and other
financial liabilities - 60 - - 96,588 - 96,648
Short-term borrowings from related
parties - - - - 62,342 - 62,342
Current portion of long-term debt and
capital lease obligations - 271,090 - 200,000 40,280 - 511,370
Income tax payable - 114,197 - - 56,163 - 170,360
Deferred taxes - 2,331 9,002 - 64,539 (41,678) 34,194
Total current liabilities 29,770 2,332,480 690,137 1,809,883 7,549,680 (8,857,977) 3,553,973
Long term debt and capital lease
obligations, less current portion 1,167,466 96,699 - 2,438,189 7,478,944 (3,434,378) 7,746,920
Long term debt from related parties - 3,359,606 - 2,092,818 6,940 (5,459,364) -
Other liabilities - 5,616 6,028 - 298,313 19,604 329,561
Pension liabilities - 10,377 254,233 - 171,248 - 435,858
Income tax payable 2,287 30,846 - - 20,262 123,538 176,933
Deferred taxes - - - - 768,156 (24,766) 743,390
Total liabilities 1,199,523 5,835,624 950,398 6,340,890 16,293,543 (17,633,343) 12,986,635
Noncontrolling interests subject to put
provisions - - 0 - 648,251 - 648,251
Total FMC-AG & Co. KGaA
shareholders' equity 69,569 9,234,564 787,519 7,885,917 13,197,233 (21,940,238) 9,234,564
Noncontrolling interests not subject to
put provisions - - - - 250,456 - 250,456
Total equity 69,569 9,234,564 787,519 7,885,917 13,447,689 (21,940,238) 9,485,020
Total liabilities and equity $ 1,269,092 $ 15,070,188 $ 1,737,917 $ 14,226,807 $ 30,389,483 $ (39,573,581) $ 23,119,906
(1) Other assets are presented net of investment in equity method investees.

F-66
At December 31, 2012
Issuer Guarantors
FMC US
Finance
FMC - AG &
Co. KGaA D-GmbH FMCH
Non-
Guarantor
Subsidiaries
Combining
Adjustment
Combined
Total
Current assets:
Cash and cash equivalents $ 1 $ 78 $ 501 $ - $ 686,457 $ 1,003 $ 688,040
Trade accounts receivable, less
allowance for doubtful accounts - - 170,627 - 2,848,797 - 3,019,424
Accounts receivable from related
parties 1,269,471 2,257,445 1,449,317 3,562,953 4,398,630 (12,800,007) 137,809
Inventories - - 271,039 - 885,613 (119,843) 1,036,809
Prepaid expenses and other current
assets - 72,022 27,693 167 837,152 40,503 977,537
Deferred taxes - - - - 311,280 (43,443) 267,837
Total current assets 1,269,472 2,329,545 1,919,177 3,563,120 9,967,929 (12,921,787) 6,127,456
Property, plant and equipment, net - 611 206,873 - 2,856,000 (122,881) 2,940,603
Intangible assets - 584 67,874 - 641,714 (56) 710,116
Goodwill - - 54,848 - 11,367,041 - 11,421,889
Deferred taxes - 51,111 10,123 - 131,452 (103,534) 89,152
Other assets (1) - 12,675,998 650,255 11,766,104 (4,751,531) (19,304,044) 1,036,782
Total assets $ 1,269,472 $ 15,057,849 $ 2,909,150 $ 15,329,224 $ 20,212,605 $ (32,452,302) $ 22,325,998
Current liabilities:
Accounts payable $ - $ 1,935 $ 41,114 $ - $ 579,245 $ - $ 622,294
Accounts payable to related parties - 2,234,205 491,525 1,598,852 8,663,240 (12,864,472) 123,350
Accrued expenses and other current
liabilities 29,771 27,530 102,728 3,157 1,611,997 12,288 1,787,471
Short-term borrowings and other
financial liabilities - 38 - - 117,812 - 117,850
Short-term borrowings from related
parties - - - - 3,973 - 3,973
Current portion of long-term debt and
capital lease obligations - 207,160 - 100,000 27,587 - 334,747
Income tax payable - 130,636 - - 19,367 - 150,003
Deferred taxes - 1,622 8,126 - 61,774 (41,219) 30,303
Total current liabilities 29,771 2,603,126 643,493 1,702,009 11,084,995 (12,893,403) 3,169,991
Long term debt and capital lease
obligations, less current portion 1,172,397 285,049 - 2,559,340 7,020,190 (3,251,236) 7,785,740
Long term debt from related parties - 3,212,455 657,284 2,019,925 64,530 (5,898,020) 56,174
Other liabilities - 6,696 12,679 110,637 96,322 33,923 260,257
Pension liabilities - 7,753 202,219 - 247,701 - 457,673
Income tax payable 2,113 264 - - 52,684 146,581 201,642
Deferred taxes - - - - 685,158 (21,157) 664,001
Total liabilities 1,204,281 6,115,343 1,515,675 6,391,911 19,251,580 (21,883,312) 12,595,478
Noncontrolling interests subject to put
provisions - - - - 523,260 - 523,260
Total FMC-AG & Co. KGaA
shareholders' equity 65,191 8,942,506 1,393,475 8,937,313 173,011 (10,568,990) 8,942,506
Noncontrolling interests not subject to
put provisions - - - - 264,754 - 264,754
Total equity 65,191 8,942,506 1,393,475 8,937,313 437,765 (10,568,990) 9,207,260
Total liabilities and equity $ 1,269,472 $ 15,057,849 $ 2,909,150 $ 15,329,224 $ 20,212,605 $ (32,452,302) $ 22,325,998
(1) Other assets are presented net of investment in equity method investees.

F-67
For the year ended December 31, 2013
Issuer Guarantors
FMC US
Finance
FMC - AG &
Co. KGaA D-GmbH FMCH
Non-
Guarantor
Subsidiaries
Combining
Adjustment
Combined
Total
Operating Activities:
Net income (loss) $ 4,377 $ 1,109,890 $ (3,251) $ 795,615 $ 1,157,973 $ (1,808,981) $ 1,255,623
Adjustments to reconcile net income to
net cash provided by (used in) operating
activities:
Equity affiliate income - (924,138) - (824,853) - 1,748,991 -
Depreciation and amortization - 689 52,029 - 629,071 (33,564) 648,225
Change in deferred taxes, net - (34,548) 3,149 - 46,888 424 15,913
(Gain) loss on sale of fixed assets and
investments - (43) 437 - (33,378) - (32,984)
(Gain) loss on investments - - (61) - - 61 -
(Write Up) write-off loans from related
parties - 91,593 - - - (91,593) -
Compensation expense related to stock
options - 13,593 - - - - 13,593
Cash inflow (outflow) from hedging - (4,073) - - - - (4,073)
Investments in equity method
investees, net - 22,945 - - (20,610) - 2,335
Changes in assets and liabilities, net of
amounts from businesses acquired:
Trade accounts receivable, net - - 14,851 - (54,149) (1,982) (41,280)
Inventories - - (4,162) - (70,848) 20,092 (54,918)
Prepaid expenses and other current and
non-current assets - 46,352 (11,519) (123,972) 151,907 5,107 67,875
Accounts receivable from / payable to
related parties (8) (334,000) 644,752 128,185 (559,991) 106,351 (14,711)
Accounts payable, accrued expenses
and other current and non-current
liabilities - 11,469 21,203 6,246 181,426 (5,080) 215,264
Income tax payable 174 7,917 - (19,049) (23,818) (1,281) (36,057)
Net cash provided by (used in)
operating activities 4,543 7,646 717,428 (37,828) 1,404,471 (61,455) 2,034,805
Investing Activities:
Purchases of property, plant and
equipment - (320) (76,096) - (712,213) 40,691 (747,938)
Proceeds from sale of property, plant and
equipment - 48 583 - 19,216 - 19,847
Disbursement of loans to related parties - 911,133 - 141,347 - (1,052,480) -
Acquisitions and investments, net of cash
acquired, and purchases of intangible
assets - (103,308) (24,503) (1,000) (492,683) 125,769 (495,725)
Proceeds from divestitures - - - - 18,276 - 18,276
Net cash provided by (used in)
investing activities - 807,553 (100,016) 140,347 (1,167,404) (886,020) (1,205,540)
Financing Activities:
Short-term borrowings, net - 20 (613,593) - 597,859 - (15,714)
Long-term debt and capital lease
obligations, net (4,544) (140,374) - 1,629,443 (2,713,226) 1,052,480 (176,221)
Increase (decrease) of accounts
receivable securitization program - - - - 189,250 - 189,250
Proceeds from exercise of stock options - 102,419 - - 8,881 - 111,300
Proceeds from conversion of preference
shares into ordinary shares - 34,784 - - - - 34,784
Purchase of treasury stock - (505,014) - - - - (505,014)
Dividends paid - (296,134) - - (2,884) 2,884 (296,134)
Capital increase (decrease) - - - (1,731,962) 1,834,786 (102,824) -
Distributions to noncontrolling interest - - - - (216,758) - (216,758)
Contributions from noncontrolling
interest - - - - 66,467 - 66,467
Net cash provided by (used in)
financing activities (4,544) (804,299) (613,593) (102,519) (235,625) 952,540 (808,040)
Effect of exchange rate changes on cash
and cash equivalents - (10,965) 170 - (15,693) - (26,488)
Cash and Cash Equivalents:
Net increase (decrease) in cash and cash
equivalents (1) (65) 3,989 - (14,251) 5,065 (5,263)
Cash and cash equivalents at beginning of
period 1 78 501 - 686,457 1,003 688,040
Cash and cash equivalents at end of period $ 0 $ 13 $ 4,490 $ - $ 672,206 $ 6,068 $ 682,777
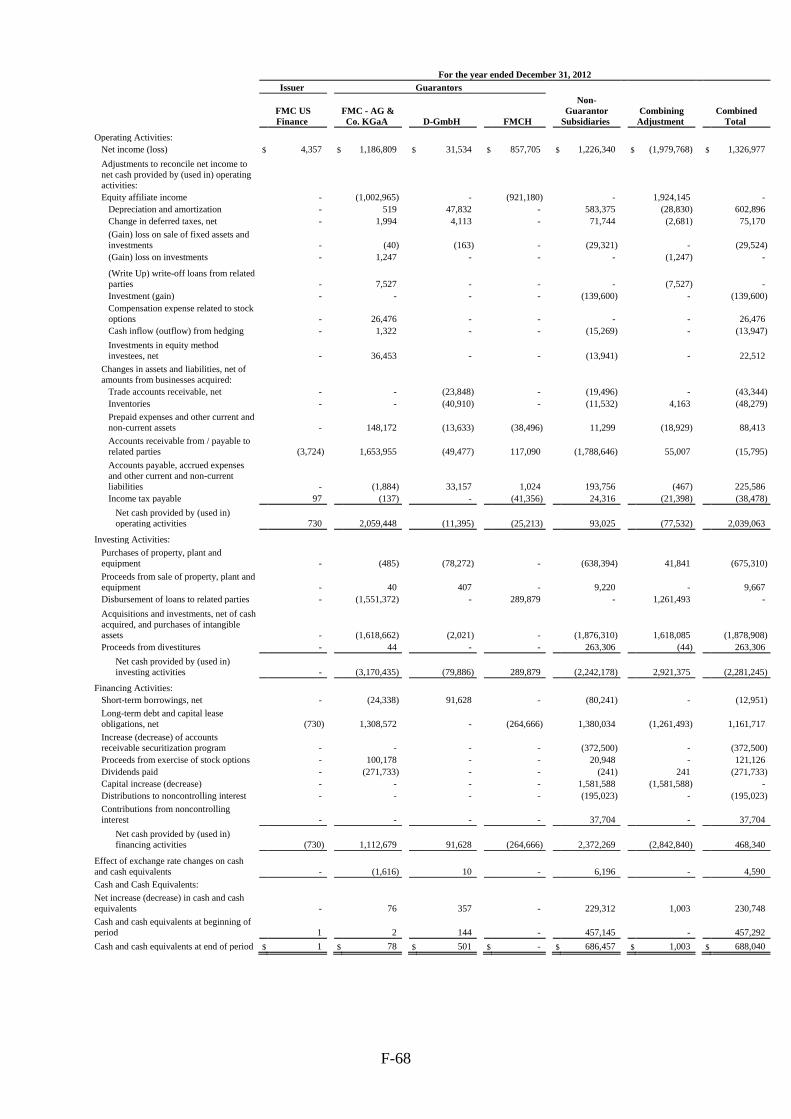
F-68
For the year ended December 31, 2012
Issuer Guarantors
FMC US
Finance
FMC - AG &
Co. KGaA D-GmbH FMCH
Non-
Guarantor
Subsidiaries
Combining
Adjustment
Combined
Total
Operating Activities:
Net income (loss) $ 4,357 $ 1,186,809 $ 31,534 $ 857,705 $ 1,226,340 $ (1,979,768) $ 1,326,977
Adjustments to reconcile net income to
net cash provided by (used in) operating
activities:
Equity affiliate income - (1,002,965) - (921,180) - 1,924,145 -
Depreciation and amortization - 519 47,832 - 583,375 (28,830) 602,896
Change in deferred taxes, net - 1,994 4,113 - 71,744 (2,681) 75,170
(Gain) loss on sale of fixed assets and
investments - (40) (163) - (29,321) - (29,524)
(Gain) loss on investments - 1,247 - - - (1,247) -
(Write Up) write-off loans from related
parties - 7,527 - - - (7,527) -
Investment (gain) - - - - (139,600) - (139,600)
Compensation expense related to stock
options - 26,476 - - - - 26,476
Cash inflow (outflow) from hedging - 1,322 - - (15,269) - (13,947)
Investments in equity method
investees, net - 36,453 - - (13,941) - 22,512
Changes in assets and liabilities, net of
amounts from businesses acquired:
Trade accounts receivable, net - - (23,848) - (19,496) - (43,344)
Inventories - - (40,910) - (11,532) 4,163 (48,279)
Prepaid expenses and other current and
non-current assets - 148,172 (13,633) (38,496) 11,299 (18,929) 88,413
Accounts receivable from / payable to
related parties (3,724) 1,653,955 (49,477) 117,090 (1,788,646) 55,007 (15,795)
Accounts payable, accrued expenses
and other current and non-current
liabilities - (1,884) 33,157 1,024 193,756 (467) 225,586
Income tax payable 97 (137) - (41,356) 24,316 (21,398) (38,478)
Net cash provided by (used in)
operating activities 730 2,059,448 (11,395) (25,213) 93,025 (77,532) 2,039,063
Investing Activities:
Purchases of property, plant and
equipment - (485) (78,272) - (638,394) 41,841 (675,310)
Proceeds from sale of property, plant and
equipment - 40 407 - 9,220 - 9,667
Disbursement of loans to related parties - (1,551,372) - 289,879 - 1,261,493 -
Acquisitions and investments, net of cash
acquired, and purchases of intangible
assets - (1,618,662) (2,021) - (1,876,310) 1,618,085 (1,878,908)
Proceeds from divestitures - 44 - - 263,306 (44) 263,306
Net cash provided by (used in)
investing activities - (3,170,435) (79,886) 289,879 (2,242,178) 2,921,375 (2,281,245)
Financing Activities:
Short-term borrowings, net - (24,338) 91,628 - (80,241) - (12,951)
Long-term debt and capital lease
obligations, net (730) 1,308,572 - (264,666) 1,380,034 (1,261,493) 1,161,717
Increase (decrease) of accounts
receivable securitization program - - - - (372,500) - (372,500)
Proceeds from exercise of stock options - 100,178 - - 20,948 - 121,126
Dividends paid - (271,733) - - (241) 241 (271,733)
Capital increase (decrease) - - - - 1,581,588 (1,581,588) -
Distributions to noncontrolling interest - - - - (195,023) - (195,023)
Contributions from noncontrolling
interest - - - - 37,704 - 37,704
Net cash provided by (used in)
financing activities (730) 1,112,679 91,628 (264,666) 2,372,269 (2,842,840) 468,340
Effect of exchange rate changes on cash
and cash equivalents - (1,616) 10 - 6,196 - 4,590
Cash and Cash Equivalents:
Net increase (decrease) in cash and cash
equivalents - 76 357 - 229,312 1,003 230,748
Cash and cash equivalents at beginning of
period 1 2 144 - 457,145 - 457,292
Cash and cash equivalents at end of period $ 1 $ 78 $ 501 $ - $ 686,457 $ 1,003 $ 688,040

F-69
For the year ended December 31, 2011
Issuer Guarantors
FMC US
Finance
FMC - AG &
Co. KGaA D-GmbH FMCH
Non-
Guarantor
Subsidiaries
Combining
Adjustment
Combined
Total
Operating Activities:
Net income (loss) $ 3,334 $ 1,071,154 $ 14,915 $ 600,613 $ 999,109 $ (1,511,863) $ 1,177,262
Adjustments to reconcile net income to
net cash provided by (used in) operating
activities:
Equity affiliate income - (872,048) - (691,312) - 1,563,360 -
Depreciation and amortization - 858 49,207 5,768 514,843 (13,393) 557,283
Change in deferred taxes, net - 12,593 2,724 - 150,598 (6,734) 159,181
(Gain) loss on sale of fixed assets and
investments - (10) (184) - (8,791) - (8,985)
(Gain) loss on investments - 31,502 186 - - (31,688) -
(Write Up) write-off loans from related
parties - 44,807 - - - (44,807) -
Compensation expense related to stock
options - 29,071 - - - - 29,071
Cash outflow from hedging - - - - (58,113) - (58,113)
Investments in equity method
investees, net - - - - (30,959) - (30,959)
Changes in assets and liabilities, net of
amounts from businesses acquired:
Trade accounts receivable, net - - (13,401) - (239,393) - (252,794)
Inventories - - (47,022) - (135,071) 30,203 (151,890)
Prepaid expenses and other current and
non-current assets - (133,691) (3,048) 86,497 (80,570) (46) (130,858)
Accounts receivable from / payable to
related parties (12,372) (1,183,881) (51,617) 54,300 1,239,464 (62,058) (16,164)
Accounts payable, accrued expenses
and other current and non-current
liabilities 13,775 (40,619) 28,385 79 131,427 (641) 132,406
Income tax payable 2,016 80,461 - (59,093) (509) 18,167 41,042
Net cash provided by (used in)
operating activities 6,753 (959,803) (19,855) (3,148) 2,482,035 (59,500) 1,446,482
Investing Activities:
Purchases of property, plant and
equipment - (221) (54,545) - (569,645) 26,556 (597,855)
Proceeds from sale of property, plant and
equipment - - 775 - 26,550 - 27,325
Disbursement of loans to related parties - 1,571,874 200 (1,118,399) - (453,675) -
Acquisitions and investments, net of cash
acquired, and purchases of intangible
assets - (148,331) (4,554) - (2,529,849) 897,405 (1,785,329)
Proceeds from divestitures - - 418 - 9,990 (418) 9,990
Net cash provided by (used in)
investing activities - 1,423,322 (57,706) (1,118,399) (3,062,954) 469,868 (2,345,869)
Financing Activities:
Short-term borrowings, net - 26,284 77,481 (298) (142,444) - (38,977)
Long-term debt and capital lease
obligations, net (64,252) (221,594) - 433,455 1,147,586 453,675 1,748,870
Redemption of trust preferred securities - - - - (653,760) - (653,760)
Increase (decrease) of accounts
receivable securitization program - - - - 24,500 - 24,500
Proceeds from exercise of stock options - 81,883 - - 13,010 - 94,893
Dividends paid - (280,649) - - 22 (22) (280,649)
Capital increase (decrease) 57,500 - - 688,390 151,097 (896,987) -
Distributions to noncontrolling interest - - - - (129,542) - (129,542)
Contributions from noncontrolling
interest - - - - 27,824 - 27,824
Net cash provided by (used in)
financing activities (6,752) (394,076) 77,481 1,121,547 438,293 (443,334) 793,159
Effect of exchange rate changes on cash
and cash equivalents - (216,618) (1) - 257,247 22 40,650
Cash and Cash Equivalents:
Net increase (decrease) in cash and cash
equivalents 1 (147,175) (81) - 114,621 (32,944) (65,578)
Cash and cash equivalents at beginning of
period - 147,177 225 - 342,524 32,944 522,870
Cash and cash equivalents at end of period $ 1 $ 2 $ 144 $ - $ 457,145 $ - $ 457,292

FRESENIUS MEDICAL CARE AG & Co. KGaA
Schedule II – Valuation and Qualifying Accounts
(in thousands, except share data)
S-II
Development of allowance for doubtful accounts
2013 2012 2011
Allowance for doubtful accounts as of January 1 $ 328,893 $ 299,751 $ 277,139
Change in valuation allowances as recorded in the consolidated
statements of income 336,090 303,508 241,598
Write-offs and recoveries of amounts previously written-off (249,783) (273,643) (214,612)
Foreign currency translation (2,035) (723) (4,374)
Allowance for doubtful accounts as of December 31 $ 413,165 $ 328,893 $ 299,751

XXX
EXHIBIT 12.1
CERTIFICATION PURSUANT TO SECTION 302
OF THE SARBANES-OXLEY ACT OF 2002
I, Rice Powell, certify that:
1. I have reviewed this annual report on Form 20-F of Fresenius Medical Care AG & Co. KGaA (the
“Report”);
2. Based on my knowledge, this Report does not contain any untrue statement of a material fact or omit to
state a material fact necessary to make the statements made, in light of the circumstances under which
such statements were made, not misleading with respect to the period covered by this Report;
3. Based on my knowledge, the financial statements, and other financial information included in this
Report, fairly present in all material respects the financial condition, results of operations and cash
flows of the company as of, and for, the periods presented in this Report;
4. The company’s other certifying officer and I are responsible for establishing and maintaining disclosure
controls and procedures (as defined in Exchange Act Rules 13a-15(e) and 15d-15(e)) and internal
control over financial reporting (as defined in Exchange Act Rules 13a-15(f) and 15d-15(f)) for the
company and have:
(a) Designed such disclosure controls and procedures, or caused such disclosure controls and
procedures to be designed under our supervision, to ensure that material information relating to
the company, including its consolidated subsidiaries, is made known to us by others within
those entities, particularly during the period in which this Report is being prepared;
(b) Designed such internal control over financial reporting, or caused such internal control over
financial reporting to be designed under our supervision, to provide reasonable assurance
regarding the reliability of financial reporting and the preparation of financial statements for
external purposes in accordance with generally accepted accounting principles;
(c) Evaluated the effectiveness of the company’s disclosure controls and procedures and presented
in this Report our conclusions about the effectiveness of the disclosure controls and
procedures, as of the end of the period covered by this Report based on such evaluation; and
(d) Disclosed in this Report any change in the company’s internal control over financial reporting
that occurred during the period covered by the annual Report that has materially affected, or is
reasonably likely to materially affect, the company’s internal control over financial reporting;
and
5. The company’s other certifying officer and I have disclosed, based on our most recent evaluation of
internal control over financial reporting, to the company’s auditors and the audit committee of the
company’s board of directors (or persons performing the equivalent functions):
(a) All significant deficiencies and material weaknesses in the design or operation of internal
control over financial reporting which are reasonably likely to adversely affect the company’s
ability to record, process, summarize and report financial information; and
(b) Any fraud, whether or not material, that involves management or other employees who have a
significant role in the company’s internal control over financial reporting.
Date: February 25, 2014
By: /s/ RICE POWELL
Rice Powell
Chief Executive Officer and
Chairman of the Management Board of
Fresenius Medical Care Management AG,
General Partner of
Fresenius Medical Care AG & Co. KGaA

XXX
EXHIBIT 12.2
CERTIFICATION PURSUANT TO SECTION 302
OF THE SARBANES-OXLEY ACT OF 2002
I, Michael Brosnan, certify that:
1. I have reviewed this annual report on Form 20-F of Fresenius Medical Care AG & Co. KGaA (the
“Report”);
2. Based on my knowledge, this report does not contain any untrue statement of a material fact or omit to
state a material fact necessary to make the statements made, in light of the circumstances under which
such statements were made, not misleading with respect to the period covered by this report;
3. Based on my knowledge, the financial statements, and other financial information included in this
report, fairly present in all material respects the financial condition, results of operations and cash flows
of the company as of, and for, the periods presented in this report;
4. The company’s other certifying officer and I are responsible for establishing and maintaining disclosure
controls and procedures (as defined in Exchange Act Rules 13a-15(e) and 15d-15(e)) and internal
control over financial reporting (as defined in Exchange Act Rules 13a-15(f) and 15d-15(f)) for the
company and have:
(a) Designed such disclosure controls and procedures, or caused such disclosure controls and
procedures to be designed under our supervision, to ensure that material information relating to
the company, including its consolidated subsidiaries, is made known to us by others within
those entities, particularly during the period in which this report is being prepared;
(b) Designed such internal control over financial reporting, or caused such internal control over
financial reporting to be designed under our supervision, to provide reasonable assurance
regarding the reliability of financial reporting and the preparation of financial statements for
external purposes in accordance with generally accepted accounting principles;
(c) Evaluated the effectiveness of the company’s disclosure controls and procedures and presented
in this report our conclusions about the effectiveness of the disclosure controls and procedures,
as of the end of the period covered by this report based on such evaluation; and
(d) Disclosed in this report any change in the company’s internal control over financial reporting
that occurred during the period covered by the annual report that has materially affected, or is
reasonably likely to materially affect, the company’s internal control over financial reporting;
and
5. The company’s other certifying officer and I have disclosed, based on our most recent evaluation of
internal control over financial reporting, to the company’s auditors and the audit committee of the
company’s board of directors (or persons performing the equivalent functions):
(a) All significant deficiencies and material weaknesses in the design or operation of internal
control over financial reporting which are reasonably likely to adversely affect the company’s
ability to record, process, summarize and report financial information; and
(b) Any fraud, whether or not material, that involves management or other employees who have a
significant role in the company’s internal control over financial reporting.
Date: February 25, 2014
By: /s/ MICHAEL BROSNAN
Michael Brosnan
Chief Financial Officer and
Member of the Management Board of
Fresenius Medical Care Management AG,
General Partner of
Fresenius Medical Care AG & Co. KGaA

XXX
EXHIBIT 13.1
CERTIFICATION PURSUANT TO
18 U.S.C. SECTION 1350,
AS ADOPTED PURSUANT TO
SECTION 906 OF THE SARBANES-OXLEY ACT OF 2002
In connection with the Annual Report on Form 20-F of Fresenius Medical Care AG & Co. KGaA (the
“Company”) for the year ended December 31, 2013 as filed with the Securities and Exchange Commission on
the date hereof (the “Report”), the undersigned, Rice Powell, Chief Executive Officer and Chairman of the
Management Board of Fresenius Medical Care Management AG, the general partner of the Company, and
Michael Brosnan, Chief Financial Officer and Member of the Management Board of Fresenius Medical Care
Management AG, the general partner of the Company, certify, pursuant to 18 U.S.C. § 1350, as adopted pursuant
to § 906 of the Sarbanes-Oxley Act of 2002, that:
(1) The Report fully complies with the requirements of section 13(a) or 15(d) of the Securities Exchange
Act of 1934, as amended; and
(2) The information contained in the Report fairly presents, in all material respects, the financial condition
and result of operations of the Company.
By: /s/ RICE POWELL
Chief Executive Officer and
Chairman of the Management Board of
Fresenius Medical Care Management AG,
General Partner of
Fresenius Medical Care AG & Co. KGaA
February 25, 2014
By: /s/ MICHAEL BROSNAN
Chief Financial Officer and
Member of the Management Board of Fresenius Medical
Care Management AG,
General Partner of
Fresenius Medical Care AG & Co. KGaA
February 25, 2014