freshwater vertebrate and invertebrate diversity patterns
TRANSCRIPT

Full Terms & Conditions of access and use can be found athttps://www.tandfonline.com/action/journalInformation?journalCode=tneo20
Neotropical Biodiversity
ISSN: (Print) 2376-6808 (Online) Journal homepage: https://www.tandfonline.com/loi/tneo20
Freshwater vertebrate and invertebrate diversitypatterns in an Andean-Amazon basin: implicationsfor conservation efforts
Janeth Lessmann, Juan M. Guayasamin, Kayce L. Casner, Alexander S.Flecker, W. Chris Funk, Cameron K. Ghalambor, Brian A. Gill, Iván Jácome-Negrete, Boris C. Kondratieff, LeRoy N. Poff, José Schreckinger, Steven A.Thomas, Eduardo Toral-Contreras, Kelly R. Zamudio & Andrea C. Encalada
To cite this article: Janeth Lessmann, Juan M. Guayasamin, Kayce L. Casner, Alexander S.Flecker, W. Chris Funk, Cameron K. Ghalambor, Brian A. Gill, Iván Jácome-Negrete, Boris C.Kondratieff, LeRoy N. Poff, José Schreckinger, Steven A. Thomas, Eduardo Toral-Contreras, KellyR. Zamudio & Andrea C. Encalada (2016) Freshwater vertebrate and invertebrate diversity patternsin an Andean-Amazon basin: implications for conservation efforts, Neotropical Biodiversity, 2:1,99-114, DOI: 10.1080/23766808.2016.1222189
To link to this article: https://doi.org/10.1080/23766808.2016.1222189
© 2016 The Author(s). Published by InformaUK Limited, trading as Taylor & FrancisGroup
View supplementary material
Published online: 12 Sep 2016. Submit your article to this journal
Article views: 3121 View related articles
View Crossmark data Citing articles: 4 View citing articles

Freshwater vertebrate and invertebrate diversity patterns in an Andean-Amazon basin:implications for conservation efforts
Janeth Lessmanna,b,c,d* , Juan M. Guayasamina , Kayce L. Casnere, Alexander S. Fleckerf, W. Chris Funke,Cameron K. Ghalambore, Brian A. Gille, Iván Jácome-Negreteg , Boris C. Kondratieffe, LeRoy N. Poffe,
José Schreckingera , Steven A. Thomash, Eduardo Toral-Contrerasb, Kelly R. Zamudiof and Andrea C. Encaladaa,i
aColegio de Ciencias Biológicas y Ambientales, Universidad San Francisco de Quito (LEA-USFQ). Pámpite y Diego de Robles,Cumbayá, Ecuador; bCentro de Investigación de la Biodiversidad y el Cambio Climático – BioCamb, Ingeniería en Biodiversidad y
Recursos Genéticos, Facultad de Ciencias de Medio Ambiente, Universidad Tecnológica Indoamérica, Quito, Ecuador;cDepartamento de Ecología, Facultad de Ciencias Biológicas, Pontificia Universidad Católica de Chile, Alameda, Chile; dInstitutode Ecología y Biodiversidad (IEB), Casilla, USA; eDepartment of Biology, Graduate Degree Program in Ecology, Colorado State
University, Fort Collins, CO, USA; fDepartment of Ecology and Evolutionary Biology, Cornell University, Ithaca, NY, USA; gInstitutoQuichua de Biotecnología Sacha Supai (IQBSS), Quito, Ecuador; hSchool of Natural Resources, University of Nebraska, Lincoln,NE, USA; iIMAR / MARE, Department of Life Sciences, Calçada Martím de Freitas, University of Coimbra, Coimbra, Portugal
(Received 7 November 2015; accepted 5 August 2016)
The Napo Basin in Ecuador is an important drainage of the Amazon Basin, the most biodiverse ecosystem for freshwaterspecies. At the same time, this basin has conspicuous information gaps on its biodiversity patterns and human threats. Here,we estimated the diversity distribution patterns of freshwater vertebrates and invertebrates in the Napo Basin, as a tool forpresent and future management and conservation efforts. Also, we assessed the spatial congruence of the diversity patternsobserved between aquatic vertebrates and invertebrates. For this, we compiled occurrence records for 481 freshwater verte-brate species (amphibians, birds, mammals, reptiles, and fish), and 54 invertebrate families obtained across an altitudinalgradient of the basin (200–4500 m). Using these occurrence records and environmental variables, we modeled the distribu-tion of each vertebrate species and invertebrate family. Then, we stacked these distributions to build species richness mapsfor vertebrates, and a family richness map for invertebrates. We found that the most diverse areas for vertebrate species arethe lowlands (<600 m), whereas richness of invertebrate families peaks at higher elevations (lower montane forests). Con-gruence among species richness patterns of the five vertebrate groups was high (r = 0.66), with fish being the best predictorfor vertebrates (r = 0.78). However, congruence decreased at higher elevations (r = 0.14), suggesting that specific species orhabitat-based approaches should be used in the highlands. Also, we found a high correlation between species and familyrichness of freshwater invertebrates (r = 0.66), suggesting that family richness of invertebrates could be used as a surrogateof species richness in this basin. We highlight this correlation because, at the watershed scale, it allows working with familygroups where species-level taxonomy is challenging. Our results provide the first comprehensive representation of freshwa-ter biodiversity patterns at high resolution in an Andean-Amazon basin, and calls attention to the need for incorporating dif-ferent taxonomic groups when assessing diversity patterns. Given these different diversity patterns, conservation programsfor this basin should incorporate both vertebrate and invertebrate groups as biodiversity indicators. Finally, our study pro-vides a practical methodological guidance in the estimation of freshwater diversity in regions of scarce information withhigh conservation priority, such as the Andean-Amazon basins.
Keywords: Ecuador; freshwater tropical ecosystems; Napo Basin; aquatic invertebrate families; vertebrate species
La cuenca del Napo es un drenaje importante de la cuenca del Amazonas, el ecosistema más biodiverso en especies deagua dulce. Sin embargo, esta cuenca presenta importantes vacíos de información sobre los patrones de biodiversidad ylas amenazas humanas. Este estudio estima los patrones de distribución de la diversidad de vertebrados e invertebrados deagua dulce en la cuenca del Napo de Ecuador, evalúa la congruencia espacial entre dichos patrones de diversidad y dis-cute las implicaciones de estos resultados en los esfuerzos actuales y futuros en el manejo y conservación de la cuenca.Para ello, recopilamos datos de presencia de 481 especies de vertebrados de agua dulce (anfibios, aves, mamíferos, reptilesy peces), y de 54 familias de invertebrados obtenidos en el gradiente altitudinal de la cuenca (200–4500 m). A partir deestos datos de presencia y de variables ambientales, modelamos la distribución de las especies de vertebrados y de lasfamilias de invertebrados. Posteriormente, combinamos las distribuciones espaciales obtenidas para construir mapas deriqueza de especies de vertebrados, y de riqueza de familias de invertebrados. Encontramos que las tierras bajas (<600 m)son las áreas más diversas para vertebrados acuáticos, mientras que la riqueza de las familias de invertebrados tienen picosde riqueza en elevaciones más altas (bosque montano bajo). La congruencia espacial entre los mapas de riqueza de loscinco grupos vertebrados fue alta (r = 0.66), siendo el patrón de los peces el mejor indicador de riqueza (r = 0.78). Sinembargo, esta congruencia entre los vertebrados disminuye a medida que incrementa la elevación (r = 0.14), por lo quepara la conservación en tierras altas son preferibles los enfoques basados en manejo de hábitat o en especies específicas.También se encontró una alta correlación entre la riqueza de especies y de familias de invertebrados de agua dulce
*Corresponding author. Email: [email protected]
© 2016 The Author(s). Published by Informa UK Limited, trading as Taylor & Francis Group.This is an Open Access article distributed under the terms of the Creative Commons Attribution License (http://creativecommons.org/licenses/by/4.0/), which permitsunrestricted use, distribution, and reproduction in any medium, provided the original work is properly cited.
Neotropical Biodiversity, 2016Vol. 2, No. 1, 99–114, http://dx.doi.org/10.1080/23766808.2016.1222189
Published online 12 Sep 2016

(r = 0.66), lo que sugiere que la riqueza de la familia podría ser utilizado como sustituto de la de especies en esta cuenca;destacamos esta correlación ya que es difícil trabajar con taxonomía a nivel de especie de invertebrados a escala decuenca. De esta forma, nuestros resultados proporcionan la primera representación de los patrones de biodiversidad deagua dulce a alta resolución en una cuenca andino-amazónicos y llama la atención sobre la necesidad de incorporar losdiferentes grupos taxonómicos en la evaluación de los patrones de diversidad. Teniendo en cuenta estos diferentespatrones de diversidad, los programas de conservación en esta cuenca deben incorporar tanto los grupos de vertebrados einvertebrados como indicadores de biodiversidad. Por último, nuestro estudio proporciona una práctica orientaciónmetodológica en la estimación de la biodiversidad de agua dulce en regiones de escasa información con alta prioridad deconservación, tales como las cuencas andino-amazónicas.
Palabras claves: Ecuador; Cuenca del Napo; ecosistemas tropicales de agua dulce; familias de invertebrados acuáticos;especies de vertebrados
Introduction
Freshwater ecosystems are among the most speciose inthe world.[1] Globally, over 126,000 described speciesinhabit freshwater systems, including fish, mollusks,amphibians, reptiles, insects, plants, and mammals, all ofthem concentrated in less than 1% of the world’s sur-face area.[1,2] However, freshwater diversity is highlythreatened by human activities, including dams, waterwithdrawals, pollution, invasive species, and overharvest-ing.[3] These impacts to freshwater biodiversity may alsodiminish the provision of freshwater ecosystem services,such as food security and nutrition, which are essentialto human populations.[4]
In order to implement conservation and managementprograms for freshwater groups, a better understanding ofspecies distributions and diversity patterns is essential.[5]For example, the identification of priority areas for fresh-water biodiversity conservation requires information onthe distribution of species and their levels of protectioninside protected area networks.[6] Similarly, the use ofsurrogates or biodiversity indicators, which facilitate thedevelopment of conservation programs, heavily rely onunderstanding how effectively one taxon predicts the spe-cies richness pattern of other taxa.[7–9] Nevertheless,despite the conservation crisis for freshwater diversity,there is a lack of comprehensive, synthesized data aboutfreshwater species distributions. As consequence of theseinformation gaps in the freshwater biological knowledge,in the tropics terrestrial plants and vertebrates are usuallyused to direct conservation planning, whereas freshwatergroups are overlooked.[10] Also, these biodiversity indi-cators have been more intensely explored for guiding themanagement of terrestrial ecosystems, and there is stilllittle experience in terms of their application to aquaticenvironments. Moreover, the longitudinal nature and theconnectivity that characterizes river and stream ecosys-tems suggest that their effective management will requiredifferent levels of information (e.g. flow and inundationarea) and the adaptation of planning tools that reflect theparticularities of lotic ecosystems.
Although recent years have witnessed increasedefforts to estimate the richness of freshwater vertebrate
species at a global scale,[6,11–13] the validity of thesepatterns at finer spatial scales is relatively unexplored.[5]Moreover, the usefulness of this information to guidemanagement and conservation interventions that areimplemented at smaller geographical scales (i.e. water-shed) is limited.[6,13] In this context, a more effectivemanagement of river and stream ecosystems will requirethe development and adaptation of tools for gatheringand interpreting information on the patterns of biodiver-sity of these ecosystems at scales that are relevant forintegrative management.
The Napo River Basin, in the northern EcuadorianAndes, is one of the main tributaries of the Amazon Riverbasin,[14] and offers a striking example of the ecologicaland socioeconomic complexities that make conservationof lotic ecosystems in the tropical Andes challenging.[15]The Napo Basin is considered part of the most biologicallydiverse ecoregion in the world for freshwater fish, amphib-ians, birds, and mammals.[6,11,12,16] In fact, this water-shed harbors more than 560 fish species, a number thatgreatly exceeds the species richness of other large water-sheds around the globe.[17,18] This high diversity ispossibly explained by the large altitudinal gradient(158–5890 m) that generates a great variety of climaticconditions.[19] Also, there are unique habitats throughoutthe region such as productive flooded forests, oxbowlakes, black, clear and white water streams, which promotehigher fish diversity and endemism.[16,18,20]
Despite its biological importance, the Napo Basin issubject to a wide array of human-induced threats. In recentdecades, there has been an important increase in humanland use and extractive practices in the basin,[21] whichare threatening its long-term viability, the integrity of itsbiodiversity, and the ecosystem services that multiplehuman populations derive from this region.[22] Specifi-cally, this basin is exposed to numerous impacts caused byhydroelectric projects, oil extraction, copper and gold min-ing, timber extraction, extensive agriculture and cattleranching.[15,19,21,23–25] At the same time, the basinlacks systematic information about its freshwater speciesdistributions and diversity patterns, an information gap thathinders adequate conservation and management initiatives.
100 J. Lessmann et al.

A systematic analysis of freshwater diversity in atropical basin presents substantial challenges. First, high-quality information on the spatial distribution of speciesis difficult to compile and, typically, this information isincomplete and spatially biased to the most accesibleareas.[26,27] Therefore, instead of using spatially biaseddata, it is advisable to spatially model freshwater speciesdistributions using observed locality data and environ-mental variables.[28] This technique is known as distri-bution or habitat modeling, and has been used innumerous studies to address sampling bias, data sparse-ness, and to characterize species richness and distributionfor a great variety of groups.[29,30]
Entire taxonomic groups that are speciose and sensi-tive to human impacts are regularly ignored in diversitystudies.[31] Ideally, an accurate estimation of freshwaterdiversity patterns should include both vertebrate andinvertebrate taxa because they may have different diver-sity patterns.[1,2,31] However, typically, adequate dataon the diversity of most invertebrate groups in tropicalfreshwaters do not exist.[1] Therefore, the second chal-lenge to study the freshwater diversity in the Napo Basinis the incorporation of freshwater invertebrate taxa,which requires invertebrate inventories across a broadaltitudinal gradient. Moreover, considering the highspecies diversity of invertebrates in the tropics and thelarge size of the Napo Basin, taxonomic identifications atthe species level are costly in terms of money, humaneffort, expertise, and time.[32] Instead, family-level iden-tification for invertebrates is more efficient, and problemssuch as under-sampling and erroneous identifications aregreatly reduced, increasing the reliability and robustnessof the patterns revealed.[33] Nevertheless, for conserva-tion planning in the Napo Basin, the validity of aquaticinvertebrate family richness patterns as a proxy forspecies diversity patterns must be evaluated.[32]
In this context, by using the Napo Basin in northeasternEcuador as a case study, this research aims to provide amodel for characterizing freshwater biodiversity patternsfor large Andean-Amazon basins. Specifically, we explorethe use of spatial distribution modeling to describe thediversity patterns for both freshwater vertebrate and inver-tebrate groups. We also assess the congruence of diversitypatterns observed among freshwater vertebrate taxa andbetween two different taxonomic levels of invertebratefauna (family and species). The ultimate goal of theseanalyses is to identify taxonomic groups that can‘t actas surrogates for characterizing biodiversity patternsfor conservation.[5] Our study provides methodologicalguidance for the estimation of freshwater diversity inassemblages that exhibit high species richness and hetero-geneity in terms of the species dependency on fluvial aqua-tic ecosystems. Finally, our study discusses implicationsfor conservation planning of fluvial ecosystems, especiallyalong altitudinal gradients in Andean-Amazon watersheds.
Methods
Study area
This study was carried out in the 59,573 km2 NapoBasin in North-eastern Ecuador (Figure 1(a)). Althoughthe Napo Basin extends beyond the international bordersof Ecuador (to Perú and Colombia), for the remainder ofthis paper we use ‘Napo Basin’ to refer only to theEcuadorian portion of this watershed. The digital infor-mation of the limits and configuration of the Napo Basinwas obtained from the Instituto Geográfico Militar delEcuador.[34]
The Napo Basin in Ecuador comprises an altitudinalgradient of more than 5000 m, with thousands of streamsand rivers that run through 25 ecosystems.[35] Themajority of large rivers in the lower Napo Basin (e.g.Napo, Coca, Tiputini, Yasuní, and Curaray) are ‘whitewaters rivers’,[36] that drain extensive territories in theAndean mountains and gather large amounts of sedi-ments, which result in the murky and alkaline nature ofthese rivers.[10] The lower Napo Basin also harbors asmaller number of acidic ‘blackwater’ rivers, whichoriginate in lowland swamps and flooded forests andowe their tea-like appearance to humic acids and othertannic and organic compounds released during decompo-sition of leaf litter in these forests.[10] In contrast to thelower part of the basin, a vast number of smaller streamsand fast rivers of stony substrate, drain the upper reachesand have clear and well-oxygenated water that tumbledown the steep slopes of the Andes.
Given the large altitudinal gradient and differentecological formations of our study area, we classified theNapo Basin into three main altitudinal zones to facilitatethe discussion and interpretation of results: lowlands(<600 m), lower montane forests (600–1600 m), andupper montane forests ecosystems (1600–5897 m).Although this classification is relatively arbitrary, weused these ranges to reflect the very different topographythat characterizes these altitudinal zones and influencestheir aquatic biota. The upper montane forest (which inthis case includes the páramo ecosystems) is character-ized by complex topography and steep slopes, with fastrunning rivers and streams that cut deep canyons throughthe mountains. The lower montane forests coincide withthe area where the slopes of the Andes recede and therivers become bigger and wider as they approach theAmazonian plain. Finally, the lowland forests are charac-terized by relatively flat terrain and large, slow-movingrivers that are loaded with sediments eroded from theAndes.
Freshwater biodiversity data
We considered as freshwater fauna the following taxa:(i) species that are fully aquatic during their entire life
Neotropical Biodiversity 101

Figure 1. Study area, the Napo Basin in Ecuador. (A) Altitudinal gradient, main rivers, floodplains systems, and some main riversand cities in the basin. (B) Location of all vertebrate species records obtained from museum databases and online data-sets, and(C) sampling localities surveyed for freshwater invertebrates and amphibians during this study.
102 J. Lessmann et al.

cycle (e.g. riffle beetles, and fish), (ii) species thatdepend on streams, rivers, ponds, or lakes at least in onelife-history stage (e.g. aquatic larvae of otherwise terres-trial amphibians or invertebrates), and (iii) species withpreference for aquatic habitats for feeding, nesting, andbreeding (e.g. ducks and egrets).
To assess freshwater vertebrate diversity, we includedrecords from amphibians, birds, mammals, reptiles, andfish. For all these species, we collected presence datafrom museum databases (MZUTI: Museo de Zoología,Universidad Tecnológica Indoamérica, Ecuador) andonline data-sets,[37–39] books, and scientific papers (seeAppendix S1 in supplementary data for a list of thereferences). As result, a total of 20,261 records for 481freshwater vertebrate species were included in our study(Figure 1(b)), corresponding to 10 mammals, 19 reptiles,93 amphibians, 138 birds, and 221 fish (see AppendixS2 for a list of the species included). These data repre-sent 83% of freshwater species of mammals,[40,41] 60%of reptiles,[42] 90% of birds,[42,43] 74% of amphibians,[44–46] and 40% of fish [17,20] reported for the NapoBasin.
In addition to locality data from the literature, we col-lected new data on amphibians and aquatic invertebratesduring field surveys covering an elevational gradient from218 to 4246 m in the Napo the basin (see EVOTRAC[47] and PEER [48] projects). Amphibians were sampledalong streams at 200 m elevation intervals, when possible;two researchers sampled each stream once during three-to-four hours per night and collected individuals wereidentified to the species level at the MZUTI. For inverte-brates, a total of 134 streams were sampled along the ele-vation gradient in the Napo Basin (Figure 1(c)). At eachstream site, we collected five Surber samples and oneD-net sample (500 uM mesh) for 5 min. Samples weresorted and classified in the Aquatic Ecology Laboratory ofUniversidad San Francisco de Quito (LEA-USFQ). Givenour large number of samples, the high diversity, and taxo-nomic complexity of aquatic invertebrate in the tropics,all specimens were classified to the family level, resultingin 54 families (50 insect families and four non-insectfamilies; see Appendix S2 in supplementary data for a listof the families collected) with more than five uniquerecords in the basin. All specimens are housed at MZUTI(Patente No. 010–2015-FAU-DPAP-MA).
Modeling freshwater biodiversity patterns
The diversity patterns of freshwater fauna in the NapoBasin were analyzed using species richness for vertebratesand family richness for invertebrates.[5] To calculate spe-cies richness for vertebrates, we first estimated their geo-graphic distributions, using Species Distribution Models(SDMs).[49] SDM is a technique that generalizes theempirical relationships between species occurrences and
underlying habitat conditions, to predict the probability ofspecies occurrence within a given area. To constructSDMs, we used Maxent, a machine-learning algorithmbased on the principle of maximum entropy.[50] Maxentis an adequate technique for our goal because it performsadequately when modeling presence-only occurrence datawith low sample sizes, and with moderate errors in theirgeoreferencing.[29,51,52]
In the case of invertebrates, for each sampling site,we estimated the number of invertebrate families. How-ever, the relationship between family richness and envi-ronmental variables was problematic to model, probablybecause of the diverse ecological requirements of specieswithin each of the 54 families. Therefore, we modeledthe geographic distribution of each family using Maxent,producing an equation that relates the family occurrencesand the corresponding environmental variables. Thisapproach has some limitations, such as treating a familyas a biological unit, when in reality, species are actuallythe biological units that interact and evolve a given eco-logical niche.[49] However, predicting the geographicdistributions of a supraspecific monophyletic taxa hasbeen carried out by other studies [53–55] based on thefact that ecological niches are attributes of supraspecificclades, as result of a composite function of the niches ofits constituent species. In the case of the Napo Basin, ithas been reported that several invertebrate families andeven orders show clear diversity patterns related toenvironmental variables such as altitude and watertemperature,[33,56] facilitating the modeling of thesesupraspecific taxa.
Vertebrate species and invertebrate families with fiveor more unique data records in the Napo Basin weremodeled.[57,58] As environmental predictors, weselected a set of 16 variables related to climate, topogra-phy, hydrology, and landscape, at ~0.5 km2 of resolution,hypothesized to influence the distribution of the freshwa-ter species at a regional scale (Table 1).
For vertebrates, we had to implement two mainmodifications in the modeling process according to thedifferent levels of dependence of species to water bodies.The first modification was the use of different sets ofenvironmental variables. The distribution of obligatefreshwater species (such as fish and some mammals) isstrongly influenced by the characteristics of the basinsbecause they are confined to freshwater environmentsand are unable to move by land or air.[5,13] Thus, tomodel these species we included three variables relatedto microbasin characteristics such as flow accumulation,density of drainage, and drainage size. However, birds,amphibians, and semiaquatic mammals are able to dis-perse overland, and, therefore, are less dependent onbasin conditions.[5] For these species, the modeling pro-tocol excluded the three variables related to microbasins,resulting in biologically relevant SDMs.
Neotropical Biodiversity 103

The second modification in the construction of thevertebrate SDMs was the generation of different back-ground sets. To represent the range of environmentalconditions in the modeled region, background data areconstructed, which usually consists of 10,000 randompoints in the study area.[59] Instead, species occurrencerecords in the Napo Basin are biased towards main rivercourses, which are easily navigable and usually nearurban centers (Figure 1). These sampling differencesbetween the species occurrence and random backgroundleads to inaccurate models for birds and amphibianssince the distribution of several of these species are notrestricted to the main rivers.[59–61] To solve this prob-
lem, SDMs for birds and amphibians were constructedusing their presence localities as background data. Thus,these backgrounds reflect the same sample selection biasas the occurrence data, improving the performance of theSDMs.[59–61] In contrast, for fish, mammals, reptiles,and invertebrates that have a naturally high diversity ofspecies in the main watercourses, the use of abackground with 10,000 random points across all theNapo Basin was more appropriate. For invertebrates, weexcluded the size and water accumulation of microbasinsfrom the modeling because these variables showed lowvariability among sampling sites, biasing the familydistribution models for the invertebrate families.
Table 1. Environmental data layers used in the species and family distribution models.
Variable Description Data source
ClimaticAnnual maximum
temperatureAir temperature was used as a substitute for water temperatures, since thesetwo variables are usually strongly positively correlated in regional and large-scale studies [102]
Ministerio del Ambientedel Ecuador [35]
Annual minimumtemperature
Annual precipitation The precipitation has an important influence in the water regimes, flow rivers,and flood process
Ministerio del Ambientedel Ecuador [35]
TopographicElevation (DEM) Elevation and slope are important in describing the hydrological
characteristics of the river, providing favorable or non-favorable habitats [103]SRTM (http://srtm.csi.cgiar.org/)
Slope Derived from DEMAspect Aspect is an important contributor to vegetation and habitat type, as north-
facing slopes often have very different conditions and temperatures thansouth-facing slopes [87]
Derived from DEM
HydrologicTopographic wetness
indexThis index involves the upslope contributing area (a), a slope, and a coupleof geometric functions. Higher values represent drainage depressions andmore wetness
Derived from DEM
General curvature The curvatures indicate the concavity or convexity of regions, and whererunning water would converge, diverge, accelerate or decelerate as it flowsover the region [87]
Derived from DEMLongitudinal CurvatureCross-sectional curvatureAverage of flow
accumulation inmicrobasins
The flow accumulation represents the potential water accumulation in thestream channels
Derived from DEM
Drainage density inmicrobasins
The drainage density has been determined as influent in the fishdistributions.[104] For each microbasin we divide the total stream length (km)by microbasin area (km2)
Derived from DEM
Microbasin size The watershed area is related to river size and strongly influences stream fishassemblages [104]
IGM (www.igm.gob.ec)
Floodplains (categorical) The floodplains systems may have different species compositions given theirdifference in the hydrological regimes. Floodplain zones: lakes and lagoonsand other flooded areas by more than 8 months. Floodable zones: seasonallyflooded with water from overflowing rivers or local precipitation. Zonessusceptibility to flood: occasionally they may be flooded due to overflowingrivers or high rainfall events
Ministerio del Ambientedel Ecuador [35]
LandscapeEcosystems (categorical) The ecosystems indicate important aspects of the different habitats and the
zones with different “type of waters”, which influence the distribution ofaquatic species
Sierra [105]
Geomorphology(categorical)
Describe the three-dimensional landscape (geoforms) characterized by one ormore morphometric, lithological and structural attributes. The geomorphologyinfluences the distribution of species and ecosystems at multiple scales
Ministerio del Ambientedel Ecuador [35]
104 J. Lessmann et al.

The distribution models were developed with Maxent3.3.3e,[62] setting the convergence threshold to 10−5,maximum iterations to 500, and the regularizationparameter to ‘auto’. Given the large number of speciesin this study, we did not remove highly correlated vari-ables, allowing Maxent to choose the most informativevariables among all predictors for modeling each species.Also, we were not interested in explaining the impor-tance of the environmental predictors for each species,which is the aspect that could be affected when corre-lated variables are included.[63,64] For vertebrate spe-cies, we reclassified the 0.0–1.0 distribution model mapsinto binary (presence/absence) maps using the MaximumTraining Sensitivity Plus Specificity threshold, whichminimizes the false-presence errors.[65] For inverte-brates, we reclassified the models with the ‘MinimumTraining Presence’ threshold, which ensures that allrecords collected in the field for each family are includedas presences in its binary distribution map. As a controlmeasure of the modeling performance, we employed theAUC statistic (Area under ROC curve), which was cal-culated using 10-fold cross-validation.[66] Also, wecompared the resulting models with the species distribu-tions reported in the literature [40,41,43,67] and with theexpert opinion in the case of fish species. Thus, whennecessary, we removed areas of overprediction and areasbeyond geographic barriers that are likely to precludespecies dispersal.[68]
Finally, we generated vertebrate species richnessmaps, which show the number of species by ~0.5 km2.These maps were produced by summing all individualbinary SDMs for all species and for each vertebrate spe-cies group. Similarly, for freshwater invertebrates weadded all the family distribution models to obtain afamily richness map. Also, we used analyses of varianceand Tukey HSD to test differences in vertebrate andinvertebrate richness among the three elevation levels.
Congruence of freshwater biodiversity patterns
We explored congruence among diversity patterns of thefive vertebrate groups using pairwise Spearman correla-tion coefficients. We calculated the correlation betweenthe numbers of species in each pixel from the speciesrichness maps of the five vertebrate groups. We also ana-lyzed congruence separately for each of the three eleva-tion levels (lowlands, lower montane forests, and uppermontane forests) to assess if the importance of a speciesgroup as a surrogate may change with elevation. Sincethese analyses invoked a large number of tests (10 corre-lations within each altitudinal zone), we used a Bonfer-roni correction and considered significant only thosecorrelations for which p < 0.05/10 = 0.005. In addition,considering that pixels within a richness map could bespatially autocorrelated, to test for significance of the
correlation analyses we used a modified t-test, which cal-culates an effective number of degrees of freedom due tospatial autocorrelation.[69]
We also examined the validity of using families ofinvertebrates as surrogates for species diversity patterns.For this, we classified invertebrates to morphospecies for26 samples located between 1700 and 4250 m. Then,through a Pearson analysis we correlated the number offamilies and the number of species found in each samplesite. In this case, a positive and significant correlationcould allow us to analyze the correlation level betweenthe diversity patterns of invertebrate families andvertebrate species.
In order to ensure the reliability of our data forconservation purposes, the correlation level among thevertebrate groups and between the taxonomic levels ofthe invertebrate should be more than r = 0.5.[5,9]
Results
Diversity pattern for freshwater biodiversity
Distribution models of the 418 vertebrate species and 54invertebrate families were acceptable in regard to AUCvalues (all > 0.7).[66] Average AUC values variedamong groups: invertebrates (0.95, SD 0.03), fish (0.95,SD 0.07), birds (0.92, SD 0.07), mammals (0.92, SD0.07), reptiles (0.87, SD 0.07), and amphibians (0.82,SD 0.07) (see Appendix S2 and S3).
The lowlands of the Napo Basin were inferred to bethe most diverse area for vertebrates (F(2, 255367) = 80,309,p < 0.0001; Tukey HSD test p < 0.0001, Figure 2a).Within this altitudinal zone, the highest species richness isfound in large microbasins with large drainage area andwater accumulation, as well as in flooded forests. In addi-tion, several poorly known rivers such as the Cononaco,Nashiño, and Ashmahuayacu, for which we had no infor-mation or few records, appear as potentially diverse areasfor vertebrate species.
Similar to the general vertebrate diversity pattern,fish, reptiles, and mammals had diversity peaks in themain rivers, whereas the richest areas for birds andamphibians were less restricted to these water courses(Figure 2(b–f)). Also, species richness of fish, the mostdiverse group of the vertebrates in the Napo Basin, washighest in the lowlands with a steep decrease at eleva-tions >600 m. In contrast, the other groups have severalspecies distributed at higher elevations.
Contrary to the patterns observed for vertebrates,areas between 1100 and 1900 m concentrate pixels thathave high richness of invertebrate families (Figure 3).Similarly, and according to the altitudinal levels, thelower montane forest were the most rich in families(F(2, 255367) = 43,190; p < 0.0001; Tukey HSD testp < 0.0001). Specifically, the orders of Coleoptera,
Neotropical Biodiversity 105

Figure 2. Species richness for freshwater vertebrates in the Napo Basin. Species richness maps were obtained from the summationof the species distribution models of (A) all species, (B) amphibians, (C) birds, (D) mammals, (E) reptiles, and (F) fish. Main stateprotected areas in the Napo Basin are: Yasuní National Park (Y NP), Cuyabeno Faunistic Reserve (C FR), Cayambe Coca NationalPark (CC NP), Sumaco Napo-Galeras National Park (SN NP), Antisana Ecological Reserve (A ER), Colonso-Chalupas BiologicalReserve (CC BR), and Llanganates National Park (L NP).
106 J. Lessmann et al.

Diptera, Ephemeroptera, and Trichoptera, had theirdiversity peaks at higher elevations. Other orders (i.e.,Odonata, Megaloptera, and Hemiptera), however, aremore diverse in lowland areas.
Congruence of the freshwater biodiversity patterns
In the Napo Basin, spatial pattern of species richness offreshwater vertebrates are significantly correlated acrossthe five vertebrate taxa, with mean correlation valuesgenerally high (r = 0.66, SD 0.11, Table 2). On average,fish have the highest level of correlation with the othervertebrate groups (r = 0.78, SD 0.03), although correla-tion with birds was not significant (p > 0.005). Incontrast, birds and mammals have the lowest aver-age correlation coefficients with other groups of freshwa-ter vertebrates (r = 0.61, SD 0.12; r = 0.61, SD 0.10,respectively).
Correlation of richness patterns among vertebratespecies groups decreases as the altitude increases(Table 2). In the lowlands, species richness patterns hadthe highest correlation values (r = 0.58, SD 0.18), fol-lowed by montane forests, where correlation is moderate(r = 0.39, SD 0.19). In the streams and rivers of theupper montane forests, the average correlation is veryweek (r = 0.14, SD 0.36), as well as pairwise correla-tions between groups (r < 0.3).
For the 26 water sampling sites between 1700 and4250 m, species richness of freshwater invertebrates washighly correlated with family richness (r = 0.66,p < 0.05). Finally, we found an insignificant negativecorrelation between diversity patterns for invertebratefamilies and vertebrate species, (r = −0.33, p = 0.32).
Discussion
Studies focused on freshwater diversity patterns are avital foundation for natural resource management andconservation in tropical basins.[10] In Andean-Amazonbasins, these studies have been scarce, probably becausethe difficulty of addressing its great diversity in speciesand explore the different environments of the region.Here, based on biological records and spatial modelingtechniques, we generated comprehensive information inhigh resolution on the freshwater biodiversity patterns inthe Napo Basin in an effort to facilitate conservation andmanagement of the large basins that constitute the head-waters of the Amazon river.
Freshwater biodiversity patterns
Our study uncovers patterns inferred from an extensivecollection of freshwater taxa records (481 vertebrate spe-cies and 54 aquatic invertebrate families), representingapproximately 60% of the known freshwater species ofamphibians, birds, mammals, reptiles, and fish in theNapo Basin. We decided to include species with differentlevels of freshwater dependence because (i) all freshwa-ter species, whether or not they are confined to aquaticenvironment, are affected by human pressures to theseecosystems, and (ii) this set of species also reflects theinterconnectedness between aquatic ecosystems and theterrestrial environments that they drain. We also madeefforts to incorporate information from the entire basin, achallenging task given its notable area and altitudinalgradient, as well as from organisms with differentecological requirements and evolutionary trajectories(vertebrates and invertebrates). Thus, our biologicaldataset is unique and provides useful insights into thediversity patterns of the region.
Based on distribution models, we found that for allvertebrates (amphibians, birds, mammals, reptiles, andfish), species richness was highest in the lowlands(<600 m), decreasing consistently throughout the mid-range, and high-altitude ecosystems, whereas the richnessof invertebrate families has its highest value at middleelevations (lower montane forest). These contrasting pat-terns of diversity among vertebrate and invertebrategroups are remarkable and have important consequencesfor the ecology and management and of tropical basinswith large altitudinal gradients. Potential explanations aremanifold, but we suggest that an important factor
Figure 3. Family richness for freshwater invertebrates in theNapo Basin. This map was obtained from the summation of 54invertebrate family distribution models. Main state protectedareas in the Napo Basin are: Yasuní National Park (Y NP),Cuyabeno Faunistic Reserve (C FR), Cayambe Coca NationalPark (CC NP), Sumaco Napo-Galeras National Park (SN NP),Antisana Ecological Reserve (A ER), Colonso-ChalupasBiological Reserve (CC BR), and Llanganates National Park(L NP).
Neotropical Biodiversity 107

explaining these contrasting patterns might be related todifferent levels of spatial heterogeneity that vertebrateand invertebrate groups experience along the watershed.Given the short lifespan of aquatic invertebrates and theirrelatively limited dispersal capabilities, the steep environ-mental gradients that predominate in the Andean slopes,might have favored aquatic invertebrate speciation atmid-range altitudes.[70] Moreover, considering the smallsize of invertebrates, larger rivers and low topographicvariation in the lowlands could represent a relativelyhomogeneous environment, with limited opportunitiesfor speciation. Also, the low invertebrate diversity in thelowlands could be due to physical and chemical proper-ties of water, such as low pH, high water temperatures,low dissolved oxygen content (because of low turbu-lence and consumption generated by organic matterdecomposition), presence of suspended solids, high claycontent in sediments, and high disturbance as a conse-quence of water flood pulses.[70–72] At much higherelevations (>3600 m), the diversity of invertebrate familydecreases, probably because of low temperatures in gen-eral, high daily variation in temperature,[56,70] and thediminution in oxygen saturation that could affect thelong-term viability of the invertebrate species.[73]
Large vertebrates frequently experience the land-scape at a much larger spatial scale than aquatic inverte-brates and, given their longer life spans and relativelybetter dispersal capabilities they exploit a diversity of
environments created by the dynamic nature of lowlandrivers and their floodplains.[74] Moreover, higherdiversity of vertebrates in the lower altitudes might be adirect consequence of the higher productivity of thesesystems,[5,75,76] especially in the form of allochtho-nous organic matter from the terrestrial ecosys-tem.[77,78] Additionally, it has been suggested that,compared to the Andes, the lowlands have experiencedlonger periods of time of comparatively stable climates,favoring species diversification under competitive pres-sures.[79] Lowlands usually encompass large geographi-cal areas (large rivers and basins) and exhibit highenvironmental heterogeneity at larger spatial scales (i.e.Varzea and Igapó forests, rivers and lagoons) and alsotemporal scales (due to flood-pulse dynamics), favoringallopatric speciation of larger groups.[5,10,80] This factis especially important for fish species, which arerestricted to river channels, whereas other taxa havevarying abilities to colonize other river systems by landor air.[5,13] Thus, the high diversity of vertebrates isconcentrated in the large rivers at lowlands and floodedzones, whereas in montane forests, where rivers andbasins are too small and homogeneous (at a river scale)for most vertebrates, their diversity drastically decreases.There are, of course, exceptions to these patterns; forexample, small vertebrates such as glass frogs areadapted to small montane streams and have theirrichness peak at middle elevations.[81]
Table 2. Correlation tests for species richness between pairs of freshwater vertebrate taxa in the entire Napo Basin and by altitudinalzone.
Altitudinal level Amphibians Birds Mammals Reptiles Fish Average
Napo Basin 0.66 (SD 0.11)Amphibians – 0.61 ns 0.56** 0.68** 0.81** 0.67 (SD 0.11)Birds 0.61ns – 0.54 ns 0.49** 0.78* 0.61 (SD 0.13)Mammals 0.56** 0.54ns – 0.58** 0.75** 0.61 (SD 0.10)Reptiles 0.68** 0.49** 0.58** – 0.76** 0.63 (SD 0.12)Fish 0.81** 0.78* 0.75** 0.76** – 0.78 (SD 0.03)Lowlands (<600 m) 0.58 (SD 0.18)Amphibians – 0.25* 0.51* 0.67** 0.57** 0.50 (SD 0.18)Birds 0.25* – 0.51** 0.38** 0.63** 0.44 (SD 0.16)Mammals 0.51** 0.51* – 0.64** 0.85** 0.63 (SD 0.16)Reptiles 0.67** 0.38** 0.64** – 0.80** 0.62 (SD 0.18)Fish 0.57** 0.63** 0.85** 0.80** – 0.71 (SD 0.13)Lower montane forests (600–1600 m) 0.39 (SD 0.19)Amphibians – 0.29** 0.33** 0.62** 0.58** 0.45 (SD 0.17)Birds 0.29** – 0.05ns 0.29** 0.31** 0.23 (SD 0.12)Mammals 0.33** 0.05ns – 0.50** 0.32** 0.30 (SD 0.19)Reptiles 0.62** 0.29** 0.50** – 0.66** 0.52 (SD 0.17)Fish 0.58** 0.31** 0.32** 0.66** – 0.46 (SD 0.18)Upper montane forests (>1600 m) 0.14 (SD 0.36)Amphibians – 0.13ns −0.51** 0.52** 0.45** 0.15 (SD 0.47)Birds 0.13ns – −0.02* 0.28ns 0.25** 0.16 (SD 0.14)Mammals −0.51** −0.02* – −0.19** −0.16** −0.22 (SD 0.21)Reptiles 0.52** 0.28ns −0.19** – 0.65** 0.32 (SD 0.37)Fish 0.45** 0.25** −0.16** 0.65** – 0.30 (SD 0.35)
Notes: Results of significance tests are corrected for spatial autocorrelation. **p < 0.005 (Bonferroni correction); *p < 0.05; ns, not significant.
108 J. Lessmann et al.
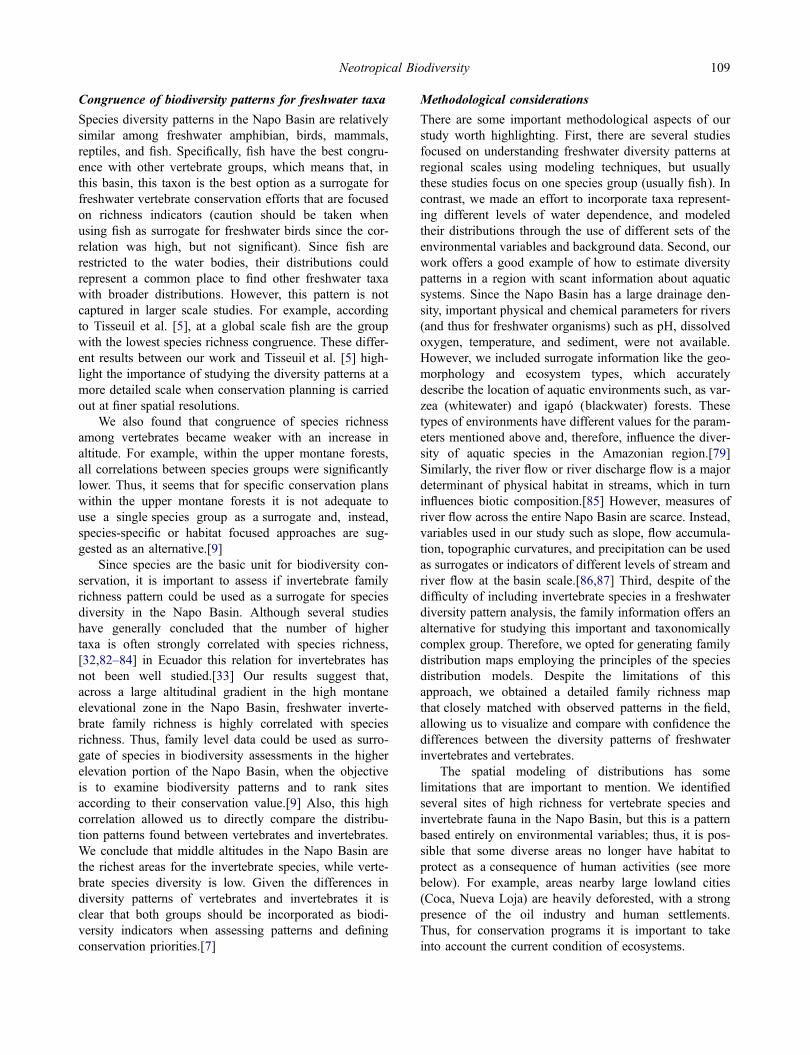
Congruence of biodiversity patterns for freshwater taxa
Species diversity patterns in the Napo Basin are relativelysimilar among freshwater amphibian, birds, mammals,reptiles, and fish. Specifically, fish have the best congru-ence with other vertebrate groups, which means that, inthis basin, this taxon is the best option as a surrogate forfreshwater vertebrate conservation efforts that are focusedon richness indicators (caution should be taken whenusing fish as surrogate for freshwater birds since the cor-relation was high, but not significant). Since fish arerestricted to the water bodies, their distributions couldrepresent a common place to find other freshwater taxawith broader distributions. However, this pattern is notcaptured in larger scale studies. For example, accordingto Tisseuil et al. [5], at a global scale fish are the groupwith the lowest species richness congruence. These differ-ent results between our work and Tisseuil et al. [5] high-light the importance of studying the diversity patterns at amore detailed scale when conservation planning is carriedout at finer spatial resolutions.
We also found that congruence of species richnessamong vertebrates became weaker with an increase inaltitude. For example, within the upper montane forests,all correlations between species groups were significantlylower. Thus, it seems that for specific conservation planswithin the upper montane forests it is not adequate touse a single species group as a surrogate and, instead,species-specific or habitat focused approaches are sug-gested as an alternative.[9]
Since species are the basic unit for biodiversity con-servation, it is important to assess if invertebrate familyrichness pattern could be used as a surrogate for speciesdiversity in the Napo Basin. Although several studieshave generally concluded that the number of highertaxa is often strongly correlated with species richness,[32,82–84] in Ecuador this relation for invertebrates hasnot been well studied.[33] Our results suggest that,across a large altitudinal gradient in the high montaneelevational zone in the Napo Basin, freshwater inverte-brate family richness is highly correlated with speciesrichness. Thus, family level data could be used as surro-gate of species in biodiversity assessments in the higherelevation portion of the Napo Basin, when the objectiveis to examine biodiversity patterns and to rank sitesaccording to their conservation value.[9] Also, this highcorrelation allowed us to directly compare the distribu-tion patterns found between vertebrates and invertebrates.We conclude that middle altitudes in the Napo Basin arethe richest areas for the invertebrate species, while verte-brate species diversity is low. Given the differences indiversity patterns of vertebrates and invertebrates it isclear that both groups should be incorporated as biodi-versity indicators when assessing patterns and definingconservation priorities.[7]
Methodological considerations
There are some important methodological aspects of ourstudy worth highlighting. First, there are several studiesfocused on understanding freshwater diversity patterns atregional scales using modeling techniques, but usuallythese studies focus on one species group (usually fish). Incontrast, we made an effort to incorporate taxa represent-ing different levels of water dependence, and modeledtheir distributions through the use of different sets of theenvironmental variables and background data. Second, ourwork offers a good example of how to estimate diversitypatterns in a region with scant information about aquaticsystems. Since the Napo Basin has a large drainage den-sity, important physical and chemical parameters for rivers(and thus for freshwater organisms) such as pH, dissolvedoxygen, temperature, and sediment, were not available.However, we included surrogate information like the geo-morphology and ecosystem types, which accuratelydescribe the location of aquatic environments such, as var-zea (whitewater) and igapó (blackwater) forests. Thesetypes of environments have different values for the param-eters mentioned above and, therefore, influence the diver-sity of aquatic species in the Amazonian region.[79]Similarly, the river flow or river discharge flow is a majordeterminant of physical habitat in streams, which in turninfluences biotic composition.[85] However, measures ofriver flow across the entire Napo Basin are scarce. Instead,variables used in our study such as slope, flow accumula-tion, topographic curvatures, and precipitation can be usedas surrogates or indicators of different levels of stream andriver flow at the basin scale.[86,87] Third, despite of thedifficulty of including invertebrate species in a freshwaterdiversity pattern analysis, the family information offers analternative for studying this important and taxonomicallycomplex group. Therefore, we opted for generating familydistribution maps employing the principles of the speciesdistribution models. Despite the limitations of thisapproach, we obtained a detailed family richness mapthat closely matched with observed patterns in the field,allowing us to visualize and compare with confidence thedifferences between the diversity patterns of freshwaterinvertebrates and vertebrates.
The spatial modeling of distributions has somelimitations that are important to mention. We identifiedseveral sites of high richness for vertebrate species andinvertebrate fauna in the Napo Basin, but this is a patternbased entirely on environmental variables; thus, it is pos-sible that some diverse areas no longer have habitat toprotect as a consequence of human activities (see morebelow). For example, areas nearby large lowland cities(Coca, Nueva Loja) are heavily deforested, with a strongpresence of the oil industry and human settlements.Thus, for conservation programs it is important to takeinto account the current condition of ecosystems.
Neotropical Biodiversity 109
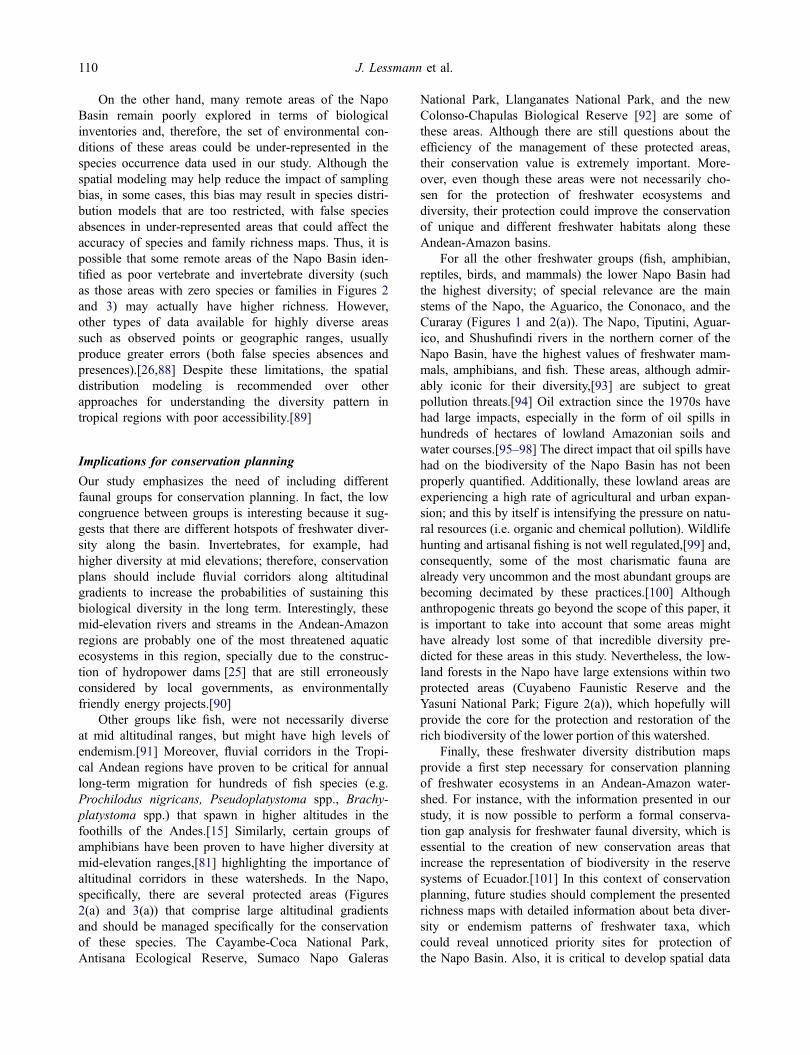
On the other hand, many remote areas of the NapoBasin remain poorly explored in terms of biologicalinventories and, therefore, the set of environmental con-ditions of these areas could be under-represented in thespecies occurrence data used in our study. Although thespatial modeling may help reduce the impact of samplingbias, in some cases, this bias may result in species distri-bution models that are too restricted, with false speciesabsences in under-represented areas that could affect theaccuracy of species and family richness maps. Thus, it ispossible that some remote areas of the Napo Basin iden-tified as poor vertebrate and invertebrate diversity (suchas those areas with zero species or families in Figures 2and 3) may actually have higher richness. However,other types of data available for highly diverse areassuch as observed points or geographic ranges, usuallyproduce greater errors (both false species absences andpresences).[26,88] Despite these limitations, the spatialdistribution modeling is recommended over otherapproaches for understanding the diversity pattern intropical regions with poor accessibility.[89]
Implications for conservation planning
Our study emphasizes the need of including differentfaunal groups for conservation planning. In fact, the lowcongruence between groups is interesting because it sug-gests that there are different hotspots of freshwater diver-sity along the basin. Invertebrates, for example, hadhigher diversity at mid elevations; therefore, conservationplans should include fluvial corridors along altitudinalgradients to increase the probabilities of sustaining thisbiological diversity in the long term. Interestingly, thesemid-elevation rivers and streams in the Andean-Amazonregions are probably one of the most threatened aquaticecosystems in this region, specially due to the construc-tion of hydropower dams [25] that are still erroneouslyconsidered by local governments, as environmentallyfriendly energy projects.[90]
Other groups like fish, were not necessarily diverseat mid altitudinal ranges, but might have high levels ofendemism.[91] Moreover, fluvial corridors in the Tropi-cal Andean regions have proven to be critical for annuallong-term migration for hundreds of fish species (e.g.Prochilodus nigricans, Pseudoplatystoma spp., Brachy-platystoma spp.) that spawn in higher altitudes in thefoothills of the Andes.[15] Similarly, certain groups ofamphibians have been proven to have higher diversity atmid-elevation ranges,[81] highlighting the importance ofaltitudinal corridors in these watersheds. In the Napo,specifically, there are several protected areas (Figures2(a) and 3(a)) that comprise large altitudinal gradientsand should be managed specifically for the conservationof these species. The Cayambe-Coca National Park,Antisana Ecological Reserve, Sumaco Napo Galeras
National Park, Llanganates National Park, and the newColonso-Chapulas Biological Reserve [92] are some ofthese areas. Although there are still questions about theefficiency of the management of these protected areas,their conservation value is extremely important. More-over, even though these areas were not necessarily cho-sen for the protection of freshwater ecosystems anddiversity, their protection could improve the conservationof unique and different freshwater habitats along theseAndean-Amazon basins.
For all the other freshwater groups (fish, amphibian,reptiles, birds, and mammals) the lower Napo Basin hadthe highest diversity; of special relevance are the mainstems of the Napo, the Aguarico, the Cononaco, and theCuraray (Figures 1 and 2(a)). The Napo, Tiputini, Aguar-ico, and Shushufindi rivers in the northern corner of theNapo Basin, have the highest values of freshwater mam-mals, amphibians, and fish. These areas, although admir-ably iconic for their diversity,[93] are subject to greatpollution threats.[94] Oil extraction since the 1970s havehad large impacts, especially in the form of oil spills inhundreds of hectares of lowland Amazonian soils andwater courses.[95–98] The direct impact that oil spills havehad on the biodiversity of the Napo Basin has not beenproperly quantified. Additionally, these lowland areas areexperiencing a high rate of agricultural and urban expan-sion; and this by itself is intensifying the pressure on natu-ral resources (i.e. organic and chemical pollution). Wildlifehunting and artisanal fishing is not well regulated,[99] and,consequently, some of the most charismatic fauna arealready very uncommon and the most abundant groups arebecoming decimated by these practices.[100] Althoughanthropogenic threats go beyond the scope of this paper, itis important to take into account that some areas mighthave already lost some of that incredible diversity pre-dicted for these areas in this study. Nevertheless, the low-land forests in the Napo have large extensions within twoprotected areas (Cuyabeno Faunistic Reserve and theYasuní National Park; Figure 2(a)), which hopefully willprovide the core for the protection and restoration of therich biodiversity of the lower portion of this watershed.
Finally, these freshwater diversity distribution mapsprovide a first step necessary for conservation planningof freshwater ecosystems in an Andean-Amazon water-shed. For instance, with the information presented in ourstudy, it is now possible to perform a formal conserva-tion gap analysis for freshwater faunal diversity, which isessential to the creation of new conservation areas thatincrease the representation of biodiversity in the reservesystems of Ecuador.[101] In this context of conservationplanning, future studies should complement the presentedrichness maps with detailed information about beta diver-sity or endemism patterns of freshwater taxa, whichcould reveal unnoticed priority sites for protection ofthe Napo Basin. Also, it is critical to develop spatial data
110 J. Lessmann et al.

about anthropogenic threats to model different scenariosfor conservation, mitigation, and even restoration ofthese diverse but also endangered regions.
Author’s contributions
Research design and grant writing: Andrea C. Encalada,Juan M. Guayasamin, LeRoy Poff, Alexander S. Flecker,W. Chris Funk, Cameron K. Ghalambor, Boris C.Kondratieff, Steven A. Thomas, and Kelly R. Zamudio.Field work and data gathering: José Schreckinger, KayceL. Caser, Eduardo Toral-Contreras, Iván Jácome-Negrete,Andrea C. Encalada, and Juan M. Guayasamin. Datacollection and analyses: Janeth Lessmann. Manuscriptwriting: Janeth Lessmann, Andrea C. Encalada, and JuanM. Guayasamin. All authors reviewed and made substan-tial contributions to the article.
Associate Editor: Miguel Pinto.
AcknowledgmentsWe thank all the following institutions for granting access totheir specimen databases (Appendix S1). Jaime Culebras andRommel Arboleda provided invaluable helped in the field.Maja Celinscak, Nathy Quiroz, Luis Granizo, and Edgar Guer-rón help sorting and identifying insects in the laboratory. Este-ban Suárez, Javier Fajardo, Elisa Bonaccorso, and WollyWomack provided helpful comments and information aboutspecies distributions.
Disclosure statementNo potential conflict of interest was reported by the author.
FundingThis work was supported by Partnerships for EnhancedEngagement in Research Science [grant number P1-108],Dimensions of Biodiversity grant from the National ScienceFoundation [grant number DEB-1046408], UniversidadTecnológica Indoamérica [grant number Q2012-10], andCollaboration grant USFQ (“Recursos de agua dulce y biodi-versidad en la Cuenca del Napo” to ACE). JL was also sup-ported by Instituto de Ecología y Biodiversidad, Chile [grantnumber ICM- MINECON, P05-002 IEB],
Supplemental dataSupplemental data for this article can be accessed at http://dx.doi.10.1080/23766808.2016.1222189.
ORCID
Janeth Lessmann http://orcid.org/0000-0002-1502-625XJuan M. Guayasamin http://orcid.org/0000-0003-0098-978XIván Jácome-Negrete http://orcid.org/0000-0002-8337-7959José Schreckinger http://orcid.org/0000-0002-2833-2512
References[1] Dudgeon D, Arthington AH, Gessner MO, et al. Fresh-
water biodiversity: importance, threats, status and conser-vation challenges. Biol. Rev. 2006;81:163–182.
[2] Balian EV, Segers H, Leveque C, et al. The freshwateranimal diversity assessment: an overview of the results.Hydrobiologia. 2008;595:627–637.
[3] Abell R, Thieme M, Dinerstein E, Olson D. A source-book for conducting biological assessments and develop-ing biodiversity visions for ecoregion conservation. Vol.II, Freshwater ecoregions. Washington, DC: WorldWildlife Fund; 2002.
[4] Vörösmarty CJ, McIntyre PB, Gessner MO, et al. Globalthreats to human water security and river biodiversity.Nature. 2010;467:555–561.
[5] Tisseuil C, Cornu J, Beauchard O, et al. Global diversitypatterns and cross-taxa convergence in freshwatersystems. J. Anim. Ecol. 2013;82:365–376.
[6] Jenkins C, Pimm SL, Joppa LN. Global patterns ofterrestrial vertebrate diversity and conservation. PNAS.2013;110:E2602–E2610.
[7] Ricketts TH, Dinerstein E, Olson D, et al. Who’s wherein North America? Patterns of species richness and theutility of indicator taxa for conservation. BioScience.1999;49:369–381.
[8] Sauberer N, Zulka KP, Abensperg-Traun M, et al. Surro-gate taxa for biodiversity in agricultural landscapes ofeastern Austria. Biol. Conserv. 2004;117:181–190.
[9] Heino J, Paavola R, Virtanen R, et al. Searching forbiodiversity indicators in running waters: do bryophytes,macroinvertebrates, and fish show congruent diversitypatterns? Biodivers. Conserv. 2005;14:415–428.
[10] Galacatos K, Stewart D, Ibarra M. Fish community pat-terns of lagoons and associated tributaries in the Ecuado-rian Amazon. Copeia. 1996;1996:875–894.
[11] Hoekstra JM, Molnar JL, Jennings M, Revenga C,Spalding MD, Boucher TM, Robertson JC, Heibel TJ,Ellison K. The atlas of global conservation: changes,challenges, and opportunities to make a difference.Berkeley: University of California Press; 2010. Availablefrom: http://maps.tnc.org/globalmaps.html.
[12] WWF/TNC. Freshwater ecoregions of the world. 2013[cited 2014 Apr 10]. Available from: http://www.feow.org/.
[13] Abell R, Thieme M, Revenga C, et al. Freshwater ecore-gions of the world a new map of biogeographic units forfreshwater biodiversity conservation. BioScience.2008;58:403–414.
[14] WWF. Napo moist forests. 2014 [cited 2014 Apr 29].Available from: http://wwf.panda.org/about_our_earth/ecoregions/napo_moist_forests.cfm.
[15] Anderson EP, Maldonado-Ocampo JA. A regional per-spective on the diversity and conservation of TropicalAndean fishes. Conserv. Biol. 2011;25:30–39.
[16] Olson D, Dinerstein E, Canevari P, Davidson R, CastroG, Morisset V, Abell R, Toledo E. Freshwater biodiver-sity of Latin America and the Caribbean. A conservationassessment. Washington, DC: Biodiversity Support Pro-gram; 1998.
[17] Stewart D, Barriga R, Ibarra M. Ictiofauna de la Cuencadel Río Napo. Ecuador Oriental: Lista Anotada de Espe-cies Politécnica. 1987;12:9–63.
[18] Galacatos K, Barriga-Salazar R, Stewart D. Seasonal andhabitat influences on fish communities within the lowerYasuni River Basin of the Ecuadorian Amazon. Environ.Biol. Fishes. 2004;71:33–51.
Neotropical Biodiversity 111

[19] Mena CF, Bilsborrow RE, McClain ME. Socioeconomicdrivers of deforestation in the Northern EcuadorianAmazon. Environ. Manage. 2006;37:802–815.
[20] Barriga R. Lista de Peces de Agua dulce e Intermarealesdel Ecuador. Politécnica. 2012;30:83–119.
[21] Fund W. Napo moist forests. 2014 [cited 2014 May 21].Available from: http://www.eoearth.org/view/article/154765.
[22] Encalada A. Funciones ecosistémicas y diversidad de losríos: Reflexiones sobre el concepto de caudal ecológico ysu aplicación en el Ecuador. Polemika. 2010;5:40–47.
[23] Potes V. Análisis de la aplicación del Derecho Ambientalen la Amazonía Ecuatoriana y el rol de las FiscalíasAmbientales. Quito: CEDA; 2010.
[24] Finer M, Jenkins CN, Pimm SL, et al. Oil and gasprojects in the Western Amazon: threats to wilderness,biodiversity, and indigenous peoples. PLoS ONE. 2008;3:e2932.
[25] Finer M, Jenkins CN. Proliferation of hydroelectric damsin the Andean Amazon and implications for Andes-Amazon connectivity. PLoS ONE. 2012;7:e35126.
[26] Carvalho SB, Brito JC, Pressey RL, et al. Simulating theeffects of using different types of species distribution datain reserve selection. Biol. Conserv. 2010;143:426–438.
[27] Gaston KJ, Rodrigues ASL. Reserve selection in regionswith poor biological data. Conserv. Biol. 2003;17:188–195.
[28] Elith J, Leathwick JR. Species distribution models: eco-logical explanation and prediction across space and time.Annu. Rev. Ecol. Evol. Syst. 2009;40:677–697.
[29] Mateo RG. Modelos predictivos de riqueza de diversidadvegetal. Comparación y optimización de métodos demodelado ecológico. Madrid: Universidad Complutensede Madrid; 2008.
[30] Elith J, Leathwick J. Conservation prioritisation usingspecies distribution modelling. In: Moilanen A, WilsonKA, Possingham HP, editors. Spatial conservation prioriti-zation quantitative methods and computational tools.New York (NY): Oxford University Press; 2009. p. 27–93.
[31] Jenkins C, Guénard B, Diamond SE, et al. Conservationimplications of divergent global patterns of ant and verte-brate diversity. Biodivers. Res. 2013;19:1084–1092.
[32] Heino J, Soininen J. Are higher taxa adequate surrogatesfor species-level assemblage patterns and species richnessin stream organisms? Biol. Conserv. 2007;137:78–89.
[33] Jacobsen D. Contrasting patterns in local and zonal fam-ily richness of stream invertebrates along an Andean alti-tudinal gradient. Freshwater Biol. 2004;49:1293–1305.
[34] Instituto Geográfico Militar del Ecuador. CartografíaTemática [cited 2015 Feb 2]. Available from: http://www.igm.gob.ec.
[35] Ministerio del Ambiente del Ecuador. Sistema de clasifi-cación de los ecosistemas del Ecuador continental. Quito:Subsecretaría de Patrimonio Natural; 2012.
[36] Barriga R. Peces del Parque Naciona Yasuní. Politécnica.1994;19:9–41.
[37] Fishnet2. 2014 [cited 2014 Jan 10]. Available from:http://www.fishnet2.net/.
[38] GBIF. 2014 [cited 2014 Jan 10]. Available from: www.gbif.net.
[39] Vertnet. 2014 [cited 2014 Jan 10]. Available from: http://vertnet.org/.
[40] Tirira D. Guía de Campo de los mamíferos del Ecuador.Quito: Ediciones Murciélago Blanco, Publicación espe-cial sobre los mamíferos del Ecuador 6; 2007.
[41] IUCN. IUCN red list of threatened species. Version2014.3. 2014. Available from: www.iucnredlist.org.
[42] Torres-Carvajal O, Salazar-Valenzuela D, Merino-ViteriA, Nicolalde DA. ReptiliaWebEcuador. Versión 2015.0.Quito: Museo de Zoología QCAZ, Pontificia UniversidadCatólica del Ecuador; 2015 [cited 2014 Feb 1]. Availablefrom: http://zoologia.puce.edu.ec/Vertebrados/reptiles/reptilesEcuador.
[43] Ridgely R, Greenfield PJ. Aves del Ecuador. Vol. II, Guíade Campo. Quito: Fundación Jocotoco; 2007.
[44] Frost DR. Amphibian species of the world: an online ref-erence. Version 5.5. New York: American Museum ofNatural History; 2011. Available from: http://research.amnh.org/vz/herpetology/amphibia/.
[45] Centro Jambatu. Anfibios del Ecuador. Quito: FundaciónOtonga; 2014 [cited 2014 Feb 1]. Available from: http://www.anfibioswebecuador.ec.
[46] Guayasamín JM, Castroviejo-Fisher S, Trueb L, et al.Phylogenetic systematics of Glassfrogs (Amphibia: Cen-trolenidae) and their sister taxon Allophryne ruthveni.Zootaxa. 2009;2100:1–97.
[47] Poff NL, Funk WC, Ghalambor CK, Kondratieff BC,Thomas S, Flecker AS, Bernardo J, Zamudio KR. Anintegrative traits-based approach to predicting variation invulnerability of tropical and temperate stream biodiversityto climate change (EVOTRAC). NSF CollaborativeResearch; 2010.
[48] Guayasamin JM, Encalada A. Long-term sustainability ofwater resources and biodiversity under scenarios of cli-mate change in the Napo watershed. NSF Partnershipsfor enhanced engagement in research (PEER) science;2011.
[49] Guisan A, Zimmermann NE. Predictive habitat distribu-tion models in ecology. Ecol. Modell. 2000;135:147–186.
[50] Phillips SJ, Anderson RP, Schapire RE. Maximumentropy modeling of species geographic distributions.Ecol. Modell. 2006;190:231–259.
[51] Graham CH, Elith J, Hijmans RJ, et al. The influence ofspatial errors in species occurrence data used in distribu-tion models. J. Appl. Ecol. 2008;45:239–247.
[52] Elith J, Graham CH, Anderson RP, et al. Novel methodsimprove prediction of species’ distributions from occur-rence data. Ecography. 2006;29:129–151.
[53] Baselga A, Recuero E, Parra-Olea G, et al. Phylogeneticpatterns in zopherine beetles are related to ecologicalniche width and dispersal limitation. Mol. Ecol.2011;20:5060–5073.
[54] Schaefer SA, Arroyave J. Rivers as islands: determinantsof the distribution of Andean astroblepid catfishes. J. FishBiol. 2010;77:2373–2390.
[55] Schmidt-Lebuhn AN, Knerr NJ, Miller JT, et al. Phyloge-netic diversity and endemism of Australian daisies(Asteraceae). J. Biogeogr. 2015;42:1114–1122.
[56] Jacobsen D, Schultz R, Encalada A. Structure and diver-sity of stream invertebrate assemblages: the influence oftemperature with altitude and latitude. Freshwater Biol.1997;38:247–261.
[57] Pearson RG, Raxworthy CJ, Nakamura M, et al. Predict-ing species distributions from small numbers of occur-rence records: a test case using cryptic geckos inMadagascar. J. Biogeogr. 2007;34:102–117.
[58] Wisz MS, Hijmans RJ, Li J, et al. Effects of sample sizeon the performance of species distribution models.Divers. Distrib. 2008;14:763–773.
112 J. Lessmann et al.

[59] Phillips SJ, Dudík M, Elith J, et al. Sample selection biasand presence-only distribution models: implications forbackground and pseudo-absence data. Ecol. Appl.2009;19:181–197.
[60] Bystriakova N, Peregrym M, Erkens RHJ, et al. Sam-pling bias in geographic and environmental space and itseffect on the predictive power of species distributionmodels. Syst. Biodivers. 2012;10:305–315.
[61] Kramer-Schadt S, Niedballa J, Pilgrim JD, et al. Theimportance of correcting for sampling bias in MaxEntspecies distribution models. Divers. Distrib. 2013;19:1366–1379.
[62] Phillips SJ, Dudík M. Modeling of species distributionswith Maxent: new extensions and a comprehensive evalu-ation. Ecography. 2008;31:161–175.
[63] Velásquez-Tibatá J, Salaman P, Graham CH. Effects ofclimate change on species distribution, community struc-ture, and conservation of birds in protected areas inColombia. Reg. Environ. Change. 2012;13:235–248.
[64] Elith J, Phillips S, Hastie T, et al. A statistical explanationof MaxEnt for ecologists. Divers. Distrib. 2011;17:43–57.
[65] Jiménez-Valverde A, Lobo JM. Threshold criteria forconversion of probability of species presence to either-orpresence-absence. Acta Oecol. 2007;31:361–369.
[66] Elith J, Leathwick J. Predicting species distributions frommuseum and herbarium records using multiresponse mod-els fitted with multivariate adaptive regression splines.Divers. Distribut. 2007;13:265–275.
[67] AmphibiaWeb. Information on amphibian biology andconservation. Berkeley, CA; 2012. Available from: http://amphibiaweb.org/.
[68] Soberón J, Peterson TA. Interpretation of models of fun-damental ecological niches and specie’s distributionalareas. Biodivers. Inf. 2005;2:1–10.
[69] Dutilleul P, Clifford P, Richardson S, et al. Modifying thet Test for assessing the correlation between two spatialprocesses. Biometrics. 1993;49:305–314.
[70] Lounaci A, Brosse S, Thomas A, et al. Abundance,diversity and community structure of macroinvertebratesin an Algerian stream: the Sébaou wadi. Ann. Limnol.2000;36:123–133.
[71] Carvajal V. Macroinvertebrados acuáticos. In: Albuja L,editor. Fauna de Guiyero, Parque Nacional Yasuní.Quito: Escuela Politécnica Nacional – EcoFondo;2011. p. 169–183.
[72] Ferreira V, Encalada AC, Graça M. Effects of litter diver-sity on decomposition and biological colonization of sub-merged litter in temperate and tropical streams.Freshwater Sci. 2012;31:945–962.
[73] Jacobsen D. Low oxygen pressure as a driving factor forthe altitudinal decline in taxon richness of streammacroinvertebrates. Oecologia. 2008;154:795–807.
[74] Utreras BV, Suárez RE, Zapato-Ríos G, et al. Dry andrainy season estimations of giant otter, Pteronurabrasiliensis, home range in the Yasun′ı National Park,Ecuador. LAJAM. 2005;4:1–4.
[75] Wright DH. Species-energy theory: an extension of spe-cies-area theory. Oikos. 1983;41:496–506.
[76] Heino J. Concordance of species richness patterns amongmultiple freshwater taxa: a regional perspective. Bio-divers. Conserv. 2002;11:137–147.
[77] McCLain ME, Richey JE. Regional-scale linkages ofterrestrial and lotic ecosystems in the Amazon basin: aconceptual model for organic matter. Large Rivers.1996;10:1–4.
[78] Mortillaro J-M, Rigal F, Rybarczyk H, et al. Particulateorganic matter distribution along the lower Amazon river:addressing aquatic ecology concepts using fatty acids.PLoS ONE. 2012;7:e46141.
[79] Albuja L. Fauna de Guiyero, Parque Nacional Yasuní.Quito: Escuela Politécnica Nacional – EcoFondo; 2011.
[80] Cooke GM, Chao NL, Beheregaray LB. Natural selectionin the water: freshwater invasion and adaptation by watercolour in the Amazonian pufferfish. J. Evol. Biol.2012;25:1305–1320.
[81] Hutter CR, Guayasamin JM, Wiens JJ. ExplainingAndean megadiversity: the evolutionary and ecologicalcauses of glassfrog elevational richness patterns. Ecol.Lett. 2013;16:1135–1144.
[82] Grelle CEV. Is higher-taxon analysis an useful surrogateof species richness in studies of Neotropical mammaldiversity? Biol Conserv. 2002;108:101–106.
[83] Balmford A, Lyon AJE, Lang RM. Testing the higher-taxon approach to conservation planning in a megadi-verse group: the macrofungi. Biol. Conserv. 2000;93:209–217.
[84] Williams PH, Gaston K. Measuring more of biodiversity:can higher-taxon richness predict wholesale species rich-ness? Biol. Conserv. 1994;211–217.
[85] Bunn SE, Arthington AH. Basic principles and ecologicalconsequences of altered flow regimes for aquatic biodi-versity. Environ. Manage. 2002;67:30:492–507.
[86] Joy MK, Death R. Predictive modelling and spatial map-ping of freshwater fish and decapod assemblages usingGIS and neural networks. Freshwater Biol. 2004;49:1036–1052.
[87] Jenness J. DEM surface tools. Flagstaff: Jenness Enter-prises; 2013.
[88] Rondinini C, Wilson KA, Boitani L, et al. Tradeoffs ofdifferent types of species occurrence data for use insystematic conservation planning. Ecol. Lett. 2006;9:1136–1145.
[89] Bombi P, Luiselli L, D’Amen M. When the method formapping species matters: defining priority areas for con-servation of African freshwater turtles. Divers. Distrib.2011;17:581–592.
[90] Ministerio de Electricidad y Energia Renovable. Ecuador,un ejemplo para el mundo en energía limpia y desarrolloQuito. 2014 [cited 2015 Nov 2]. Available from: http://www.energia.gob.ec/ecuador-un-ejemplo-para-el-mundo-en-energia-limpia-y-desarrollo/.
[91] Jaramillo-Villa U, Maldonado-Ocampo JA, Escobar F.Altitudinal variation in fish assemblage diversity instreams of the central Andes of Colombia. J. Fish Biol.2010;76:2401–2417.
[92] Ministerio del Ambiente. Áreas Protegidas del Ecuador.2015 [cited 2015 Nov 2]. Available from: http://www.ambiente.gob.ec/areas-protegidas-3/.
[93] Bass MS, Finer M, Jenkins CN, et al. Global conserva-tion significance of Ecuador’s Yasunı′ National Park.PLoS ONE. 2010;5:e8767.
[94] Arellano P, Tansey K, Balzter H, et al. Detecting theeffects of hydrocarbon pollution in the Amazon forestusing hyperspectral satellite images. Environ. Pollut.2015;205:225–239.
[95] Rosenfeld AB, Gordon DL, Guerin-McManus M. Rein-venting the well. Approaches to minimizing the environ-mental and social impact of oil development in theTropics. Washington, DC: Conservation International;1997.
Neotropical Biodiversity 113

[96] Fontaine G. Petróleo y desarrollo sostenible en Ecuador:Reglas de juego. Quito: FLACSO & GPA Petroecuador;2003.
[97] Kimerling J. Disregarding environmental law: petroleumdevelopment in protected natural areas and indigenoushomelands in the Ecuadorian Amazon. Hastings Int.Compar. Law Rev. 1991;14:849–903.
[98] Larrea C, Larrea AI, Bravo AL, Belmont P, Baroja C,Mendoza C, Ibáñez W, Luna I. Petróleo, sustentabilidady desarrollo en la Amazonía Centro-Sur. Quito: Fun-dación Pachamama, Unidad de Información SocioAmbiental de la Universidad Andina Simón Bolívar,Ecuador; 2010.
[99] Suárez E, Morales M, Cueva R, et al. Oil industry, wildmeat trade and roads: indirect effects of oil extractionactivities in a protected area in north-eastern Ecuador.Anim. Conserv. 2009;12:364–373.
[100] Zapata Ríos G, Suárez E, Utreras V, Cueva R. Uso yconservación de fauna silvestre en el Ecuador. In:Krainer A, Mora MF, editors. Retos y Amenazas enYasuní. Quito: FLACSO; 2011. p. 97–116.
[101] Dudley N, Parish J. Closing the gap. Creating ecologi-cally representative protected area systems: a guide toconducting the gap assessment of protected area systemfor the convention on biological diversity. Montreal: Sec-retariat of the Convention on Biological Diversity; 2006.(Technical Series; no. 24).
[102] Buisson L, Blanc L, Grenouillet G. Modelling streamfish species distribution in a river network: the relativeeffects of temperature versus physical factors. Ecol.Freshwater Fish. 2007;17:244–257.
[103] Filipe AF, Cowx IG, Collares-Pereira MJ. Spatial mod-elling of freshwater fish in semi-arid rivers systems: atool for conservation. River Res. Appl. 2002;18:123–136.
[104] Maloney KO, Weller DE, Michaelson DE, et al. Speciesdistribution models of freshwater stream fishes in Mary-land and their implications for management. Environ.Model. Assess. 2013;18:1–12.
[105] Sierra R. Propuesta preliminar de un sistema de clasifi-cación de vegetación para el Ecuador continental. Quito:Proyecto INEFAN/GEF-BIRF y Ecociencia; 1999.
114 J. Lessmann et al.