from big bang to black holesblack body temperature of 2.73 k and is interpreted as the...
TRANSCRIPT

FROM BIG BANG TO BLACK
HOLES
The Evolution of Structures in the Cosmos
Max Camenzind
Landessternwarte Konigstuhl HeidelbergNovember 4, 2003


The big bang appears to the casual observer as just another myth, albeitwithout some of the more obvious anthropocentric characteristics. The
difference, however, is that modern cosmology is based upon the scientificmethod. The scientific method has very specific rules.


Preface
In the history of science few developments have been more important than the advent of thenew heliocentric cosmology in the sixteenth and seventeenth centuries. Whereas most of theancient Greeks and European medievals had believed the earth was at the center of the universe- with the sun, moon, planets, and stars orbiting around us - in the sixteenth century a newidea began to emerge. According to this new way of thinking, it was not the earth but the sunthat was at the center of the cosmic system. This revolutionary idea was famously proposedby Nicholas Copernicus in his bookOn the Revolution of the Heavenly Spheres, published in1543.
The progress of modern cosmology has been guided by both observational and theoreticaladvances. The subject really took off in 1917 with a paper by Albert Einstein that attemptedthe ambitious task of describing the universe by means of a simplified mathematical model.Five years later Alexander Friedmann constructed models of the expanding universe that hadtheir origin in a big bang. These theoretical investigations were followed in 1929 by the pi-oneering work on nebular redshifts by Edwin Hubble and Milton Humason, who providedthe observational foundations of present–day cosmology. In 1948 the steady state theory ofHermann Bondi, Thomas Gold, and Fred Hoye added a spice of controversy that led to manyobservational tests, essential for the healthy growth of the subject as a branch of science. Thenin 1965 Arno Penzias and Robert Wilson discovered the microwave background, which notonly revived George Gamow’s concept of the hot big bang proposed nearly two decades be-fore, but also prompted even more daring speculations about the early history of the universe.
Present models of the universe hold two fundamental premises: the cosmological principleand the dominant role of gravitation. Derived by Hubble, the cosmological principle holdsthat if a large enough sample of galaxies is considered, the universe looks the same from allpositions and in all directions in space. The second point of agreement is that gravitationis the most important force in shaping the universe. According to Einstein’s general theoryof relativity, which is a geometric interpretation of gravitation, matter produces gravitationaleffects by actually distorting the space about it; the curvature of space is described by a formof non-Euclidean geometry. A number of cosmological theories satisfy both the cosmologicalprinciple and general relativity. The two main theories are the big-bang hypothesis and thesteady-state hypothesis, with many variations on each basic approach.
The material here is therefore of two kinds: relevant pieces of physics and astronomy thatare often not found in undergraduate courses, and applications of these methods to more recentresearch results. The former category is dominated by general relativity and quantum fields.Relativistic gravitation has always been important in the large-scale issues of cosmology, butthe application of modern particle physics to the very early universe is a more recent develop-ment. Many excellent texts exist on these subjects, but I want to focus on those aspects thatare particularly important in cosmology. At times, I have digressed into topics that are strictly“unnecessary”, but which were just too interesting to ignore. These are, after all, the crown

iv Preface
jewels of 20th Century physics, and I firmly believe that their main features should be a stan-dard part of a graduate education in physics and astronomy. Despite this selective approach,which aims to concentrate of the essential core of the subject, the course will cover a widerange of topics. My original plan was in fact focused more specifically on matters to do withparticle physics, the early universe, and structure formation. However, as I wrote, the subjectimposed its own logic: it became clear that additional topics simply had to be added in orderto tell a consistent story. This tendency for different parts of cosmology to reveal unexpectedconnections is one of the joys of the subject, and is also a mark of the maturity of the field.
According to big-bang theories, at the beginning of time, all of the matter and energy inthe universe was concentrated in a very dense state, from which itexploded, with the resultingexpansion continuing until the present. Thisbig bangis dated between 12 and 15 billion yearsago. In this initial state, the universe was very hot and contained a thermal soup of quarks,electrons, photons, and other elementary particles. The temperature rapidly decreased, fallingfrom 1013 degrees Kelvin after the first microsecond to about one billion degrees after threeminutes. As the universe cooled, the quarks condensed into protons and neutrons, the buildingblocks of atomic nuclei. Some of these were converted into helium nuclei by fusion; therelative abundance of hydrogen and helium is used as a test of the theory. After many millionsof years the expanding universe, at first a very hot gas, thinned and cooled enough to condenseinto individual stars and galaxies, and even Black Holes.
Several spectacular discoveries since 1960 have shed new light on the problem. Opticaland radio astronomy complemented each other in the discovery of the quasars and the radiogalaxies. It is believed that the energy reaching us now from some of these objects was emittednot long after the creation of the universe. Further evidence for the big-bang theory was thediscovery in 1965 that a cosmic background noise is received from every part of the sky. Thisbackground radiation has the same intensity and distribution of frequencies in all directionsand is not associated with any individual celestial object. This radiation filling space has ablack body temperature of 2.73 K and is interpreted as the electromagnetic remnant of theprimordial fireball, stretched to long wavelengths by the expansion of the universe. Morerecently, the analysis of radiation from distant celestial objects detected by artificial satelliteshas given additional evidence for the big-bang theory and the small scale structure imprintedby early fluctuations in the density distribution.
Max Camenzind
Heidelberg, 13 715 733 101 after the Big Bang

Contents
1 Introduction 11.1 Cosmological Myths . . . . . . . . . . . . . . . . . . . . . . . . . . . . . . 11.2 History of the Universe . . . . . . . . . . . . . . . . . . . . . . . . . . . . . 41.3 Problems and Mysteries . . . . . . . . . . . . . . . . . . . . . . . . . . . . . 61.4 The Edge of Time . . . . . . . . . . . . . . . . . . . . . . . . . . . . . . . . 7
I Relativistic World Models 9
2 Cornerstones of Cosmology 112.1 The Universe is Expanding . . . . . . . . . . . . . . . . . . . . . . . . . . . 112.2 Cosmic Background Radiation as a Relic of the Early Universe . . . . . . . . 162.3 Galaxies are not Uniformly Distributed . . . . . . . . . . . . . . . . . . . . 222.4 Gravity is Dominated by Dark Matter . . . . . . . . . . . . . . . . . . . . . 272.5 Exercises . . . . . . . . . . . . . . . . . . . . . . . . . . . . . . . . . . . . 33Bibliography . . . . . . . . . . . . . . . . . . . . . . . . . . . . . . . . . . . . . 34
3 The Relativistic Cosmos 373.1 Relativity and Cosmology . . . . . . . . . . . . . . . . . . . . . . . . . . . 373.2 Newtonian Gravity is Obsolete . . . . . . . . . . . . . . . . . . . . . . . . . 37
3.2.1 Gravity as a Lorentzian Connection . . . . . . . . . . . . . . . . . . 383.2.2 Gravity of Stellar Objects – Basic Tests for Einstein . . . . . . . . . . 44
3.3 Isotropic SpaceTimes . . . . . . . . . . . . . . . . . . . . . . . . . . . . . . 473.3.1 Slicing of SpaceTime . . . . . . . . . . . . . . . . . . . . . . . . . . 483.3.2 Isotropic Riemannian Spaces . . . . . . . . . . . . . . . . . . . . . . 503.3.3 Spaces of Constant Curvature . . . . . . . . . . . . . . . . . . . . . 50
3.4 Friedmann–Robertson–Walker (FRW) SpaceTimes . . . . . . . . . . . . . . 513.5 The Modern World Model . . . . . . . . . . . . . . . . . . . . . . . . . . . 533.6 The Origin of the Cosmological Redshift . . . . . . . . . . . . . . . . . . . . 553.7 The Luminosity Distance and the Hubble–Law . . . . . . . . . . . . . . . . 563.8 The apparent angular distance . . . . . . . . . . . . . . . . . . . . . . . . . 593.9 Number Counts in the Expanding Universe . . . . . . . . . . . . . . . . . . 593.10 On Homogeneous World Models . . . . . . . . . . . . . . . . . . . . . . . . 623.11 Exercises . . . . . . . . . . . . . . . . . . . . . . . . . . . . . . . . . . . . 62Bibliography . . . . . . . . . . . . . . . . . . . . . . . . . . . . . . . . . . . . . 63

vi Contents
II Relativistic Perturbation Theory 65
III Evolution of Non–Linear Structure 67
List of Figures 69
List of Tables 71
Index 73

1 Introduction
Our exploration of cosmology begins with a brief history of the human desire to understand thecosmos. Mythology, humanity’s first attempt to grapple with cosmological questions, consistsof narrative tales that describe the universe in understandable terms. The text briefly discussesthe Tanzanian myth The Word as an example of a creation myth. Cosmology, particularly asexpressed by a mythology, can influence a culture’s or an individual’s actions.1
1.1 Cosmological Myths
The big bang appears to the casual observer as just another myth, albeit without some of themore obvious anthropocentric characteristics. The difference, however, is that modern cos-mology is based upon the scientific method. The scientific method has very specific rules. Itis based on objective data, observations that are independent of who made those observations.Once sufficient data are collected, a hypothesis is framed to explain and unify them. In orderto be regarded as scientific, the hypothesis must meet at minimum five characteristics: it mustbe relevant, testable, consistent, simple, and have explanatory power. Of these, the qualityof testability particularly defines the scientific method. A hypothesis that does not containthe potential to be falsified is not scientific. Once a hypothesis has met success at explain-ing data and has proven itself useful in predicting new phenomena, it is generally called atheory. Some particularly well established theories, especially those pertaining to a limitedphenomenon or forming the foundation for a broader theory, are called laws. Hence we referto the law of gravity, even though scientific ”laws” are subject to modification as our under-standing improves. Newton’s law of gravity is extremely well verified for the regime in whichit is applicable (weak gravitational fields and speeds small compared to the speed of light);but Newton’s law must be superseded by Einstein’s general theory of relativity.
The first attempt to construct a systematic cosmology that was grounded in physical theorywas the model of Aristotle. Aristotle developed a theory of motion, and defined the conceptsof ”natural motion” and ”force.” In Aristotle’s view, the Earth was the center of the universeand the center of all natural motions. Motions on the Earth were linear and finite, while theheavenly bodies executed perfect circles forever. The stars and planets were composed of aperfect element called ”ether,” whereas Earthly objects were made up of varying combinationsof the four ancient elements of earth, air, fire and water; a body’s motion was a consequenceof its composition. Although our modern definitions of these concepts are quite differentfrom Aristotle’s, natural motion and force remain fundamental to our understanding of thestructure and evolution of the universe. Aristotle’s Earth-centered worldview was embodiedin the detailed model of Ptolemy, with its deferents, epicycles, and eccentrics, all designed
1We follow here John F. Hawley’s book onFoundations of Modern Cosmolgy, Oxford University Press

2 1 Introduction
to predict the complicated celestial motions of the planets while still requiring motion in theheavens to be built upon circles.
During the Renaissance, humanity’s cosmological model changed dramatically. The firstblow in the ”Scientific Revolution” was struck by Copernicus, whose Sun-centered model ofthe heavens gained rapid ascendency in Renaissance Europe. Tycho Brahe’s detailed nakedeye observations of the heavens provided the data that Kepler used to derive his laws of plan-etary motion. Kepler’s laws of planetary made it possible for the first time for humans tounderstand the paths of the ”wanderers” across the sky.
A consequence of Kepler’s second law is that planets orbit more slowly the more distantthey are from the Sun. The third law enables the period of a planet, comet, or asteroid to becomputed once observations establish the length of the semimajor axis of its orbit. These lawswere among the greatest quantitative achievements of the Renaissance.
Kepler and Galileo were contemporaries, though Kepler was more of a theorist and Galileowas primarily an observer. Galileo was the first to make serious scientific use of the telescope,an instrument which provided observations that challenged the Ptolemaic model of the heav-ens. (Kepler was unable to afford to purchase a telescope, a prohibitively expensive device atthe time, though he was able to borrow one for a summer from a visiting nobleman. Galileopromised for several years to make a telescope for Kepler, but never got around to fulfillinghis promise.) Galileo observed craters on the Moon, demonstrating that it was not a perfect,smooth sphere; he also gave the large lunar plains the name of ”maria” (seas) because hethought they might be filled with water. He also found that the Milky Way was not a solidband of light but was filled with myriad stars, too small to be resolved by the unaided eye.Another key observation by Galileo was that Venus went through a full cycle of phases, justlike the Moon; this was impossible in the Ptolemaic model but was required by the Coperni-can model, since Venus is between the Earth and the Sun in the latter. But one of Galileo’smost important discoveries was of the four largest satellites of Jupiter, now called the Galileanmoons. These bodies demonstrated that the Earth was not the only center of motion in theuniverse, thus refuting one of the important tenets of Ptolemaic-Aristotelian cosmology andphysics.
Galileo also studied mechanics. From direct observation and careful reasoning, he wasable to arrive at the conclusion that all bodies fall at the same rate, if air resistance is negligible.This principle, now called theequivalence principle, is one of the foundations of the generaltheory of relativity, though Galileo could not have appreciated this at the time. Galileo alsorealized that motion might not be easily detectable by observers partaking of that motion, i.e.that motion is relative, though he never succeeded in working out the laws of motion. But afew months after Galileo’s death, Isaac Newton was born on a farm in Lincolnshire, England,beginning a life that would complete the Copernican Revolution with the fundamental laws ofphysics and gravitation that govern the universe under most conditions.
The Aristotelian cosmological system was consistent with his physics. Although Aristo-tle’s cosmology is quite different from the modern point of view, in what ways is it consistentwith modern ideas? How did it differ? What were some of the motivations for Copernicus topropose such a grand change to the prevailing concepts of the universe?
Tycho Brahe’s observations of a supernova that appeared in 1572 helped to end the beliefin the Aristotelean unchanging perfection of the celestial realm. How would you feel if youobserved something that so challenged a basic tenet of your world view? In Tycho’s ownwords:
Amazed, and as if astonished and stupefied, I stood still, gazing for a certain length of

1.1 Cosmological Myths 3
time with my eyes fixed intently upon it and noticing that same star placed close to the starswhich antiquity attributed to Cassiopeia. When I had satisfied myself that no star of that kindhad ever shone forth before, I was led into such perplexity by the unbelievability of the thingthat I began to doubt the faith of my own eyes.
Kepler too was to observe a supernova, only 32 years later in 1604. The next supernovavisible to the naked eye did not occur until 1987 when a star exploded in the nearby irregulargalaxy known as the Large Magellanic Cloud.
Controversy over the nature ofspiral nebulaehad persisted since the late 18th century,with one camp insisting they were external universes, while their opponents were equallyconvinced that the spiral nebulae were localized clusters of stars within our Galaxy. An im-portant early discovery was Shapley’s determination of the size of the Milky Way Galaxy, andof our location within it. Shapley found the Milky Way to be much larger than previouslybelieved, and on this basis he erroneously concluded that the spiral nebulae must be relativelynearby clusters. Shapley and Curtis participated in a famous debate in 1920 over the nature ofthe spiral nebulae, but insufficient data prevented a resolution of the puzzle. Finally, Hubbledetermined that the Andromeda Nebula (now known as the Andromeda Galaxy) was much toofar to lie within the confines of the Milky Way; Hubble had discovered external galaxies. Inthe first quarter of the twentieth century, humanity’s view of the cosmos leaped from a fairlylimited realm of the Sun surrounded by an amorphous grouping of stars, to one in which theMilky Way is just a typical spiral galaxy in a vast universe filled with galaxies.
Not long after Hubble’s discovery of external galaxies came his discovery of a linear rela-tionship between their redshifts and their distances, a relationship known today as the HubbleLaw. Determining the value of the constant of proportionality, the Hubble constant, remains animportant research goal of modern astronomy. The Hubble ”constant” is not really constant,because it can change with time, though at any given instant of cosmic time in a homogeneous,isotropic universe, it is the same at all spatial locations. The inverse of the Hubble constant,called the Hubble time, gives an estimate of the age of the universe.
The development of the theory of general relativity provided the framework in which Hub-ble’s discovery could be understood. Einstein found that his equations would not admit astatic, stable model of the universe, even with the addition of the ”cosmological constant”.The timely discovery of the redshift-distance relationship provided evidence that the universewas not static, but was expanding. The Robertson-Walker metric is the most general metricfor an isotropic, homogeneous universe that is also dynamic; i.e. it changes with time. An im-portant parameter in this metric is the scale factor, the quantity which describes how lengths inthe universe change with cosmic time. The scale factor can be used to derive the cosmologicalredshift, the change in wavelength of light as it traverses the universe.
Measuring Hubble’s constant requires accurate distances to increasingly remote galaxies.One of the best distance measures is the Cepheid variable star. The HST has now been able todetect Cepheid variable stars in the galaxy M100 in the Virgo galaxy cluster. Several Cepheidshave been found such as this one. These new data give us a distance to M100 of 17 Mpc andis consistent with a rather large Hubble constant of about 70 km/sec/Mpc. This value has nowbeen confirmed by Supernovae type Ia measurments and a detailed analysis of the cosmicmicrowave anisotropies by the WMAP satellite. It is the first time in the history of the Hubbleconstant that a converging value has been acchieved by various methods.

4 1 Introduction
1.2 History of the Universe
The relativistic cosmos is expanding. The history of the universe can be divided into manyeras, depending on which constituent was most important. Today the matter density of the uni-verse dominates its gravity completely; thus we say that we live in thematter era. However,conditions were not always as they are today. The relationship between temperature and red-shift of the CMBR demonstrates that as we look backward in time towardt = 0, the photonsin the CMBR become increasingly hot. Density also changes with time, becoming ever higheras we look toward earlier times; but the variation with scale factor is different for matter den-sity and for radiation energy density, with matter varying as the cube of the scale factor, whileradiation energy density varies as the fourth power ofR. Hence there was a time in the pastwhen radiation was more important than ordinary matter in determining the evolution of theuniverse. This high-temperature epoch defines the early universe. Temperature is a measureof energy, and Einstein’s equationE = mc2 tells us that energy and matter are equivalent.At sufficiently high temperatures, particles with large mass can be created, along with theirantiparticles, from pure energy. The temperature also influenced how the fundamental forcesof nature behaved during the earliest intervals of the universe’s history.
The interval of domination by radiation is called theradiation era. As we approach t=0in this era, we encounter increasingly unfamiliar epochs, dominated by different physics anddifferent particles. The earliest was thePlanck epoch, during which all four fundamentalforces were unified and ”particles” as we known them could not have existed. Next followedthe GUT epoch, when gravity had decoupled but the other three forces remained unified.The small excess of matter that makes up the universe today must have been created duringthis epoch, by a process still not completely understood. As the temperature dropped, theuniverse traversed the quark epoch, the hadron epoch, the lepton epoch, and the epoch ofnucleosynthesis.
The first atomic nuclei formed during the nucleosynthesis epoch. Most of the helium in theuniverse was created from the primordial neutrons and protons by the time the nucleosynthesisepoch ended scarcely three minutes after the big bang. A few other trace isotopes, specificallydeuterium (heavy hydrogen) and lithium 7, were also created, and their density depends sen-sitively upon the density of the universe during this time. If the universe were too dense,then most of the deuterium would have fused into helium. Only in a low-density universecan the deuterium survive. The major factor controlling the ultimate densities of helium anddeuterium is the abundance of neutrons. The more neutrons that decay before combining withprotons, the smaller the abundances of heavier elements. The availability of neutrons dependson the expansion rate as well as the cosmic matter density. Comparing the observed densitiesof the primordial isotopes to those computed from models and translating the results intoΩB ,the density parameter, givesΩB = 0.015/h2 whereh is the Hubble parameter divided by100 km/sec/Mpc. The smallerH0, the largerΩ; if H0=50,ΩB is approximately 0.06, whereasH0 = 100 givesΩB of only 0.015. This range is still much less thanΩ = 1, but nucleosynthe-sis limits can indicate only the density of baryons, because only baryons participate in nuclearreactions. Hence we must conclude that the universe contains less than the critical density ofbaryons.
After nucleosynthesis, nothing much happened for roughly a million years as the universecontinued to cool. The ordinary matter consisted of a hot plasma of nuclei and electrons. Thefree electrons made the plasma opaque; a photon of radiation could not have traveled far beforebeing scattered. However, once the universe cooled to approximately 3000 K, the electrons no

1.2 History of the Universe 5
longer moved fast enough to escape the attraction of the nuclei, and atoms formed. Althoughthere had been no previous combination, this event is still known asrecombination. The lastmoment at which the universe was opaque forms the surface of last scattering; it representsthe effective edge of the universe that is even theoretically visible with an optical telescope,since no optical telescope could ever penetrate the dense, opaque plasma that existed prior torecombination. Once the radiation was able to stream freely through the universe, matter andradiation lost the tight coupling that had bound them since the beginning. Henceforth matterand radiation evolved almost entirely independently. The photons that filled the universe atthe surface of last scattering make up the CMBR today, but now their energy is mostly inthe microwave band. At some point before or near recombination, the matter density andthe energy density were equally important. This is the epoch in which structure formationbegan to occur. The seeds of structure formation may have been planted much earlier, duringthe GUT epoch, but the tight coupling between radiation and matter prevented the densityperturbations from doing much. Once matter and radiation went their separate ways, densitypertubations could evolve on their own. The most overdense areas collapsed gravitationally,forming galaxies and clusters of galaxies. Less dense areas probably led to voids, the largeunderdense areas we see on the sky today. The process by which structure formed in the earlyuniverse is still very poorly understood; better data from instruments such as the plannedsuccessors to COBE (WMAP and Planck) will help to elucidate the mystery of the galaxies.
The matter density is one of the fundamental parameters of the universe; in the standard(Λ = 0) models, the matter density determines the geometry of the cosmos. An accuratedetermination of this quantity is thus of great cosmological importance. Many methods havebeen developed to try to measure the matter density. Most rely upon detecting the orbits ofvisible matter and using Kepler’s laws to compute the mass; these dynamical methods areprobably the most widely employed. At all scales, we have found that the amount of matterrevealed through gravitational interactions is greater than can be explained by the mass of thevisible stars. The nature of this unseen dark matter is one of the most important outstandingcosmological problems.
At the scale of individual galaxy disks, much of the dark matter can be attributed to stellarashes such as white dwarfs, neutron stars, and black holes, as well as to extremely faint objectssuch as very low-mass stars and brown dwarfs. However, at larger scales, the total aggregationof known baryonic matter cannot account for the mass that orchestrates gravitational interac-tions. Galaxies, including the Milky Way, appear to be surrounded by huge spheroidal darkhalos. The composition of the dark halos is unknown, but observations have indicated thatat least some of the mass must take the form of compact objects called MACHOs. Since webelieve that only baryonic (i.e. ordinary) matter can form compact objects, this suggests thatgalaxies are surrounded by an invisible cloud of objects such as neutron stars or small blackholes. How and when these bodies formed is still a mystery.
At larger scales, measurements ofΩ rise until they typically level off within a range of0.1 to 0.3, with the middle of this range (about 0.25) currently seeming to be most likely.This is far greater than can be accommodated by the abundances of primordial elements suchas helium and deuterium. Thus we conclude that some 90% of the matter of the universeis not only invisible, but is nonbaryonic. If it is not baryons, what is it? It must consistof some type of WIMP (weakly interacting massive particle). What this particle might beremains unknown, though particle physicists can provide plenty of possibilities. One obviouscandidate is the neutrino. Evidence has grown over the last decade that the neutrino actuallyhas an extremely tiny mass. There is no theoretical reason that the neutrino must be massless;

6 1 Introduction
indeed, one hypothesis for the dearth of solar neutrinos observed over the past 30 years isthat neutrinos are massive, and the kind that can be observed is converted into a kind thatis invisible to most neutrino detectors on the journey from the Sun. Laboratory evidenceis beginning to support this hypothesis. If neutrinos have even a small mass per particle,they could add considerably to the cosmic matter density because they are approximately asabundant as photons. However, the experimental limits on the neutrino mass preclude it fromproviding enough matter density to close the universe. Plenty of more exotic WIMPS havebeen suggested, but as yet none has been detected. A great deal of experimental and theoreticalingenuity and effort is being devoted to identifying the elusivemissing matter.
The dark matter is also inextricably connected with the formation of galaxies and galaxyclusters, since it must dominate the gravity of the universe. It is well known that galaxies tendto occur in clusters, such as the Hercules cluster. Galaxy clusters are gravitationally bound;that is, the galaxies within a cluster orbit one another. The Milky Way is a member of a smallcluster of a few dozen members, dominated by itself and the Andromeda galaxy; this clusteris called the Local Group. The nearest large cluster to the Local Group is the Virgo cluster,about 16 Mpc distant.
1.3 Problems and Mysteries
Despite its successes, the standard big bang cosmology has some problems that are difficult toresolve. Among these are:
• The horizon problem
• The flatness problem
• The structure problem
• The relic problem
These can be summarized thusly: (1) The universe is observed to be highly homogeneous andisotropic, but how did it become so when all regions observable universe were not in mutualcausal contact at early times? (2) The universe is nearly flat today, but this implies that it musthave had anΩ very nearly equal to one at early times. Unless the universe is exactly flat, thisseems to require fine tuning. Why is the universe so flat? (3) What formed the perturbationsthat lead to the structure we see around us? Why is structure the same everywhere, even thoughdifferent parts of the universe were not causally connected early in the big bang model? (4)GUTs predict massive particles that are not observed. What happened to these ”relics” of theGUT epoch?
The inflationary model addresses all these issues by presuming that what we call the ob-servable universe is actually a very small portion of the initial universe that underwent a deSitter phase of exponential expansion around the time of the GUT epoch. This model positsthat what became our observable universe was small enough to be in causal contact at thebig bang; it then grew at an exponential rate during the inflationary epoch. The exponentialgrowth had the effect of flattening out any curvature, stretching the geometry of the universeso much that it became flat. Any massive GUT particles were diluted, spread out over thisnow fantastically huge domain to an extremely tiny density, so that they no longer are observ-able. Quantum fluctuations in the vacuum are preserved and ”blown up” to large scales by theexpansion, providing the seeds for structure formation.

1.4 The Edge of Time 7
The source of this exponential growth was a negative pressure produced by a nonzerovacuum energy. A nonzero vacuum energy could result from quantum processes in the earlyuniverse. In quantum field theory, a field is associated with each particle, and the field in turnis related to a potential, the latter being a function which describes the energy density of thefield. The right potential would result in a false vacuum, a situation in which the field was zerobut the corresponding potential was not zero. The false vacuum state could have provided avacuum energy that would behave exactly like a positive (repulsive) cosmological constant,resulting in a temporary de Sitter phase during which the patch of universe grew by a factorof perhaps10100 or even more. Eventually, however, this vacuum energy was converted intoreal particles and the field found its way to the true vacuum, bringing the inflation to a halt.The universe then continued to evolve from this point as in our standard model.
The inflationary model is an area of active research. It makes some predictions aboutthe structures in the universe which are consistent with the CMBR data, although not yetproven, and it predicts that the present universe should be flat. This may present a problemfor the model since most measurements giveΩ < 1. Furthermore,Ω = 1 models are tooyoung for the larger Hubble values that tend to be measured by recent techniques. Moreover,the particle that might have provided the vacuum energy density is still unidentified, eventheoretically; it is sometimes called theinflatonbecause its sole purpose seems to be to haveproduced inflation. Despite these outstanding questions, it seems difficult to understand howthe horizon problem could be explained unless something like inflation occurred. Researchcontinues along all these lines of investigation.
1.4 The Edge of Time
Completely unknown is the beginning of time, the point in the big bang known as the Planckepoch. During this time the universe was sufficiently dense and energetic that all the funda-mental forces, including gravity, were merged into one grand force. Quantum mechanics isgenerally associated only with the world of the very small, but during the Planck epoch theentire observable universe was tiny. Under such conditions, quantum mechanics and gravitymust merge into quantum gravity. Unfortunately, at this time physicists do not have a theoryof quantum gravity. So we can speculate on what such a theory might be like, and what itmight tell us.
The basis for quantum mechanics is the recognition that everything has a wavelike nature,even those things we normally consider particles. By the same token, those things that weusually consider waves (e.g., light) also have a particle nature. The evolution of quantumsystems is governed by the Schroedinger equation. However, the Schroedinger equation givesonly the evolution of the probabilities associated with a system. Interpreting what this meansis somewhat difficult, given our usual expectations regarding the nature of reality. Accordingto the Copenhagen interpretation of quantum mechanics, a system exists in a superposition ofstates so long as it remains unobserved. An ”observation,” which it must be understood refersto any interaction that requires a variable to take a value and need not imply a conscious agent,collapses the wavefunction. The collapse of the wave function means that the system abruptlyceases to obey Schroedinger’s equation; what was previously probabilities becomes a knownquantity. The story of “Schroedinger’s cat” illustrates. A cat is locked in a box containing avial of poison, which will be broken by a quantum process such as the decay of a radioactiveatom. This event has some probability, which may be calculated, of occurring during any

8 1 Introduction
particular time interval. While the cat is in the box, unobserved, we cannot know whether theevent has taken place or not and thus whether the cat is alive or dead. A strict application ofthe Copenhagen interpretation demands that the cat be neither alive nor dead, or perhaps bothalive and dead, in some superposition of states according to the probability that the atom hasdecayed; in this view, the cat becomes alive or dead only when the experimenter opens the boxto investigate. Schroedinger’s cat illustrates difficulties with ”standard” quantum mechanicsas applied to complex systems such as living beings. Schroedinger himself meant this thoughtexperiment to show that quantum mechanics, a young science at the time, did not apply tosuch systems. Yet when we seek to apply quantum mechanics to cosmology, we know that itmust apply to the universe as a whole, and thus there is no such thing as ”classical” behavior;everything is ultimately quantum.
When we ponder the Planck era, we are led to questions about the nature of space andtime themselves. What is it that provides the “arrow of time,” the perception that we moveinto the uncertain future and leave behind the unchangeable past. The laws of physics aretime symmetric, meaning that they work the same whether time runs forward or backward.(A substitution of -t for t everywhere gives the same equations). The one exception is thesecond law of thermodynamics which states that entropy must increase with time. This meansthat a complicated system will tend to evolve toward its most probable state, which is a stateof equilibrium (and maximum disorder). If the sense of the arrow of time comes from thesecond law this means that the big bang had to start in a state of low entropy (high order),and the arrow of time results from the universal evolution from this initial state to the finaldisordered state, be it big crunch or the heat death of the ever expanding universe. We are ledto ask whether the theory of quantum gravity explains why the initial big bang was in a lowentropy state. Is quantum gravity a theory that is not time symmetric? Does the second lawof thermodynamics, an empirical relationship first discovered by engineers in the nineteenthcentury, tell us something about the most profound secrets of the universe?
Although we have no established theory of quantum gravity, some promising starts havebeen made. One of the most studied is string theory, in which reality at the Planck scaleof distance and time is described by the quantum oscillations of strings and loops. Stringtheories require that many more spatial dimensions exist than our familiar three. At leastten spatial dimensions exist in these theories, but only three are of cosmic scale; the restare compactified into ”coils” the size of the Planck distance. Thus the very early universemay have undergone a ”proto-inflation” in which three spatial dimensions grew into thosethat make up the observable universe. String theories are not yet well understood and manydetails remain to be worked out, but so far they can at least unify gravitation and the otherfundamental forces in a natural way. They are not the only candidates, however; anothertheory envisions that the exotic level of the Planck scale consists of a foam of quantized spaceand time. Perhaps someday we shall have a better understanding of the mysteries of the Planckscales. Such a discovery would be at least as momentous as general relativity itself.

Part I
Relativistic World Models


2 Cornerstones of Cosmology
There are four key observational facts which require the Universe to be described in terms ofa relativistic model:
• the expansion of the Universe (also called Hubble–expansion);
• the distribution of galaxies in the Universe which results from the gravitational action ofsmall perturbations rooted in the very early epoch of the Universe;
• cosmic microwave radiation (CMBR) which is a relic from the recombination era and,
• the presence of dark matter whose gravity dominates the motion in galactic halos andgalaxy clusters. Though the nature of dark matter is still completely obscure, its existencecan no longer be avoided.
When Einstein developed his theory of gravity in the general theory of relativity, hethought he ran into the same problem that Newton did: his equations said that the universeshould be either expanding or collapsing, yet he assumed that the universe was static. Hisoriginal solution contained a constant term, called the cosmological constant, which cancelledthe effects of gravity on very large scales, and led to a static universe. After Hubble discov-ered that the universe was expanding, Einstein called the cosmological constant hisgreatestblunder.
At around the same time, larger telescopes were being built that were able to accuratelymeasure the spectra, or the intensity of light as a function of wavelength, of faint objects. Us-ing these new data, astronomers tried to understand the plethora of faint, nebulous objects theywere observing. Between 1912 and 1922, astronomer Vesto Slipher at the Lowell Observatoryin Arizona discovered that the spectra of light from many of these objects was systematicallyshifted to longer wavelengths, or redshifted. A short time later, other astronomers showed thatthese nebulous objects were distant galaxies.
2.1 The Universe is Expanding
Until 1929, the Universe of galaxies was thought to be static. Even Einstein originally searchedfor a static solution of his euqations. For that reason, he had to introduce the cosmologicalconstantΛ which is nowadays fundamental for the understanding of the dynamics of the Uni-verse.
In 1929 Edwin Hubble, working at the Carnegie Observatories in Pasadena, California,measured the redshifts of a number of distant galaxies. He also measured their relative dis-tances by measuring the apparent brightness of a class of variable stars called Cepheids in
12 2 Cornerstones of Cosmology
each galaxy. When he plotted redshift against relative distance, he found that the redshiftz ofdistant galaxies increased as a linear function of their distanced
cz = H0 d . (2.1)
The only explanation for this observation is that the Universe of galaxies is expanding.
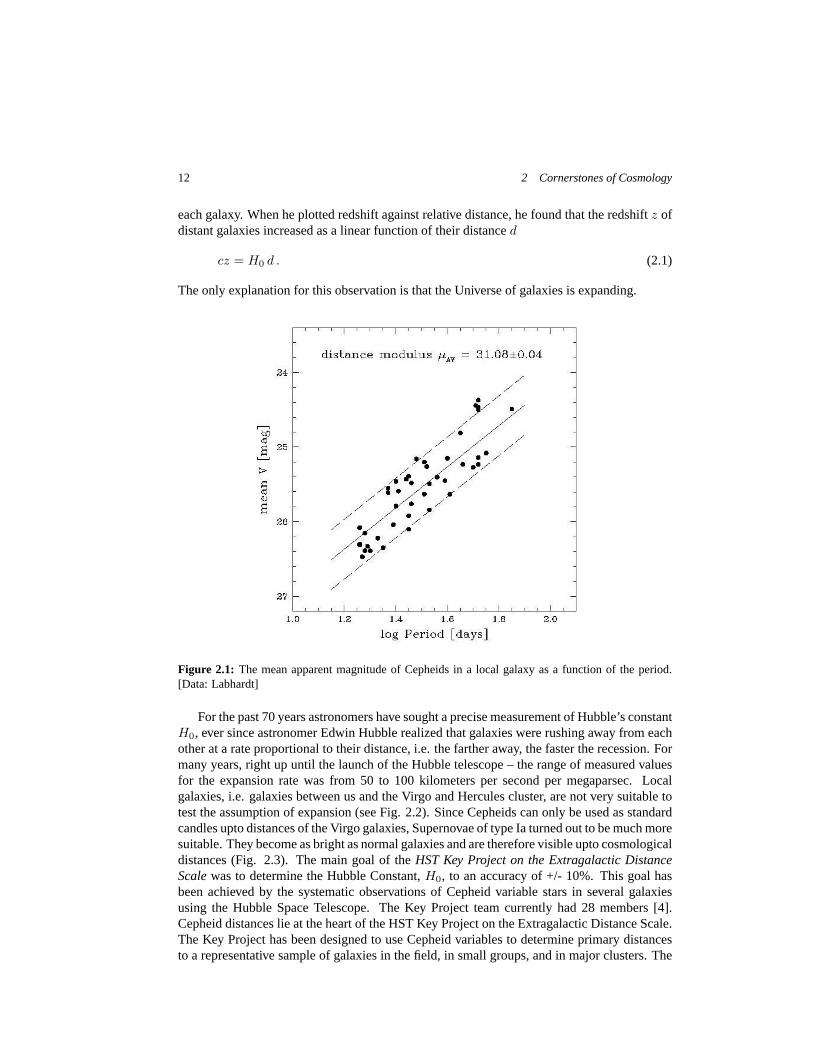
Figure 2.1: The mean apparent magnitude of Cepheids in a local galaxy as a function of the period.[Data: Labhardt]
For the past 70 years astronomers have sought a precise measurement of Hubble’s constantH0, ever since astronomer Edwin Hubble realized that galaxies were rushing away from eachother at a rate proportional to their distance, i.e. the farther away, the faster the recession. Formany years, right up until the launch of the Hubble telescope – the range of measured valuesfor the expansion rate was from 50 to 100 kilometers per second per megaparsec. Localgalaxies, i.e. galaxies between us and the Virgo and Hercules cluster, are not very suitable totest the assumption of expansion (see Fig. 2.2). Since Cepheids can only be used as standardcandles upto distances of the Virgo galaxies, Supernovae of type Ia turned out to be much moresuitable. They become as bright as normal galaxies and are therefore visible upto cosmologicaldistances (Fig. 2.3). The main goal of theHST Key Project on the Extragalactic DistanceScalewas to determine the Hubble Constant,H0, to an accuracy of +/- 10%. This goal hasbeen achieved by the systematic observations of Cepheid variable stars in several galaxiesusing the Hubble Space Telescope. The Key Project team currently had 28 members [4].Cepheid distances lie at the heart of the HST Key Project on the Extragalactic Distance Scale.The Key Project has been designed to use Cepheid variables to determine primary distancesto a representative sample of galaxies in the field, in small groups, and in major clusters. The

2.1 The Universe is Expanding 13
Figure 2.2: The recession velocities as a function of distances determined by Cepeheid distances forlocal galaxies. The observed redshift of the galaxies is corrected by means of the motion against thecosmic microwave background. [HST Key Project]
galaxies were chosen so that each of the secondary distance indicators with measured highinternal precisions can be accurately calibrated in zero point, and then intercompared on anabsolute basis. The Cepheid distances can then be used for secondary calibrations and appliedto independent galaxy samples at cosmologically significant distances. Cepheid distances tothe Virgo and Fornax clusters provide a consistency check of the secondary calibrations.
Type Ia Supernova are the explosions of white dwarfs. This is a pinnacle that only a fewstars like our sun are able to achieve. Unfortunately we are not sure exactly how these eventsoccur. We think they are related to white dwarf stars which are near another star in a binarysystem. Chandrasekhar, as part of his Nobel Prize in Physics demonstrated that white dwarfstars, if they become more massive than 1.4 times our sun can explode. They do this becauseat this point, the forces (electrons repelling electrons) which keep the star from collapsingagainst the force of gravity, lose their battle, and the white dwarf begins to collapse. As youmay recall, white dwarf stars are not made of Iron, (instead they are composed of Carbonand Oxygen) and there is still substantial amounts of nuclear energy left in their atoms. Asthe white dwarf begins to collapse against the weight of gravity, this material is ignited, andrather than collapsing further, this nuclear blast wave consumes the star in a second, creatingan explosion 10 to 100 times brighter than a Type II supernova.
The idea to measure the Universe with Supernovae is not new, it has long been contem-plated, but it is only in the past decade that it has become feasible. The first distant SN Iawas discovered in 1988 by a Danish team, but it wasn’t until 1994 that they were discoveredin large numbers. Since 1995 two teams have been discovering these objects: the High-Z SNSearch, and the Supernova Cosmology Project.
14 2 Cornerstones of Cosmology
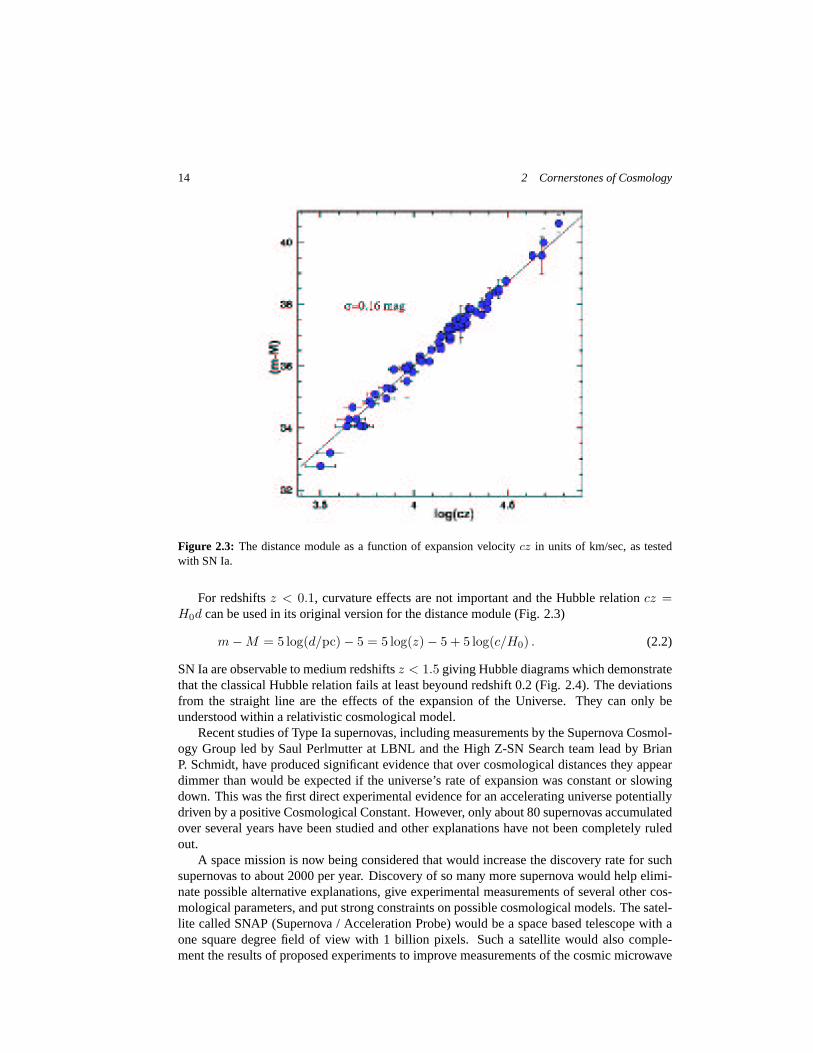
Figure 2.3: The distance module as a function of expansion velocitycz in units of km/sec, as testedwith SN Ia.
For redshiftsz < 0.1, curvature effects are not important and the Hubble relationcz =H0d can be used in its original version for the distance module (Fig. 2.3)
m−M = 5 log(d/pc)− 5 = 5 log(z)− 5 + 5 log(c/H0) . (2.2)
SN Ia are observable to medium redshiftsz < 1.5 giving Hubble diagrams which demonstratethat the classical Hubble relation fails at least beyound redshift 0.2 (Fig. 2.4). The deviationsfrom the straight line are the effects of the expansion of the Universe. They can only beunderstood within a relativistic cosmological model.
Recent studies of Type Ia supernovas, including measurements by the Supernova Cosmol-ogy Group led by Saul Perlmutter at LBNL and the High Z-SN Search team lead by BrianP. Schmidt, have produced significant evidence that over cosmological distances they appeardimmer than would be expected if the universe’s rate of expansion was constant or slowingdown. This was the first direct experimental evidence for an accelerating universe potentiallydriven by a positive Cosmological Constant. However, only about 80 supernovas accumulatedover several years have been studied and other explanations have not been completely ruledout.
A space mission is now being considered that would increase the discovery rate for suchsupernovas to about 2000 per year. Discovery of so many more supernova would help elimi-nate possible alternative explanations, give experimental measurements of several other cos-mological parameters, and put strong constraints on possible cosmological models. The satel-lite called SNAP (Supernova / Acceleration Probe) would be a space based telescope with aone square degree field of view with 1 billion pixels. Such a satellite would also comple-ment the results of proposed experiments to improve measurements of the cosmic microwave

2.1 The Universe is Expanding 15
Figure 2.4: The redshift of SN Ia as a function of the luminosity distance derived from the distancemodule for a set of recent data. At redshiftsz > 0.15, the Hubble relation fails. The lines correspondto luminosity distances of various cosmological models which will be discussed later on. [Data: Tonry2003]
background.In addition to the supernova discover program itself, LBNL’s Supernova Cosmology Group
has unique expertise in large charge-coupled (CCD) detectors. While smaller CCD’s are nowcommon, LBNL has developed techniques to construct the large mosaics required for SNAPby stitching together several hundred of the largest ones. The group has also devised a wayto manufacture the detectors at significantly reduced cost. Technically, the CCD’s have highresistivity with excellent quantum efficiency at 1 micron, which is the same as the emissionfrom distant Type Ia supernova and where conventional CCD’s have very low sensitivity.
The SNAP baseline science objective is to obtain a high statistics calibrated dataset of TypeIa supernovae to redshifts of 1.7 with excellent control over systematic errors. The statisticalsample is to be 2 orders of magnitude greater than the current published set of 42 supernovae,and is to extend much farther in distance and time. From this dataset we expect to obtaina 2% measurement of the mass density of the universe, a 5% measurement of the vacuumenergy density, a 5% measurement of the curvature, and a 5% measurement of the equationof state of the ”dark energy” driving the acceleration of the universe. Systematic studieswill include a measurement of the ”reddening” of spectra from ”ordinary dust” at redshiftsup to 1.7, and studying potential ”grey dust” sources. Using type Ia supernovae as standardcandles will require measurement of the key luminosity indicators: the light curve peak andwidth. The redshift of the host galaxy of the supernova needs to be measured, supernova typeidentfied, and spectral features studied. Effects correlated with host galaxy morphology andthe position of the supernova in the host galaxy will also be studied. These properties may

16 2 Cornerstones of Cosmology
indicate diferences in stellar population from which the supernova came and therefore canbe used to test whether the intrinsic brightness of the supernova changes systematically withredshift.
2.2 Cosmic Background Radiation as a Relic of the EarlyUniverse
In 1963, Arno Penzias and Robert Wilson, two scientists in Holmdale, New Jersey, were work-ing on a satellite designed to measure microwaves. When they tested the satellite’s antenna,they found mysterious microwaves coming equally from all directions. At first, they thoughtsomething was wrong with the antenna. But after checking and rechecking, they realized thatthey had discovered something real [10]. What they discovered was the radiation predictedyears earlier by Gamow [5], Alpher and Herman [1]. The radiation that Penzias and Wilsondiscovered, called the Cosmic Microwave Background Radiation (CMBR), convinced mostastronomers that the big bang theory was correct. For discovering the Cosmic MicrowaveBackground Radiation, Penzias and Wilson were awarded the 1978 Nobel Prize in Physics.
The significance of the discovery of the CMBR is that it was predicted by the basic phys-ical theory of the expanding universe, first laid down decades before, by Georges Lematre.While the cosmology wars of the 1940’s and 1950’s pitted several competing models againstone another, only the Big Bang had predcited the necessity of the CMBR as a consequence ofthe theory. So it’s only natural that its discovery gave support to that theory. The supportersof alternative cosmologies tried to bring such a background radiation out of their models afterthe fact, but always with unsatisfying, arbitrary tricks. Only the Big Bang actually requiresthat there be a CMBR. The existence of the CMBR was one of several strong reasons thatdeveloped during the 1960’s & 1970’s, which drove Big Bang cosmology into its premiereposition amongst scientists.
Subsequent observations confirmed, as well as it could be confirmed by limited, groundbased observations, that the CMBR discovered by Penzias & Wilson indeed had the requiredthermal spectrum, and was indeed isotropic. These two facts alone are strong indicators thatthe CMBR is the predicted relic of Lematre’s primeval atom, and argues against alternativecosmologies.
After Penzias and Wilson found the Cosmic Microwave Background Radiation, astro-physicists began to study whether they could use its properties to study what the universe waslike long ago. According to Big Bang theory, the radiation contained information on howmatter was distributed over ten billion years ago, when the universe was only 500,000 yearsold. At that time, stars and galaxies had not yet formed. The Universe consisted of a hot soupof electrons and atomic nuclei. These particles constantly collided with the photons that madeup the background radiation, which then had a temperature of about 3000 K.
Soon after, the Universe expanded enough, and thus the background radiation cooledenough, so that the electrons could combine with the nuclei to form atoms. Because atomswere electrically neutral, the photons of the background radiation no longer collided withthem.
When the first atoms formed, the universe had slight variations in density, which grew intothe density variations we see today - galaxies and clusters. These density variations shouldhave led to slight variations in the temperature of the background radiation, and these varia-tions should still be detectable today. Scientists realized that they had an exciting possibility:

2.2 Cosmic Background Radiation as a Relic of the Early Universe 17
Figure 2.5: The spectrum measured by COBE is a perfect Planckian distribution.
by measuring the temperature variations of the Cosmic Microwave Background Radiationover different regions of the sky, they would have a direct measurement of the density vari-ations in the early universe, over 10 billion years ago. In 1990, the a satellite called the
Figure 2.6: The motion of the Earth generates a dipole anisotropyδT/T ' 0.001 in the temperaturedistribution on the Sky as observed by COBE.
Cosmic Microwave Background Explorer (COBE) measured background radiation tempera-tures over the whole sky (Fig. 2.5). COBE found variations that amounted to only about 5parts in 100,000, but revealed the density fluctuations in the early universe (Fig. 2.6).

18 2 Cornerstones of Cosmology
Figure 2.7: Temperature fluctuations on the Sky as observed by WMAP. The typical angular separationof temperature spots is about one degree, the resolution of the instrument is 13 arcminutes, in contrast tothe 7 degree resolution for the COBE instrument. [Source: Tegmark]
Figure 2.8: Harmonic analysis on the sphere: Dipole anisotropy (l = 2) and anisotropy mitl = 16 demonstrate, how a complicated fluctuation spectrum can be decomposed into a super-position of all possiblel–values.
The initial density variations would be the seeds of structure that would grow over time tobecome the galaxies, clusters of galaxies, and superclusters of galaxies observed today by theSloan Digital Sky Survey. With the Sloan data, along with data from COBE, astronomers willbe able to reconstruct the evolution of structure in the universe over the last 10 to 15 billionyears. With this information, we will have a deep understanding of the history of the universe,which will be an almost unbelievable scientific and intellectual achievement.
The cosmic microwave radiation is emitted by a sphere (the socalledLast Scattering Sur-faceat redshiftz = 1070). We can therefore consider the temperature as a scalar function onthe sphere, which can be decomposed into spherical harmonics [8]
∆T (θ, φ) = T (θ, φ)− T0 =lmax∑
l=0
m=+l∑
m=−l
alm Ylm(θ, φ) (2.3)

2.2 Cosmic Background Radiation as a Relic of the Early Universe 19
Figure 2.9: The power spectrum of the CMBR temperature fluctuations as a function of mul-tipolesl, i.e. as a function of angular separation before WMAP. The angular scale is given atthe upper axis of the figure. COBE had an angular resolution of 7 degrees, ballon experimentssuch as Boomerang and Maxima could determine fluctuations uptol ' 800, though with con-siderable error bars due to the limited sky coverage. The solid line gives the impression offluctuations expected in a CDM model. Here, the greatest fluctuations are expected on scales ofabout one degree. On much smaller scales, fluctuations decay very rapidly.
Ylm are the spherical harmonics (as used e.g. in Quantum mechanics).lmax follows from theresolution on the sky, which is 7 degrees for COBE, 10 arcminutes for MAXIMA–1, and 13arcminutes for WMAP. The functionsYlm form a complete basis on the sphere, i.e.
∫
4π
Y ∗lm(θ, φ) YLM (θ, φ) dΩ = δlL δmM . (2.4)
From this orthogonality relation we obtain the representation of the coefficientsa by means

20 2 Cornerstones of Cosmology
of N observed values, i.e. the temperature inN discrete directions on the sphere. The samplefunction values∆Tp can then be used to estimate the parametersalm
alm =N−1∑p=0
∆T (θp, φp) Y ∗lm(θp, φp) . (2.5)
The zeroeth of the spherical harmonicsYlm divide up the sphere into invidual cells, withan extension near the equatorial plane of∆θ = π/l. This is the meaning of the multipole
Figure 2.10: The power spectrum measured by WMAP. This figure summarizes the experi-mental results as of March 2003. The existence of the resonance peak atl ' 200 has beenconfirmed, the secondary maximum is barely visible. [Data: Tegmark, WMAP]
of orderl. The power represented by a multipole of orderl is obtained by averaging over allm–values
Cl ≡ 12l + 1
m=+l∑
m=−l
alma∗lm . (2.6)
2.2 Cosmic Background Radiation as a Relic of the Early Universe 21
The parametersCl represent indeed a complete statistical representation of Gaussian temper-ature fluctuations. The value ofl = 200 just corresponds to an angular separation of aboutone degree on the sky. COBE could only resolve scales uptol = 20, balloon measurementshad a bigger resolution, but they could not resolve structure beyondl = 750 (Fig. 2.10).
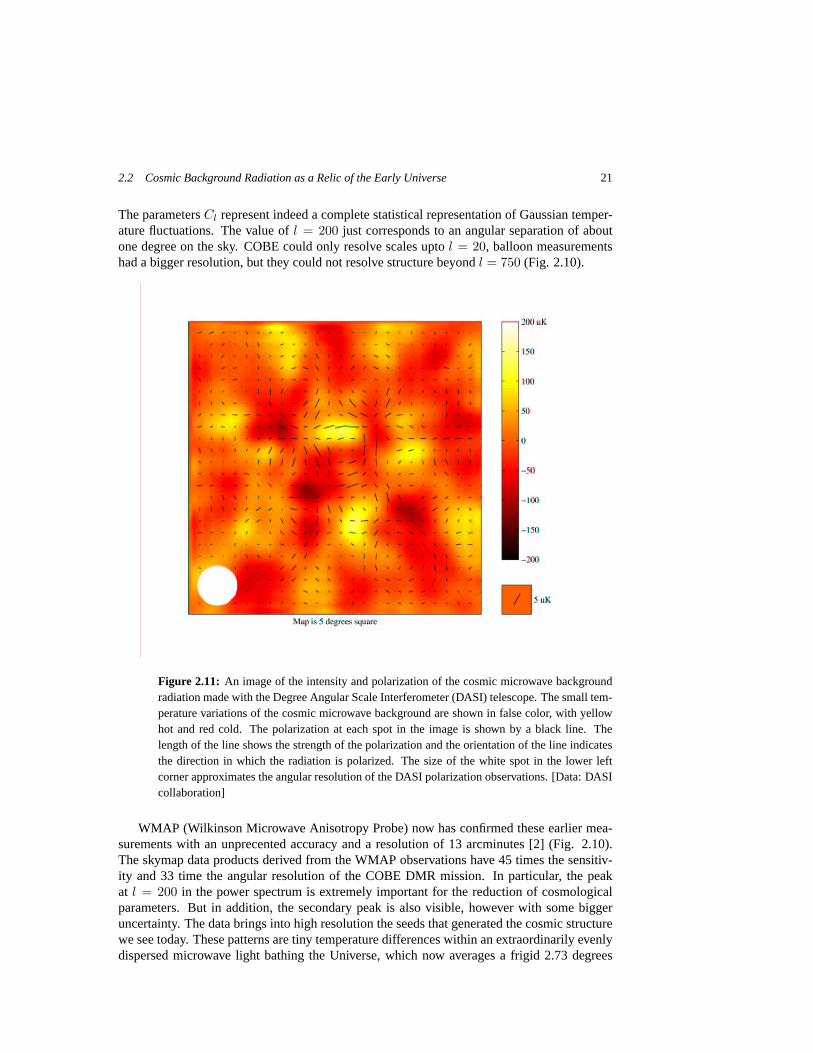
Figure 2.11: An image of the intensity and polarization of the cosmic microwave backgroundradiation made with the Degree Angular Scale Interferometer (DASI) telescope. The small tem-perature variations of the cosmic microwave background are shown in false color, with yellowhot and red cold. The polarization at each spot in the image is shown by a black line. Thelength of the line shows the strength of the polarization and the orientation of the line indicatesthe direction in which the radiation is polarized. The size of the white spot in the lower leftcorner approximates the angular resolution of the DASI polarization observations. [Data: DASIcollaboration]
WMAP (Wilkinson Microwave Anisotropy Probe) now has confirmed these earlier mea-surements with an unprecented accuracy and a resolution of 13 arcminutes [2] (Fig. 2.10).The skymap data products derived from the WMAP observations have 45 times the sensitiv-ity and 33 time the angular resolution of the COBE DMR mission. In particular, the peakat l = 200 in the power spectrum is extremely important for the reduction of cosmologicalparameters. But in addition, the secondary peak is also visible, however with some biggeruncertainty. The data brings into high resolution the seeds that generated the cosmic structurewe see today. These patterns are tiny temperature differences within an extraordinarily evenlydispersed microwave light bathing the Universe, which now averages a frigid 2.73 degrees

22 2 Cornerstones of Cosmology
above absolute zero temperature. WMAP resolves slight temperature fluctuations, which varyby only millionths of a degree [7].
Polarisation of the CMBR: The polarization of the cosmic microwave background (Fig.2.11) was produced by the scattering of cosmic light when it last interacted with matter, nearly14 billion years ago. If no polarization had been found, astrophysicists would have to rejectall their interpretations of the remarkable data they have compiled in recent years.
Triangulation of Spherical Surfaces: Die Messung der TemperaturT (~n) in einer bes-timmten Richtung~n am Himmel bedeutet die Vorgabe von diskreten Daten auf der Kugelflache(Abb. 2.12 oben). Damit stellt sich die Frage nach einer effizienten Triangulation der Kugeloberflache,so dass alle Pixel etwa dieselbe Flache aufweisen. Wurde man einfach die beiden Winkelφundθ diskretisieren, so entstehen Pixelflachen, die an den Polen kleiner werden. Numericallyefficient procedures should have the following properties:
• Equal area for all pixels.
• Pixels are distributed on lines of constant latitude. This property is essential for all har-monic analysis applications involving spherical harmonics. Due to the iso-latitude distri-bution of sampling points the speed of computation of integrals over individual sphericalharmonics scales as' √
N with the total number of pixels, as opposed to theN–scalingfor the non-iso-latitude sampling distributions (examples of which are the Quadrilateril-ized Spherical Cube used for the NASA’s COBE data, and any distribution based on thesymmetries of the icosahedron [12]).
• The sphere is hierarchically tessellated into curvilinear quadrilaterals. The lowest resolu-tion partition is comprised of 12 base pixels. Resolution of the tessellation increases bydivision of each pixel into four new ones. The Figure 2.12 illustrates (clock-wise fromupper-left to bottom-left) the resolution increase by three steps from the base level, i.e.the sphere is partitioned, respectively, into 12, 48, 192, and 768 pixels.
The HealPix algorithm (Hierarchical Equal Area isoLatitude Pixelisation) satisfies these re-quirements (Fig. 2.12) [6]. Each healpix sphere contains12 × N2 pixel. Typical values areN = 256, 512, 1024. This triangulation of the spherical surface has many application in as-trophysics, in particular it is very useful for the numerical solution of the radiative transferequation.
Future CMBR Missions: Planck (formerly COBRAS/SAMBA) was officially adopted asthe third Medium-Sized Mission of ESA’s Horizon 2000 scientific program in November 1996with a scheduled launch in late 2005, now postponed to 2007. Planck currently consists of 4frequency channels (30-100 GHz) that use HEMT amplifiers running at 20K and 6 channels(100-857 GHz) that use bolometer detectors in a 0.1 K dewar. The single 1.3m x 1.5m primaryreflector produces a 0.1 degree beam at 200 GHz and above. The sensitivity of PLANCK isalmost an order of magnitude higher than WMAP.
2.3 Galaxies are not Uniformly Distributed
Matter in the universe is not distributed randomly. Galaxies, quasars, and intergalactic gasoutline a pattern that has been compared to soap bubbles - large voids surrounded by thin

2.3 Galaxies are not Uniformly Distributed 23
Figure 2.12: Triangulation of spherical surfaces with the HealPix procedure. The surface of asphere is primarily divided up into 12 domains of equal area. These segments are then dividedup in ahierarchical procedure. top right the topography of the Earth is shown with 3,145,728pixels (corresponding to a resolution of 7 arc minutes) and left top the anisotropy of the CMBRis given for 12,582,912 pixels (resolution of 3.4 arc minutes).
walls of galaxies, with dense galactic clusters where walls intersect. One of the primary goalsof modern surveys (CfA, Las Campanas, 2dF, SDSS, 6dF) is to map this structure in greatdetail, out to large distances. There are many theories about how the universe evolved, andthe theories predict different large-scale structrues for the universe. The SDSS’s map may tellus which theories are right - or whether we will have to come up with entirely new ideas.Galaxies are usually found near each other, in galactic clusters. The distribution of these clus-

24 2 Cornerstones of Cosmology
Figure 2.13: The galaxy distribution in the CfA redshift survey. Each dot represents a galaxy. Redshiftruns along the radius of the circle, we are located in the center of the circle. The radius of the circleamounts to 15,000 km/s, the Coma cluster and the Great Wall are at about 8,000 km/s. The center is partof the Virgo cluster.
ters, and how this distribution evolves with time, are important tests of cosmological models:for instance, different cosmological models predict different numbers of galaxy clusters at dif-ferent redshifts. Additionally, not only are galaxies clustered, but the clusters themselves areclustered! The degree to which both galaxies and clusters tend to group together is also a testof different theories. By studying the masses, distributions, and evolution of galaxy clusters,we can learn something about the formation of mass in the universe: a fundamental goal ofcosmology.
Superclusters are simply clusters of galaxy clusters. Whereas clusters are typically foundin the filaments and walls of the universe’s ”soap bubble,” superclusters are at the intersectionsof the walls. Superclusters are the largest known structures in the universe, with some aslarge as 200,000,000 light-years! However, because these structures are very rare, only afew are known. The most famous superclusters are nearby, including the Great Wall and thePerseus-Pisces supercluster. There has been recent evidence for superclusters at redshifts of

2.3 Galaxies are not Uniformly Distributed 25
Figure 2.14: The galaxy distribution in the 2dF galaxy survey for a strip of 3 degrees wide in declination.Galaxies are detected out to redshifts of 0.2, roughly corresponding to a distance of one Gigaparsec.
Figure 2.15: The redshift distribution in the 2dF galaxy redshift survey. Beyond redshift 0.15, onlythe most luminous galaxies can be detected. The solid line is the theoretical expectation based on theSchechter form for the galaxy luminosity function.
about 1, which places important constraints on structure formation and cosmological models.Additionally, the M/L ratios of superclusters are similar to those of clusters. This discovery

26 2 Cornerstones of Cosmology
implies that the mysterious dark matter cannot contribute more to the mass of the universethan it contributes to the mass of clusters.
Figure 2.16: A comparison between CfA and SDSS galaxy surveys. A kind of great wall is now visiblein the SDSS map, however at much larger scales.
Future Surveys: The VIRMOS-VLT Deep Survey (VVDS) is a breakthrough spectroscopicsurvey which will provide a complete picture of galaxy and structure formation over a verybroad redshift range (0 < z < 5) over sixteen square degrees of the sky in four separatefields. This ambitious survey is possible thanks to the impressive multiplex gains of the VIR-MOS instruments (VIMOS and NIRMOS) built by the Franco-Italian VIRMOS consortiumfor ESO-VLT. The survey will be carried out over the consortium’s 120 nights of guaranteedtime, and will contain in total a sample of 150,000 redshifts. This unique database will enableus to trace back the evolution of galaxies, active galactic nuclei and clusters to epochs wherethe universe was a fraction (about 20 per cent) of its current age. The VVDS will be compa-rable in size to the largest redshift surveys currently underway, but will probe to much higherredshifts. It will provide an unparalleled description of how structures and galaxy populations

2.4 Gravity is Dominated by Dark Matter 27
evolved in the universe from high redshift to the present day.The distribution of galaxies at higher redshifts (z ≥ 1) is the topic of deep surveys (HST
deep fields, FORS deep fields, Subaru deep fields etc). The spatial distribution at these dis-tances is the topic of the next decade in Astronomy.
Facit: The observations (d2F and SDSS) demonstrate for the first time that the Universe ofgalaxies is homogeneous on scales beyond 50 Mpc, but definitely not within 50 Mpc.
2.4 Gravity is Dominated by Dark Matter
The nature and identity of the dark matter in the Universe is one of the most challengingproblems facing modern cosmology. The problem has been for the first time formulated byZwicky. Given the distribution of galaxies with total luminosityL, Φ(L) dL, one can computethe mean luminosity density of galaxies
L =∫
Φ(L) dL (2.7)
which is then determined by
L ' (2± 0.2) × 108 h0 L¯Mpc−3 . (2.8)
In the absence of a cosmological constant, one can define acritical mass density
ρc ≡ 3H20/8πG = 1.88× 10⁻²⁹ h2 g cm−3 . (2.9)
With this, we can define a critical mass–to–light ratio
(M/L)c = ρc/L ' 1390 h (M¯/L¯) . (2.10)
For the standard valueH0 = 70 we find then(M/L)c ' 1000 (M¯/L¯). With this we obtaina value for thedensity parameter
Ωm =ρ
ρc=
(M/L)(M/L)c
. (2.11)
It turns out that mass–to–light ratios are strongly dependent on distance scale over which theyare determined: In the solar neighborhoodM/L ' 1, yielding values ofΩm ' 0.001. Inthe central parts of galaxies one findsM/L ' (10 − 20)h so thatΩm ' 0.01 for galaxies.On larger scales (i.e. for binaries and small groups of galaxies),M/L ' (60 − 180)h withΩm ' 0.1. finally, on the scale of galaxy clusters,M/L still increases and may be as large as(200−500)h giving Ωm ' 0.3−0.4. Thus on the scales of clusters, dark matter is inevitable.
Dark Matter in Clusters: Because galaxy clusters can be very massive (up to1014 timesthe mass of the Sun), their gravity is strong enough to hold on to extremely hot gas, withtemperatures of millions of degrees. This gas emits radiation at X-ray wavelengths, whichcan be observed by X-ray satellites like ROSAT, Chandra, and XMM. These satellites haveshown that a large fraction of clusters have structure and complicated internal motions, whichindicate that they are still evolving. Also, satellite observations have shown that the X-ray

28 2 Cornerstones of Cosmology
emitting gas comprises the largest fraction of the visible mass in clusters, greater than thesum of all the galaxies. This is a very interesting result - remember that galaxy clusters werediscovered as overdensities of galaxies, and now we know that galaxies are but a small partof the total mass of clusters. Some astronomers have even suggested clusters without galaxiesmay also exist – just huge clumps of gas.
Figure 2.17: The X–ray gas in the cluster Abell 2104 at redshift 0.15. The blue dots are X–ray photonsdetected by Chandra, the red dots optical galaxies in the cluster. The extension of the X–ray emittinggas is about 200 kpc. A few of the galaxies in the cluster are also emitting X–rays (these are Quasars).[Source: Chandra Homepage]
The cluster Abell 2104 is one of the lowest redshift clusters (z = 0.153) known to have agravitational lensing arc. Detailed analysis of the cluster properties such as the gravitationalpotential using the X-ray data from ROSAT (HRI) and ASCA, as well as optical imagingand spectroscopic data from the CFHT has been given. The cluster is highly luminous in theX-ray with a bolometric luminosity ofLX ' 3 × 1045 ergs/s and a high gas temperature ofkeV. The X-ray emission extending out to at least a radius of 1.46 Mpc, displays significantsubstructure. The total mass deduced from the X-ray data under the assumption of hydrostaticequilibrium and isothermal gas, is found to beM(r < 1.46 Mpc) ' 8 × 10¹⁴ M¯. The gasfraction within a radius of 1.46 Mpc is 5–10%. The cluster galaxy velocity distribution has adispersion of(1200± 200) km/s with no obvious evidence for substructure.
Direct evidence for dark matter in clusters follows from the observation of the distributionof the hot baryonic gas. The hot gas in a cluster is held in the cluster primarily by the gravity

2.4 Gravity is Dominated by Dark Matter 29
of the dark matter, so the distribution of the hot gas is determined by that of the dark matter.By precisely measuring the distribution of X-rays from the hot gas, the astronomers were ableto make the best measurement yet of the distribution of dark matter in the inner region of agalaxy cluster. Under the assumption of hydrostatic equilibrium and spherical symmetry, thecluster total mass is directly related to the intracluster gas properties as
Mtot(r) = −rkBTg(r)µmpG
(d ln ne
d ln r+
d ln Tg
d ln r
). (2.12)
The gas density usually follows a standard law
Figure 2.18: Mass profiles derived from X–ray observations in the Hydra cluster on the scale from afew kpc to 200 kpc. [Source: Chandra]
ne(r) = n0
(1 + (r/r0)2
)−3β/2. (2.13)
Hence the gravitational potential for a constant gas temperature is given by
Φ(r)− Φ0 =3σ2
0
2ln[1 + (r/r0)2] (2.14)
whereσ20 = βkBTg/µmp and the total mass is given by
Mtot(r) =3σ2
0r0
G
(r/r0)3
1 + (r/r0)2. (2.15)

30 2 Cornerstones of Cosmology
If we consider galaxies as test particles in the cluster potential well, then Jean’s equationfor a collisionless, steady state, non-rotating spherically symmetric system gives
Mtot(r) = −rσ2r(r)G
(d ln ngal
d ln r+
d ln σ2r
d ln r+ 2βt
). (2.16)
σr is the 1D velocity dispersion of the galaxies in the cluster. By measuring the density profileand the profile of the velocity dispersion, a direct mass determination can be obtained.
Figure 2.19: HST image of Abell 2218 with luminous arcs. The dark matter in the cluster operates as agravitational lense. [Data: HST]
Gravity can bend light, allowing huge clusters of galaxies to act as telescopes. Almost allof the bright objects in the above Hubble Space Telescope image are galaxies in the clusterknown as Abell 2218 (Fig. 2.19). The cluster is so massive and so compact that its gravitybends and focuses the light from galaxies that lie behind it. As a result, multiple images ofthese background galaxies are distorted into long faint arcs – a simple lensing effect analogousto viewing distant street lamps through a glass of wine. The cluster of galaxies Abell 2218 isitself about three billion light-years away in the northern constellation Draco.
Dark Matter in Galaxies: Dark matter is also required to explain the flat rotation curvesof spiral galaxies. The halo of spiral galaxies must be populated by a dark component with adensity distribution ofρH ∝ 1/r2, providing a mass distribution from the Jean’s equation
M(r) ∝ V 2r/G . (2.17)
Matter distribution in the disk cannot explain the observed rotation curves.

2.4 Gravity is Dominated by Dark Matter 31
Dark Matter Candidates: The nature of the dark matter predicted by inflation is a profoundand unresolved puzzle. We have two choices. Either the dark matter consists of ordinary,baryonic matter, or else it consists of some more exotic form of matter. The history of theuniverse during the first few minutes provides an interesting measure of the total amount ofbaryonic matter in the universe that may help resolve the puzzle.
For a significant clue to the composition of the dark matter, we look to the abundance ofthe heavier isotope of hydrogen, weighing twice the mass, called deuterium, created duringthe big bang. There is no alternative source for the extra deuterium other than the big bang,since stars destroy deuterium rather than produce it. By now, a considerable fraction of anyprimordial deuterium present at the birth of the galaxy would have been destroyed inside stars.This is confirmed by observation: interstellar clouds contain deuterium, as do gravitationally-powered stars that have not yet developed nuclear burning cores; on the other hand, evolvedstars have no deuterium.
To estimate how much deuterium was created in the big bang, one has to factor in allthe deuterium that has since been destroyed. The percentage of the isotope destroyed sincethe big bang can be calculated if one knows the its rate of destruction, which can be foundby comparing the abundance of deuterated molecules in the atmosphere of Jupiter with theabundance of deuterium in interstellar clouds. One has to choose a value for the density ofbaryons that cannot exceed about a tenth of the critical density for closure of the universe,or too little primordial deuterium would have been synthesized. Conversely, the density ofbaryons cannot be too low, below 2 or 3 percent of the critical density, or else one wouldoverproduce deuterium, compared to what is observed in the solar system. If the universe isat critical density, 90 percent of the matter in the universe must be nonbaryonic.
If, in a universe at critical density, most dark matter could not be baryonic, what otherforms could it take? Likely relics of the early universe are species of stable, weakly interactingparticles. One example is the neutrino, if it possesses a small mass. Normally, the neutrinois assumed to be practically massless, but a finite mass is not implausible. There are so manyneutrinos left over from the big bang that a neutrino mass of even 50 eV, or one ten-thousandththe mass of an electron, would suffice to close the universe. Laboratory experiments areunderway in several countries to determine a definitive mass for the neutrino, but at presentthese experiments are inconclusive. The current upper limit on the electron neutrino mass,which is obtained from tritium decay experiments, is about 1 eV. Other species of neutrinoscould have higher masses.
If the particles are very massive, possessing more mass than, say, a proton, a special namehas been coined: the WIMP, for weakly interacting, massive particle. Exotic WIMPs suchas the photino and neutralino have been postulated to exist in sufficient quantity to close theuniverse. The problem is that there is no guarantee that these particles do exist. Disregardingthis uncertainty, the big bang theory predicts their density today, if they do exist and are stableover the age of the universe.
The existence of the photino is predicted in a theory called supersymmetry. This theorydoubles the number of known particles by postulating the existence of partner ‘-ino’ particles.These particles are almost all short-lived, and exist in large numbers only in the very earlyuniverse, when the temperature was high enough to exceed the energy scale characteristic ofsupersymmetry, affectionately abbreviated to SUSY. As the universe cools, supersymmetryis broken. The relevant energy scale is not known from theory, but it must exceed 100 GeVto avoid conflict with particle experiments. In our low-energy universe today, the lightestsupersymmetric particle should still survive. It is expected to be the partner, in the sense of
32 2 Cornerstones of Cosmology
having a complementary spin, of the photon, and is therefore known as a photino. Its mass isexpected to be 10 to 100 times that of the proton. The photino is uncharged and interacts veryweakly with matter.
There is strong evidence for SUSY from experiments at CERN that measure the strengthof the nuclear interactions, which increase with increasing energy. There is no guarantee,however, that the weak and strong nuclear force strengths will all converge to the same energy.That they do converge at very high energy is the thesis of grand unification of the fundamentalforces, whose breakdown in the very early universe gave rise to inflation. While this energy,some 10 to the 15 GeV, is very much higher than is directly accessible by experiment, the trendtowards convergence of the disparate forces is already apparent. Only if SUSY describes thehigh energy world do these three fundamental forces become indistinguishable at a uniqueenergy. Only therefore with SUSY could one construct a strong case for the inevitability ofgrand unification.
The most natural form for dark matter is matter that we know exists, namely baryons.The big bang explanation of the light element abundances requires the existence of baryonicdark matter. Although these same abundances imply that most dark matter is nonbaryonic,the amount of dark baryonic matter is still most likely several times that in luminous baryonicmatter, or about 3 percent of the critical density for closing the universe. But where do welook for the baryonic dark matter? One’s first expectation might be that baryonic dark matterconsists of burnt-out stars in the galactic halo, yet other forms, such as planets and black holes,are also possible. Baryonic dark matter does exist: it is far more uncertain whether there existsenough to solve any of the dark matter problems, that is to say, dark matter in galaxy halos,dark matter in galaxy clusters and superclusters, or dark matter in an amount suficient to closethe universe. It is most unlikely that baryonic dark matter can account for the closure density,as we will now see: for this, one must appeal to WIMPs, or some other weakly interactingparticle. However, baryonic dark matter is a serious candidate for dark matter at least in galaxyhalos, if not on larger scales. In acknowledgment of the rivalry between these two forms ofdark matter, the favored baryonic dark matter candidates have been dubbed MACHOs, formassive compact halo objects.
Among the possible astrophysical objects contained in the halo are the relics of stars, dimstars such as white dwarfs, neutron stars, or even black holes, as well as objects that havenever quite fulfilled themselves as stars because of their low mass. Because these objects areinvisible, or almost so, they are excellent candidates for dark matter. Moreover, MACHOs aremore natural candidates for the halo dark matter than WIMPs, because they are already knownto exist.
Two experiments reported in 1993 have found strong evidence for the existence of MA-CHOs. The technique used is gravitational microlensing. If a MACHO in our galaxy’s halopasses very close to the line of sight from earth to a distant star, the gravity of the otherwiseinvisible MACHO acts as a lens that bends the starlight. The star splits into multiple imagesthat are separated by a milliarc-second, far too small to observe from the ground. However,the background star temporarily brightens as the MACHO moves across the line of sight in thecourse of its orbit around the Milky Way halo. To overcome the low probability of observinga microlensing event, the experiments were designed to monitor several million stars in theLarge Magellanic Cloud. Each star was observed hundreds of times over the course of a year.A preliminary analysis of the data, taken with both red and blue filters, revealed several eventsthat displayed the characteristic microlensing signatures. The event durations were between30 and 50 days.

2.5 Exercises 33
The duration of the microlensing event directly measures the mass of the MACHO, al-though there is some uncertainty because of the unknown transverse velocity of the MACHOacross the line of sight. The event duration is simply the time for the MACHO to cross theeffective size of the gravitational lens, known as the Einstein ring radius. The radius of theEinstein ring is approximately equal to the geometric mean of the Schwarzschild radius of theMACHO and the distance to the MACHO. For a MACHO half-way to the Large MagellanicCloud, that distance is 55 kiloparsecs. The Einstein ring radius is about equal to 1 astronomi-cal unit, or the earth-sun distance. In order to be lensed, the MACHOs must be objects that aresmaller than the lens, so they must be smaller than an astronomical unit, roughly the radius ofa red giant star. The events detected are, to within a factor of a few, as the MACHO model ofdark halo matter predicts, and the event durations suggest a typical mass of around 0.1 solarmasses; however, there is at least a factor of 3 uncertainty in either direction.
The microlensing experiments have given robust and strong limits on the baryonic contentof the halo. Much more data from the LMC and SMC will be available soon, so we expectthe statistics to improve in the near future. The LMC events, if interpreted as due to halo mi-crolensing, allow a measurement of the baryonic contribution to the halo, which is around 20%for a standard halo. In this case, the most likely Macho contribution to the Milky Way halomass is about8 × 1010 M¯, which is roughly the same as the disk contribution to the MilkyWay mass. However, the whole story has been made more complicated (and exciting) by themuch larger than expected number of bulge microlensing events. These events imply a newcomponent of the Galaxy, and until the nature of this new component is known, unambiguousconclusions concerning the LMC events will not be possible. For example, if the Milky Waydisk is much larger than usually considered, a much smaller total halo mass will be required,and so even an all-Macho halo might be allowed. Alternatively, the new Galactic componentwhich is giving rise to the bulge events, may also be giving rise to the LMC events, and theMacho content of the halo could be zero. Fortunately, much more data is forthcoming, andmany new ideas have been proposed. Microlensing is fast becoming a new probe of Galacticstructure, and, beside the original potential to discover or limit dark matter, may well producediscoveries such as extra–solar planetary systems.
2.5 Exercises
Hubble constant: Besides Cepheids and Supernovae, many other methods are used to esti-mate the Hubble constant. Consult the paper [4] !
CMBR Spectrum: Calculate the photon number densitynCMBR contained in the Planckspectrum and compare this number with the mean baryon number densitynB in the presentUniverse.
Observed galaxy redshift distributions: The overall luminosity function for galaxies canbe well approximated by means of a Schechter function (see e.g. Virgo cluster and othernearby clusters)
Φ(L) dL = Φ∗ (L∗/L)α exp(−L/L∗) d(L/L∗) . (2.18)
L∗ is a characteristic luminosity,Φ∗ the corresponding normalisation of the space density, andα ' 1 the power–law index of the distribution. The number of galaxies observed in a redshift

34 2 Cornerstones of Cosmology
bin dz with energy fluxf in the range[f, f + df ] and in the solid angle4π∆Ω is then givenby, for z ¿ 1,
d2N
dz df= 4π∆Ω
∫ ∫ ∞
0
Φ(L/L∗) d(L/L∗) r2 dr δ(r− cz/H0) δ(L− 4πfr2) (2.19)
Show that the above integral is given by
d2N
dz df=
4π∆ΩL∗
(c
H0
)5
z4 Φ(κz2) , (2.20)
whereκ = 4πfc2/(H20L∗) is a dimensionless constant. In a flux–limited survey, we observe
all galaxies with fluxes above some minimum flux
dN
dz=
∫ ∞
fmin
d2N
dz dfdf = ∆Ω
(c
H0
)3
z4
∫ ∞
κmin
Φ(κz2) dκ , (2.21)
whereκmin = 4πfminc2/(H20L∗).
Explain by simple arguments, why the observed distribution scales as∝ z4, compare withFig. 2.15.Plot the expected distributiondN/dz for the Schechter function and compare with observeddistributions for given flux limits.
Galaxy Correlation function: What is the meaning of the correlation functionξ(r) for a3D galaxy distribution ?What is the correlation lengthr0 ? (see e.g. CfA or Las Campanas surveys)How can one find estimators for this correlation function ?
Spherical Harmonics: Look up the definition of spherical harmonics as used e.g. in quan-tum mechanics. Explain the completeness of this functional basis.
Galaxy cluster gas: Explain the emission process behind the X–rays observed from galaxyclusters. What processes heat the gas to X–ray temperatures ?Discuss the cooling times for this cluster gas (Virgo cluster e.g.) as a function of radius fromthe cluster center.
Jean’s equation: What is the Jean’s equation for the dynamics in galaxies ?How can one extract the mass distribution in a galaxy by using the Jean’s equation ?
Bibliography
[1] Alpher, R.A., Herman, R.C.: 1948, Nature162, 774-775[2] Bennett, C.L. et al.: 2003,First Year Wilkinson Microwave Anisotropy Probe
(WMAP) Observations: Preliminary Maps and Basic Results, ApJS148, 1.[3] Freedman, W.L. et al.: 1994, Nature371, 757

Bibliography 35
[4] Freedman, W.L. et al.: 2001,Final Results from the Hubble Space Telescope KeyProject to Measure the Hubble Constant, ApJ553, 47.
[5] Gamow, G.: 1948, Nature162, 680-682[6] Healpix Homepage: http//www.eso.org/healpix[7] Hinshaw, G. et al.: 2003,First Year Wilkinson Microwave Anisotropy Probe
(WMAP) Observations: The Angular Power Spectrum, ApJS148, 135[8] Hu, W., Dodelson, s.: 2002,Cosmic Microwave Background Anisotropies, Ann.
Rev. Astron. Astrophys.40, 171.[9] Hubble, E.: 1929,A relation between distance and radial velocity among extra-
galactic nebulae, Proc. Nat. Acad. Sci. (USA)15, 168[10] Penzias, A.A., Wilson, R.W.: 1965, Astrophysical Journal142, 419-421 (July)[11] Tonry, J.L. et al.: 2003,Cosmological Results from High-z Supernovae, ApJ594, 1[12] Tegmark, M.: 1996, ApJ 470, 81[13] Vogeley, M.S., Park, C., Geller, M.J., Huchra, J.P.: 1992,Large–scale clustering of
galaxies in the CfA Redshift Survey, Astrophsy. J. Letters391, L5


Part II
Relativistic Perturbation Theory


Part III
Evolution of Non–Linear Structure

List of Figures
2.1 Cepheid luminosity . . . . . . . . . . . . . . . . . . . . . . . . . . . . . . . 122.2 Hubble expansion . . . . . . . . . . . . . . . . . . . . . . . . . . . . . . . . 132.3 Hubble expansion . . . . . . . . . . . . . . . . . . . . . . . . . . . . . . . . 142.4 SNIa Hubble diagram . . . . . . . . . . . . . . . . . . . . . . . . . . . . . . 152.5 CMB Planck distribution . . . . . . . . . . . . . . . . . . . . . . . . . . . . 172.6 COBE dipole anisotropy . . . . . . . . . . . . . . . . . . . . . . . . . . . . 172.7 WMAP temperature ripples . . . . . . . . . . . . . . . . . . . . . . . . . . . 182.8 Spherical harmonics . . . . . . . . . . . . . . . . . . . . . . . . . . . . . . . 182.9 Power spectrum of temperature fluctuations before WMAP . . . . . . . . . . 192.10 WMAP power spectrum . . . . . . . . . . . . . . . . . . . . . . . . . . . . 202.11 DASI polarisation maps . . . . . . . . . . . . . . . . . . . . . . . . . . . . . 212.12 Triangulation of spheres . . . . . . . . . . . . . . . . . . . . . . . . . . . . 232.13 Galaxy distribution in CfA survey . . . . . . . . . . . . . . . . . . . . . . . 242.14 Galaxy distribution in 2dF galaxy survey . . . . . . . . . . . . . . . . . . . . 252.15 Redshift distribution in the 2dF survey . . . . . . . . . . . . . . . . . . . . . 252.16 SDSS vs CfA . . . . . . . . . . . . . . . . . . . . . . . . . . . . . . . . . . 262.17 Abell 2104 at redshift 0.15 . . . . . . . . . . . . . . . . . . . . . . . . . . . 282.18 Hydra cluster . . . . . . . . . . . . . . . . . . . . . . . . . . . . . . . . . . 292.19 Abell 2218 . . . . . . . . . . . . . . . . . . . . . . . . . . . . . . . . . . . 30
3.1 Einstein’s Theorie der Relativit”at von 1916 . . . . . . . . . . . . . . . . . . 393.2 Light cones . . . . . . . . . . . . . . . . . . . . . . . . . . . . . . . . . . . 403.3 Lichtkegel in der N”ahe eines Schwarzen Lochs . . . . . . . . . . . . . . . . 453.4 Periheldrehung im Zweik”orperproblem . . . . . . . . . . . . . . . . . . . . 463.5 Gravitational lense . . . . . . . . . . . . . . . . . . . . . . . . . . . . . . . 473.6 Photon trajectories around a Black Hole . . . . . . . . . . . . . . . . . . . . 483.7 Slicing of SpaceTime . . . . . . . . . . . . . . . . . . . . . . . . . . . . . . 493.8 Kr”ummung der Weltmodelle . . . . . . . . . . . . . . . . . . . . . . . . . . 543.9 Weltlinien . . . . . . . . . . . . . . . . . . . . . . . . . . . . . . . . . . . . 563.10 Light bundle . . . . . . . . . . . . . . . . . . . . . . . . . . . . . . . . . . . 60


List of Tables


Index
Allgemein–Relativistische Effekte, 46
Beobachter, 45
connection, 40, 41connection, one–forms, 41
de Sitter, 53
gravity, 39
Hyperboloide, 54
Lorentzian connection, 41
Rotverschiebung der Galaxien, 55
scheinbare Durchmesser, 59Schwarzschild–Radius, 45