from concept to launch - instar engineering and …€¦ · · 2017-02-20mmpds sec. 9 defines a...
TRANSCRIPT

Space Mission Structures: From Concept to Launch
July 2013 Copyright Instar Engineering and Consulting, Inc.• instarengineering.com Materials may be reproduced in complete form only, with header and footer
Course developed and taught by Tom Sarafin and Poti Doukas
Course Sampler
Space Mission Structures From Concept to Launch
Objectives:
Audience: All mechanically inclined engineers and managers involved
in specifying, designing, building, and testing spacecraft or
launch vehicles and their components
Strengthen your understanding of …
– how structures fail
– how to design structures to be dependable for space missions
– how to reduce total cost and avoid problems through effective engineering
Make you think!
Overall objective:
Help you become
a better engineer!

July 2013 Copyright Instar Engineering and Consulting, Inc.• instarengineering.com Materials may be reproduced in complete form only, with header and footer
Course Sampler
Space Mission Structures: From Concept to Launch
SMS History
First version developed by Tom Sarafin of Instar in 1995.
– Based on the book Spacecraft Structures and Mechanisms: From Concept to Launch (SSAM)
Book development jointly funded by Martin Marietta and many U.S. government organizations
4-year project, 24 authors, published in 1995 by Microcosm, Inc.
Tom Sarafin was the editor and principal author
– Original title of the course was the same as that of the book; taught 24 times under this title
Course revised in 1999; mechanisms dropped and new title, “Space Mission Structures: From Concept to Launch”.
– Taught 54 times under this title as of July 2013
The course is constantly being revised for improvement
– Based on in-class observations and new acquired knowledge
– Poti Doukas joined Instar in 2006 and has contributed to the improvement
The full version is offered as a 5-day (40-hour) course
– 32-hour version also available with selected topics omitted
Each participant receives a copy of the SSAM book

July 2013 Copyright Instar Engineering and Consulting, Inc.• instarengineering.com Materials may be reproduced in complete form only, with header and footer
Course Sampler
Space Mission Structures: From Concept to Launch
Agenda
Introduction
1. Overview of Space Mission Structures
2. Review of Statics and Dynamics
3. Launch Environments and How Structures Respond
4. Mechanics of Materials
5. Strength Analysis
6. Structural Life Analysis: Fatigue and Fracture Mechanics
7. Overview of Finite Element Analysis
8. Preliminary Design
8a. Avoiding Problems with Loads and Vibration*
8b. Improving the Loads-cycle Process*
9. Designing for Producibility
10. Verification and Quality Assurance
11. A Case Study: FalconSAT-2
12. Final Verification and Risk Assessment
Summary/Wrap-up
*Sections 8a and 8b are included only in the 5-day, 40-hour version of this course.

July 2013 Copyright Instar Engineering and Consulting, Inc.• instarengineering.com Materials may be reproduced in complete form only, with header and footer
Course Sampler
Space Mission Structures: From Concept to Launch
Everything Solid Is a Structure
Primary Structures
Tertiary Structures: • Brackets • Electronics Boxes
• Body Structure • Launch Vehicle Adapter
Secondary Structures
• Appendages • Solar Panels • Antenna Dishes • Support Trusses • Platforms
• PC boards
• What we normally refer to as a structure is something whose main
function is structural.
• But, regardless of function, everything made of solid materials—
radiators, feed lines, wires, microchips—is structurally loaded by
acceleration (e.g., during launch).
1-8
July 2013 Copyright Instar Engineering and Consulting, Inc.• instarengineering.com Materials may be reproduced in complete form only, with header and footer
Course Sampler
Space Mission Structures: From Concept to Launch
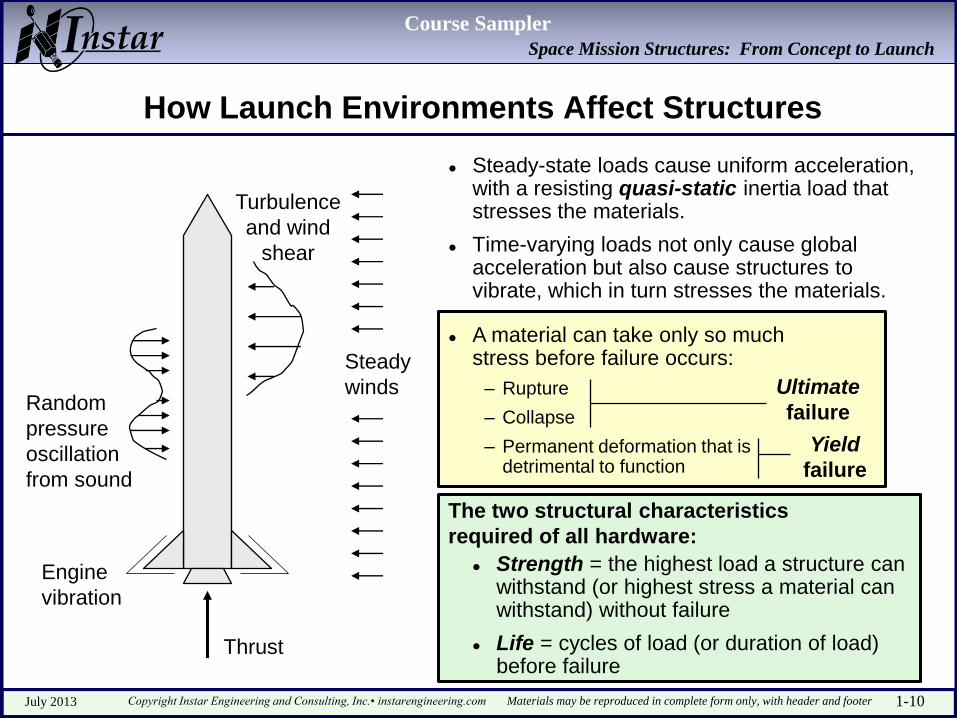
A material can take only so much stress before failure occurs:
– Rupture
– Collapse
– Permanent deformation that is detrimental to function
How Launch Environments Affect Structures
Steady-state loads cause uniform acceleration, with a resisting quasi-static inertia load that stresses the materials.
Time-varying loads not only cause global acceleration but also cause structures to vibrate, which in turn stresses the materials.
Thrust
Turbulence
and wind
shear
Random
pressure
oscillation
from sound
Engine
vibration
Steady
winds Ultimate
failure
Yield
failure
The two structural characteristics
required of all hardware:
Strength = the highest load a structure can withstand (or highest stress a material can withstand) without failure
Life = cycles of load (or duration of load) before failure
1-10

July 2013 Copyright Instar Engineering and Consulting, Inc.• instarengineering.com Materials may be reproduced in complete form only, with header and footer
Course Sampler
Space Mission Structures: From Concept to Launch
Weight Is Always a Consideration but Is Not Always Critical
Example: Estimated spacecraft weight (with growth allowance) = 1700 lb
Payload capacities at our target orbit for available launch vehicles:
LV Capacity
A
B
C
2000 lb
1500 lb
1200 lb
If we can’t drive our spacecraft weight down to
1500 lb (with an appropriate growth allowance),
then we must use launch vehicle A—and weight
will not be critical (300 lb margin).
When weight margin is available, we can reduce the cost of hardware
development and also decrease risk:
• Aluminum instead of advanced composites
• Proven designs that may not be as efficient
• Less costly manufacturing processes
• Robust designs (lower risk, simpler analyses and tests, etc.)
Myth: “All flight hardware is weight-critical.”
Reality: Often not true for launch-vehicle payloads
Make sure you understand how important weight is on your program!
Note: Mass properties may be critical for reasons other than launch, such as satellite on-orbit operation.
1-14

July 2013 Copyright Instar Engineering and Consulting, Inc.• instarengineering.com Materials may be reproduced in complete form only, with header and footer
Course Sampler
Space Mission Structures: From Concept to Launch
Before we move on to dynamics,
Remember: Weight Is Not the Same As Mass!
maF
Force Mass Acceleration
mgw
Weight
(force) Acceleration of gravity
Weight
Acceleration
Mass
English units SI units
lb
in/s2
lb-s2/in
N
m/s2
N-s2/m (or kg)
Weight is in
units of force.
Kilogram is a
unit of mass,
not force.
Pound is a unit
of force, not
mass.
The weight of an object is less on the moon than on Earth, but
the mass is the same. It takes just as much force on the moon to
achieve a given acceleration for an object.
2-12

July 2013 Copyright Instar Engineering and Consulting, Inc.• instarengineering.com Materials may be reproduced in complete form only, with header and footer
Course Sampler
Space Mission Structures: From Concept to Launch
Response to Sinusoidal Vibration: Transmissibility
Transmissibility describes the gain in a sinusoidally base-driven single-DOF system: peak response acceleration relative to peak input acceleration.
222
2
21
21
nn
n
f
f
f
f
f
f
TR
2
1QQuality factor,
= response ratio at resonance
f = Forcing frequency in Hz
fn = System’s natural frequency in Hz
= Damping ratio
(SSAM Eq. 5.30) where
Response to a sinusoidal force
depends on the damping and the
ratio of the forcing frequency to
the system’s natural frequency.
Ratio of forcing frequency to
natural frequency, f/fn
Transmissibility,
TR
(ratio of peak
response
acceleration to
peak base
acceleration)
SSAM Fig. 5.11
Amplification Attenuation (isolation)
Resonance
= 0.01
= 0.05
= 0.1
= 0.2
= 0.5
2
2-27

July 2013 Copyright Instar Engineering and Consulting, Inc.• instarengineering.com Materials may be reproduced in complete form only, with header and footer
Course Sampler
Space Mission Structures: From Concept to Launch
Describing Random Vibration with Acceleration Spectral Density
Acceleration spectral density* (ASD) at frequency f, is the mean-square acceleration within a selected frequency band (whose center is f) divided by the bandwidth.
– Traditional units: g2/Hz
An ASD curve typically spans 20 to 2000 Hz for random vibration testing.
For easy control during test—and to account for uncertainty—we smooth out the ASD plot to envelop any significant peaks.
*Often referred to as power spectral density (PSD), but the
word “power” comes from processing an electrical signal
Frequency, Hz
Accel.
Spectral
density,
g2/Hz
10 100 1000 2000
1
0.1
0.01
0.001
Example:
Derived from
measured data
(hypothetical, in
this case)
Max expected
(acceptance test)
(typically 95%
probability, 50%
confidence)
Envelope of
measured data
Qualification test, 6 dB up per military standards
Protoqual test, 3 dB up per
military standards
The RMS (root mean square) acceleration is the square root of
the area under the ASD curve and is equal to the standard deviation
of random acceleration.
A 6-dB increase means the
acceleration doubles (g2
increases by a factor of 4).
Input Response
Any point on a vibrating component will have its own ASD,
different than the input ASD.
3-23
July 2013 Copyright Instar Engineering and Consulting, Inc.• instarengineering.com Materials may be reproduced in complete form only, with header and footer
Course Sampler
Space Mission Structures: From Concept to Launch
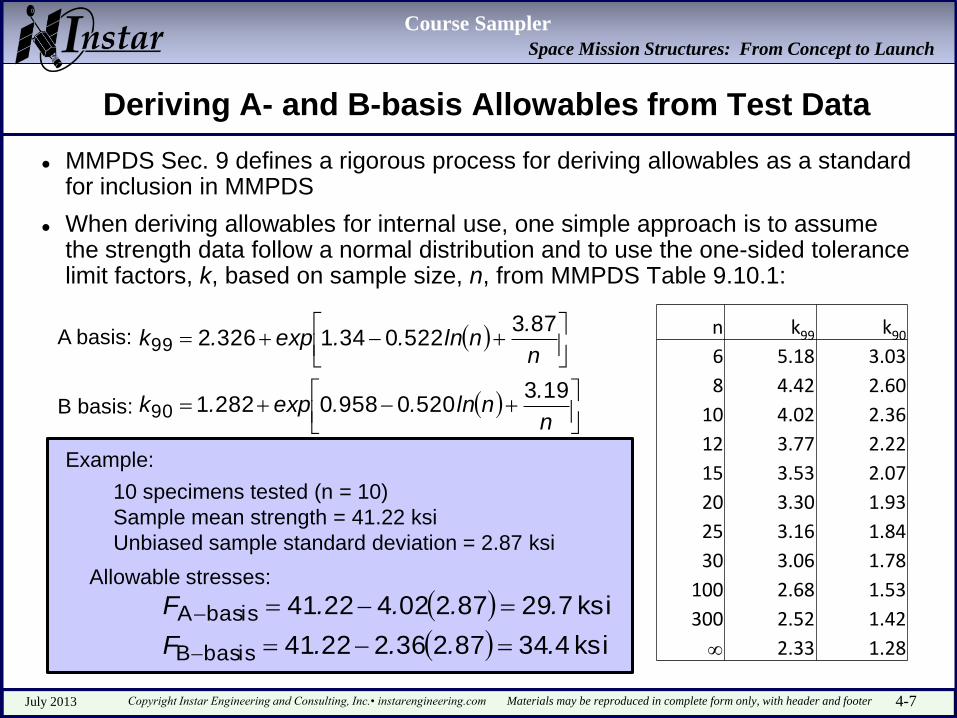
Deriving A- and B-basis Allowables from Test Data
MMPDS Sec. 9 defines a rigorous process for deriving allowables as a standard for inclusion in MMPDS
When deriving allowables for internal use, one simple approach is to assume the strength data follow a normal distribution and to use the one-sided tolerance limit factors, k, based on sample size, n, from MMPDS Table 9.10.1:
n
.nln..exp.k
n
.nln..exp.k
193520095802821
87352203413262
90
99A basis:
B basis:
n k99 k90
6 5.18 3.03
8 4.42 2.60
10 4.02 2.36
12 3.77 2.22
15 3.53 2.07
20 3.30 1.93
25 3.16 1.84
30 3.06 1.78
100 2.68 1.53
300 2.52 1.42
2.33 1.28
Example:
10 specimens tested (n = 10)
Sample mean strength = 41.22 ksi
Unbiased sample standard deviation = 2.87 ksi
ksi 4348723622241
ksi 7298720242241
basisB
basisA
....F
....F
Allowable stresses:
4-7

July 2013 Copyright Instar Engineering and Consulting, Inc.• instarengineering.com Materials may be reproduced in complete form only, with header and footer
Course Sampler
Space Mission Structures: From Concept to Launch
Understanding the Effect of Discontinuities
We make 100 identical tensile
specimens out of material XYZ
and pull them to failure.
Mean ult. strength = 34,297 lb,
Standard deviation = 1324 lb.
What would you expect
the mean strength to be?
2.00" 2.00"
0.25"
P
P
We then drill a 0.20”-dia hole
through each of 100
otherwise identical specimens
of material XYZ and pull them
to failure.
2.00" 2.00"
0.25"
P
P 0.20“-dia hole
4-9

July 2013 Copyright Instar Engineering and Consulting, Inc.• instarengineering.com Materials may be reproduced in complete form only, with header and footer
Course Sampler
Space Mission Structures: From Concept to Launch
The Benefit of Ductility for Uniaxial Stress
Ductility is desirable because it allows materials to tolerate stress concentrations, which occur at discontinuities.
Example—Aluminum flat plate, with hole, under tension:
2.00"
P
P
0.20" dia.
Thickness, t = 0.25”
(0.635 cm)
s g = P
2.00 (0.25) = 2P
s max 3 s g
Net-section stress:
Stress, s
(ksi)
70 67
Strain, e 0.022 0.06
Gross stress:
Peak stress (elastic):
P (2.00 - 0.20)(0.25) n s = = 2.22P
= 6P When the edge of the hole is at a
rupture strain of 0.06, the strain at
the edge of the part is 0.022, and
the state of stress is nearly uniform.
Stress concentrations such as these often do not significantly reduce the
strength of parts made of ductile materials.
Such stress concentrations do, however, greatly reduce fatigue life.
Note: 1 ksi = 1000 psi = 6.895 MPa
SSAM Fig. 8.1
4-10

July 2013 Copyright Instar Engineering and Consulting, Inc.• instarengineering.com Materials may be reproduced in complete form only, with header and footer
Course Sampler
Space Mission Structures: From Concept to Launch
What’s Wrong with This Design?
P
4-46
July 2013 Copyright Instar Engineering and Consulting, Inc.• instarengineering.com Materials may be reproduced in complete form only, with header and footer
Course Sampler
Space Mission Structures: From Concept to Launch
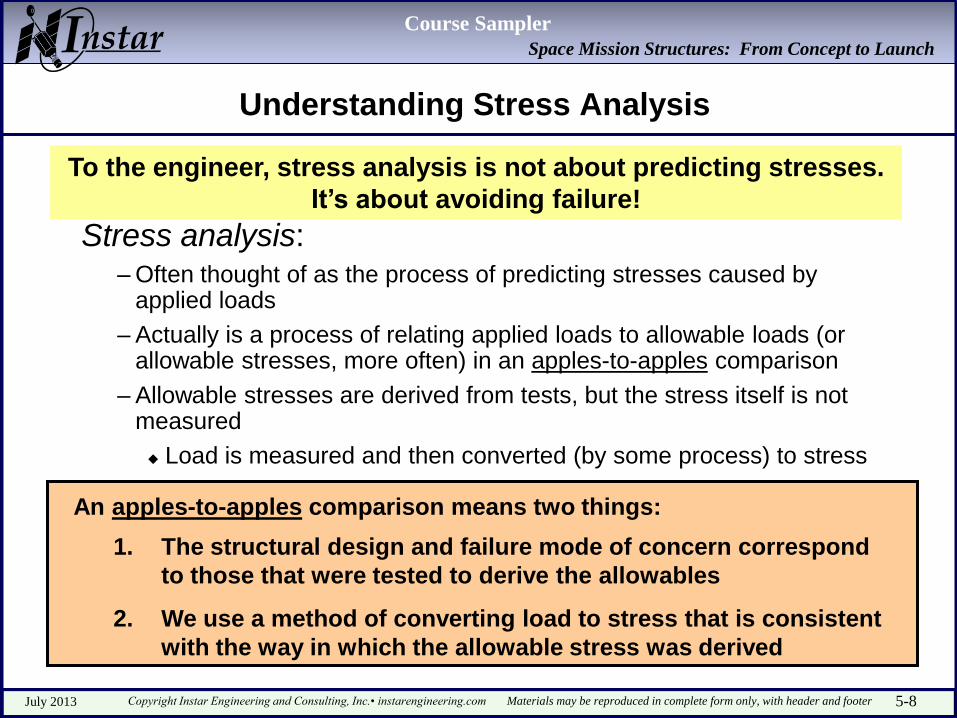
Understanding Stress Analysis
Stress analysis: – Often thought of as the process of predicting stresses caused by
applied loads
– Actually is a process of relating applied loads to allowable loads (or allowable stresses, more often) in an apples-to-apples comparison
– Allowable stresses are derived from tests, but the stress itself is not measured
Load is measured and then converted (by some process) to stress
An apples-to-apples comparison means two things:
1. The structural design and failure mode of concern correspond
to those that were tested to derive the allowables
2. We use a method of converting load to stress that is consistent
with the way in which the allowable stress was derived
To the engineer, stress analysis is not about predicting stresses.
It’s about avoiding failure!
5-8

July 2013 Copyright Instar Engineering and Consulting, Inc.• instarengineering.com Materials may be reproduced in complete form only, with header and footer
Course Sampler
Space Mission Structures: From Concept to Launch
A. Identify all potential
ultimate failure modes
of concern.
B. Explain how you would
assess those failure
modes and obtain
corresponding
allowables.
C. How would you improve
the design?
Class Exercise: Recognizing Potential Failure Modes (Problem 2)
Sandwich construction:
• Graphite/epoxy laminate face sheets
• Flexible aluminum honeycomb core
Uniformly
introduced
tension
and shear
at each
end
Resultant load
P
P
5-31

July 2013 Copyright Instar Engineering and Consulting, Inc.• instarengineering.com Materials may be reproduced in complete form only, with header and footer
Course Sampler
Space Mission Structures: From Concept to Launch
Fatigue Damage is Cumulative
To assess fatigue life, most engineers use Miner’s Rule: ni = Number of loading cycles at stress level Si
Ni = Number of cycles to failure at stress level Si
j = Number of different stress levels
The number of cycles to failure at a given stress level comes from an S-N curve (stress vs. number of cycles), which is different for each material, stress ratio, and stress concentration factor.
An S-N curve is a “best fit” curve drawn through scattered test data. To account for variation in material life, multiply the predicted number of loading cycles, ni, by a scatter factor (life factor) of 4 (typical criterion).
Stress ratio,
Criterion:
Endurance limit = the stress at which a
material can withstand infinite cycles
(Aluminum alloys do not have a true
endurance limit.)
j
i i
i
N
nD
1
max
minRs
s
1 D
Kt = stress concentration factor
smin = minimum stress
smax = maximum stress
Cumulative damage,
SSAM Fig. 9.1
0
40
80
120
160
Steel 17-4 PH (H900) bar, longitudinal direction
(derived from MIL-HDBK-5E; not intended for reference) 200
Kt = 1.0 R = 0.1
Kt = 1.0 R = -1.0
Kt = 3.0 R = 0.1
Kt = 3.0 R = -1.0
Number of Cycles to Failure, N
10 3 10 4 10 5 10 6 10 7 10 8
where
Ma
xim
um
Str
ess,
sm
ax (
ksi)
6-4

July 2013 Copyright Instar Engineering and Consulting, Inc.• instarengineering.com Materials may be reproduced in complete form only, with header and footer
Course Sampler
Space Mission Structures: From Concept to Launch
Example
• We’re designing a spacecraft structure with an octagonal cross section
What is wrong here?
Make sure the results pass the sanity check!
We have the FEM plot the mode shape, with colors to
indicate the associated stresses, and this is what we get:
Bolt circle
(grounded in model)
The color red
indicates the
highest stress
• The first mode of vibration is rocking on the separation mechanism
7-20

July 2013 Copyright Instar Engineering and Consulting, Inc.• instarengineering.com Materials may be reproduced in complete form only, with header and footer
Course Sampler
Space Mission Structures: From Concept to Launch
FireSat Example
Mission: detect forest fires in the United States
Orbit: 700 km at 55° inclination*
Payload: mid-range infrared scanner
Payload field of regard: half angle of ±58° from nadir
Control system: 3-axis (because of off-nadir viewing)
Communications: relay satellite—Tracking and Data Relay Satellite System (TDRSS)
Launch vehicle: Pegasus
Allowable payload weight for 700-km altitude: 635 lb (288 kg mass)
Problem:
Develop a conceptual configuration for FireSat, a hypothetical satellite
conceived in Space Mission Analysis and Design (Larson and Wertz, ed.)
Preliminary Requirements:
*Inclination = angle between the satellite’s orbit plane and the planet’s equatorial plane
Example by John Leritz (SSAM Sec.14.4)
Pegasus data and constraints
used in this example are circa
1993 and may no longer apply.
8-4

July 2013 Copyright Instar Engineering and Consulting, Inc.• instarengineering.com Materials may be reproduced in complete form only, with header and footer
Course Sampler
Space Mission Structures: From Concept to Launch
Designing Minimum-Weight Trusses
The work done by an applied force (external work) equals the
structure’s total strain energy (internal work).
For a truss made of n members with pinned ends, the total strain energy is
Pi = member i’s axial load
Li = length
Ai = cross-sectional area
Ei = Young’s modulus The work done by a single applied force, P, is
= displacement in the direction of applied force
Setting the external work equal to the internal work,
Thus, the way to stiffen a truss is to reduce its strain energy, which we can do by
increasing the members’ cross-sectional areas (which adds weight) or by making
load paths more direct (decreasing Pi2Li, which reduces weight).
Given optional truss arrangements with each member sized to provide just the
required strength for a given material, the lightest truss will be the stiffest.
n
i ii
ii
EA
LPU
1
2
2
2
PW
n
i ii
iin
i ii
ii
EA
LP
PEA
LPP
1
2
1
2
2
2or
22
SSAM Eq. 15.4
8-41

July 2013 Copyright Instar Engineering and Consulting, Inc.• instarengineering.com Materials may be reproduced in complete form only, with header and footer
Course Sampler
Space Mission Structures: From Concept to Launch
Truss Example: Which Is the Most Efficient Arrangement?
Example by Bob Heymans
P
2P
2P
P
0
P
2P
2P
P
0
P
2P
2P
P
0
P
2P
2P
P
0 P
2P
-2.2P
0
P
2P
2P
P
0 2.2P
-2P
0
0
A
B (more efficient)
C
D
E
F
2P P
-1.4P -1.4P P
0 -P
P
0
0 P
1.4P 1.4P
-P -2P
-P
P
P
-1.4P 1.4P
-2P 0
P
2P
2P
P
0
2P 0
0 1.4P -1.4P
-P
20” (0.508 m)
(0.254 m) 10”
SSAM Fig. 15.14
(more efficient) (more efficient)
8-42

July 2013 Copyright Instar Engineering and Consulting, Inc.• instarengineering.com Materials may be reproduced in complete form only, with header and footer
Course Sampler
Space Mission Structures: From Concept to Launch
Uncertainty in final weight
Weight margin is the difference between the allowable weight and the design weight. It’s good to have margin because your weight-growth allowance is probably based on average historical growth, and about 50% of past spacecraft have had more than average weight growth!
Understanding Weight Growth and Weight Margin
Weight-growth allowance (contingency) is the weight added to your current best estimate to account for uncertainty and omissions (has averaged about 25% overall for spacecraft between proposal and completion [ref. Hawkins*]).
Weight inevitably grows during the course of the program ...
SSAM Fig. 14.26
Margin
Estimated weight at conceptual
design
Launch vehicle capability (payload weight)
Weig
ht
Conceptual Design
Production and Test Launch
Program Phase
Expected weight growth
Design weight
(mature weight) =
estimated weight
multiplied by growth
factor
Growth factor =
1 + growth allowance
(decreases as the
program progresses)
* Results of survey of 16 commercial and military S/C. K. Hawkins, “Space Vehicle and Associated Subsystem Weight Growth”, Paper # 1816, presented at the 1988 Conference of the Society of Allied Weight Engineers.
8-54

July 2013 Copyright Instar Engineering and Consulting, Inc.• instarengineering.com Materials may be reproduced in complete form only, with header and footer
Course Sampler
Space Mission Structures: From Concept to Launch
The Cost of Parts
The “after-the-fact” cost
study on the Saturn S-IVB
forward skirt was expanded
to compare expected costs
of alternate designs
Ref: O.P.Harwood, “Right for Flight:
The Structural and Architectural Design
of Machines that Fly”
As built
(A composite
skirt was also
considered in
the study but
had the same
weight as the
isogrid design
at a cost ratio of
9.3.)
9-6

July 2013 Copyright Instar Engineering and Consulting, Inc.• instarengineering.com Materials may be reproduced in complete form only, with header and footer
Course Sampler
Space Mission Structures: From Concept to Launch
Example of Adaptability
Example of the rework necessary to
mount equipment in a skin-stringer
structure: S-IVB skirt. The rows of rivets
attach external stringers.
(Ref: O.P.Harwood, “Right for Flight: The Structural
and Architectural Design of Machines that Fly.”)
An integrally machined isogrid skirt provides
an attachment point at each node, allowing
the structure to adapt to late-added
components.
9-8
July 2013 Copyright Instar Engineering and Consulting, Inc.• instarengineering.com Materials may be reproduced in complete form only, with header and footer
Course Sampler
Space Mission Structures: From Concept to Launch
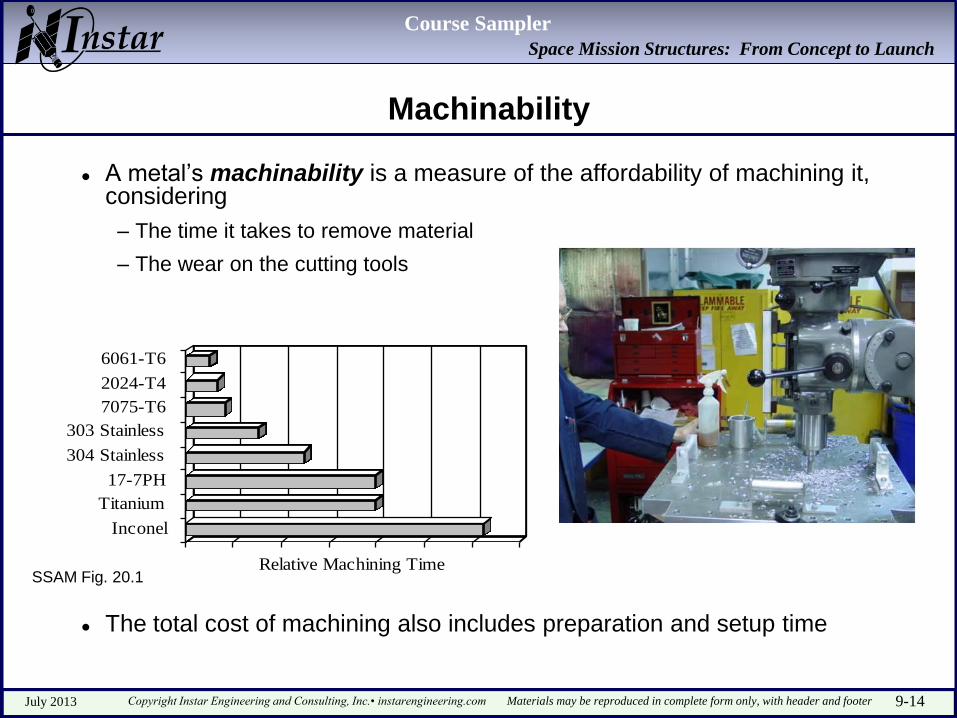
Machinability
A metal’s machinability is a measure of the affordability of machining it, considering
– The time it takes to remove material
– The wear on the cutting tools
Inconel
Titanium
17-7PH
304 Stainless
303 Stainless
7075-T6
2024-T4
6061-T6
Relative Machining Time
The total cost of machining also includes preparation and setup time
SSAM Fig. 20.1
9-14

July 2013 Copyright Instar Engineering and Consulting, Inc.• instarengineering.com Materials may be reproduced in complete form only, with header and footer
Course Sampler
Space Mission Structures: From Concept to Launch
Verification Can Be Proactive or Reactive
Reactive Methods
(weed out poor quality)
Analysis (when done after the
design is released)
Inspection
End-item testing:
•Qualification testing
•Acceptance testing
•Analysis-validation testing
Proactive Methods
(improve product quality)
Analysis (when done to improve a design)
Process control (goal is to learn to control
a manufacturing process so well that its
products do not need inspection)
Development test (to understand a
problem or to improve a design or
manufacturing process )
When production quantity is low, as it is for most aerospace programs,
we typically can’t afford to learn how to control processes as well as
we’d like, so we must rely somewhat on end-item inspections and tests.
The key is finding the right balance.
10-7

July 2013 Copyright Instar Engineering and Consulting, Inc.• instarengineering.com Materials may be reproduced in complete form only, with header and footer
Course Sampler
Space Mission Structures: From Concept to Launch
Qualification and Acceptance Testing
Qualification test
Objective: Demonstrate the adequacy of a design by testing a dedicated non-flight article—built just like a flight article—to conditions that are more severe than expected for the mission. The additional factor or amount is the qualification margin, which is intended to cover build-to-build variation
Applications: When we are not confident in our ability to predict a design’s key characteristics or response or resistance to an environment
Limitations: Effectiveness depends on how well manufacturing processes are controlled (i.e., whether the qualification margin bounds the build-to-build variability)
Acceptance test
Objective: Demonstrate the adequacy of each product by testing it to conditions that are equal to or slightly more severe than expected for the mission
Applications: When we are not confident that our manufacturing processes will limit product variability within the range covered by the qualification margin
Limitations: Not effective in demonstrating life (no way of knowing how much life remains in the flight article)
A qualification random vibration or acoustics test provides confidence that
the flight units will have sufficient fatigue life after acceptance testing
10-17

July 2013 Copyright Instar Engineering and Consulting, Inc.• instarengineering.com Materials may be reproduced in complete form only, with header and footer
Course Sampler
Space Mission Structures: From Concept to Launch
Hypothetical Problem (Example 12-1): Responding to a Negative Margin of Safety
• A spacecraft is about to complete integration and test, two months before launch.
• The verification loads cycle shows increased loads, causing a negative 20% margin of
safety (–0.20) for ultimate failure of a key member in the primary structure.
– If the member fails, the mission will be lost. (Human safety is not at issue.)
• All unnecessary conservatism has been scrubbed from the stress analysis and the loads
analysis; the analysis is relatively straightforward and the failure mode is well understood.
• The ultimate factor of safety used in the analysis is 1.25. Limit load is estimated at 3-sigma
probability (99.87%), and the allowable stress is A-basis (99%).
• The structure was tested, but to 1.1 times the original limit loads, which were 35% lower
than the new limit load.
• This is a one-of-a-kind structure; there is no qualification unit we can test.
• Redesign is out of the question—replacing the structure with a redesigned one would cause
the program to miss its launch window.
• Structural reinforcement could be added. Total estimated cost: $200,000 (labor, materials,
overhead)
• Mission value = $100,000,000 What would you do?
12-7

July 2013 Copyright Instar Engineering and Consulting, Inc.• instarengineering.com Materials may be reproduced in complete form only, with header and footer
Course Sampler
Space Mission Structures: From Concept to Launch
Margin of Safety Relates to Probability of Failure
Load Strength
Negative margin of safety
• Doesn’t meet our criteria
• Implies greater risk
Load Strength
Zero margin of safety
• Acceptable
• What we want when weight is critical
F.S.
F.S. = factor of safety
Load Strength
Positive margin of safety
• More robust: better when weight is
not critical
F.S. M.S.
M.S. = margin of safety
12-15