from store brands to store brandscapes - university of...
TRANSCRIPT
1
From Store Brands to Store Brandscapes:
The Emergence of a Time and Money Saving Heuristic
A. Collins, J. Cronin, S. Burt and R. George
Dr. Alan Collins. (Contact Author)
Department of Food Business and Development.
University College Cork.
Cork.
Ireland.
Dr. James Cronin.
Department of Marketing.
Lancaster University Management School.
Lancaster.
UK.
Professor Steve Burt
Institute for Retail Studies,
Stirling Management School – University of Stirling,
Stirling,
UK.
Dr. Richard George.
Haub School of Business.
Saint Joseph’s University.
Philadelphia.
USA.
2
From Store Brands to Store Brandscapes:
The Emergence of a Time and Money Saving Heuristic
Abstract
Purpose: This research investigates role of store brands as a time and money saving heuristic in the
context of an omnipresent store brand hierarchy. Drawing on the work of Tversky and Kahneman
(1982) it proposes that the store brand hierarchy is characterised by many of the traits of frequently
used heuristics employed by grocery shoppers.
Design/methodology/approach: Based on Chaiken’s (1980) model of information processing and
Stigler’s (1961) perspective on the economics of information search, the study deductively establishes
a model of store brand proneness to reveal the role of store brands as a time and money saving
heuristic. The model is tested on a sample of 535 US households using structural equation modelling
and subsequent multigroup analysis based on two sub-samples of households experiencing high
financial pressure but who differ in terms of time pressure.
Findings: The findings provide strong support for store brands as a time and money saving heuristic
and as a substitute for price search among households experiencing financial and time pressures.
Practical implications: Retailers need to be aware that extensions of the store brand portfolio beyond
the traditional tiered hierarchy, risks undermining what has emerged to be a valuable heuristic used by
certain shoppers. The hierarchy represents a risk to individual retailers in that as a heuristic, store
brands have become part of a familiar generalised market wide store brandscape. Consequently,
retailers are recommended to revaluate the precise role of store brands and the store brand hierarchy
within their loyalty building strategies. In-store, store brands time and money saving characteristics
may promote the subsitution of these products for branded competitors.
Originality/value: This study extends our understanding of the role of store brands in the
marketplace by going beyond their traditional conceptualisation as a competitive device used by
retailers, to instead view them as a decision-making tool used by consumers. It also deepens our
understanding of the boundary between rational search activities and the transition to the use of
frequently flawed heuristics within the shopping process.
Key Words: Store Brand Proneness; Brandscape; Hierarchy; Shopper Heuristic; Time Saving;
Retail.
Article Classification: Research Paper

3
Introduction
The development of store brands to become a strategic totem for a retailer’s identity and quality
reputation provides growing evidence of the continuing role of retailers in shaping consumers’
experience of the shopping process (Burt, 2000; Cuneo et al., 2012; Dawes, 2013; Deleersnyder and
Koll, 2012). Store brands, also termed private brands, private labels, or own labels are defined as the
suite of products sold under a retail organization's house brand name and sold only through that retail
organization's outlets (Morris, 1979). Gradually, the purpose of store brands has evolved to achieve
multiple goals: from providing a defence against low price competition and the provision of a
competitively priced alternative to national brands; to the establishment of points of differentiation
based on innovation, reflecting a greater emphasis on the strategic development of the retailer as the
brand (Burt and Davies, 2010; Collins and Burt, 2003). Over time, this has resulted in the emergence
of a generic multi-tiered ‘store brand hierarchy’ that has become one of the most distinguishing
features of the grocery retailscape today (Palmeira and Thomas, 2011; Geyskins et al, 2010; Nielsen,
2011; Rider, 2010). This is typically represented by a common strategy amongst retailers to offer at
least two of their own branded offerings within the same product category across various price and
quality tiers (e.g. a value tier representing the opening price point; a mid-priced tier of national brand
equivalents; and a premium tier featuring unique and differentiating products) (PLMA 2011). While
the effects of this well established generic system of store brands on manufacturers and retailers are
widely understood, less is known about how availability and familiarity with multi-tier store brands
impacts upon consumers.
A common thread throughout many studies of shopping behaviour within the retail context is
the effort consumers invest in attempting to strike a balance between their desire for judgmental
accuracy and their desire to minimalize effort expenditure (Mandrik, 1996) in the context of
‘hyperchoice’ (Mick et al, 2004; Chernev 2003). Familiarity thus becomes a welcome addition for
consumers when interacting with the shopping environment; and it is within this logic that we believe
the ubiquitous presence of multi-tier store brands plays an important role in the processing goals of
effort reduction and value maximization. The specific purpose of this paper is to examine whether or

4
not store brands have been appropriated by shoppers as a heuristic device; a mental stratagem capable
of saving time and money. In doing so we explore the relationship between shoppers’ store brand
proneness and in-store price search.
Following Richardson et al. (1996) we define store brand proneness as a shopper’s inclination
to purchase store brand products, enabling us to adopt a more generalised market based view rather
than a store, product or category specific approach (Erdem et al., 2004). More importantly, it enables
us to nest the store brand purchase in the context of the broader shopping decision making process and
to test whether or not store brands function as a time and money saving heuristic. By responding to
Ailawadi and Keller’s (2004) call for a greater understanding of the retail brand architecture, the
paper contributes to the literature on the role of brands in the consumer marketplace as it extends our
understanding of the store brand beyond a competitive device used by retailers and positions it as a
decision-making tool used by consumers while shopping. It also deepens our understanding of the
boundary between rational search activities and the transition to the use of frequently flawed time and
cognitive saving heuristics within the shopping process.
To assess the time and money saving role of store brands, the study is situated in the context
of the US grocery market where there is evidence indicating the presence of well-developed entry-
level and mid-price store brand tiers, both of which are shopped heavily by price-driven and value-
committed consumers (see Nielsen, 2011). These tiers, we believe, are particularly important in terms
of time and money saving motives especially when financial constraints are evident.
The paper is structured as follows. First it will outline the concept of a heuristic in the context
of shopping behaviour before developing an a priori argument for store brands as a heuristic device
for shoppers. Following this, the paper will establish a set of hypotheses that builds a model of store
brand proneness which explicitly incorporates these products as a time and money saving device. This
will be followed by an exposition of the method used to test the hypotheses in the form of two
structural equations models, one based on the full survey of 535 US grocery shoppers, and a second
based on two extracted cohorts of financially pressed shoppers who differ in terms of time pressure.
5
The paper cloncludes with a discussion of the contributions, implications for management and future
research and possible applications in markets characterised by a more sophisticated store brand
hierarchy.
Heuristics in Consumer Behaviour
Heuristics
A heuristic may be defined as a mental stratagem that serves “to reduce the complex tasks of
assessing probabilities and predicting values to simpler judgemental operations” (Tversky and
Kahneman, 1982 p.3). Heuristics are cognitive rules of thumb that enable individuals to make
decisions while reducing the information search which might otherwise be required to deal with
existing conditions of uncertainty. The significance of heuristics to marketplace behaviour can be
appreciated when considering the sprawling ‘hyperchoice’ of product options and category varieties
that are encountered during most contemporary shopping trips, particularly in the grocery market. The
time and effort consumers can be expected to invest in trying to make sense of the surplus of product
information may have detrimental effects, including confusion and cognitive strain, as well as lower
decision satisfaction (Mick et al., 2004). Heuristics make the grocery shopping environment
manageable for consumers by reducing the amount of time and effort involved in making choices, and
dealing with implicit trade-offs, while providing a certain level of comfort that the decision made will
have a favourable outcome (Chaiken et al., 1989; Mandrik, 1996; Simpson et al., 2008).
There are a wide variety of heuristics and inferential mechanisms used by consumers to
simplify decision making in daily life (for an extensive review see Kardes et al., 2004) some of which
are particularly relevant in the context of grocery shopping. The brand-quality and price-quality
heuristics dominate much of the marketing literature (Richardson et al., 1996; Völckner and
Hofmann, 2007). The brand-quality heuristic enables consumers to deal with the uncertainty
surrounding quality by helping them to manage perceived risk (Richardson et al., 1996) through
reliance on a brand's accumulated equity as a quality cue (Delvecchio et al., 2006). This enables
6
consumers to economise on search and mental effort “rather than considering tradeoffs between their
usual brand and other available brands” (Nowlis 1995, p.288). Thus, national manufacturer brands
with accumulated equity and ubiquity are regularly believed by consumers to be of superior quality
and signal a “safer-bet” purchase during shopping missions (Aaker, 1996; Kirmani and Wright, 1989).
The inherent conflict within the price-quality heuristic, with price acting both as a measure of
quality and as a measure of sacrifice, is widely recognized (Dodds et al., 1991; Scitovsky, 1945).
Despite this, extant research demonstrates that price, or to be more specific, relative prices are used as
a heuristic to complete product quality evaluations particularly when consumer motivation or
involvement is low (Mitra, 1995). However considerations of relative prices can involve considerable
effort given the array of price points, pack sizes and promotional activity available in the marketplace
today. Furthermore, the efficacy of this heuristic may be questioned as it regularly exposes the
consumer to substantial risks of overpayment or underperformance (Nowlis, 1995). Consequently
consumers may have the incentive to devise and implement alternative heuristics that economise on
price-quality evaluations and that reduce uncertainty on both the quality and sacrifice dimensions.
The ‘representativeness heuristic’ is based on similarity (Tversky and Kahneman, 1982).
Predictions about an unknown product are inferred from what is known about another similar product
or category: “An event is judged probable to the extent that it represents the essential features of its
parent population” (Tversky and Kahneman, 1982 p.163). Additionally, the ‘availability’ and
‘numerosity’ heuristics have both been implicated in grocery shopping behavior and the determination
of store price perceptions (Ofir et al., 2008). The availability heuristic refers to the ease with which
experience of the phenomenon in question can be recalled from memory and can be influenced by
recency, salience and frequency (Kardes et al., 2004) making it particularly relevant in the context of
routine and familiar decision making situations such as grocery shopping. The numerosity or
frequency heuristic on the other hand, relates to situations where shoppers employ their ability to
recall more, rather than fewer, instances of the phenomenon on which to base their inferences (Alba et
al., 1994; Alba et al., 1999).

7
Store Brands as a Heuristic Device
Given the above, we argue that store brands most commonly sold in the context of a store
brand hierarchy have the potential to act as a heuristic capable of reducing cognitive effort, time and
monetary costs. In the first instance, store brands offer a solution to the overpayment –
underperformance risk (Nowlis, 1995) because the structural characteristic of the store brand
hierarchy is imbued with more information than simply price alone. Consequently the hierarchy may
serve as a more credible solution to the problem of asymmetric information because a given retailer’s
tiered positioning strategies are re-enforced by competitive discipline across the broader retail market.
Second the generic store brand hierarchy, dimensioned by price and quality, acts as a rubric with in-
built price/quality trade-offs that reduce the cognitive effort and time investments required of the
shopper. Third, when considering the store brand hierarchy, the whole is greater than the sum of its
parts. Recent findings indicate that the presence of a multi-tiered store brand hierarchy has the effect
of improving quality perceptions within the hierarchy (Palmeira and Thomas, 2011) while evidence of
shopping across the various tiers of the store brand hierarchy is provided by Geyskens et al. (2010)
and across stores by González-Benito and Martos-Partal (2012). Fourth, a store brand heuristic may
be a potent substitute for the representative, numerosity, and availability heuristics given the extensive
variety of categories that feature these products, the frequency of purchase and the relatively low
involvement normally associated with the purchase of many grocery items.
Finally, the hierarchical store brand structure typically occupies multiple product categories
within a single store environment and is shared by many different grocery retailers. We thereby
propose the ominpresence of a generic store brand hierarchy across different retailers can be loosely
conceptualised as a brandscape (see also Sherry, 1998; i.e. a unified portfolio, positioning and
merchandising of brands that becomes a familiar and comfortable space for consumers). By virtue of
this familarity, consumers can interpret the context in which they are shopping, draw meanings from
this context and economise on their search. The organization of retailers’ store brand products
according to shared, standardized, and recognizable price and quality points represents a basic
blueprint that consumers can incorporate into their decision making and put to a wide variety of uses.

8
As such, the wide availably of store brands and the near ubiquity of the basic store brand hierarchy
across the grocery market may improve the shopping experience and yield efficiencies when used as a
time and money saving device across multiple product categories and stores. A specific breakdown of
our hypotheses is laid out below.
Hypotheses and Model Development
Financial Pressure and Price Search
The effect of financial pressure or perceived budget constraints (Urbany et al., 1996) is to reduce the
consumer’s consumption set. In economic analysis this is characterized by a shift in the individual’s
budget constraint which is constructed for a given nominal income and set of prices. One means of
restoring the consumption set is to substitute search for other time consuming activities and identify
lower prices. Thus we propose that in terms of the shopping experience;
H1 Household Financial Pressure will be positively related to In Store Price Search.
However the relationship between financial pressure and price search is partly determined by the dual
and conflicting role of price as an indicator of product quality and a monetary measure of sacrifice
(Scitovsky, 1945). This relationship is embodied in the shopper’s willingness to trade down to lower
perceived quailty products to take advantage of lower prices, thereby reducing financial pressure
(Dodds et al., 1991). We propose that this propensity to trade-down will mediate the relationship
between financial pressure and price search. Furthermore, the willingness to trade down increases the
shopper’s choice set encouraging price search at the point of sale. This suggests that;
H2 Household financial pressure will be positively related to the Willingness to Trade Down.
and
H3 Willingness to Trade Down will be positively related to In Store Price Search.
Store Brand Proneness, Financial Pressure and Price Search
9
While the relationship between store brand proneness and household income is mixed (see Baltas and
Argouslidis, 2007; Hoch and Banerji, 1993) the relationship with financial pressure appears to be
clearer. Ailawadi and colleagues (2001) found that store brand usage was positively related to the
individual’s financial constraints while more recent research links the purchase of store brand
products to the economic cycle (see Lamey et al., 2012) supporting the view that store brands may be
considered as inferior goods, as defined by economic theory, displaying a negative relationship with
income levels. Thus we propose that financial pressure is one of the key drivers for store brand
purchases and that;
H4 Household Financial pressure will be positively related to Store Brand Proneness.
Furthermore, given the substantial price discounts available throughout the store brand hierarchy,
substitution of these products for national manufacturer brands or indeed alternative store brands
within the hierarchy (Geyskens et al., 2010) enables shoppers to maintain their consumption bundle in
the face of financial pressure. However knowledge and awareness of these discounts is acquired
through the process of price search suggesting that:
H5 In Store Price Search will be positively related to Store Brand Proneness.
Financial Pressures and the Opportunity Cost of Time Engaged in Price Search
The propensity to employ heuristics when under time pressure is recognized throughout the literature
(Mitchell and McGoldrick, 1996). The concept of time pressure is central to the understanding of
decision-making and the use of heuristics. Time can be objectively measured but the concept of time
pressure is more nuanced and of a subjective nature. It conveys the sense of tasks or activities to be
accomplished relative to the time available and points to the time allocation decision given competing
time demands. In this manner time pressure is related to the economic concept of the opportunity cost
of time which may be defined as “the value of what was foregone in order for the individual to spend
his or her time in the manner he or she did” (Bryant, 1990, p160).
10
Throughout the economics literature, the opportunity cost of time is equated with and measured by the
real wage rate (Bryant, 1990; Putrevu and Ratchford, 1997) which is the purchasing power of an
hour’s work. A fall in the real wage, either in light of a fall in the nominal wage or rising prices, is
therefore associated with a fall in the opportunity cost of time. Consequently, the relationship between
financial pressure and the opportunity cost of time is negative because as real wages fall, and financial
pressure increases, the opportunity cost of time declines (Collins et al., 2012; Gauri et al., 2008).
Alternatively, financial pressure may be due to unemployment or underemployment where the
consumer is forced to consume excess leisure thereby reducing the opportunity cost of time engaged
in price search. Thus we propose that;
H6. Household Financial Pressure is negatively related to the Opportunity Cost of Time engaged in
Price Search
Our key concerns are the relationships between financial pressure, the individual’s opportunity cost of
time engaged in price search and store brand proneness. According to Stigler’s (1961) cost-benefit
perspective, consumers will engage in search as long as the marginal benefits exceed the marginal
costs. In the current application, the primary resources being expended are time and effort and the
benefits are denominated in terms of savings in the form of more economical store brands found
through the process of price search. This suggests that the opportunity cost of time engaged in price
search will partly determine the actual amount of search undertaken. As the opportunity cost of time
engaged in search increases, the propensity to engage in search diminishes. Thus,
H7. The Opportunity Cost of Time engaged in price search will be negatively related to In Store Price
Search.
However we need to modify this rational economising perspective to account for the possible use of
heuristics as an alternative to search. Individuals who place a high value on their time, thereby
experiencing a high opportunity cost of time, experience greater feelings of time pressure (Devoe and
Pfeffer, 2011). To understand how time pressure might influence behaviour we turn to Chaiken’s
(1980) dual information processing framework which casts light on how time influences information
11
processing and judgements. Central to this framework is the distinction between systematic versus
heuristic information processing. According to the systematic view, agents engage in information
processing and cognitive effort, while the heuristic view is associated with considerably less effort
when making judgements. The perspective presents search and heuristics as alternatives. Expanding
on this work, Kruglanski and Freund (1983) and Suri and Monroe (2003) find evidence showing that
time pressure moderates the effect of incentives or motivation on the form of information processing
employed. Where motivations or incentives are high, systematic information processing is favoured.
However, where perceived time pressure and the opportunity cost of time is high, heuristic
processing is more likely. This indicates that time pressure is likely to moderate the effect of financial
motivations and determine the extent to which the individual engages in systematic or heuristic
information processing in the course of making purchasing decisions. Earlier we proposed that store
brand proneness is an outcome of price search where awarneness of discounts lead to purchase. We
also argued that store brands in themselves have the potential to act as a time and money saving
heuristic. Coupling these argments with the idea of time pressure or the opportunity cost of time as a
moderator leads us to hypothesise that;
H8 Store brands act as a heuristic and there will be a direct positive relationship between the
Opportunity Cost of Time engaged in Price Search and Store Brand Proneness.
More specifically, following the work of Suri and Monroe (2003) we propose that where financial
pressures are high, the opportunity cost of time engaged in price search will moderate the nature of
economising behaviours undertaken by the individual. Therfore;
H9: where Household Financial Pressure is high and the Opportunity Cost of Time is also high,
consumers will engage in more heuristic information processing (incurring less cognitive and
temporal costs) than consumers faced with high Household Financial Pressure but low Opportunity
Costs of Time.
H10: where Houshold Financial Pressure is high and the Opportunity Cost of Time is low,
consumers will engage in more systematic information processing/In Store Price Search (incurring

12
more cognitive and temporal costs) than consumers faced with high Household Financial Pressure and
high Opportunity Costs of Time.
Hypotheses 1-8 are presented in Figure 1.
Locate Figure 1 near here.
Methodology
Data Collection
Following much of the existing research in the area, direct self-reported measures were used
for all the dependent and independent variables. Data were collected in the Pennsylvania, New Jersey,
Delaware, and Maryland states using an external marketing company. This company was requested
to build a sample size of 500 respondents from their database subject to the conditions that thirty
percent of respondents were male, that the respondent was the individual responsible for the
household’s primary shopping, and had completed a grocery shop within the previous four weeks.
Each qualifying respondent completed a 10 minute on-line survey and, to encourage responses, a $5
reward was given for each completed questionnaire. Five hundred and thirty five completed
questionnaires were usable. The number exceeded the initial 500 sample size request in order to
meet the 30 percent male requirement and the additional observations are included in the analysis.
The variety of primary grocery stores frequented by the sample is presented in table 1. 95% of the
sample identifed a primary grocery location which sold store brands with at least two tiers of the store
brand hierarchy available.
Locate Table 1 Near Here
Measurement Model

13
The indicators used for each latent construct in the model are presented in table 2. Items were
chosen directly or modified from earlier works (Ailawadi et al., 2001; Lichtenstein et al., 1990;
Putrevu and Ratchford, 1997; Urbany et al., 1996). A five point Likert scale anchored by 1 =
“strongly disagree” to 5 =“strongly agree” was used. One construct, the opportunity cost of time spent
engaged in price search, employs a subset of items used by Lichtenstein and colleagues (1993) to
measure price consciousness. We suggest that given our definition of opportunity cost of time spent
engaged inprice search as the value of the most preferred opportunity forgone (e.g. leisure or
remunerated work), the items selected are appropriate at a conceptual level. For example, instances
where “searching for lower prices is not worth it”, or where “looking for lower prices takes too much
time”, suggest that the opportunity cost of search (i.e. the value of the alternative) is high.
The use of self-reported measures, particularly when the dependent and independent variables
are measured using the same scale can result in common methods variance (CMV). Following
Podsakoff et al (2003), to assess this risk we first applied a Harmon’s single factor test. The results of
the exploratory factor analysis indicated that the one factor explained just over 25% of the variation in
the data suggesting that CMV was not a problem. To extend our analysis beyond the one factor test
we included a confirmatory factor analysis and introduced an additional latent variable. To estimate
CMV each factor loading between it and every manifest variable was set to be equal (Podsakoff et al,
2003). The factor loadings for this CMV variable were estimated as 0 providing further evidence that
our data is free of common methods variance.
Initially, a maximum likelihood confirmatory factor analysis was carried out using AMOS 20
to test the measurement model. The overall model fit measures, chi-square (χ2) =131, degrees of
freedom (d.f.) 67, p=.000, the goodness of fit index GFI=. 97, the adjusted goodness of fit index
AGFI=.96 are presented in table 2. The Chi-square is significant at the .001 suggesting a lack of fit.
However the Chi-square is very sensitive to large sample sizes making it very probable that some
inconsequential difference will be found between the variance-covariance matrix and the implied
variance-covariance matrix hypothesised in the measurement model. Consequently we employ the
comparative fit index (CFI = .974), the Tucker-Lewis index (TLI = .965) (Hu and Bentler, 1999) and

14
root mean square error of approximation (RMSEA =.042) to assess the model’s fit (Byrne, 2001).
All support an acceptable model fit (Arbuckle, 2012). All standardized factor loadings demonstrate
the correct sign and statistical significance (p<.001) on their corresponding construct.
Locate Table 2 Near Here
Convergent validity was assessed by examining the size and significance of the factor
loadings and their associated critical values as well as inspecting the average variances extracted
(AVE) for each construct (table 2). All average variances extracted met the .50 threshold (Hair et al.,
1995) and all items significantly and positively loaded on their corresponding latent construct
demonstrating adequate convergent validity. Reliability is demonstrated through the use of
Cronbach’s alpha scores with all constructs meeting the desired .70 threshold (Nunally, 1981) along
with the Spearman-Brown value for the two item willingness to trade down construct. Discriminant
validity is supported by table 3 and the fact that the average variance extracted exceeds the squared
correlation coefficient for each pair of latent factors (Fornell and Larcker, 1981).
Consequently the measures of the constructs used in our model achieve satisfactory
reliability, convergent and discriminant validity.
Locate Table 3 Near Here
The Results: Hypotheses 1-8
The structural model outlined in figure 1 was tested and estimated using AMOS 20. The results are
presented in table 4. Once again the chi-square is significant at the .001 percent level (Chi-square (χ2)
= 132.99 d.f. =69, p = .000) due to sample size so we rely on the remaining measures of fit (GFI.97),
(AGFI=.97), (CFI = .98), (TLI =.97) and the root mean square error of approximation, (RMSEA=
.042). All indicate a good level of fit for the overall model (Arbuckle, 2012; Byrne 2001). Therefore
we can proceed to examine our model in detail.
First, the model explains 29% of the variation in store brand proneness. We believe that this is
acceptable given that other factors such as perceived risk have not been incorporated and compares

15
well with other models that included considerably more variables (Urbany et al., 1996). The results
present the hypothesised paths and direction of each coefficient and the estimated standardised
coefficient values with their significance levels and the critical ratios. They provide support for all the
direct relationships postulated with the exception of the direct relationship between household
financial pressure and store brand proneness.
To establish a competing model, the most important causal path as far as this research is
concerned, between the opportunity cost of time engaged in price search and store brand proneness,
was removed. This relationship, we have argued captures the essence of store brands as a heuristic.
The model was re-estimated yielding a Chi-square (χ2) = 144.7 d.f. =70, p = .000. (AGFI=.94), (TLI=
.97). The change in Chi-square Δ (χ2) for 1 degree of freedom = 11.71 is significant at the .001 level
indicating a significantly inferior model fit. This is supported by the fall in the AGFI and an increase
in the Akaike Information Criteria from 204.997 to 214.736 (Byrne, 2001). Consequently, we can be
confident that the causal path between the opportunity cost of time engaged in search and store brand
proneness improves model fit.
Locate Table 4 Near Here
To provide more insight, and extend our findings beyond the hypotheses, the results are
further broken down into the total, direct, and indirect effects in table 5. Focusing on household
financial pressure (HFP), we note that while its direct effect on store brand proneness (SBP) is small
and insignificant we can observe that its total effect (.213), mediated through the willingness to trade
down to lower quality goods for better prices (WTD), in-store price search (ISPS), and the
opportunity cost of time engaged in search (OCTS) is substantial. As shown in table 4, the direct
effects between HFP and each of these variables, ISPS (β=.242), WTD (β=.289), and OCTS (β=-.271)
are all significant and display the expected signs. Thus HFP is deeply implicated in SBP but the
mediated nature of its relationship may explain some of the contradictory results found in earlier
research which focused on the direct relationship between income and store brand proneness.
In line with earlier related research, our view that willingness to trade down (WTD) would be

16
found to be positively related to in store price search (ISPS) is supported. We can see that there is a
positive indirect effect between WTD and SBP mediated through ISPS (table 5). This finding sits
neatly with the earlier work of Richardson and colleagues (1994) who observe that evaluating
perceived quality is a complex task involving a wide variation of intrinsic and extrinsic product
attributes at different price points. Thus WTD increases the shoppers’ choice set, providing the
shopper with the motivation to search for lower prices, and upon discovery encourages the purchase
of store brands. The direct effect between ISPS and SBP is the largest of all such effects (β= .600)
highlighting the importance of in store price search and price comparison across brands in explaining
store brand proneness.
Locate Table 5 Near Here
Turning our attention to the set of relationships between the opportunity cost of time in
searching(OCTS), in store price search (ISPS), and store brand proneness (SBP) sheds light on the
main contribution of this research. As table 5 shows, the total effect between OCTS and SBP is
extremely small (β=-.044), suggesting that the opportunity cost of time spent engaged in search is not
a determinant of store brand proneness. However this total effect is comprised of two pathways, each
of which has very different dynamics. First, following the systematic information processing path, the
direct effect of OCTS on ISPS is negative, significant, and large; as OCTS increases less search is
undertaken, depressing store brand proneness. The indirect effect between OCTS and SBP, mediated
through ISPS, may be calculated as the product of both direct effects (i.e. -.410*.60=-.246). On the
other hand we have proposed the use of store brands as a heuristic, a time and effort saving device
modelled as a direct path between OCTS and SBP, is found to be positive and significant (β=.202).
The total effect between OCTS and SBP, calculated the sum of these effects is small as these effects
almost cancel each other out (-.246+.202= -.044).
To investigate these relationships, and establish clearer evidence for systematic versus
heuristic information processing and their effects on store brand proneness we progress to hypotheses
9 and 10.

17
The Results: Hypotheses 9-10
Measurement Invariance
To test hypotheses 9 and 10 and establish the role of the opportunity cost of time in price search
(OCTS) on systematic versus heuristic information processing required two cohorts of respondents
with a similar motivation (Household Financial Pressure) to save money but different resources in
terms of time measured by OCTS; a cohort comprised of individuals under financial pressure with a
high OCTS and another cohort comprised of individuals also under financial pressure but with a low
OCTS. To establish these cohorts, latent means were extracted from AMOS using the measurement
model. The means for OCTS and HFP were used as the clustering variables for a hierarchical cluster
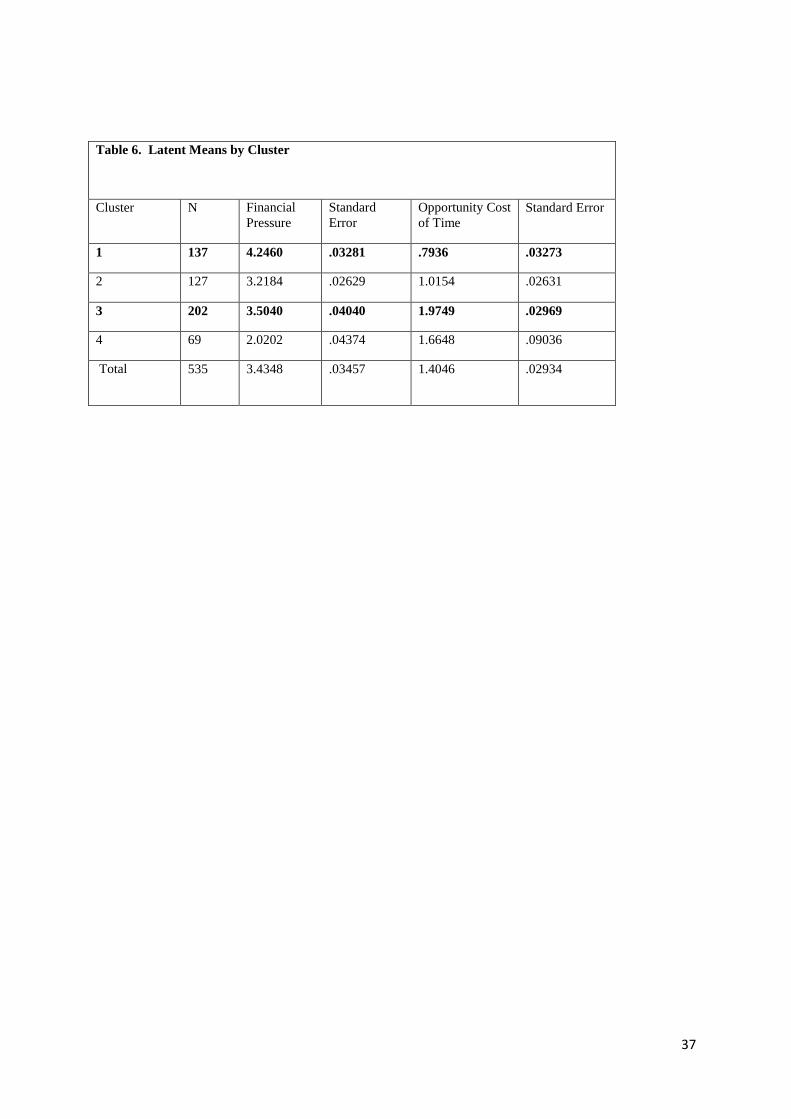
analysis using Ward’s method. A four cluster solution was extracted. The means for each cluster are
provided in table 6. To test hypotheses 9 and 10 two clusters were chosen for multigroup analysis:
Cluster 1, characterised by higher than average HFP but lower than average OCTS;
Cluster 3, higher than average FP, with a higher than averge OCTS.
Locate Table 6 Near Here
To test H9 and H10 we need to establish the measurement basis for comparing our two
cohorts. There is a hierarchy of increasingly demanding nested levels of measurement equivalence
(Steenkamp and Baumgartner, 1998; Vandenberg and Lance, 2000). The level of measurement
equivalence required for a specific piece of analysis is determined by the parameter of interest (e.g.
regression coefficients, means). For the purposes at hand we are interested in differences in regression
coefficients or structural paths between our two cohorts. Thus, metric equivalence which guarantees
cross group equality of the intervals of the scales used to measure our latent constructs is required
given our specific application (Davidov et al., 2014). The existence of metric equivalence is tested by
fixing the factor loadings between the manifest and latent variables across groups yielding our
constrained model and assessing the difference in fit between this and the unconstrained model when
factor loadings are allowed to vary across cohorts (freely estimated).

18
The initial analysis showed that invariance could not be established for the willingness to
trade down (WTD) construct so this was removed from the analysis. This was not considered
problematic as this construct was not central to hypotheses 9 or 10.
Having removed this construct, the remaining constructs and manifest variable were tested
across both cohorts. The Chi-square ( (χ2) = 102.53 d.f. =96, p = .305) for the unconstrained model
when compared to the constrained measurement model ( Chi-square (χ2) = 128.83 d.f. =104, p = .05)
yielded a change in Chi-square Δ (χ2) =26.30 for df=8. This exceeds the Chi-square (χ2) with df = 8
=15.507 at =0.05 level, indicating a significant difference between the unconstrained and
constrained measurement models.
Two items, Pcom1 and HF1 were found to be the causes of the difference. Following Byrne
and Van De Vijver (2010), these were removed retaining only the equivalent items which was
sufficient for our analysis (Byrne et al., 1989; Davidov et al., 2014). A comparison of the revised
unconstrained model (Chi-square (χ2) = 44.92 d.f. =58, p = .896) and the constrained measurement
model1 (Chi-square (χ2) = 53.115 d.f. =64, p = .832) yields a change in Chi-square Δ (χ2) = 8.19 for
Δd.f.= 6 which is not significant at =0.05 level (i.e. is less than (Chi-square (χ2) = 12.592 d.f. =6),
indicating no difference between our models and supporting invariance at the metric level.
Comparisons across Groups
Having established metric invariance and fixing the factor loadings associated with each
construct, the next stage was to test the revised structural model presented in figure 2. To test our
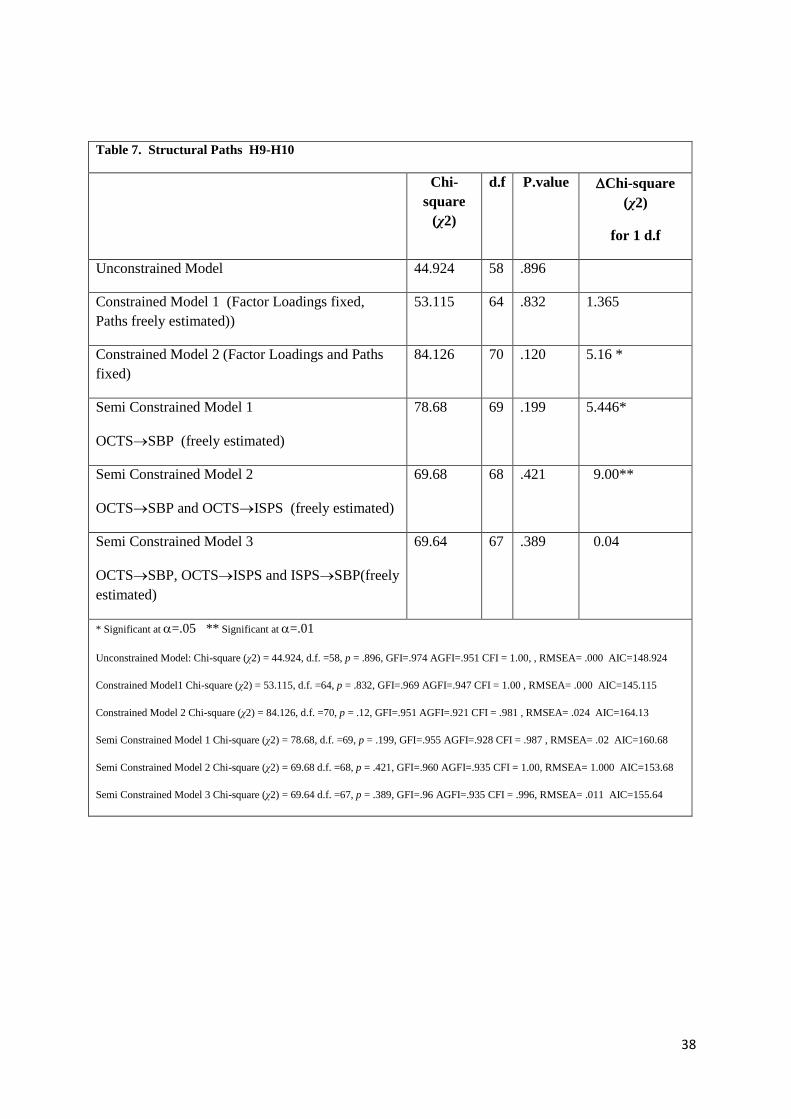
hypotheses we estimated the revised model and the results are presented in table 7. By comparing
constrained model 1, where factor loadings are fixed but the structural parameters (path coefficients)
are freely estimated, with constrained model 2 where both factor loadings and structural paths are
fixed, we find a change in Chi-square Δ (χ2) =30.01 for Δ df= 6 or equivalently Δ (χ2) =5.16 for Δ
df= 1. Examining a Chi-square distribution table reveals that for 1 degree of freedom, the Chi-square
(χ2) at =.05 = 3.841. Any Chi-square (χ2) greater than this value for Δ df= 1 indicates a significant
19
difference. This result indicates a reduction in model fit and that differences exist in the structural
paths (regression coefficients) across our two cohorts.
Locate Figure 2 Near Here
To identify the cause of this reduction in fit (and the structural paths that differ across
cohorts) we now begin to freely estimate the structural paths (our regression coefficients) in a nested
sequential manner.
By freeing the structural path between the opportunity cost of time in price search (OCTS)
and store brand proneness (SBP), and examining the change in Chi-square (χ2) between the
constrained model 2 and semi constrained model 1, we can isolate the effect on model fit thereby
identifying if the strength of this path differs across both our cohorts. The change in Chi-square Δ
(χ2)=5.446 for d.f=1, indicates a significant difference and an improvement in model fit compared to
the constrained model 2, providing evidence that the strength of this relationship differs across the
two cohorts.
We now add the structural path between opportunity cost of time in price search (OCTPS)
and in store price search (ISPS) to our freely estimated structural parameters (semi constrained model
2). Comparing semi constrained model 2 with semi constrained model 1 reveals a change in Chi-
square (χ2)=9 for 1 d.f., strongly supporting an improvement in the overall model fit and a
significant difference in the strength of this path across both cohorts. The overall improvements in our
model as the relevant paths are freed are supported by the declining AIC criteria (Byrne, 2001).
Next, we add the structural path between in store price search (ISPS) and store brand
proneness (SBP) to our freely estimated structural parameters (semi constrained model 3) and note
that the change in Chi-square (χ2)=.04 for 1 d.f. does not support any difference in the relationship
between ISPS and SBP across the cohorts. This we suggest indicates that both cohorts respond to
changes in price search undertaken in the same manner.
Locate Table 7 Near Here
20
Having established that differences exist in the strength of the OCTSSBP (heuristic processing) and
OCTSISPS (systematic processing/price search) paths across cohorts, we now progress to examine
the path coefficients to investigate if evidence can be found to support H9 and H10. To recap,
H9: where financial pressure is high and the opportunity cost of time is also high,
consumers will engage in more heuristic information processing (incurring less cognitive and
temporal costs) than consumers faced with high financial pressure but low opportunity costs
of time.
H10: where financial pressure is high and the opportunity cost of time is low, consumers
will engage in more systematic information processing/price search (incurring more
cognitive and temporal costs) than consumers faced with high financial pressure and high
opportunity costs of time.
The results are presented in table 8. It shows that the path between opportunity cost of time in price
search (OCTS) and store brand pronesses (SBP) is positive and significant for those with a high
OCTS. For these shoppers, store brands help economise on time and effort while dealing with the
challenge of financial pressure. We note that the path is not significant for those with a low OCTS
providing clear support for H9 and heuristic information processing.
Examining the path between opportunity cost of time in price search (OCTS) and in store
price search (ISPS) reveals support for H10, with those shoppers with a low OCTS engaging in ISPS.
However, no evidence is found to support this relationship for shoppers with a high OCTS.
Locate Table 8 Near Here
Discussion and Theoretical Implications
There is a convincing body of research that ties store brand penetration and sales to the
economic cycle and the financial wellbeing of households (Ailawadi et al., 2001; Lamey et al., 2012).
Much of the extant work has suggested direct relationships between financial circumstances and store
brand proneness. The results that emerge from the current study do not support such a direct
21
relationship but indicate that household financial pressure causes a change in how households
evaluate time with implications for information acquisition, processing and purchasing behaviours.
Household financial pressure also causes changes in preferences that lead shoppers to become more
willing to forgo quality and seek out lower prices. In this manner, the importance of the mediating
effects of shoppers’ opportunity cost of time engaged in price search and changing preferences on
household financial pressure have been brought to the fore.
In combining Chaiken’s (1980) model of decision making and more recent developments
incorporating time pressure (Suri and Monroe, 2003) with the more orthodox marginal cost - marginal
benefit decision making as espoused by Stigler (1961), this research provides a more inclusive
perspective on decision making when both time and money are scarce. It draws attention to the
boundary where incentives are mediated by a lack of time and when further search is economically
irrational to the world of heuristics where decision making is simplified but frequently flawed. It is in
this space that store brands and the store brand hierarchy can serve as a uniquely effective heuristic.
By extending beyond financial matters, this research has uncovered the subtle processes
initiated by financial stress that cause shoppers to re-evaluate how they allocate their time and how
they deal with time scarcity. One of the most striking findings to emerge from this research is that at
an aggregate level, we saw that the opportunity cost of time in price search appeared to have little
effect on store brand proneness. Importantly, our analysis revealed that this was the outcome of two
distinct and counteracting effects. Richardson et al. (1994) and Baltas et al. (2010) argue that search
is a time consuming process involving evaluations of various forms of perceived risks and price
comparisons. These evaluations require effort and time and are cognitively demanding (Chernev,
2003; Garbarino and Edell, 1997). Traditional economic theory (Stigler, 1961) informs us that rational
shoppers would be expected to engage in price search until the marginal benefits coincide with the
marginal costs or, put in another way, as long as it’s worth it. This fitted neatly with the systematic
information processing strand of Chaiken’s (1980) dual information framework. However drawing on
the subsequent works of Kriglanski and Freund (1983) and Suri and Monros (2003) enabled us to
incorporate Chaiken’s heuristic strand as a response to time scarcity and to progress beyond this

22
limited economic view of behaviour. By considering both strands simultaneously we were able to
isolate the discriminating effect of time on search and how financially pressed shoppers facing high
time constraints had a propensity to use store brands as a money and time saving heuristic.
There is a tendency within much of the existing literature on store brands to adopt either a
store, category or tier specific perspective. The current work, by explicitly considering and
interpreting store brands as ubiquitous, familiar, subsitutable, transferable, and recognisable market
offerings that are commonly sold in the context of an established structured price-quality hierarchy
(which we have referred to as a store brandscape) points to their role as a time and money saving
heuristic with ever increasing applicability. We argue that the store brand hierarchy itself incorporates
features of the brand-quality, price-quality, representiveness, numerosity and availability heuristics; it
provides a price-quality rubric that acts as a guiding mechanism to rationalise and simplify shoppers’
decision making processes within and across categories and across stores. Of added benefit is that
while many frequently used heuristics expose shoppers to the dangers presented by asymmetric
information (Lindsey-Mullikin and Petty, 2011; Srivastava and Lurie, 2001; Urbany et al., 1988) the
store brand hierarchy is more reliable and protected from opportunistic behaviour on the part of the
retailer through market enforced disciplines including reputational effects and associated incentives,
and more market wide competitive forces.
In this context this research has extended our theoretical understanding of the tiered store
brand structure beyond recognition of this architecture as simply a marketing tool used by retailers.
While the tiers of the store brand hierarchy are purposefully aligned by retailers to compete with
rivals in the marketplace, we have built the case that this hierarchy also operates in the consumer’s
mind as a ‘buying tool’ to facilitate an easier shopping experience. As a buying tool, store brands
presented in the form of a generic hierarchy offer more to shoppers than the sum of the tiers. Evidence
of this is provided by Palmeira and Thomas (2011) regarding quality perceptions. The heuristic nature
of the hierarchy bolsters our understanding that the familiarity and ubiquity of a portfolio of store
brands (i.e. a brandscape) can help orient and simplify consumers’ experiences in the marketplace
(see also Rahman and Cherrier, 2010) and also helps redress some of the problems created by hyper
23
choice in a store setting (Mick et al., 2004).
Managerial Implications
First, retailers need to be aware that the effect of financial pressure on store brand proneness is
mediated through changing preferences, shoppers’ opportunity cost of time, and their propensity to
check prices. Our findings indicate that changing financial pressure influences customers’ willingness
to trade down and, as a consequence of price search, display a greater propensity to purchase store
brands. While this finding may be encouraging, retailers need to be aware that this trading down may
occur within the store brand hierarchy resulting in cannibalisation. Consequently, management may
need to consider their promotional activity within the store brand hierarchy to ensure that shoppers
continue to see their mid and premium tiers (where available) as delivering ongoing value.
Second, for a given level of financial pressure, our results suggest that the opportunity cost of
time will determine the extent to which shoppers engage in price search or employ the store brand
heuristic. Those with a low opportunity cost of time engage in more price search. For these
individuals, searching or hunting for lower prices may even prove to be an enjoyable aspect of the
shopping process (Collins et al, 2014); and if linked to store brand products, create an additional
source of hedonic value adding positively to the shopping experience (Babin et al, 1994) and the
retailer as a brand.
Third, the findings suggest that it is important that retailers concentrate on the formulation
and maintenance of a clear and simplistic brandscape that consumers can decode and use as a
heuristic. A heuristic, by definition is a time and effort saving device. In a consumer market
increasingly characterised by demands for convenience (in all its forms) any heuristic meets these
demands. Our findings suggest that a clear, generic, and commonly understood store brand hierarchy
provides such a heuristic. To this end, it suggests that retail management should step back from
individual tiers and develop an understanding of the value that the overall store brand hierarchy as an
entity creates. Recent trends in store brand evolution such the expansion of retailers’ role as brand
creators (Witham, 2013) risks diverting important attention away from the existing store brand
24
hierarchy. To facilitate shopping within their brand hierarchy, retailers might be advised to preserve
the clear price-quality rubric lest the hierarchy becomes confused with a proliferation of venture brand
type products (IGD, 2012). Furthermore by drawing retailers’ attention to the time saving function of
the store brand hierarchy, other means of providing time savings including siting instore and
merchandising techniques such as logical product adjacencies may be identified to increase the time
efficiency of shoppers’ product selection processes. This may be of particular importance in the case
of convenience or fill-in shopping missions where the opportunity cost of time may be particularly
high.
Fourth, there is the matter of loyalty. Earlier authors investigating the relationship between
store brand proneness and loyalty found the relationship to be linear. However there is evidence of
consumers generalising their shopping experience across retailers with store brands becoming
increasingly substitutable (Szymanowski and Gijsbrechts, 2012). Ongoing research is revealing the
relationship to be non-linear, nonmonotonic, reflecting an inverted U shape. Ailawadi and colleagues
(2008) explained this by arguing that highly store brand prone individuals are attracted more by
savings rather than a particular store brand and consequently shop for best prices across stores. This
we suggest may be related to systematic information processing where additional temporal costs are
incurred for monetary savings. González-Benito and Martos-Partal (2012) found a similar non-linear
relationship between store brand proneness and loyalty, but interestingly observed that the loyalty
relationship endured for longer in limited line discounters. We add to the interpretation of this work
and propose that shoppers’ choice of limited line discount stores, which tend to rely almost
exclusively on store brands, may be another aspect of time, money and cognitive economising and is
consistent with heuristic driven store brand buying behaviour that we have uncovered.
Finally, the challenge for each retailer is to determine the precise role of store brands and the
store brand hierarchy within their loyalty building strategies. The hierarchy represents a risk to
individual retailers to the extent that store brands as a heuristic have become part of a familiar
generalised market wide store brandscape that is substitutable and transferable. This suggests that
store brands may not possess the loyalty building qualities previously imagined yet, once the shopper
25
is in-store their heuristic qualities may serve to encourage the substitution of store brands for national
brands thereby improving the financial return to the retailer. The implication is that retailers may have
to focus their loyalty building efforts elsewhere.
Areas for Further Research
An important question that emerges from this work is the need to add further detail to the relationship
between store brand proneness and time pressure within the context of different shopping occasions
and missions. We have shown empirically that store brands act as a heuristic. We have argued that
this heuristic can be applied both within stores and across the broader store brandscape. However,
determining the extent to which the heuristic is actually applied in different shopping situations was
beyond the data available in this study.
The data underlying this research comes from the US market where the value and mid priced
components of the store brand hierarchy are well developed and the relationship between financial
pressure, price search and store brand proneness may be more established when compared with
Europe. It is clear that the ‘third’ or ‘premium’ tier of the store brandscape has evolved to a much
greater extent in Europe, particularly in the UK market, where quality concerns may be of relatively
greater importance when shopping the store brand hierarchy. This opens up the possibility that the
heuristic potential of the store brandscape may extend beyond time engaged in price search to include
economising on time and effort spent engaged in strategies to reduce perceived risk (Richardson et al
1994, Gonzales-Mires et al, 2006) and assessing product quality across brands. We believe that this
merits further investigation.
Finally, to progress and deepen this line of research, experimental design based work might be
considered to test the extent to which the heuristic is used as an alternative to evaluating the price-
quality bundles offered by the variety of national brands against their store brand equivalents and in
particular to see if the use of the heuristic varies according to product variety (assortment depth),
hierarchy complexity (number of tiers), and product involvement.
26
References
Aaker, D. (1996), Building Strong Brands, Simon and Schuster, New York.
Ailawadi, K. L., Neslin, S. A. and Gedenk, K. (2001), "Pursuing the Value-Conscious Consumer:
Store Brands Versus National Brand Promotions", Journal of Marketing, Vol. 65 No. 1, pp.
71-89.
Ailawadi, K.L., and Keller, K.L (2004) . “Understanding Retail Branding: Conceptual Insights and
Research Priorities” Journal of Retailing, 2004. Vol. 80, No 4, pp. 331-342.
Ailawadi, K. L., Pauwels, K. and Steenkamp, J.-B. E. M. (2008), "Private-Label Use and Store
Loyalty", Journal of Marketing, Vol. 72 No. 6, pp. 19-30.
Alba, J. W., Broniarczyk, S. M., Shimp, T. A. and Urbany, J. E. (1994), "The Influence of Prior
Beliefs, Frequency Cues, and Magnitude Cues on Consumers' Perceptions of Comparative
Price Data", Journal of Consumer Research, Vol. 21 No. 2, pp. 219-235.
Alba, J. W., Mela, C. F., Shimp, T. A. and Urbany, J. E. (1999), "The effect of discount frequency and
depth on consumer price judgments", Journal of Consumer Research, Vol. 26 No. 2, pp. 99-
114.
Arbuckle, J. (2012), "AMOS 20 User's Guide", Marketing Department, SPSS Incorporated.
Babin, B. J., Darden, W. R., & Griffin, M. 1994. Work and/or Fun: Measuring Hedonic and
Utilitarian Shopping Value. The Journal of Consumer Research, Vol. 20 No. 4. Pp. 644-656.
Baltas, G. and Argouslidis, P. C. (2007), "Consumer characteristics and demand for store brands",
International Journal of Retail & Distribution Management, Vol. 35 No. 5, pp. 328-341.
Baltas, G., Argouslidis, P. C. and Skarmeas, D. (2010), "The Role of Customer Factors in Multiple
Store Patronage: A Cost-Benefit Approach", Journal of Retailing, Vol. 86 No. 1, pp. 37-50.
Bryant, K. W. (1990), The Economic Organisation of the Household, Cambridge University Press,
Cambridge.
Burt, S. (2000), "The strategic role of retail brands in British grocery retailing", European Journal of
Marketing, Vol. 34 No. 8, pp. 875.
Burt, S. and Davies, K. (2010), "From the retail brand to the retail-er as a brand: themes and issues in
retail branding research", International Journal of Retail & Distribution Management, Vol.
38 No. 11/12, pp. 865 - 878.

27
Byrne, B. M. (2001), Structural Equation Modeling with Amos, Lawrence Erlbaum Associates, New
Jersey.
Byrne, B. M., Shavelson, R. J. and Muthén, B. (1989), "Testing for the equivalence of factor
covariance and mean structures: The issue of partial measurement invariance", Psychological
Bulletin, Vol. 105 No. 3, pp. 456-466.
Byrne, B. M. and van De Vijver, F. J. (2010), "Testing for measurement and structural equivalence in
large-scale cross-cultural studies: Addressing the issue of nonequivalence", International
Journal of Testing, Vol. 10 No. 2, pp. 107-132.
Chaiken, S. (1980), "Heuristic versus systematic information processing and the use of source versus
message cues in persuasion", Journal of Personality and Social Psychology, Vol. 39 No. 5,
pp. 752.
Chaiken, S., Liberman, A. and Eagly, A. (1989), "Heuristic and Systematic Information Processing
Within and Beyond the Persuasion Context.", in Uleman, J. and Bargh, J. A. (Eds.),
Unintended Thought,. Guilford Press., New York, pp. 212-252.
Chernev, A. (2003), "When more is less and less is more: The role of ideal point availability and
assortment in consumer choice", Journal of Consumer Research, Vol. 30 No. 2, pp. 170-183.
Collins, A., Kavanagh, E., Cronin, J., & George, R. (2014). Money, mavens, time, and price search:
modelling the joint creation of utilitarian and hedonic value in grocery shopping. Journal of
Marketing Management, Vol. 30 No. 7-8, pp. 719-746. 10.1080/0267257X.2013.839572
Collins, A., Kavanagh, E. and George, R. (2012), "Store deal prone shoppers: motivators and
implications for the supply chain in a distressed market", The International Review of Retail,
Distribution and Consumer Research, Vol. 22 No. 1, pp. 83-100.
Collins, A. B. S. L. (2003), "Market sanctions, monitoring and vertical coordination within retailer-
manufacturer relationships: The case of retail brand suppliers", European Journal of
Marketing, Vol. 37 No. 5/6, pp. 668-689.
Cuneo, A., Lopez, P. and Yagüe, M. J. (2012), "Measuring private labels brand equity: a consumer
perspective", European Journal of Marketing, Vol. 46 No. 7/8, pp. 952-964.
Davidov, E., Meuleman, B., Cieciuch, J., Schmidt, P. and Billiet, J. (2014), "Measurement
Equivalence in Cross-National Research", Annual Review of Sociology, Vol. 40 No. X, pp.xx.
Dawes, J. (2013), "Reasons for variation in SCR for private label brands", European Journal of
Marketing, Vol. 47 No. 11/12, pp. 1804-1824.
Deleersnyder, B. and Koll, O. (2012), "Destination discount: a sensible road for national brands?",
European Journal of Marketing, Vol. 46 No. 9, pp. 1150-1170.
DelVecchio, D., Henard, D. H. and Freling, T. H. (2006), "The effect of sales promotion on post-
promotion brand preference: A meta-analysis", Journal of Retailing, Vol. 82 No. 3, pp. 203-
213.

28
DeVoe, S. E. and Pfeffer, J. (2011), "Time is tight: how higher economic value of time increases
feelings of time pressure", Journal of Applied Psychology, Vol. 96 No. 4, pp. 665.
Dodds, W. B., Monroe, K. B. and Grewal, D. (1991), "Effects of Price, Brand, and Store Information
on Buyers' Product Evaluations", Journal of Marketing Research (JMR), Vol. 28 No. 3, pp.
307-319.
Erdem, T., Ying, Z. and Valenzuela, A. (2004), "Performance of Store Brands: A Cross-Country
Analysis of Consumer Store-Brand Preferences, Perceptions, and Risk", Journal of Marketing
Research (JMR), Vol. 41 No. 1, pp. 86-100.
Fornell, C. and Larcker, D. F. (1981), "Evaluating Structural Equation Models with Unobservable
Variables and Measurement Error", Journal of Marketing Research (JMR), Vol. 18 No. 1, pp.
39-50.
Garbarino, E. C. and Edell, J. A. (1997), "Cognitive Effort, Affect, and Choice", Journal of Consumer
Research, Vol. 24 No. 2, pp. 147-158.
Gauri, D. K., Sudhir, K. and Talukdar, D. (2008), "The Temporal and Spatial Dimensions of Price
Search: Insights from Matching Household Survey and Purchase Data", Journal of Marketing
Research (JMR), Vol. 45 No. 2, pp. 226-240.
Geyskens, I., Gielens, K. and Gijsbrechts, E. (2010), "Proliferating Private-Label Portfolios: How
Introducing Economy and Premium Private Labels Influences Brand Choice", Journal of
Marketing Research (JMR), Vol. 47 No. 5, pp. 791-807.
González-Benito, Ó. and Martos-Partal, M. (2012), "Role of Retailer Positioning and Product
Category on the Relationship Between Store Brand Consumption and Store Loyalty", Journal
of Retailing, Vol. 88 No. 2, pp. 236-249.
González Mieres, C., Díaz Martín, AM., and Trespalacios Gutiérrez, J.A., (2006),"Antecedents of the
difference in perceived risk between store brands and national brands", European Journal of
Marketing, Vol. 40 Iss 1/2 pp. 61 - 82
Hair, J. F., Anderson, R. E., Thatham, R. L. and Black, W. C. (1995), Multivariate Data Analysis with
Readings, Prentice Hall, New Jersey.
Hoch, S. J. and Banerji, S. (1993), "When Do Private Labels Succeed?", Sloan Management Review,
Vol. 34 No. 4, pp. 57-67.
Hu, L. and Bentler, P. M. (1999), " Cutoff criteria for fit indexes in covariance structure analysis:
Conventional criteria versus new alternatives", Structural Equation Modeling, Vol. 6 No. 1,
pp. 1-55.
IGD. (2012), Private label Update 2012, How traditional structures are evolving. In Retail Analysis,
Institute of Grocery Distribution, Watford.
Kardes, F. R., Posavac, S. S. and Cronley, M. L. (2004), "Consumer inference: A review of processes,
bases, and judgment contexts", Journal of Consumer Psychology, Vol. 14 No. 3, pp. 230-256.

29
Kirmani, A. and Wright, P. (1989), "Money talks: Perceived advertising expense and expected
product quality", Journal of Consumer Research, pp. 344-353.
Kruglanski, A. W. and Freund, T. (1983), "The freezing and unfreezing of lay-inferences: Effects on
impressional primacy, ethnic stereotyping, and numerical anchoring", Journal of
Experimental Social Psychology, Vol. 19 No. 5, pp. 448-468.
Lamey, L., Deleersnyder, B., Steenkamp, J.-B. E. M. and Dekimpe, M. G. (2012), "The Effect of
Business-Cycle Fluctuations on Private-Label Share: What Has Marketing Conduct Got to Do
with It??", Journal of Marketing, Vol. 76 No. 1, pp. 1-19.
Lichtenstein, D. R., Netemeyer, R. G. and Burton, S. (1990), "Distinguishing Coupon Proneness From
Value Consciousness: An Acquisition-Transaction Utility Theory Perspective", Journal of
Marketing, Vol. 54 No. (July), pp. 54-67.
Lichtenstein, D. R., Ridgway, N. M. and Netemeyer, R. G. (1993), "Price Perceptions and Consumer
Shopping Behavior: A Field Study", Journal of Marketing Research (JMR), Vol. 30 No. 2,
pp. 234-245.
Lindsey-Mullikin, J. and Petty, R. D. "Marketing tactics discouraging price search: Deception and
competition", Journal of Business Research, Vol. 64 No. 1, pp. 67-73.
Mandrik, C. A. (1996), "Consumer Heuristics: The Tradeoff Between Processing Effort and Value in
Brand Choice", Advances in Consumer Research, Vol. 23 No. 1.
Mick, D. G., Broniarczyk, S. M. and Haidt, J. (2004), "Choose, Choose, Choose, Choose, Choose,
Choose, Choose: Emerging and Prospective Research on the Deleterious Effects of Living in
Consumer Hyperchoice", Journal of Business Ethics, Vol. 52 No. 2, pp. 207-211.
Mitchell, V.-W. and McGoldrick, P. J. (1996), "Consumers' risk-reduction strategies: a review and
synthesis", International Review of Retail, Distribution & Consumer Research, Vol. 6 No. 1,
pp. 1.
Mitra, A. (1995), "Price cue utilization in product evaluations: the moderating role of motivation and
attribute information", Journal of Business Research, Vol. 33 No. 3, pp. 187-195.
Morris, D. (1979), "The strategy of own brands", European Journal of Marketing, Vol. 13 No. 2, pp.
59-78.
Nowlis, S. M. (1995), "The effect of time pressure on the choice between brands that differ in quality,
price, and product features", Marketing Letters, Vol. 6 No. 4, pp. 287-295.
Nielsen (2011) Private Brands U.S. Outlook: Flash in the Pan or the Real Deal? Available at
http://www.nielsen.com/content/dam/corporate/campaigns/select-summit/Private-Label-US-
White-Paper-Dec-2011.pdf. Date accessed 15-10-2014.
Nunally, J. C. (1981), Psychometric Theory, McGraw Hill., New Delhi.
Ofir, C., Raghubir, P., Brosh, G., Monroe, K. B. and Heiman, A. (2008), "Memory-Based Store Price
Judgments: The Role of Knowledge and Shopping Experience", Journal of Retailing, Vol. 84
No. 4, pp. 414-423.

30
Palmeira, M. M. and Thomas, D. (2011), "Two-Tier Store Brands: The Benefic Impact of a Value
Brand on Perceptions of a Premium Brand", Journal of Retailing, Vol. 87 No. 4, pp. 540-548.
PLMA (Private Label Manufacturer's Association) (2011), “PLMA's 2011 Private Label Trade Show-
Store Brand Facts”, available at http://plma.com/storeBrands/facts11.html (accessed 10th
October 2014)
Podsakoff, P.M., MacKenzie, S.B., Lee, J.-Y. and N.P, Podsakoff, N.P. (2003). "Common method
biases in behavioral research: A critical review of the literature and recommended remedies"
Journal of Applied Psychology, Vol.88 No.5, pp. 879–903.
Putrevu, S. and Ratchford, B. T. (1997), "A Model of Search Behavior with an Application to Grocery
Shopping", Journal of Retailing, Vol. 73 No. 4, pp. 463-486.
Rahman, K. and Cherrier, H. (2010), "Galloping through the Global Brandscape: Consumers in a
Branded Reality", Advances in Consumer Research, Vol. 37, pp. 1.
Richardson, P., Jain, A. and Dick, A. (1996), "Household Store Brand Proneness: A Framework",
Journal of Retailing, Vol. 72 No. 2, pp. 159-185.
Richardson, P. S., Dick, A. S. and Jain, A. K. (1994), "Extrinsic and intrinsic cue effects on
perceptions of store brand quality", Journal of Marketing, Vol. 58 No. 4, pp. 28.
Rider, L. (2010), "The future of US Store Brands", Food Technology Magazine, available at:
http://www.nielsen.com/content/dam/corporate/us/en/newswire/uploads/2010/03/0310feat_pri
vatelabel.pdf (Accessed 10th October 2014).
Scitovsky, T. (1945), "Some Consequences of the Habit of Judging Quality by Price", Review of
Economic Studies, Vol. 12 No. 32, pp. 6.
Sherry, J. (1998), "The Soul of the Company Store: Nike Town Chicago and the Emplaced
Brandscape", in Sherry, J. F. (Ed.), Servicescapes: The Concept of Place in Contemporary
Markets. McGraw-Hill, New York, pp. 109-146.
Simpson, P. M., Siguaw, J. A. and Cadogan, J. W. (2008), "Understanding the consumer propensity to
observe", European Journal of Marketing, Vol. 42 No. 1/2, pp. 196-221.
Srivastava, J. and Lurie, N. (2001), "A Consumer Perspective on Price-Matching Refund Policies:
Effect on Price Perceptions and Search Behavior", Journal of Consumer Research, Vol. 28
No. 2, pp. 296-307.
Steenkamp, J.-B. E. and Baumgartner, H. (1998), "Assessing measurement invariance in cross-
national consumer research", Journal of consumer research, Vol. 25 No. 1, pp. 78-107.
Stigler, G. J. (1961), " The Economics of Information ", The Journal of Political Economy, Vol. 69
No. 3, pp. 213–225.
Suri, R. and Monroe, K. B. (2003), "The effects of time constraints on consumers’ judgments of
prices and products", Journal of consumer research, Vol. 30 No. 1, pp. 92-104.
31
Szymanowski, M. and Gijsbrechts, E. (2012), "Consumption-Based Cross-Brand Learning: Are
Private Labels Really Private??", Journal of Marketing Research (JMR), Vol. 49 No. 2, pp.
231-246.
Tversky, A. and Kahneman, D. (1982), "Judgement under uncertainty: Heuristics and biases", in
Kahneman, D., Slovic, P. and Tversky, A. (Eds.), Judgement under uncertainty: Heuristics
and biases. Cambridge University press, Cambridge:, pp. 3-20.
Urbany, J. E., Bearden, W. O. and Weilbaker, D. C. (1988), "The Effect of Plausible and Exaggerated
Reference Prices on Consumer Perceptions and Price Search", Journal of Consumer
Research, Vol. 15 No. 1, pp. 95-110.
Urbany, J. E., Dickson, P. A. and Kalapurakal, R. (1996), "Price Search in the Retail Grocery
Market", Journal of Marketing, Vol. 60 No. 2, pp. 91-104.
Vandenberg, R. J. and Lance, C. E. (2000), "A review and synthesis of the measurement invariance
literature: Suggestions, practices, and recommendations for organizational research",
Organizational Research Methods, Vol. 3 No. 1, pp. 4-70.
Völckner, F. and Hofmann, J. (2007), "The price-perceived quality relationship: A meta-analytic
review and assessment of its determinants", Marketing Letters, Vol. 18 No. 3, pp. 181-196.
Witham, K. (2013), "Top Private Label Trends for 2014", in Retail Analysis. Institiute of Grocery
Distribution, Watford.

32
Tables
Table 1. Locations of Primary Grocery Shop (N=535)
Retailer % of Sample Retailer % of Sample
Shoprite 29.4 Target 2.0
Giant 17.8 BJ s 1.3
Acme 14.4 Costco 1.3
Wegmans 5.0 Aldi 1.1
Genuardis 4.6 Sams 0.9
Walmart 3.5 The Fresh Grocer 0.7
Pathmark 3.1 Save-a-Lot 0.6
SuperFresh 3.1 IGA 0.2
Trader Joe's 3.0 Others 5.4
Whole Foods 2.4 Total 100.0

33
Table 2. Construct Loadings
Constructs Standardised Factor Loading
Opportunity Cost of Time Searching (OCTS) (α = .81) ( Lichtenstein et al., 1993)
Opc1 The time it takes searching for lower prices is not worth it .726 a
Opc2 The money saved on searching for cheaper food is not worth it .817***
Opc3 Looking for lower prices takes too much time .750***
Store Brand Proneness (SBP) (α = .83) (Ailawadi et al., 2001)
SB1 I buy store brands .835 a
SB2 I look for store brands when I go shopping .747***
SB3 My shopping cart contains store brands for several products .788***
Willingness to Trade-Down (WTD) (α = .71) Spearman-Brown stepped-up reliability coefficient
=.711 (Ailawadi et al., 2001)
Pqu1 I’d prefer better prices rather than quality .600 a
Pqu2 I’d sacrifice some quality for lower prices .919***
Household Financial Pressure (HFP) (α = .88) (Urbany et al., 1996)
HF1 Money is tight so I have to reduce my bills .820 a
HF2 Household finances are such that I am trying to save on my bills .862***
HF3 My household budget is usually tight .852***
In-Store Price Search (ISPS) (α =.78) (Putrevu & Ratchford, 1997)
Pcom1 I compare prices on the shelf before deciding which product to buy .706 a
Pcom2 Before buying a product I usually check its price .723***
Pcom3 I compare prices between brands .808***
Chi-square (χ2) = 131.526, d.f. =67, p = .000, GFI=.97, AGFI=.96,
CFI = .98, TLI = .97, RMSEA= .042
α = Cronbach’s Alpha; a critical value not estimated as loading set to 1. *** Significant at the .001
level.

34
Table 3. Correlation Coefficients (upper), Average Variance Extracted (diagonal) and
Squared Correlations R2 (Lower)
HFP ISPS OCTS WTD SBP
Household Financial pressure 0.713 0.410 -0.271 0.300 0.212
In Store Price Search 0.168 0.558 -0.491 0.304 0.506
Opportunity Cost of Time
Searching for lower Prices 0.073 0.241 0.586 -0.090 -0.101
Willingness to Trade Down 0.090 0.092 0.008 0.600 0.227
Store Brand Proneness 0.045 0.256 0.010 0.052 0.625

35
Table 4. Results for H1-H8
Hyp.
sign
Std
Path
CR Outcome
H1 Household Financial Pressure In
Store Price Search
+ .242*** 4.66 Supported
H2 Household Financial Pressure
Willingness to Trade Down
+ .289*** 4.13 Supported
H3 Willingness to Trade Down In Store
Price Search
+ .200*** 4.17 Supported
H4 Household Financial Pressure Store
Brand Proneness
+ .021 .406 Unsupported
H5 In Store Price Search Store Brand
Proneness
+ .600*** 8.36 Supported
H6 Household Financial Pressure
Opportunity Cost of Time engaged in
Price Search
- -.271*** -5.24 Supported
H7 Opportunity Cost of Time engaged in
Price Search In Store Price Search
- -.410*** -7.41 Supported
H8 Opportunity Cost of Time engaged in
Price Search Store Brand Proneness
+ .202*** 3.37 Supported
Supported
Chi-square (χ2) = 132.99 d.f. =69, p = .000 GFI=.97, AGFI=.97, CFI = .98, TLI =.97,
RMSEA= .042
*** significant at the 0.001 level.

36
Table 5 Total, Direct, and Indirect (Standardized) Effects
Total
Effect
Direct
Effect
Indirect
Effect
HFP → WTD .289 .289 N/A
HFP → SBP .213 .021 .192
HFP → ISPS .411 .242 .169
HFP WTD .289 .289 N/A
HFP → OCTS -.271 -.271 N/A
WTD ISPS .200 .200 N/A
WTD → SBP .120 N/A .120
ISPS → SBP .600 .600 N/A
OCTS → SBP -.044 .202 -.246
OCTS → ISPS -410 -410 N/A
37
Table 6. Latent Means by Cluster
Cluster N Financial
Pressure
Standard
Error
Opportunity Cost
of Time
Standard Error
1 137 4.2460 .03281 .7936 .03273
2 127 3.2184 .02629 1.0154 .02631
3 202 3.5040 .04040 1.9749 .02969
4 69 2.0202 .04374 1.6648 .09036
Total 535 3.4348 .03457 1.4046 .02934
38
Table 7. Structural Paths H9-H10
Chi-
square
(χ2)
d.f P.value Chi-square
(χ2)
for 1 d.f
Unconstrained Model 44.924 58 .896
Constrained Model 1 (Factor Loadings fixed,
Paths freely estimated))
53.115 64 .832 1.365
Constrained Model 2 (Factor Loadings and Paths
fixed)
84.126 70 .120 5.16 *
Semi Constrained Model 1
OCTSSBP (freely estimated)
78.68 69 .199 5.446*
Semi Constrained Model 2
OCTSSBP and OCTSISPS (freely estimated)
69.68 68 .421 9.00**
Semi Constrained Model 3
OCTSSBP, OCTSISPS and ISPSSBP(freely
estimated)
69.64 67 .389 0.04
* Significant at =.05 ** Significant at =.01
Unconstrained Model: Chi-square (χ2) = 44.924, d.f. =58, p = .896, GFI=.974 AGFI=.951 CFI = 1.00, , RMSEA= .000 AIC=148.924
Constrained Model1 Chi-square (χ2) = 53.115, d.f. =64, p = .832, GFI=.969 AGFI=.947 CFI = 1.00 , RMSEA= .000 AIC=145.115
Constrained Model 2 Chi-square (χ2) = 84.126, d.f. =70, p = .12, GFI=.951 AGFI=.921 CFI = .981 , RMSEA= .024 AIC=164.13
Semi Constrained Model 1 Chi-square (χ2) = 78.68, d.f. =69, p = .199, GFI=.955 AGFI=.928 CFI = .987 , RMSEA= .02 AIC=160.68
Semi Constrained Model 2 Chi-square (χ2) = 69.68 d.f. =68, p = .421, GFI=.960 AGFI=.935 CFI = 1.00, RMSEA= 1.000 AIC=153.68
Semi Constrained Model 3 Chi-square (χ2) = 69.64 d.f. =67, p = .389, GFI=.96 AGFI=.935 CFI = .996, RMSEA= .011 AIC=155.64
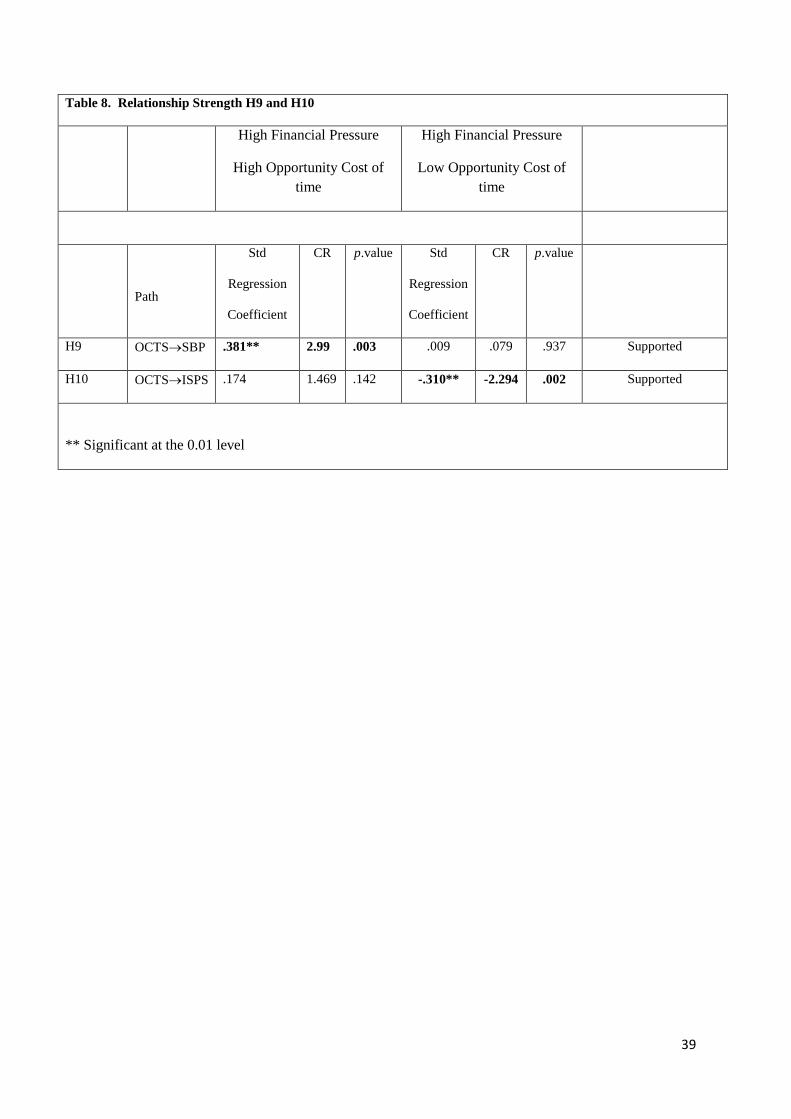
39
Table 8. Relationship Strength H9 and H10
High Financial Pressure
High Opportunity Cost of
time
High Financial Pressure
Low Opportunity Cost of
time
Path
Std
Regression
Coefficient
CR p.value Std
Regression
Coefficient
CR
p.value
H9 OCTSSBP .381** 2.99 .003 .009 .079 .937 Supported
H10 OCTSISPS .174 1.469 .142 -.310** -2.294 .002 Supported
** Significant at the 0.01 level
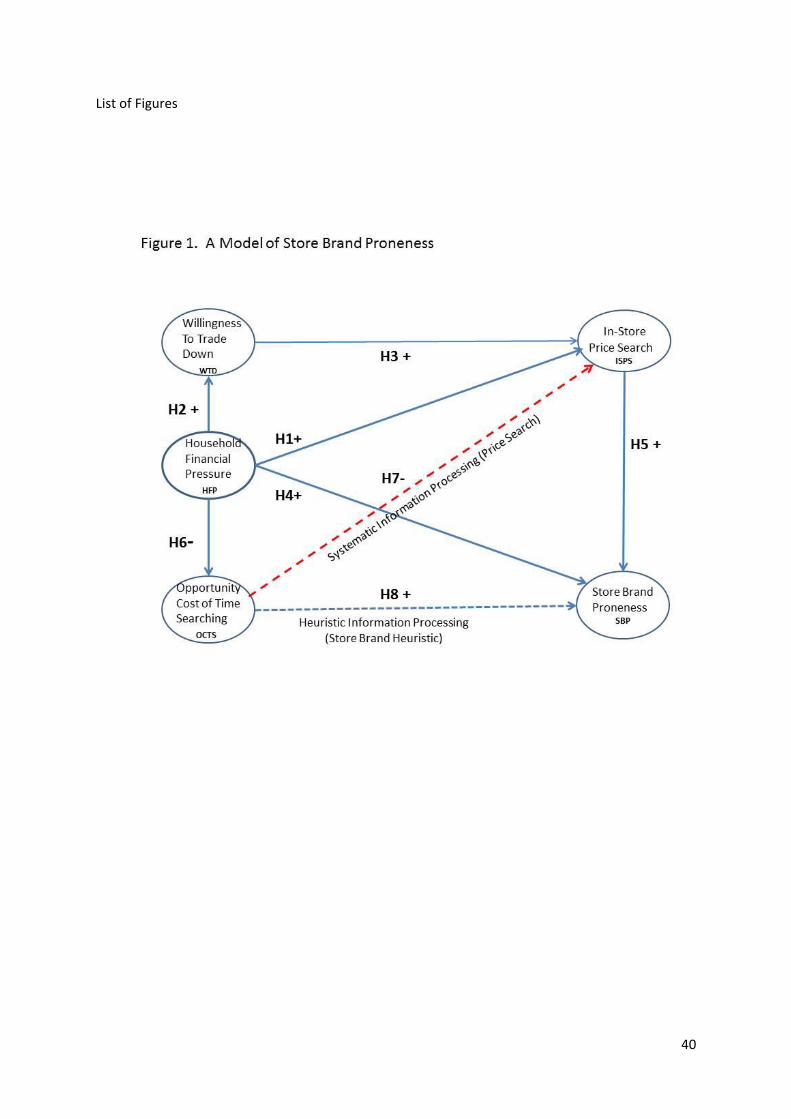
40
List of Figures
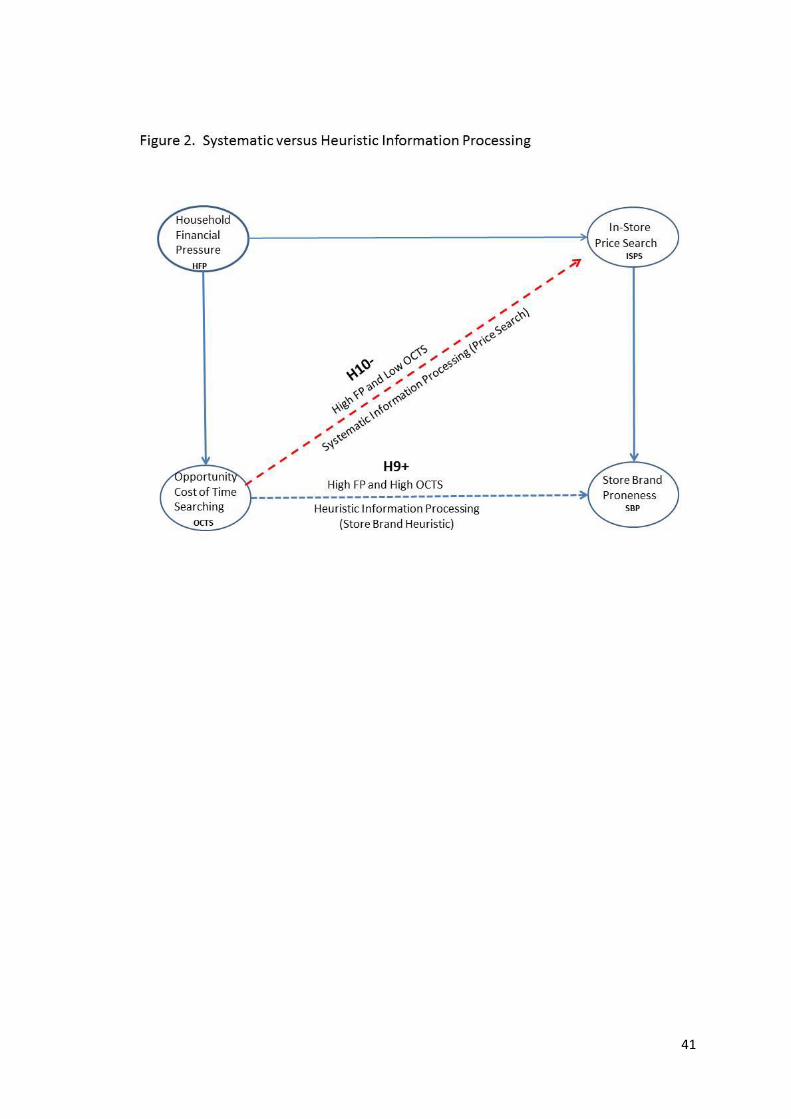
41