name brands versus store brands: a look into …
TRANSCRIPT

NAME BRANDS VERSUS STORE BRANDS: A LOOK INTO CONSUMER
PERCEPTIONS OF STORE BRANDS
A THESIS
Presented to
The Faculty of the Department of Economics and Business
The Colorado College
In Partial Fulfillment of the Requirements for the Degree
Bachelor of Arts
By
Wyatt Babb
May 2012

NAME BRANDS VERSUS STORE BRANDS: A LOOK INTO CONSUMER
PERCEPTIONS OF STORE BRANDS
Wyatt Babb
May 2012
Economics
Abstract
Store brands have been gaining popularity and market share over the past century
and nearly all large retailers have their own private label brands. The central focus of this
study was to explore consumer perceptions towards these brands and the factors that
influence these perceptions. We focused on brand name, packaging and store reputation.
A taste test experiment was designed to test only these factors and revile consumer’s true
perceptions. The tests were conducted but not enough data was collected to make
meaningful conclusions. Although our results were not conclusive we found some
interesting patterns and behaviors.
KEYWORDS: (Store Brand, National Brand, Generic, Branding, Taste Test)

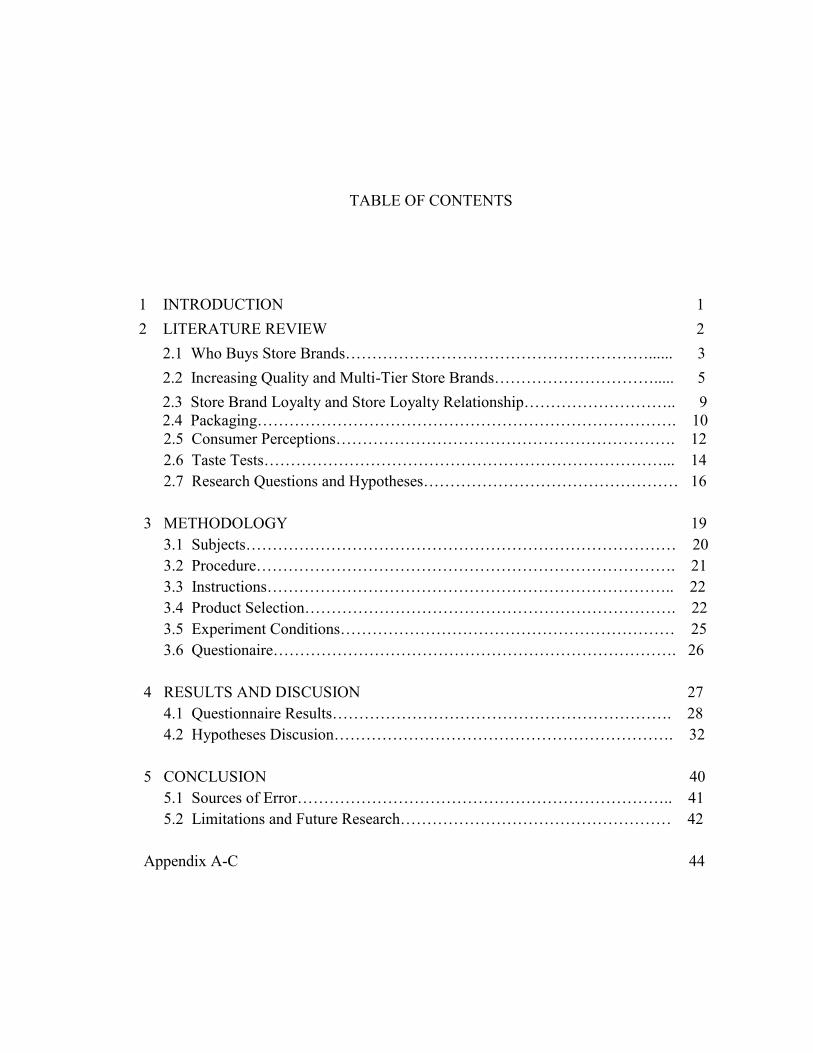
TABLE OF CONTENTS
1 INTRODUCTION 1
2 LITERATURE REVIEW 2
2.1 Who Buys Store Brands…………………………………………………...... 3
2.2 Increasing Quality and Multi-Tier Store Brands…………………………..... 5
2.3 Store Brand Loyalty and Store Loyalty Relationship……………………….. 9
2.4 Packaging……………………………………………………………………. 10
2.5 Consumer Perceptions………………………………………………………. 12
2.6 Taste Tests…………………………………………………………………... 14
2.7 Research Questions and Hypotheses………………………………………… 16
3 METHODOLOGY 19
3.1 Subjects……………………………………………………………………… 20
3.2 Procedure……………………………………………………………………. 21
3.3 Instructions………………………………………………………………….. 22
3.4 Product Selection……………………………………………………………. 22
3.5 Experiment Conditions……………………………………………………… 25
3.6 Questionaire…………………………………………………………………. 26
4 RESULTS AND DISCUSION 27
4.1 Questionnaire Results………………………………………………………. 28
4.2 Hypotheses Discusion………………………………………………………. 32
5 CONCLUSION 40
5.1 Sources of Error…………………………………………………………….. 41
5.2 Limitations and Future Research…………………………………………… 42
Appendix A-C 44

LIST OF TABLES
3.1 Taste Test Groups………………….. ………. ……………………………... 21
4.1 Participant Groups…………………………….…………………………….. 27
4.2 Taste Test Results………... ………………………………………………… 28
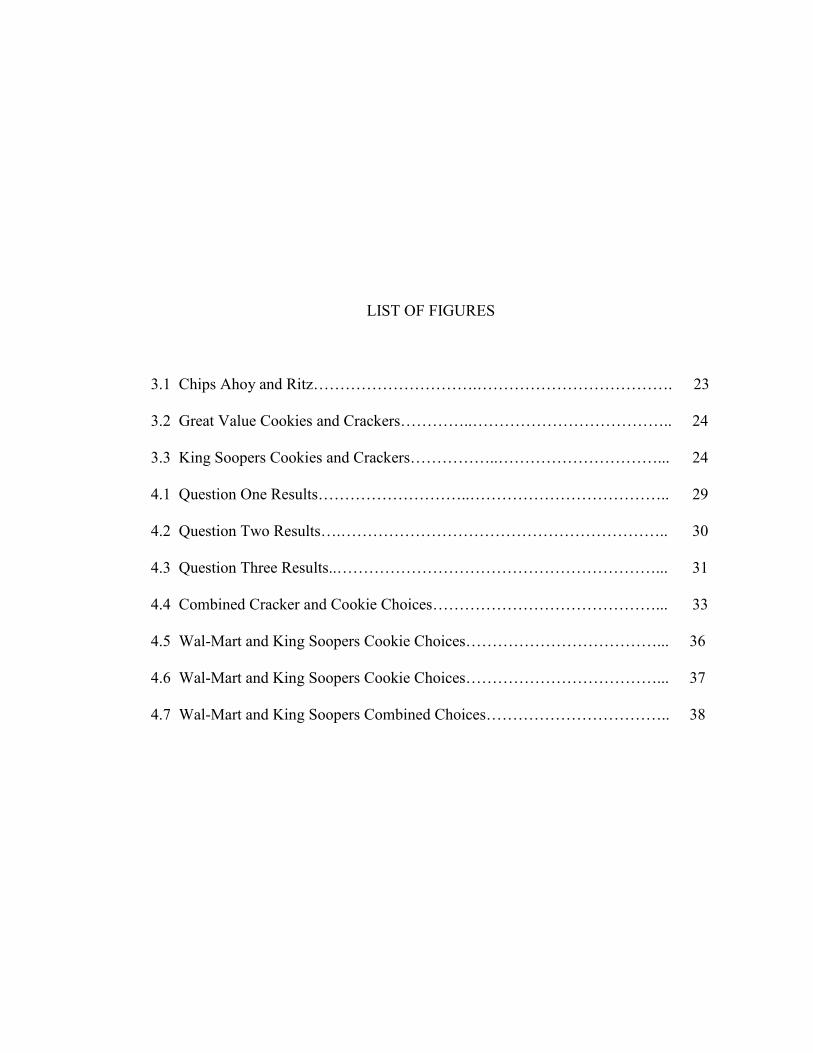
LIST OF FIGURES
3.1 Chips Ahoy and Ritz………………………….………………………………. 23
3.2 Great Value Cookies and Crackers…………..……………………………….. 24
3.3 King Soopers Cookies and Crackers……………..…………………………... 24
4.1 Question One Results………………………..……………………………….. 29
4.2 Question Two Results….…………………………………………………….. 30
4.3 Question Three Results..……………………………………………………... 31
4.4 Combined Cracker and Cookie Choices……………………………………...
4.5 Wal-Mart and King Soopers Cookie Choices………………………………...
4.6 Wal-Mart and King Soopers Cookie Choices………………………………...
4.7 Wal-Mart and King Soopers Combined Choices……………………………..
33
36
37
38
1
CHAPTER I
INTRODUCTION
Everyone at some point in their lives has been in the grocery store and seen store
brand products. All of the big retailers have them in just about every product category.
Wal-Mart has their Great Value line, and Safeway has its Safeway Select label. Costco
has Kirkland Signature and Target has Market Pantry. These products fill the shelves
right next to their brand name counter parts tempting every customer that walks by.
They come in all different types and styles but they almost all have one thing in
common, low prices. Every consumer has seen these goods in the market place but
what do they think of them? Why do they think of them that way? Do they see them as
cheap low quality goods or a great deal? Why would they pay more for a name brand
good? Do they by name brands in some product categories and store brands in others?
This study and many others like it take a deep look at this very subject. This study
focuses on the perceptions consumers have of these store brand goods and what drives
these perceptions.

2
CHAPTER II
LITERATURE REVIEW
Store brands have been a growing force in the retail world over the past century
offering products in a wide variety of categories ranging from marshmallows to facial
tissues. Most big supermarkets and discount stores have their own store brands and they
are typically offered for 15 to 30 percent cheaper than brand names. Because there are
no marketing costs and lower supply costs for store brands, they can be sold at lower
prices than name brands.1 According to the Private Label Manufacturers Association,
store brands have grown in sales by 40 percent annually in supermarkets over the past
decade and now account for almost one out of every four items sold in US supermarkets
and discount stores.2 In 2010 store brand overall sales were around $100 billion. Store
brands have become a large part of retail and many studies have been conducted on the
subject. These studies have focused on many different aspects of store brands from the
consumer, retailer and manufactures points of view.
11
George Baltas, "Determinants of Store Brand Choice: A Behavioral Analysis," Journal of Product &
Brand Management 6, no. 5 (05 1997): 315.
2 "Private Lable Manufacturers Association," [cited 2011]. Available from http://plma.com/.

3
Who Buys Store Brands?
When store brands first hit the market and started becoming popular, a lot of
studies focused on the characteristics of the people who bought store brand goods.
These studies explained the demographics and the behavioral characteristics of the
consumers that are buying store brands and generic products. Demographics are
important pieces of information when marketing a product. It is good for retailers and
manufacturers to know who is buying what so that they can make their products more
appealing and capture more of the market. The studies concerning store brands would
be valuable information for both retailers with store brands and brand names. The
behavioral characteristics of consumers would also be important information that
retailers and manufactures could use to better understand how to appeal to their
customers.
Early studies of store brands and generics focused on demographics. These
studies found characteristics that store brand purchasers were more likely to have than
non store brand purchasers. Previous research generally agreed that store brand buyers
tend to be married, shopping for a lager household, higher educated, and paying a
higher grocery bill.3 The research disagreed on age and income. Granzin argues that
the savings that buying store brands would appeal more to lower income and younger
consumers who out of necessity have to stay on budgets. These were interesting results
and opened up new areas for research around store brands and generic goods. By better
3 Kent L. Granzin, "An Investigation of the Market for Generic Products," Journal of Retailing 57, no. 4
(Winter81 1981): 39.

4
understanding the consumers who buy store brand goods, researchers could look at the
way these consumers make the choice to buy or not to buy store brand goods.
Further research focused on the behavioral characteristics of store brand
consumers. These studies aimed to explain why buyers of store brands and generics act
the way they do. It was found that store brand goods appeal more to consumers who are
open to new products and are more willing to take a chance to find savings without
sacrificing much in the way of quality or taste.4 It was hypothesized that changing to a
new product (especially a store brand) carried a risk of being unsatisfied so to avoid risk
shoppers continue to buy the goods they normally buy. This is referred to as brand
inertia. When consumers are satisfied with the product they purchased on their previous
shopping trip they are reluctant to switch to a new product.5 The result of this can be
that consumers become habitual buyers of certain products. Because of previous
satisfaction with the product consumers will keep purchasing it. This explains why
some consumers are reluctant to try store brands. Another interesting point that has
come up in the research is that consumers are more prone to buy store brands during
economic down turns but they keep buying them after the down turn is over.6 This
suggests that brand inertia can work for both brand names and store brands. This
research shows that there are behavioral characteristics that make certain consumers
more prone to buy store brands and that there is a perceived risk of un-satisfaction when
4 Ibid
5 Marcel Corstjens and Rajiv Lal, "Building Store Loyalty through Store Brands," Journal of Marketing
Research (JMR) 37, no. 3 (08 2000): 281-291. 6 Mercedes Martos-Partal and Óscar González-Benito, "Store Brand and Store Loyalty: The Moderating
Role of Store Brand Positioning," Marketing Letters 22, no. 3 (09 2011): 297-313.

5
switching from one product to another. Researchers have taken this into account and
have done further studies to determine what consumers take into account when
purchasing goods.
This early research revealed a very important concept that plays a huge role in
store brand research and the practices of retailers. The idea is that of a quality-price
trade off. Many of the articles about store brands and generics think of it as a ratio. If
the product has a favorable price-to-quality ratio it then becomes a bargain for the
consumer and they are more likely to purchase it.7 This ratio equates to a perceived
value of the good. The consumer will purchase the good with the higher perceived
value. Price and quality have been a main focus of a lot of the literature concerning
store brand and generic products for obvious reasons. Price and quality are the factors
that determine a products perceived value and therefore if a consumer will buy the
product. Retailers have taken this research to heart and have made changes to their
store brand offerings.
Increasing Quality and Multi-Tier Store Brands
In recent years, the quality of store brands has been climbing to levels as good
as, if not better than that of national brand products. Retailers have increased the value
of their store brand products. This helps explain the tremendous sales growth store
brands have experienced in recent years. Along with broadly increasing quality
retailers have adopted multi-tier store brand offerings with product lines to appeal to all
7Granzin, An Investigation of the Market for Generic Products, 39.

6
customers. Many articles have talked about these trends and how effective they have
been.
In today’s world, store brands are equal and sometimes even better than brand
name goods in quality and taste. This did not use to be the case. In 1981, Granzin
explained in his study how generic and store brand, were more often than not poor
quality goods.8 Retailers have stepped up their game to offer better quality store brand
goods and in turn better value to their customers. According to Consumer Reports in
2005, “buying store brands can not only get you high-quality products, it can save you
hundreds, sometimes thousands, of dollars a year.”9 In 2010, Consumer Reports stated,
“In blind tests, our trained tasters evaluated twenty one pairs of staple foods. Brand
names won seven times; store brands, three. There were eleven ties. Prices are based on
an average of what we found. The store brands cost seven to sixty percent less.”10
Many of the store brand goods are as good as brand names and in some cases they did
better. The fact that many of these products are of similar quality to brand names, and
are cheaper to purchase makes many of them a better value for consumers. In many
cases, store brand products are produced by the same manufacturers that produce brand
name products. That same Consumer Report from 2005 found, “Of the thousands of
manufacturers of store brands, many are national-brand companies.” Manufactures
included Alcoa, Hormel, Del Monte, and solo among others. Baltas argues, “Most own
labels aren’t actually produced by the retailer. Manufacturers may elect to produce
8 Ibid.
9 "Battle of the Brands," Consumer Reports 70, no. 8 (08 2005): 12-15.
10
"Store Brands Vs. Name Brands," Consumer Reports 75, no. 10 (10 2010): 16-21

7
own-label products for retailers in order to achieve scale economies in production and
distribution, utilization of excess capacity, sales increase without marketing costs, as
well as price discrimination.”11
There are a lot of incentives for manufactures to
produce store brand goods. This explains why so many do just that. In most cases
these goods are not just the same product with a different label but they are very similar.
Store brands have become the major competitors boasting similar and sometimes better
quality than name brands and consumers are beginning to take notice. “In many
instances, shoppers no longer can distinguish between national and private label
brands.”12
The Private Label Manufacturers Association also shared, “In a 2010 GfK
Group study half of the respondents said that they had recently switched to the store’s
brand in categories where they had previously only bought a national brand. Nearly all
who did switch were pleased with their decision: nine in ten compared store brands
“favorably” to their national brand choice.” These increases in quality across store
brands are starting to become common knowledge among consumers and may help in
explaining the growing popularity of store brands.
Retailers are encouraging more store brand purchases by offering several lines
of store brand products so they can appeal to a larger share of the market. These
product offerings are designed to meet the differing price and quality demands of
consumers. Martos-Partal and Mercedes explain four general store brand types in their
paper: generics, copycats, premium, and value innovators.13
Generic store brands offer
11
Baltas, Determinants of Store Brand Choice: A Behavioral Analysis, 315.
12
Private Lable Manufacturers Association
13
Martos-Partal and González-Benito, Store Brand and Store Loyalty: The Moderating Role of Store
Brand Positioning, 297-313.
8
the cheapest product in a given category and focus solely on offering the lowest cost
alternative. Copycat store brands do just as the name suggests. They offer similar
products to brand names but for less. Premium store brand products aspire to be the
best products in the category; they may not be cheaper than name brand products but
they are of very high quality. The last group is value innovators. These products focus
on giving consumers the best value in the category. They do this through low prices
and high quality. Store brand product offerings by retailers may include one or all of
these types of products. The trend in recent years is towards multi-tier store brand
offerings. Corstjens shares, “A survey of retailers that carry store brands concludes that
retailers must develop high-quality store brands, not just low-priced brands. Without a
combination of low price and high quality, store brands are not successful.”14
Retailers
need to offer a range of store brands in order to capture consumers with different price
and quality demands. By providing multi-tier store product offerings, retailers can
attract customers away from lower tier name brands and towards higher tier store
brands. Yang talks about this in his study, “the price decrease of high-quality brands
not only provides an opportunity for consumers to switch from low-quality brands to
high-quality brands, but also provides them with higher utility.”15
By offering higher
quality brands at lower prices retailers are able to attract more consumers to their
products. Retailers have started to capture more of the market by offering a wider array
of store brand products. These products have nearly become brands of their own and
14
Corstjens and Lal, Building Store Loyalty through Store Brands, 281-291.
15
Defeng Yang and Xinxin Wang, "The Effects of 2-Tier Store Brands' Perceived Quality, Perceived
Value, Brand Knowledge, and Attitude on Store Loyalty," Frontiers of Business Research in China 4, no.
1 (03 2010): 1-28.

9
rival name brands in quality. With the rise in quality of store brands there has been a lot
of curiosity regarding how store brands affect store loyalty.
Store Brand Loyalty and Store Loyalty Relationship
Store brands have always been unique in that they are goods offered exclusively
at their respective stores. In recent years with the quality of store brands rising along
with their popularity a lot of studies have been looking at how store brand loyalty
relates to store loyalty. Some researchers theorize that store brands can be a form a
differentiation for retailers that helps fosters store loyalty. Some research on the other
hand contradicts this and suggests that high level buyers of store brand goods are
actually less loyal to the store. There is an interesting dynamic between store brand
loyalty and store loyalty that this research has uncovered.
“In Britain, house brands have reached close to half of grocery sales. For
example, Asda’s private label share reached 46 percent, with Sainsbury at 45 percent
and Safeway at 39.4 percent. In some categories, house brands are the market share
leader, creating store loyalty through their exclusive distribution.”16
With store brands
become more popular and their quality rising, retailers are starting to view store brands
as a possible source of differentiation from other retailers. Because store brands are
exclusively offered by their respective retailers, loyalty to store brands can translate into
16
Colleen Collins-Dodd and Tara Lindley, "Store Brands and Retail Differentiation: The Influence of
Store Image and Store Brand Attitude on Store Own Brand Perceptions," Journal of Retailing and
Consumer Services 10, no. 6 (11 2003): 345-352.

10
store loyalty. It is a good theory these studies have not shown any concrete data to
support it.
Packaging
Product packaging has been gaining importance to manufactures and retailer
alike. A recent study found, “Analysis of finding would clearly indicate that there is a
strong association regarding the influence of packaging on the purchase decision, with
over 73 percent of interviewed consumers stating that they relied on packaging to aid
their decision making process at the point of purchase.”17
Other studies have also shown
that packaging is important and it plays a large role consumer decisions. “Good
packaging is far more than a salesman, it is a flag of recognition and a symbol of
values”18
Packaging can serve as a “salesman” and is the face of a product in the store.
Attractive packaging could convince consumer to try a product and unattractive
packaging can discourage consumers from purchasing. With no prior knowledge of a
product the packaging is the consumer’s primary way of judging the quality of a good.
With this in mind many manufactures and retailers have embraced packaging as a
marketing tool. Retailers have embraced this research and begun focusing more on
packaging for their private label brands. “Retailers are hiring more and more top-flight
marketers, designers and advertising agencies. They have embraced the fundamentals of
classic CPG marketing and, now, some have become so sophisticated that they are in a
17 Wells, L. E., H. Farley, and G. A. Armstrong. "The Importance of Packaging Design for Own-Label
Food Brands." International Journal of Retail & Distribution Management 35, no. 9 (09 2007): 677-690.
18 Ibid
11
position to teach brand marketers a thing or two. Packaging is a very effective
marketing tool especially for private label brands.”19
A 2007 study by L. E. Wells, H
Farley and G.A. Armstrong explains, “Given that only a small minority of brands are
strong enough to justify the investment that national advertising requires, for the rest,
packaging represents one of the most important vehicles for communicating brand
massage to the target consumer.”20
Packaging is a cost effective way of marketing a
product directly to consumers. “Private label’s decision to invest in packaging was born
of capital restrictions. Without the massive ad budgets of national brands, retailers had
no choice but to turn the bulk of their focus to packaging”21
This is evident on store
shelves and is a primary reason why packaging is always evolving. “As the retail
environment becomes saturated with competitors vying for consumers attention,
packaging has to work harder than ever if the product is to be noticed through the
congestion of competitive products.”22
Packaging needs to make products stand out
from the competition in order to draw buyers. The studies tend to agree that packaging
is an important marketing tool and attractive packaging can lead to more sales.
19 Koeppel, Jean. "Store Brands Vs. National Brands Who is Coming Out Ahead?" Brand Packaging 14,
no. 6 (07 2010): 22-24.
20
Wells, L. E., H. Farley, and G. A. Armstrong. "The Importance of Packaging Design for Own-Label
Food Brands." 2.
21 Koeppel, Jean. "Store Brands Vs. National Brands Who is Coming Out Ahead?" 22-24.
22
Wells, L. E., H. Farley, and G. A. Armstrong. "The Importance of Packaging Design for Own-Label
Food Brands." 3
12
Consumer Perceptions
The one subject that nearly all the literature agrees on is that consumers have
different perceptions of national brands and private label brands. A 2001 study entitled
“Consumer Perceptions of National, Private, and Generic Brands,” by Bellizzi,
Krueckeberg, Hamilton, and Martin, explored consumer perceptions through interview
surveys.23
The study found that the majority of the people surveyed rated national
brands higher in almost all categories including but not limited to reliability, quality,
texture, purity, desirability, freshness, satisfaction, aroma, and taste. Although the
national brands received the highest ratings in most categories, private labels were rated
as the best value. The study explains, “Consumers may feel that while national brands
are superior to private brands, the purchase and use of private instead of nation brands
do not entail many significant tradeoffs.”24
This study reviles that there are perceptions
by most consumers that national brands are superior to others but it fails to show which
products consumers would purchase. Retailers would want consumers to view their
private label products as comparable to national brands. This study shows that in a
sense but we do not get a real feel of what consumers would pick when purchasing
products; the product with the highest perceived value or the product with the highest
perceived quality.
23 Bellizzi, Joseph A., Harry F. Krueckeberg, John R. Hamilton, and Warren S. Martin. "Consumer
Perceptions of National, Private, and Generic Brands." Journal of Retailing 57, no. 4 (Winter81
1981): 56.
24 Ibid

13
Other studies on the subject have focused on what causes these perceptions and
what influences consumers when making purchasing decisions. Cue utilization theory
explores this subject.25
The theory basically views products as a group of cues both
intrinsic and extrinsic that convey a products quality. Extrinsic cues are ones that are
not directly related to the product itself like brand name, price, and packaging. Intrinsic
cues are the ones that directly relate to the product like ingredients, taste, and texture.
“The cue utilization literature has found repeatedly that brand name is one of the most
important cues of product quality. In fact, blind taste tests have demonstrated that
extrinsic cues, in particular brand name and price, often explain more variance in
perceptions of product quality than do intrinsic cues.”26
This is very interesting because
the majority of consumers would not identify themselves as choosing products based on
extrinsic cues. A 1994 study by found that, “Regardless of the product category or the
actual ingredients sampled, ingredients coupled with national brand extrinsic cues
received significantly more favorable quality assessment than the same ingredients
coupled with store brand extrinsic cues. For example, holding ingredients constant at
the national brand level, national brand extrinsic cues received mean quality assessment
of 5.95; the same ingredients identified with the extrinsic cues of Store I and Store II
brands received mean quality ratings of 5.20 and 5.29, respectively.”27
This study
showed that based only on extrinsic cues national brands were rated better in quality.
25
Colleen Collins-Dodd and Tara Lindley, "Store Brands and Retail Differentiation: The Influence of
Store Image and Store Brand Attitude on Store Own Brand Perceptions," 2.
26
Colleen Collins-Dodd and Tara Lindley, "Store Brands and Retail Differentiation: The Influence of
Store Image and Store Brand Attitude on Store Own Brand Perceptions," 2.
27 Richardson, Paul S., Alan S. Dick, and Arun K. Jain. "Extrinsic and Intrinsic Cue Effects on
Perceptions of Store Brand Quality." Journal of Marketing 58, no. 4 (10 1994): 28.

14
Based on these results it is safe to say that extrinsic cues play a large in building
consumer perceptions towards goods and therefore product purchasing choices.
Taste Tests
Taste tests have been steadily becoming a more widely used tool in food product
marketing. They are mostly used to change consumer’s perceptions about a product or
draw in new customers. A 2001 article by Ghose and Lowengart explains, “Taste tests
are a common activity of marketers in various industries. Such tests are major selling
and advertising message design tools that are aimed at convincing potential customers
about the superiority of one brand over another.”28
For years these taste tests have been
used for marketing and a lot of examples come to mind. The Pepsi Challenge created in
1975 is a prime example that is fairly well known. Pepsi simple challenged consumers
to do a blind taste test comparing Coke to Pepsi. Other examples simply state taste test
results, for example: 68% of people prefer product A to Product B in taste tests. Coors
did this in a 1991 add campaign against Budweiser.29
There are many variations of
these taste tests but their primary focus is to show one product’s superiority over
another.
28
Ghose, Sanjoy, and Oded Lowengart. "Taste Tests: Impacts of Consumer Perceptions and Preferences
on Brand Positioning Strategies." Journal of Targeting, Measurement & Analysis for Marketing 10, no. 1
(08 2001): 26.
29
Ibid

15
The business world has taken a different focus when it comes to taste test.
“Several academic studies have looked at the different perspectives of taste testing.
Broadly these measurements of taste can be divided into two categories: perceptual
discrimination tests and preference tests”30
Perceptual discrimination tests are designed
to see if consumers can tell the product apart from other similar products. This type of
taste test would be useful in launching a new product or comparing the quality of two
very similar products. Preference tests are used to rank a product against competing
products. These two types of tests reveal the biggest concerns for companies selling
products. Ghose an Lowengart would argue, “It is clear then that with respect to taste
testing, two factors dominate. One is the consumers’ perceptions of the dissimilarity
between brands and the other is their feelings of preference for each brand.”31
This
subject has also been the interest of academics. A 1994 study entitled “Extrinsic and
Intrinsic Cue Effects on Perceptions of Store Brand Quality” used taste tests to explore
consumer perceptions.32
The study used manipulated taste tests to view the role
extrinsic cues had on consumer’s perceptions. They volunteers were given packaging
and other extrinsic cues to examine like: price, ingredients, and nutritional information.
The volunteers were then asked to sample the product and rate it. The product given to
the volunteers was not necessarily the product that the extrinsic cues represented. This
30
Ibid
31
Ibid
32 Richardson, Paul S., Alan S. Dick, and Arun K. Jain. "Extrinsic and Intrinsic Cue Effects on
Perceptions of Store Brand Quality." 28.

16
study used taste tests to discover consumer’s true perceptions about goods. Taste tests
have long been a reliable tool for discovering or changing consumer perceptions.
Research Questions and Hypotheses
The academic literature on the subject of private label goods has left some
lingering questions that I feel need to be better explored. The literature does a good job
of exploring subjects but they cover a very wide focus or they bring up new areas that
need to be explored.
The first research question of this study was inspired by the 1994 study by Paul
S. Richardsoii, Alan S. Dick, and Arun K. Jain entitled “Extrinsic and Intrinsic Cue
Effects on Perceptions of Store Brand Quality”.33
Their study examined the roles
extrinsic and intrinsic cues have on consumers. They found that extrinsic cues had
more influence over consumer’s perceptions than intrinsic cues. This study aims to take
these results and explore them further. How does brand alone affect consumer
perceptions of a good, specifically between store band and name brand goods? Collins-
Dodd and Lindley explain, “In fact, blind taste tests have demonstrated that extrinsic
cues, in particular brand name and price, often explain more variance in perceptions of
product quality than do intrinsic cues.”34
It has been found that extrinsic cues have a
33
Ibid
34
Colleen Collins-Dodd and Tara Lindley, "Store Brands and Retail Differentiation: The Influence of
Store Image and Store Brand Attitude on Store Own Brand Perceptions," 2.

17
large impact on consumer perceptions but how large of a role does brand name alone
play?
Hypothesis one: Brand name has a large effect on consumer perceptions towards
a product, and more specifically consumers perceive name brand products to be
superior to store brand products.
The second research question of this study was also inspired by “Extrinsic and
Intrinsic Cue Effects on Perceptions of Store Brand Quality.” Like the first research
question this question focuses on specific extrinsic cues. Product packaging is said to
be one of the most important extrinsic cues so we decided to make it the focus of the
second hypothesis. How does a product’s packaging affect consumer perceptions
towards that product? Does a more appealing packaging give a product a more
favorable perception to consumers? Does imitating name brand product packaging
make private label goods more alluring or does it simply make them disappear on the
shelf?
Hypothesis two: Appealing product packaging has a positive effect on consumer
perceptions of that product.
The third research question was inspired by “Store brands and retail
differentiation: the influence of store image and store brand attitude on store own brand

18
perceptions” a 2003 study by Colleen Collins-Dodd and Tara Lindley.35
Their study
examines consumer perceptions towards store brands and store image. The study found
a positive relationship between a stores image and perceptions of its private label
brands. Our study wants to recreate the results of this study. Store brands are in a way
an extension of the store so it would make sense that consumer perceptions of the store
influence consumer perceptions of that store’s private label goods. This leads to
Hypothesis three: Private label goods will be perceived as better if the store they
originate from is perceived highly by consumers. In other words if a store is
perceived as a good store its private label goods will be perceived better.
35
Ibid

19
CHAPTER III
METHODOLOGY
Overview
To test my hypotheses, we designed an experiment with intentions of revealing
subjects perceptions towards store brands and national brands based only on the brands
themselves. The experiment was also designed to explore how differences in store
reputation or store brand packaging affect consumer’s perception of store’s brands.
Room 119 in the Economics Department in Palmer Hall was the sight of the
experiment. It was set up like a taste test that subjects take one at a time. Outside the
room an assistant checked subjects in and had them fill out a consent form as well as a
quick survey. In the room there was a table with two packages of each category,
crackers and cookies; a store brand and a name brand product of each. The chosen
products looked almost identical to one another. In front of each of the packages there
was a sample that the subject will taste test. Both samples were of the store brand
product. The subjects assumed that the samples represent the product they are in front
of, and if they asked during the taste test, we were not allowed to answer. The subject
was then asked to pick their favorite in each category. If the subjects have no
perceptions about name brands versus store brands the experiment should result in
around fifty percent preferring the store brand and fifty percent preferring the name
brand in both categories. We will test the effect of store reputation and packaging on

20
that store’s brand by changing the store brand that is used in the experiment. If the
same results are seen for the two store’s brands then store reputation has no effect.
Subjects
The experiment was designed to provide the best results if 100 or more subjects
participate. These subjects were told that they were participating in a taste test to
research snack food preferences. The subjects were people over the age of 18 and
include Colorado College students, Colorado College faculty and staff, and members of
the Colorado Springs community. Subjects were recruited using the Colorado College
list server, bulletin boards, class announcements, and emails. The majority of the
participants were recruited through personal emails. The subjects were told that they
would be put into a drawing for $45 worth of prizes. Each subject was randomly put in
one of four groups. The first group sampled crackers first and cookies second with
Wal-Mart store brand “Great Value.” The second group sampled cookies first and
crackers second with Great Value. The third group sampled crackers first and cookies
second with King Soopers store brand “Kroger.” The fourth group will sample cookies
first and crackers second with Kroger. Subjects completed the taste test one at a time in
a controlled environment. The experiment took aproximently five minutes per subject.
Upon completing the experiment subjects were asked not to talk about the experiment
until after all the subjects have completed the experiment. When all the subjects had
completed the experiment, We sent out a debriefing letter of the experiment to explain
what the experiment was truly about. (See appendix A)

21
TABLE 3.1 TASTE TEST GROUPS
Wal-Mart Store Brand King Soopers Store Brand
Crackers then Cookies
Group 1 (25 subjects)
Group 3 (25 subjects)
Cookies then Crackers
Group 2 (25 subjects)
Group 4 (25 subjects)
Procedure
The experiment taste tests were conducted in Palmer Hall room 119 in the
Economics Department of Colorado College. The same procedure was done for all of
the taste test experiments according to which group they were assigned. When the
subject arrived he or she was asked to complete a consent form, a brief questionnaire,
and read the test instructions. Before the subject entered the room the table was set up
with two the two categories; one category for crackers and the other one for cookies.
One product in each category was a name brand and the other was a store brand. The
products were set up from left to right in the order the subjects tasted them. Store
brands will be selected from both Wal-Mart and King Soopers. The selected store
brands were very similar to the name brand products both visually and in overall
quality. The order in which the brands were arranged was randomized. In front of both
brands in each category there was a sample of the store brand product. The subject was
given a set of instructions to read while the test is being set up, as well as a
questionnaire to complete. When the test was set up the subject entered the room and
the test began. Subjects were given the same instructions in every experiment session.

22
They were first asked to taste the samples in the first category. The subjects were given
water to cleanse their pallet in between samples. They were then asked to indicate
which sample they liked best and it was recorded on the back of their questionnaire.
Next they were asked to test the next set of samples in the same way. They were asked
to again indicate which sample they liked the best and it was recorded. The subjects
were then asked not to discuss the experiment until all of the subjects have completed
the taste test and they will be excused.
Instructions
The subjects were each given an instructions sheet that tells them what they will
be doing when they come into the room to participate in the experiment. This will help
the experimenter with giving the test and also minimize the amount of verbal contact
needed to administer the test. (See appendix B)
Product selection
There were several considerations to take into account when choosing the
products for the taste test. First was the type of food. The foods chosen were simple
and have very little variation in taste, quality, or visual appeal. Also we wanted product
categories that had a clear market leader as well as high brand recognition. With all of
this in mind, we chose Ritz crackers and Chunky Chips Ahoy cookies as the name
brand products for the taste tests. Ritz and Chips Ahoy are both highly recognized
brands and a lot of private label brands have products targeting these product categories.

23
FIGURE 3.1 CHIPS AHOY AND RITZ
Next the store brands that would be tested were selected. First we considered which
stores we would get the store brand products from. We selected Wal-Mart and King
Soopers. Wal-Mart was picked because it is known as a low cost provider and they
retail a large variety of products other than groceries. We selected King Soopers
because they are a traditional grocery store and they employ a different packaging
strategy for their private label products. Packaging was the second consideration. Wal-
Mart’s Great Value line of products has very simple packaging with very little color and
no frills. They also do not try to brand each individual product; they are simply Great
Value cookies or crackers. This goes with Wal-Mart’s strategy of providing low cost
products to save people money.

24
FIGURE 3.2 GREAT VALUE COOKIES AND CRACKERS
King Soopers employs an imitation strategy for the packaging of their private label
goods. King Soopers products are packaged to imitate the leading product in each
product category and each product is individually branded. It is not obvious that King
Sooper’s private label goods are store brands. These store brands have different
packaging strategies and the results may shed light on which strategy is more effective.
FIGURE 3.3 KING SOOPERS COOKIES AND CRACKERS

25
The six products used for the tests were Ritz crackers, Chunky Chips Ahoy cookies,
Great Value buttery rounds crackers, Great Value chocolate chip cookies, Kroger Chip
Mate cookies, and Kroger Zips crackers. Ritz crackers and Chips Ahoy were both
$2.50 each. The Great Value cookies and King Soopers cookies were $2.18 and $1.99
respectively. The Great Value crackers were $1.38. King Soopers Zips crackers were
more expensive than the Ritz crackers coming in at $2.89.
Experiment Conditions
The taste tests were conducted in a small classroom. Two tables were set up;
one outside the room and one inside the room. The table outside the room served as a
check-in area for the subjects. An assistant checked in subjects and gave them a
questionnaire and consent form to fill out. The assistant also had the subjects read the
taste test instructions while they wait for the taste test to be set up. At this table there
was also Power Point presentation and flyers to help recruit walk-in subjects. The table
inside the room was set up right inside the door with two chairs on opposite sides of the
table from each other. The taste test was set up according to the group each individual
subject is put in. The taste test samples were placed in front of the product packaging
that they represent in the test. In the middle of the table there was a cup of water for
each subject.
During the set up process the packages of the products were censored. Some of
the packages had writing on them that did not pertain to the brand or the store they
came from that could have influenced the subjects. These writings included things like

26
“0 grams fat” on both of the King Super’s products, “reduced fat” on the Wal-Mart
crackers, and “vegetarian” on the King Super’s cookies. Because these writings on the
package are not the focus of the study they were censored. Pieces of tape were used to
censor the packages. The tape will be put on all of the packages even if they don’t have
writing that needs censored so that the tape itself will not have an effect on the subject
choices.
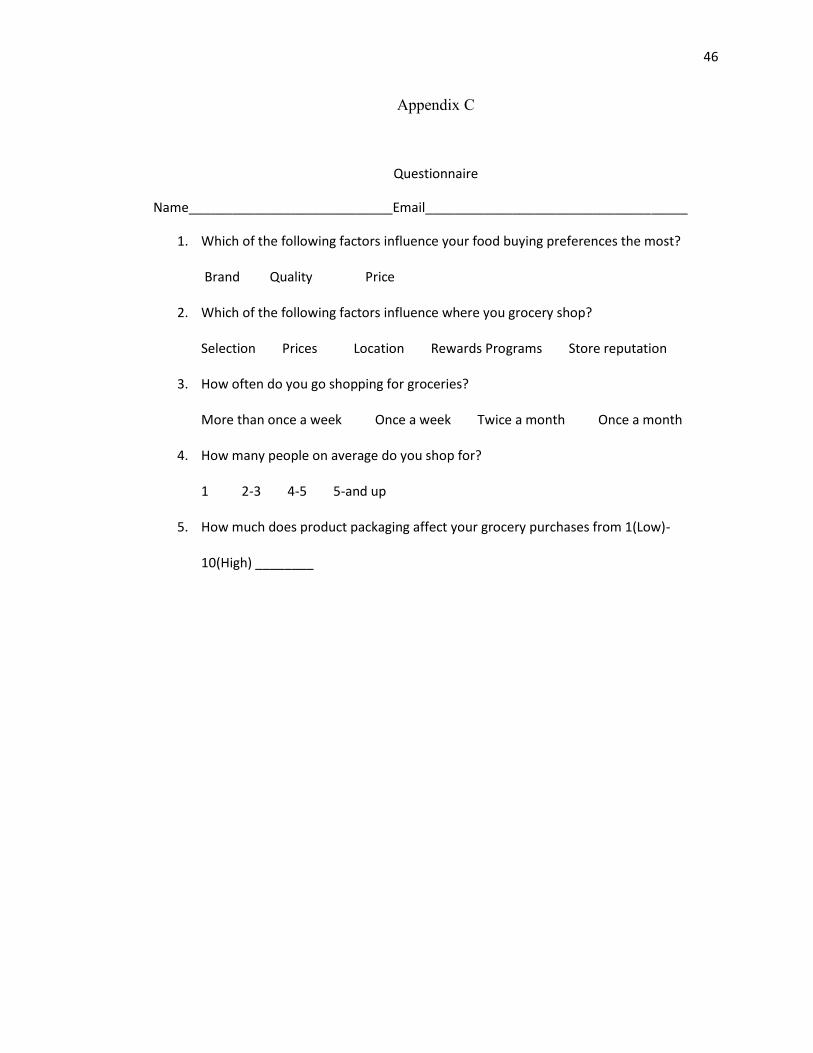
Questionnaire
Each subject completed a short questionnaire focusing on some demographics
and consumer preferences. We wrote the questions to look at some of the areas that
other studies have looked at. Some questions will give insight into the hypotheses that
We have made. Specifically question two showed how important store reputation is and
question five will give insight into how much consumers are affected by packaging.
These are the questions on the questionnaire.

27
CHAPTER IV
RESULTS AND DISCUSION
The taste test experiments gathered data from 37 subjects who included
Colorado College students, staff, faculty, as well as members from the surrounding
community. The composition of the sample was: 5 CC faculty/staff members, 30 CC
students and 7 members of the surrounding community. The participants were put in to
the four main test groups as follows.
TABLE 4.1 PARTICIPANT GROUPS
Wal-Mart Store Brand King Soopers Store Brand
Crackers then Cookies
10 Participants
9 Participants
Cookies then Crackers
9 Participants
9 Participants
The following table shows the results of the taste tests. The data from the groups were
compared using T-tests and no substantial differences in the samples were found so the
data could be combined.

28
TABLE 4.2 TASTE TEST RESULTS
King Soopers Crackers King Soopers Cookies
Times Selected % Times Selected %
11 61 7 38.9
Wal-Mart Crackers Wal-mart Cookies
Times Selected % Times Selected %
7 36.8 10 52.6
Combined Store Crackers Combined Store Cookies
Times Selected % Times Selected %
18 48.6 17 45.9
The data shows more variation when it is in the smaller groups. This could be simple
because the groups are smaller or it could show a difference in consumer perceptions.
The data sets for the individual groups are too small to draw significant conclusions
from. The combined data set gives a better representation of consumer perceptions.
Questionnaire results
The responses from the questionnaires were also combined and showed some
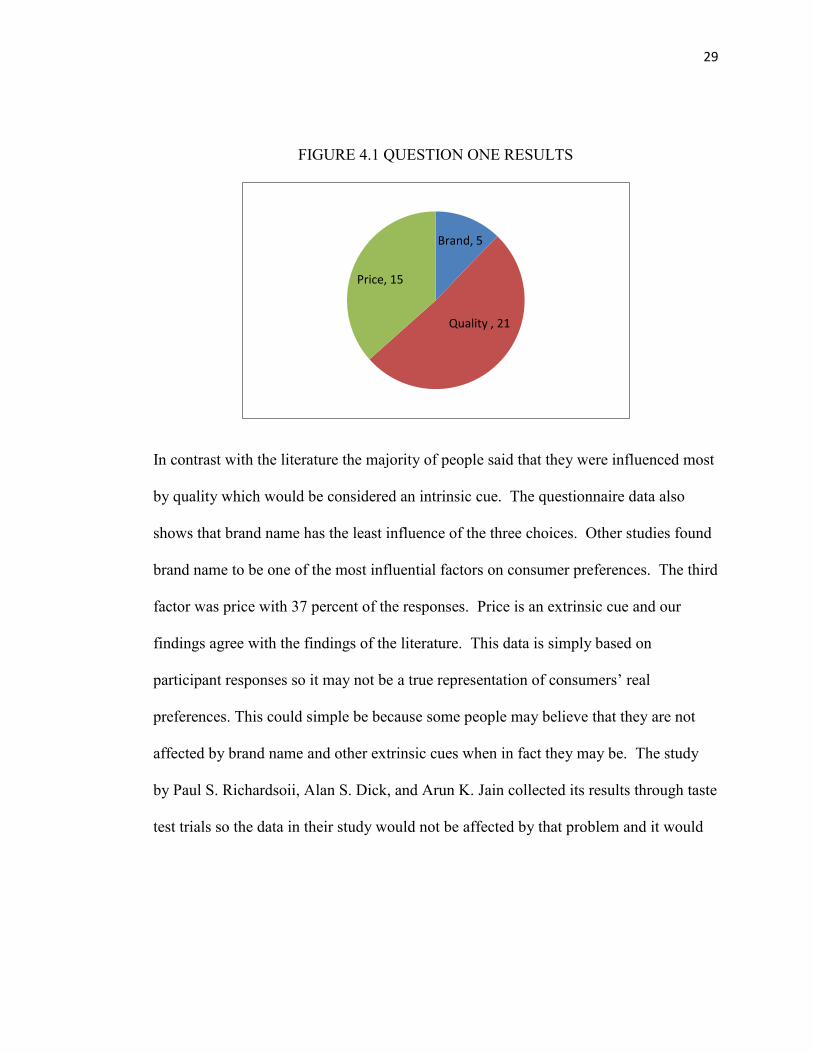
interesting results. The first question was: Which of the following factors influence
your food buying preferences the most? 12 percent responded Brand Name, 51 percent
responded Quality, and the 37 percent that were left responded Price.
29
FIGURE 4.1 QUESTION ONE RESULTS
In contrast with the literature the majority of people said that they were influenced most
by quality which would be considered an intrinsic cue. The questionnaire data also
shows that brand name has the least influence of the three choices. Other studies found
brand name to be one of the most influential factors on consumer preferences. The third
factor was price with 37 percent of the responses. Price is an extrinsic cue and our
findings agree with the findings of the literature. This data is simply based on
participant responses so it may not be a true representation of consumers’ real
preferences. This could simple be because some people may believe that they are not
affected by brand name and other extrinsic cues when in fact they may be. The study
by Paul S. Richardsoii, Alan S. Dick, and Arun K. Jain collected its results through taste
test trials so the data in their study would not be affected by that problem and it would
Brand, 5
Quality , 21
Price, 15

30
produce more reliable results.1 With this in consideration we cannot draw any
conclusions based on the results from this question.
The second question was: Which of the following factors influence where you
grocery shop? The choices were selection, prices, location, rewards programs, or store
reputation. The results were 12, 19, 18, 2, and 5 respectively.
FIGURE 4.2 QUESTION 2 RESULTS
These results do not single out the most important reason consumers shop where they
do but they do give us insight into the most important factors contributing to store
choice. The data shows that prices, location, and selection are the most important
factors to consumers and that rewards programs and reputation are not as important. In
a T tests of the data Location prices and selection were significant and rewards and
store reputation were not significant. This could influence the findings in respect to our
1 Richardson, Paul S., Alan S. Dick, and Arun K. Jain. "Extrinsic and Intrinsic Cue Effects on Perceptions
of Store Brand Quality." Journal of Marketing 58, no. 4 (10 1994): 28.
Selection, 12
Prices, 19
Location, 18
Rewards, 2
Reputation, 5
31
third hypothesis which will be talked about later in this chapter. These findings are
parallel to the findings of other research on demographics so we believe they are a fair
and accurate sample.
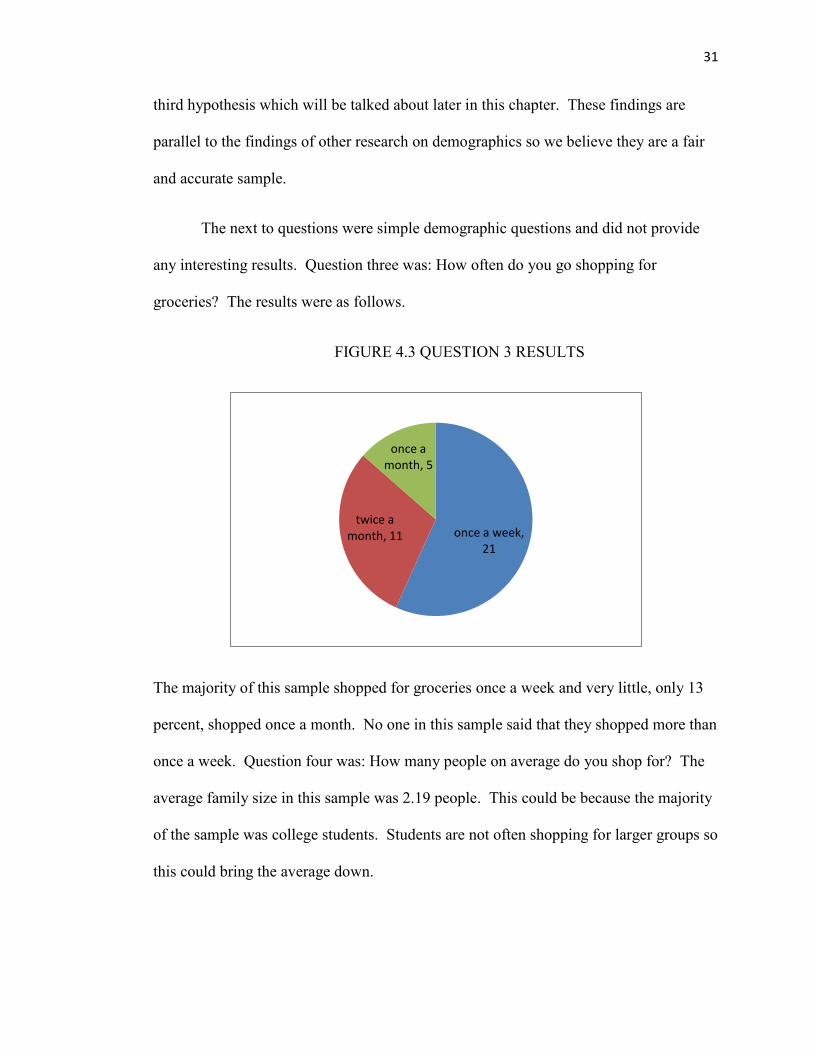
The next to questions were simple demographic questions and did not provide
any interesting results. Question three was: How often do you go shopping for
groceries? The results were as follows.
FIGURE 4.3 QUESTION 3 RESULTS
The majority of this sample shopped for groceries once a week and very little, only 13
percent, shopped once a month. No one in this sample said that they shopped more than
once a week. Question four was: How many people on average do you shop for? The
average family size in this sample was 2.19 people. This could be because the majority
of the sample was college students. Students are not often shopping for larger groups so
this could bring the average down.
once a week, 21
twice a month, 11
once a month, 5

32
The final question on the questionnaire focused on packaging. How much does
product packaging affect your grocery purchases from 1(low) to 10(high)? The average
response was five. It is clear that packaging has some influence on all consumers. Four
volunteers in this sample responded with one, saying that packaging had no effect on
their purchasing behavior. The thirty three respondents, or eighty nine percent, that
were left responded that packaging does have an effect. Thirteen of these respondents
gave ratings of seven or above meaning that packaging played a major role in their
purchasing behaviors. This goes along with the study by L. E. Wells, H Farley and
G.A. Armstrong in which seventy three percent of participants agreed that packaging
played a role at the point of purchase.2 This data will be discussed further in the section
regarding hypothesis two.
Hypothesis Discussion:
Hypothesis One
The first hypothesis was the main focus of this study. Based on the findings of
other studies we expected to see a clear perception difference between the products
presented in each category during the taste testes. We hypothesized that brand name
has a large effect on consumer perceptions towards a product, and more specifically
consumers perceive name brand products to be superior to store brand products. This
was not supported with our data.
2 Wells, L. E., H. Farley, and G. A. Armstrong. "The Importance of Packaging Design for Own-Label
Food Brands." 2.
33
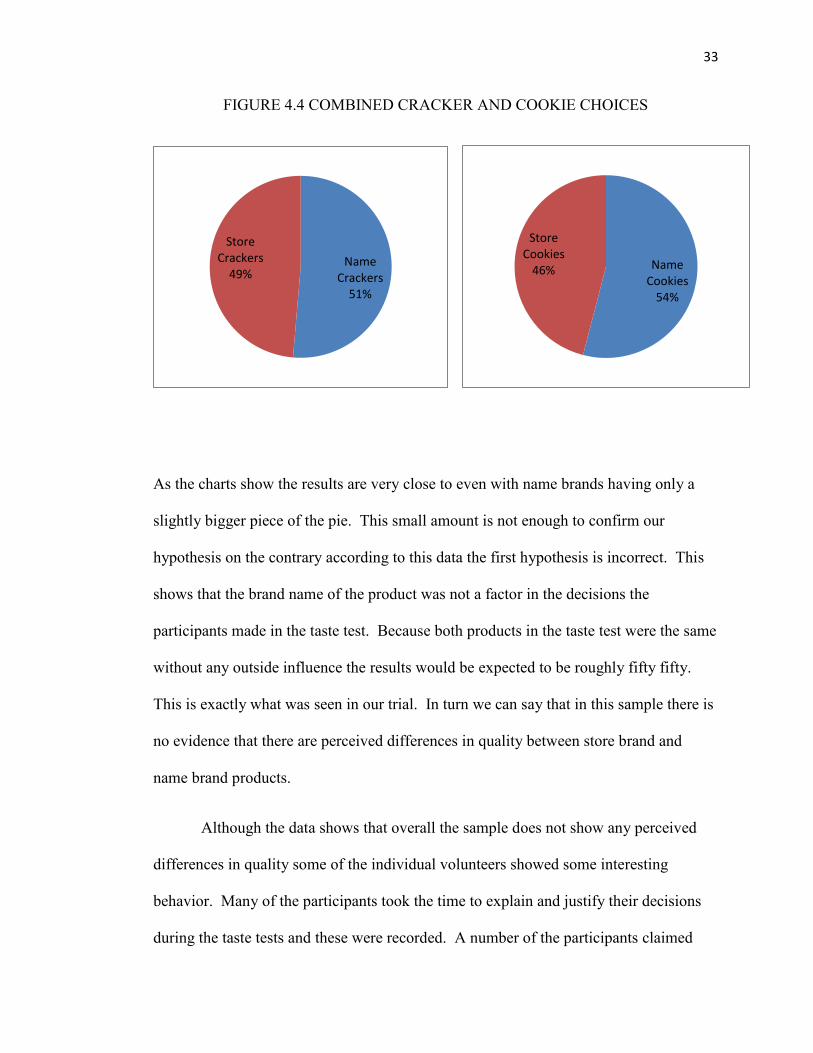
FIGURE 4.4 COMBINED CRACKER AND COOKIE CHOICES
As the charts show the results are very close to even with name brands having only a
slightly bigger piece of the pie. This small amount is not enough to confirm our
hypothesis on the contrary according to this data the first hypothesis is incorrect. This
shows that the brand name of the product was not a factor in the decisions the
participants made in the taste test. Because both products in the taste test were the same
without any outside influence the results would be expected to be roughly fifty fifty.
This is exactly what was seen in our trial. In turn we can say that in this sample there is
no evidence that there are perceived differences in quality between store brand and
name brand products.
Although the data shows that overall the sample does not show any perceived
differences in quality some of the individual volunteers showed some interesting
behavior. Many of the participants took the time to explain and justify their decisions
during the taste tests and these were recorded. A number of the participants claimed
Name Cookies
54%
Store Cookies
46% Name
Crackers 51%
Store Crackers
49%

34
that the Chips Ahoy cookies had “Better Chocolate” or that they were “cruncher” even
though they essentially tasted the same cookie twice. These participants claimed that
the Chips Ahoy cookie was greatly superior to the store brand cookie. Perhaps these
participants held a preconceived notion that Chips Ahoy Cookies were the better quality
product and therefore used “better chocolate” or tasted better. This type of behavior
was also seen in the cracker category but it was never seen in favor of the store brand
product only for the name brand product. It is possible that these participants have
perceptions of goods based on brand name. The explanations of participants also
showed that these perceptions may be based only in certain categories. Many of the
participants that claimed the name brand product to be greatly superior in one category
then chose the store brand product in the other category. This would suggest that brand
perceptions may be different for different categories of products. These responses
would suggest that the first hypothesis still has some validity.
Participants in the study often stated that they could not tell the difference
between the two products. When this happened they were picking a product based on
something other than taste. Both the name brand product and the store brand product
were chosen. In the case of the name brand product being chosen this could have been
for several reasons. First the participant could not tell a difference so they chose the
name brand product because it is better know or more popular. They may have also
chosen the name brand because they perceive it to be a better product even though they
could not taste the difference. Another reason could be that the name brand is the
product they regularly buy and they chose it because of brand inertia. In the case of the
store brand product being chosen there are also several explanations. First the

35
participant could have inferred that the store brand product would cost less and
therefore had a better price-to-quality ratio and selected it for that reason. This would
reflect the results from question one of the questionnaire. Price maters more than brand
name with quality being held equal.
Based on these findings I do not believe the first hypothesis can neither be
denied or confirmed. There is data that would render the hypothesis false but there
were also findings that support the hypothesis. The collection of more data would be
the best way to further test this hypothesis.
Hypothesis Two
The second hypothesis like the first focuses on the effect of extrinsic cues on
purchasing decisions. Based on other research we expect that products with more
appealing packaging will be selected more than other products. We hypothesized that
appealing product packaging has a positive effect on consumer perceptions of that
product. According to the questionnaire packaging has some effect on a majority of the
participants in our study. With this in mind to test this hypothesis we will look at the
data for all of the products and relate that data to the packaging of each product. First
we will look at the cookie category.

36
FIGURE 4.5 WAL-MART AND KING SOOPERS COOKIE CHOICES
The major difference between these two test groups is the packaging of the store brand
cookies. Using packaging differences to explain the differences in these two samples
can tell us a lot about how consumers are affected by the packaging. In the case of
Wal-Mart we can infer that participants found the Chips Ahoy and Great Value
packaging equally attractive because there is very little difference in the number of
participants picking each. The results from King Soopers group show a different story.
In this case we can infer that participants found the Chips Ahoy packaging more
appealing. The King Soopers brand (Chip Mates) packaging was designed to imitate
the Chips Ahoy packaging. Seeing this could have made participants assume that the
King Soopers brand was lower quality. This would explain the greater percent of
participants picking the Chips Ahoy cookie.
Name Cookies
47% Store
Cookies 53%
Wal-Mart Cookie Choices
Name Cookies
61%
Store Cookies
39%
King Soopers Cookie Choices

37
FIGURE 4.6 WAL-MART AND KING SOOPERS CRACKER CHOICES
Looking at the cracker category in the same way we can make similar inferences. The
Wal-Mart group shows significantly more participants choosing Ritz crackers. This
could be because Wal-Mart’s packaging design is very simple and Ritz packaging is
more appealing and well known. The King Soopers group showed the opposite results.
The store brand was picked a significantly higher percentage of the time. The King
Soopers store brand (Zips) is more colorful and all around appealing that the Wal-Mart
store brand. This could be the reason for the big difference.
This method of looking at the packaging of the goods in relation to how the
products were selected in the taste test cannot really tell us anything conclusive. This
was done simple to see how packaging could affect product choice. This represents an
extreme scenario where packaging would be the only factor. There are many other
factors that could have caused these results besides packaging especially with the low
Name Crackers
63%
Store Crackers
37%
Wal-Mart Cracker Choices
Name Cracker
s 39% Store
Crackers
61%
King Soopers Cracker Choices

38
number participants. With a higher number of participants and further questioning
about packaging we could learn more about how packaging effects purchasing behavior.
Hypothesis Three
The third hypothesis examines the relationship between the perceptions of
retailers and their private label brands. We hypothesis that private label goods will be
perceived as better if the store they originated from is perceived highly by customers.
In other words if a store has a good reputation then its private label goods will be
perceived as better. Our data shows no support for this hypothesis.
FIGURE 4.7 WAL-MART AND KING SOOPERS CHOICES
Both the Wal-Mart group and the King Soopers group showed similar results of store
brand choices. We would expect to see different results in each group if store
reputation plays a part in store brand perceptions. In addition to the data not supporting
Store Brand 50%
Name Brand 50%
King Soopers Choices
Store Brand 45%
Name Brand 55%
Wal-Mart Choices

39
the hypothesis the response collected on the questionnaires showed that store reputation
was not a significant factor in store choice. Based on this, hypothesis three is Rejected.

40
CHAPTER V
CONCLUSION
The central focus of this study was to explore extrinsic cues and how they affect
consumer perceptions. We focused on brand name, packaging and store reputation.
Although our results were not conclusive we found some interesting patterns and
behaviors. The raw data collected did not support our first hypothesis. The ratio of
participants choosing store brand goods to participants choosing name brand goods was
nearly one to one suggesting that brand had no effect. Responses during the taste tests
by individual participants showed evidence that supported the first hypothesis.
Participants were obviously influenced in some way by the brand names of the
products. Other research on the topic would support the initial hypothesis so individual
participants responses could not be ignored. The results tested in the second hypothesis
were equally as vague. We found trends that could be explained by variations in
packaging but there were many other factors that could explain these trends. More data
would need to be collected to properly research this hypothesis. The third hypothesis
had no support from the data. In the questionnaire responses store reputation was found
to be of very little importance to consumers. The data from the taste tests also showed
little difference between the results for each store’s group. In all the study was
inconclusive but it did show some parallels with other research on the subject.

41
Sources of error
There are some obvious sources of error in this study and some that are not so
obvious. The first is the possibility that participants were influenced by factors other
than the ones that were the subject of the study. This was for seen and precautions were
taken. One example was covering messages on the package like “low fat” or
“vegetarian.” These things alone could have persuaded participants to choose one
product over the other. Another precaution was the controlled environment of the test.
Every test took place in the same room with the same examiner. Although these
precautions were taking other aspects could have influenced participants such as
fondness of cookies or crackers, time of day, and if they had recently eating among
other things.
Another possible source of error was the quality consistency of the products
used in the taste tests. The tests were done with the assumption that because both
products in each category were from the same package that they would be the same
quality. If the quality fluctuated from one sample to the next participants would judge
based on the taste difference. This would be bad because the experiment was designed
so that participants judge based on the extrinsic cue of brand name. This was avoided
by using products which traditionally have good consistency, but this error could have
still been present. For example if one cookie had more chocolate chips than the other
this may affect the taste and sway the participant. With a lot of subjects this error
would be less and less significant.
42
Sample bias could also be a source of error. The participants in this study were
mostly student. Students general have less money to devote to food and therefore may
pay more attention to price and be more likely to buy store brands. Because of this
students may have very different perceptions of store brand goods than the rest of the
sample.
The questionnaire may be another area that may have been affected by error.
Some participant may have been hesitant to answer certain questions truthful. People
may not want to admit how much they are affected by things such as brand name, price,
packaging, and so on. In our study we promoted honesty by informing participants that
that all of the information they provided would be kept confidential and anonymous.
Even with this precaution participants may not have responded honestly.
Limitations and Future Research
Several limitations were reached in this study. The first was recruiting
participants. This process was a lot harder than originally anticipated especially under
time constraints. Scheduling taste tests in time slots allowed for more convenience to
the participants, and helped attract participants. The biggest hindrance in attracting
participants was the location. In our study we wanted a controlled environment but we
could not get participants to come. A better strategy may have been setting up the
experiment outside of a grocery store. This would not provide a controlled environment
but it would provide a large potential participant base. An experimenter could easily
43
get fifteen to twenty participants a day using this method. This would be an opportunity
for further research.
Another limitation was the responses gathered from the participants. Once we
began to analyze the data we realized that more data about packaging and store
reputation would have helped in the analysis of the hypotheses. For example after
participants chose their favorite product we could have asked them which product had
more appealing packaging. This would have helped better explain the second
hypothesis. The more data that is collected during an experiment the better even if it
does not get used.
This study did not show conclusive proof of any of the hypotheses but I feel that
the topic is still relevant and important and future research is required. By gathering
more data I believe that this study would have come to conclusions about all three
hypotheses. The study did find interesting consumer behavior and many similarities to
previous studies.

44
Appendix A
Written Debriefing Form
Name Brands versus Store Brands: A look into consumer
perceptions of store brands
The purpose of this research is to look at how brand name affects consumer perceptions
towards goods, specifically looking at name brands versus store brands. The main focus will be
looking at consumer’s perceived quality of goods based on the brand name. The objective is to
see how big of an impact brand name has in the market place. The secondary objective is to
research whether a store’s reputation has an effect on the perceptions of the stores private label
brands.
The best way to observe how consumers perceive the quality of goods based on their
brand name is through a comparison. We did this in through the taste test. We asked you to
sample two goods, one of which was in front of a store brand and the other that was in front of a
name brand, and then pick your favorite. The study was designed to lead you to believe that the
products you sampled represented the brand that they were in front of but that was not the case.
Both of the samples were the same good. We did this so we could see the affect that a products
brand name alone can have on consumer perceptions. Because the two samples are the same if
consumer perceptions do not rely on a product’s brand name we will expect to see roughly a
half and half split of the two samples being chosen. If not we will know that brand name is a
factor in a consumes choice between name brand and store brand goods.
Both consumers and retailers can benefit from this research. Consumers can gain
knowledge that may help them make more informed decisions between name brand and store
brand goods. Retailers can use the findings of this research to better market their private label
goods to customers.
We would ask you to maintain confidentiality about the purpose of the experiment since
any pre-knowledge of the purpose will bias the data for that person and thus cannot be used.
If you have any questions or concerns about the experiment or would like to receive a summary
of the findings contact The principal investigator Wyatt Babb at
[email protected], The faculty advisor Jim Parco at
[email protected], or the Colorado College Institutional Research Board chair,
Amanda Udis-Kessler at 719-227-8177 or [email protected]. If you feel
uncomfortable about having been deceived in this study you are free to ask that your data be
withdrawn from the study. Records of this study will be kept private. The data collected in this
study will be kept in a password protected spreadsheet and the data will not be linked in any
way to your name or other individual information. Any report of this research that is made
45
available to the public will not include your name or any other individual information by which
you could be identified.
Thank you very much for participating in our study!
Appendix B
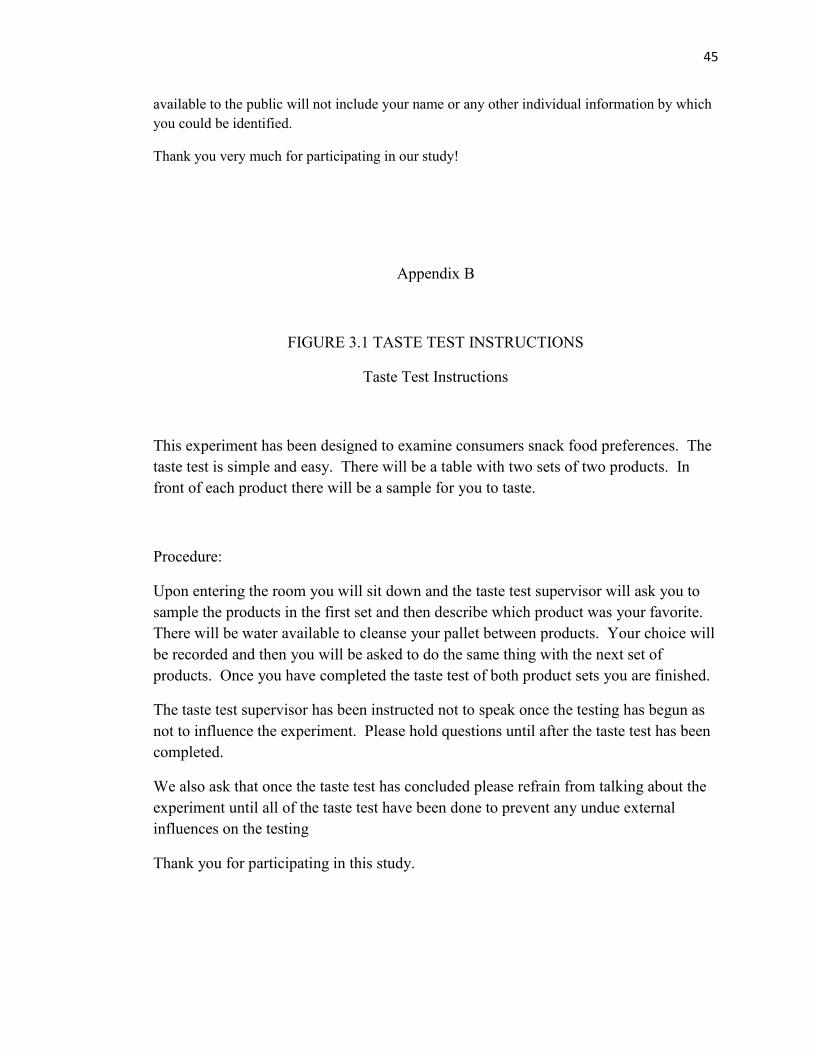
FIGURE 3.1 TASTE TEST INSTRUCTIONS
Taste Test Instructions
This experiment has been designed to examine consumers snack food preferences. The
taste test is simple and easy. There will be a table with two sets of two products. In
front of each product there will be a sample for you to taste.
Procedure:
Upon entering the room you will sit down and the taste test supervisor will ask you to
sample the products in the first set and then describe which product was your favorite.
There will be water available to cleanse your pallet between products. Your choice will
be recorded and then you will be asked to do the same thing with the next set of
products. Once you have completed the taste test of both product sets you are finished.
The taste test supervisor has been instructed not to speak once the testing has begun as
not to influence the experiment. Please hold questions until after the taste test has been
completed.
We also ask that once the taste test has concluded please refrain from talking about the
experiment until all of the taste test have been done to prevent any undue external
influences on the testing
Thank you for participating in this study.
46
Appendix C
Questionnaire
Name____________________________Email____________________________________
1. Which of the following factors influence your food buying preferences the most?
Brand Quality Price
2. Which of the following factors influence where you grocery shop?
Selection Prices Location Rewards Programs Store reputation
3. How often do you go shopping for groceries?
More than once a week Once a week Twice a month Once a month
4. How many people on average do you shop for?
1 2-3 4-5 5-and up
5. How much does product packaging affect your grocery purchases from 1(Low)-
10(High) ________

47
WORKS CONSULTED
"Packaging can Set Apart Store Brands." Official Board Markets 87, no. 8 (02/19
2011): 16-16.
"Private Lable Manufacturers Association." [cited 2011]. Available from
http://plma.com/.
"Store Brands Vs. Name Brands." Consumer Reports 75, no. 10 (10 2010): 16-21.
"Battle of the Brands." Consumer Reports 70, no. 8 (08 2005): 12-15.
"The Price Factor in Private Label Purchasing Decisions." Supermarket Business
Magazine 49, no. 8 (08 1994): 16.
"The Generic Metamorphosis: Now they'Re Third-Tier Brands with Names, Colorful
Labels. (Cover Story)." Marketing News 15, no. 22 (04/30 1982): 1-7.
"Half of Consumers Now Buy More Generics, Store Brands." Marketing News 15, no. 3
(08/07 1981): 15-15.
"Brand Loyalty Beats Price in some Product Categories. (Cover Story)." Marketing
News 14, no. 11 (11/28 1980): 1-2.
Ailawadi, Kusum L., Scott A. Neslin, and Karen Gedenk. "Pursuing the Value-
Conscious Consumer: Store Brands Versus National Brand Promotions." Journal
of Marketing 65, no. 1 (01 2001): 71-89.
ALLEN, MICHAEL W., RICHA GUPTA, and ARNAUD MONNIER. "The Interactive
Effect of Cultural Symbols and Human Values on Taste Evaluation." Journal of
Consumer Research 35, no. 2 (08 2008): 294-308.
Allison, Ralph I., and Kenneth P. Uhl. "Influence of Beer Brand Identification on Taste
Perception." Journal of Marketing Research (JMR) 1, no. 3 (08 1964): 36-39.
Badrinarayanan, Vishag, and Debra A. Laverie. "Brand Advocacy and Sales Effort by
Retail Salespeople: Antecedents and Influence of Identification with
Manufacturers' Brands." Journal of Personal Selling & Sales Management 31, no.
2 (Spring2011 2011): 123-140.

48
Baltas, George. "Determinants of Store Brand Choice: A Behavioral Analysis." Journal
of Product & Brand Management 6, no. 5 (05 1997): 315.
Baltas, George, and Paraskevas C. Argouslidis. "Consumer Characteristics and Demand
for Store Brands." International Journal of Retail & Distribution Management 35,
no. 5 (05 2007): 328-341.
Beldona, Sri, and Scott Wysong. "Putting the "Brand" Back into Store Brands: An
Exploratory Examination of Store Brands and Brand Personality." Journal of
Product & Brand Management 16, no. 4 (08 2007): 226-235.
Bellizzi, Joseph A., Harry F. Krueckeberg, John R. Hamilton, and Warren S. Martin.
"Consumer Perceptions of National, Private, and Generic Brands." Journal of
Retailing 57, no. 4 (Winter81 1981): 56.
Berman, Barry. Competing in Tough Times : Business Lessons from L.L. Bean, Trader
Joe's, Costco, and Other World-Class Retailers. Upper Saddle River, N.J.: FT
Press, 2011.
Bolan, Cristen. "Private Label Still Generic?" Global Cosmetic Industry 173, no. 10 (10
2005): 46-48.
Bonfrer, André, and Pradeep K. Chintagunta. "Store Brands: Who Buys them and what
Happens to Retail Prices when they are Introduced?" Review of Industrial
Organization 24, no. 2 (03 2004): 195-218.
Brucks, Merrie, Valarie A. Zeithaml, and Gillian Naylor. "Price and Brand Name as
Indicators of Quality Dimensions for Consumer Durables." Journal of the Academy
of Marketing Science 28, no. 3 (Summer2000 2000): 359.
Chakraborty, Samrat. "Perceptions and Buyer Behavior Towards Private-Label Colas:
An Exploratory Study to Understand the Views of the Store Managers of United
Kingdom." IUP Journal of Marketing Management 10, no. 1 (02 2011): 7-18.
Collins-Dodd, Colleen, and Tara Lindley. "Store Brands and Retail Differentiation: The
Influence of Store Image and Store Brand Attitude on Store Own Brand
Perceptions." Journal of Retailing and Consumer Services 10, no. 6 (11 2003):
345-352.
Corstjens, Marcel, and Rajiv Lal. "Building Store Loyalty through Store Brands."
Journal of Marketing Research (JMR) 37, no. 3 (08 2000): 281-291.
Cunningham, Isabella C. M., Andrew P. Hardy, and Giovanna Imperia. "Generic
Brands Versus National Brands and Store Brands." Journal of Advertising
Research 22, no. 5 (Oct 1982): 25-32.

49
Dawar, Niraj, and Philip Parker. "Marketing Universals: Consumers' use of Brand
Name, Price, Physical Appearance, and Retailer.." Journal of Marketing 58, no. 2
(04 1994): 81.
Erdem, Tü, Ying Zhao, and Ana Valenzuela. "Performance of Store Brands: A Cross-
Country Analysis of Consumer Store-Brand Preferences, Perceptions, and Risk."
Journal of Marketing Research (JMR) 41, no. 1 (02 2004): 86-100.
Fitzell, Philip B. Private Label Marketing in the 21st Century : Store Brandsexclusive
Brands on the Cutting Edge. 1 ed. New York: Global Books LLC, 2003.
Geyskens, Inge, Katrijn Gielens, and Els Gijsbrechts. "Proliferating Private-Label
Portfolios: How Introducing Economy and Premium Private Labels Influences
Brand Choice." Journal of Marketing Research (JMR) 47, no. 5 (10 2010): 791-
807.
Ghose, Sanjoy, and Oded Lowengart. "Taste Tests: Impacts of Consumer Perceptions
and Preferences on Brand Positioning Strategies." Journal of Targeting,
Measurement & Analysis for Marketing 10, no. 1 (08 2001): 26.
Gómez, Móica, and Shintaro Okazaki. "Estimating Store Brand Shelf Space."
International Journal of Market Research 51, no. 2 (03 2009): 243-266.
Gómez, Mónica, and Natalia Rubio. "Re-Thinking the Relationship between Store
Brand Attitude and Store Brand Loyalty: A Simultaneous Approach." International
Review of Retail, Distribution & Consumer Research 20, no. 5 (12 2010): 515-534.
Gomez-Arias, J., and Laurentino Bello-Acebron. "Why do Leading Brand
Manufacturers Supply Private Labels?" Journal of Business & Industrial
Marketing 23, no. 4 (06/15 2008): 273-278.
Granzin, Kent L. "An Investigation of the Market for Generic Products." Journal of
Retailing 57, no. 4 (Winter81 1981): 39.
Greenberg, Allan, and Sy Collins. "Paired Comparison Taste Tests: Some Food for
Thought." Journal of Marketing Research (JMR) 3, no. 1 (02 1966): 76-80.
Groznik, Ana, and H. S. Heese. "Supply Chain Conflict due to Store Brands: The Value
of Wholesale Price Commitment in a Retail Supply Chain." Decision Sciences 41,
no. 2 (05 2010): 203-230.
Hadary, Gideon. "The use of Taste Response Tests in Market Research." Journal of
Marketing 10, no. 2 (10 1945): 152-155.
Hansen, Karsten, and Vishal Singh. "Are Store-Brand Buyers Store Loyal? an Empirical
Investigation." Management Science 54, no. 10 (10 2008): 1828-1834.

50
Hansen, Karsten, Vishal Singh, and Pradeep Chintagunta. "Understanding Store-Brand
Purchase Behavior Across Categories." Marketing Science 25, no. 1 (Winter2006
2006): 75-90.
Herstein, Ram, and Sigal Tifferet. "An Investigation of the New Generic Consumer."
Journal of Consumer Marketing 24, no. 3 (04 2007): 133-141.
Jana, Reena. "The Revenge of the Generic." BusinessWeek Online (12/27 2006): 17-17.
Juan Beristain, Jose, and Pilar Zorrilla. "The Relationship between Store Image and
Store Brand Equity: A Conceptual Framework and Evidence from Hypermarkets."
Journal of Retailing and Consumer Services 18, no. 6 (11 2011): 562-574.
Koeppel, Jean. "Store Brands Vs. National Brands Who is Coming Out Ahead?" Brand
Packaging 14, no. 6 (07 2010): 22-24.
Kuan-Yin Lee, and Yin-Chiech Hsu. "Communication and Brand Knowledge as
Determinants of Retail Service Brand Loyalty - an Empirical Test in a Multiple
Retail Service Brand Context." Journal of Global Business & Technology 6, no. 1
(Spring2010 2010): 80-94.
Laforet, Sylvie. "Brand Names on Packaging and their Impact on Purchase Preference."
Journal of Consumer Behaviour 10, no. 1 (Jan 2011): 18-30.
Manzur, Enrique, Sergio Olavarrieta, Pedro Hidalgo, Pablo Farías, and Rodrigo Uribe.
"Store Brand and National Brand Promotion Attitudes Antecedents." Journal of
Business Research 64, no. 3 (3 2011): 286-291.
Martenson, Rita. "Corporate Brand Image, Satisfaction and Store Loyalty: A Study of
the Store as a Brand, Store Brands and Manufacturer Brands." International
Journal of Retail & Distribution Management 35, no. 7 (07 2007): 544-555.
Martos-Partal, Mercedes, and Óscar González-Benito. "Store Brand and Store Loyalty:
The Moderating Role of Store Brand Positioning." Marketing Letters 22, no. 3 (09
2011): 297-313.
Moore, Patricia. "Making it to the Finishing Line." NZ Marketing Magazine 28, no. 4
(05 2009): 36-40.
Oubiña, Javier, Natalia Rubio, and Maria Jesús Yagüe. "Effect of Strategy, Structure
and Performance Variables on Store Brand Market Share." Journal of Marketing
Management 23, no. 9 (11 2007): 1013-1035.
Parker, Philip. "Befriending the Private Label." Harvard Business Review 84, no. 2 (02
2006): 61-62.

51
Paul-Valentin, Ngobo. "Private Label Share, Branding Strategy and Store Loyalty."
Journal of Retailing and Consumer Services 18, no. 4 (7 2011): 259-270.
Richardson, Paul S., Alan S. Dick, and Arun K. Jain. "Extrinsic and Intrinsic Cue
Effects on Perceptions of Store Brand Quality." Journal of Marketing 58, no. 4 (10
1994): 28.
Richardson, Paul S., and Arun K. Jain. "Household Store Brand Proneness: A
Framework." Journal of Retailing 72, no. 2 (Summer96 1996): 159-185.
Shwu-lng Wu, and Jui-Ho Chen. "The Influence of Store Image, Store Satisfaction and
Store Loyalty on Store Brand Extension Acceptance: Evidence from Taiwanese 3c
Chain Store." Journal of International Marketing & Marketing Research 35, no. 2
(06 2010): 91-110.
Stuart, Stephen. "Grocers' Store Brands Losing Stigma, Gaining on Major Labels." New
Orleans CityBusiness (1994 to 2008) 22, no. 3 (07/16 2001).
Szymanski, David M., and Paul S. Busch. "Identifying the Generics-Prone Consumer:
A Meta-Analysis." Journal of Marketing Research (JMR) 24, no. 4 (11 1987): 425-
431.
Walker, Rob. "THE WAY WE LIVE NOW: 08-14-05: CONSUMED; Knockoff
Originals." New York Times Magazine (08/14 2005): 20.
Wells, L. E., H. Farley, and G. A. Armstrong. "The Importance of Packaging Design for
Own-Label Food Brands." International Journal of Retail & Distribution
Management 35, no. 9 (09 2007): 677-690.
Wheatley, John J., John S. Y. Chiu, and Douglas Allen. "Generics: Their Impact on
National and Private Brands." Advances in Consumer Research 9, no. 1 (01 1982):
195-200.
Yang, Defeng, and Xinxin Wang. "The Effects of 2-Tier Store Brands' Perceived
Quality, Perceived Value, Brand Knowledge, and Attitude on Store Loyalty."
Frontiers of Business Research in China 4, no. 1 (03 2010): 1-28.
Zielke, Stephan, and Thomas Dobbeistein. "Customers' Willingness to Purchase New
Store Brands." Journal of Product & Brand Management 16, no. 2 (04 2007): 112-
121.