frontiers of growth · 2011 outlook the stable growth outlook for the global economy in 2011 is...
TRANSCRIPT

SHIPBUILDING
ENGINE & MACHINERY
INDUSTRIAL PLANT & ENGINEERING
CONSTRUCTION EQUIPMENT
OFFSHORE & ENGINEERING
ELECTRO ELECTRIC SYSTEMS
GREEN ENERGY
FrontiersoF GrowthHyundai Heavy Industries Annual Report 2010
in UsD millions in KrW billions
Performance Overview 2010 2010 2009 2008
For the Year
sales 19,672.7 22,405.2 21,142.2 19,957.1
Gross Profit 4,100.7 4,670.3 3,144.8 3,145.1
operating income 3,019.9 3,439.4 2,222.6 2,206.2
net income 3,302.4 3,761.1 2,146.5 2,256.7
At Year-End
total Assets 25,364.9 28,888.1 24,872.6 25,280.4
total Liabilities 13,231.3 15,069.1 15,064.2 19,685.2
total Debt 3,026.9 3,447.3 889.6 3.3
total shareholders’ equity 12,133.6 13,819.0 9,808.4 5,595.2
Financial Indicators
Liabilities-to-equity 109.0% 109.0% 153.6% 351.8%
Debt-to-equity 24.9% 24.9% 9.1% 0.1%
ePs in KrW USD 54.27 61,807 35,705 37,340
eBitDA 3,452.1 3,931.6 2,668.2 2,597.0
eV/eBitDA (multiple) 9.3x 9.3x 5.0x 4.9x
roA 14.0% 14.0% 8.6% 10.7%
roe 31.8% 31.8% 27.9% 40.9%
Engine &Machinery
Electro ElectricSystems
ConstructionEquipment
Backlog in USD millions
08
09
10
7,086
5,722
5,312
Backlog in USD millions
08
09
10
1,397
1,839
2,673
Sales in KRW billions
08
09
10
2,522.1
2,771.5
2,834.7
Sales in KRW billions
08
09
10
1,924.5
2,712.1
3,242.2
Sales in KRW billions
08
09
10
1,768.6
1,190.4
2,274.6
Financial Highlights
Major Products
• Two- and Four-Stoke Diesel Marine Engines• HiMSEN Diesel Engines• Propellers and Crankshafts• Diesel and Gas Power Plant Engines• Industrial and Marine Pumps• Ballast Water Management Systems• Marine Thrusters• Industrial Robots
Sales Growth
Proportion of Sales
+2.3%
Since 1977, we have established ourselves as a world-class manufacturer of electrical systems for power generation, transmission, and distribution that are second to none. Today, we are an emerging global player in the solar and wind power fields with state-of-the-art manufacturing capabilities. We are also focusing on providing turnkey solu-tions for tomorrow’s energy markets.
Since 1979, we have established ourselves as the world’s No. 1 producer of two-stroke marine diesel engines with 35% of the market and over 100 million bhp produced to date. Today, we produce state-of-the-art engines for the marine and power generation industries as well as a wide range of industrial equip-ment for the shipbuilding, steelmaking, auto-mobile, and semiconductor industries.
Major Products
• Transformers• Gas Insulated Switchgear• Switchgear• Low- and Medium-Voltage Circuit Breakers• Rotating Machinery• Power Electronics and Control Systems• Wind Power Systems• Solar Power Systems
Proportion of Sales
Sales Growth +19.5%
Since 1985, we have been delivering qual-ity construction equipment and industrial vehicles to customers around the world. Today, our state-of-the-art automated manufacturing facilities in Korea, China, and India produce equipment that is sold and serviced through a global network of over 470 dealers in some 120 countries worldwide.
Major Products
• Excavators• Wheel Loaders• Forklifts• Skid Loaders
Proportion of Sales
Sales Growth +91.1%
Salesin KRW billions
08 19,957.1
09 21,142.2
10 22,405.2
TotalAssetsin KRW billions
08 25,280.4
09 24,872.6
10 28,888.1
EPSin KRW
08 37,340
09 35,705
10 61,807 08 09 10
Financial Stability Ratios Liabilities-to-Equity Debt-to-Equity
153.6%
9.1%
109.0%
0.1%
351.8%
24.9%
2010 HHI Foreign Ownership & Share Price Share Price Foreign Ownership
2010 HHI Share Performance vs. KOSPI 2010 KOSPI 2010 HHI
Korea’s benchmark KOSPI index delivered a strong performance in 2010, hitting its low in the first half and high in the second as it closed the year up 22% at 2,051 points. In the first half of the year, concerns about inflation due to excessive liquidity triggered interest rate hikes in China and other global markets. As the specter of financial crises in the PIGS—Portugal, Ireland, Greece, and Spain—loomed, the KOSPI fell, fluctuating between 1,550 and 1,750 points. In the second half of the year, recovering corporate profits and growing expectations for a US economic recovery together with the US’s quantitative easing policy attracted foreign capital to Korea, helping the KOSPI recover to close the year just above the 2,000-point mark. Foreign investors
followed up their 2009 KRW 30 trillion buying spree with another KRW 21 trillion in net purchases for the year. In contrast, domestic inves-tors showed a strong preference for safer assets, with institutional investors net selling KRW 12.4 trillion in fund holdings.
In 2010, our share price rose over 150% from its level early in the year, outperforming the market as the prospects of a shipbuilding recovery materialized. This growth was also considerably stronger than that of our peers, bolstered by our diversified business portfolio that contin-ued to grow even as shipbuilding sales declined.
Share Performance
*Won amounts for FY2010 have been translated at KRW 1,138.90 per USD 1.00, the basic rate as of Dec. 31, 2010.*EBITDA = Operating Income + Depreciation + Amortization *EV = Total Market Capitalizaion + Net Debt (Net Debt = Total Debt - Cash & Cash Equivalents - Short-term Financial Instruments - Short-term Investment Securities)
in UsD millions
Orders & Backlog 2010 2009 2008
Orders 17,209 10,735 27,473
Backlog 47,817 51,147 61,182
*The backlog above is on a delivery basis. Percentage-of-completion basis backlog was USD 31.7 bil. (2010), USD 37.9 bil. (2009), and USD 48.3 bil. (2008).
Stock Facts 2010 2009 2008
Face Value in KRW 5,000 5,000 5,000
Number of Shares Issued 76,000,000 76,000,000 76,000,000
Total Market Capitalization
in KRW billions 33,668 13,186 15,162
Share Price - High in KRW 456,500 250,000 438,000
- Low in KRW 171,000 148,500 115,500
- End in KRW 443,000 173,500 199,500
Foreign Ownership 20.2% 17.4% 14.8%
PER - High/Low 7.4x / 2.8x/ 7.2x 7.0x / 4.2x / 4.9x 11.7x / 3.1x / 5.3x
Dividend Per Share in KRW 7,000 3,500 5,000
Payout Ratio 11.3% 9.8% 13.3%
12.6% 10.2%35.0% 14.5%11.8%15.2%
11.3%
9.8%
13.3%08
09
10
5,000
Dividend Per Share Dividend Per Share Payout Ratio in KRW
Dividend Yield
3,500
7,000
2.5%
2.1%
Orders in USD millions
08
09
10
4,646
1,452
2,283
Orders in USD millions
08
09
10
2,281
2,556
3,793
Orders in USD millions
08
09
10
1,857
1,105
1,993
Shareholder Ownership
1 Chung Mong-joon 10.80%
2 Hyundai Mipo Dockyard 7.98%
3 KCC 6.72%
4 Mirae Asset Global Investments 4.27%
5 National Pension Service 3.68%
6 Hyundai Motor Company 2.88%
7 Asan Foundation 2.53%
8 Posco 1.94%
9 Treasury Shares 19.36%
10 Others 39.84%
Commentary
Shareholder Structure
12
3
45
6789
10
Jan0%
5%
10%
15%
20%
DecNovOctSepAugJulyJuneMayAprMarFeb0
100,000
200,000
300,000
400,000
500,000
in KRW
Jan0
DecNovOctSepAugJulyJuneMayAprMarFeb
80%
100%
20%
180%
140%
160%
60%
120%
40%
1.6%

Frontiers of GrowthAt Hyundai Heavy Industries, we believe in pushing the boundaries of technology to create the world’s best products. Over the nearly four decades we have been in business, our entrepreneurial spirit has enabled us to emerge as a global player in a growing number of fields beyond shipbuilding. Today, we continue to innovate across a wide spectrum of businesses and industries as we explore new frontiers of growth around the globe.
smart & sustainable
3032 Green Energy Division
36 Research & Development
Financial Highlights
HHI at a Glance
Share Performance
Highlights
14 Industrial Plant & Engineering Division
18 Engine & Machinery Division
22 Electro Electric Systems Division
26 Construction Equipment Division
strong & resilient
12
52 Management’s Discussion & Analysis
56 Independent Auditors’ Report
65 Financial Statements
106 Overseas Network
108 Affiliated Companies
50
Deep & Wide
0204 Shipbuilding Division
08 Offshore & Engineering Division
40 Message from the CEOs
42 Corporate Governance & Organization
44 Vision & Philosophy
46 HHI and the Community
48 HHI and the Environment
Global & Unlimited solid & steady
38

the oceans are a vast resource that both divides and connects us. At Hyundai Heavy industries, our leadership in shipbuilding and offshore engineering is enabling the world to bring more opportunities and energy to life.
Our Growth is Deep & Wide

Deep & Wide review of operations04 Hyundai Heavy industries Annual report 2010 05
Officially completed in March 2010, our new Gunsan shipyard cov-ers 1.8 million sqm and is capable of building 24 ships annually at its 1.3 million dwt dry dock. The yard successfully delivered its first ships in March 2010.
In July, we delivered our first 13,100 TEU containership to Rickmers of Germany. We delivered three more sister ships during the year, and four more are scheduled for delivery in 2011.
Gunsan shipyard investment
Containership delivery milestone
13,100 TEU
The world’s oceans are the new frontier of oil and gas
exploration. And drillships like the Deepwater Champion are the ultimate way to search them. Delivered in September 2010, this high-tech vessel ordered by Transocean is capa-ble of drilling up to 12 kilometers in up to 3.6 kilometers of water. Today, it is prospecting for ExxonMobil in the Black Sea, helping Turkey develop its offshore energy resources.
Deepwater Champion Drillship
12 km deep
KRW 1.2 trillion

Deep & Wide review of operations06 Hyundai Heavy industries Annual report 2010 07
444
2010 OverviewThe global shipbuilding industry delivered significantly higher growth than expected as a rapid global economic recovery spurred growing demand for ocean shipping. Container shipping rates in particular recovered faster than expected, producing a boost in containership orders in the second-half of the year. After bottoming out in the first half of the year, vessel prices rose 5% to 10% on average. According to Lloyd’s Register, the industry booked orders of 78 million gross tons (mgt) in 2010, more than double the 2009 total. Bulk carriers accounted for more than half the amount, and orders for large tankers also increased. While Chinese shipbuilders enjoyed growth due to captive domestic demand, lower vessel prices, and financial support from state-run banks, Korean shipbuilders continued to lead in high-value vessel categories such as containerships, large crude oil tankers, and specialty vessels.
2010 ReviewIn 2010, we booked orders for 55 vessels totaling USD 4 billion—an 815% increase—as we delivered 75 vessels for sales of KRW 7.8 trillion. Our Gunsan shipyard delivered its first 180,000-dwt bulk carrier in March 2010, the first of ten for the year. We also demonstrated our technical prowess in the special vessel field once again by delivering the Deepwater Champion drillship. This state-of-the-art vessel features a compact design, low fuel consumption, and a patented thruster canister design that allows on-site maintenance. At year-end, our orderbook of 200 vessels was worth USD 20.7 billion.
2011 Outlook The stable growth outlook for the global economy in 2011 is expected to spur growth in the ocean shipping and shipbuilding industries. The one factor that might dampen this outlook is the large number of vessels still on orderbooks across the industry. While this could conceivably lead to a downturn in tanker and bulk carrier orders, investment in containerships is expected to continue. Demand for drillships is projected to grow due to high oil prices, demand from the Brazilian market, and tighter regulation of aging offshore facilities in the wake of the oil rig disaster in the Gulf of Mexico. Demand for LNG carriers for delayed projects in Nigeria is also expected to rise, as is demand for shuttle tankers, large LPG carriers, and auto carriers.
We are targeting orders of USD 7.4 billion in 2011 as we work to maintain a solid two-year production backlog. We expect to deliver 110 vessels worth KRW 9.4 trillion. Our primary focus will continue to be on containerships, an area in which we are highly competitive. We aim to expand sales of special vessels, leveraging the successful delivery of the Deepwater Champion drillship last year and our acclaimed design capabilities to make inroads into the drillship market. We believe that our ongoing efforts to improve productivity and cut costs will enable us to maintain and sharpen our industry leading profitability in 2011. We also look forward to setting another milestone for the global shipbuilding industry when we become the first shipbuilder to surpass the 100 mgt production milestone in the first half of the year.
Gunsan Shipyard In March 2010, we officially completed our new Gunsan shipyard on Korea’s west coast. This state-of-the-art yard covers 1.8 million square meters and features a 1.3 million dwt dry dock that is the world’s largest. The yard delivered its first ships in March 2010.
Abdelkader LNG Carrier In February 2010, we delivered the 177,000-cum Atlantic Max LNG carrier to Mitsui OSK Lines of Japan. The tri-fuel diesel-electric propulsion system is capable of burning natural or forced boil-off gas, marine diesel oil, or heavy fuel oil. The vessel sails under a long-term charter for the ExxonMobil-led Papua New Guinea LNG project, supplying LNG mainly to Japan.
08
09
10
9,084.9
Sales in KRW billions
Shipbuilding Division
08
09
10
Orders in USD millions
13,635
9,002.6
7,849.2
4,061
2010 Order Breakdown by Value
1 Tankers: 52%
2 Containerships: 1%
3 Bulk Carriers: 25%
4 LPG Carriers: 7%
5 Special & Naval: 8%
6 Others: 7%
1
56
4
2
3
At Hyundai Heavy Industries, we build some of the world’s most advanced ships. Our most recent drillship—Deepwater Champion—is a prime example. Capable of drilling up to 12 kilometers in depths of up to 3.6 kilometers, this state-of-the-art drillship is equipped with the most advanced positioning and automated control systems to keep drilling operations running smoothly in even rough seas.

Deep & Wide review of operations08 Hyundai Heavy industries Annual report 2010 09
The world’s oceans hold untold reserves of oil and gas. And floating production and offloading vessels like the Usan FPSO
are the ultimate way to develop them. Scheduled for delivery in April 2011, this ultra-large vessel ordered by Total E&P Nigeria Limited (TEPNG) in February 2008 has a crude oil storage capacity of 2 mmbbl and will be stationed in waters about 100 km southeast of Bonny Island, Nigeria.
Usan FPso
2 mmbbl of storage
In February 2010, we signed a turnkey agreement for the Shwe gas production and processing platform project in Myanmar. Scheduled for completion by March 2013, the EPC project includes a 40,000-ton offshore gas platform, subsea facilities, and onshore terminal.
Myanmar shwe gas project
In October 2010, we won an EPC order from PTT Exploration & Pro-duction of Thailand for two spur lines totaling more than 70 km to connect the PTT Third Transmission Pipeline to the Platong 2 and Great Bongkot South production platforms.
thai Gas spur Lines project
USD 1.4 billion USD 71 million

Deep & Wide review of operations10 Hyundai Heavy industries Annual report 2010 11
2010 OverviewThe recovery of the global economy in 2010 led to greater demand and higher prices for oil, spurring recovery in the offshore oil and gas exploration field, a sector that had seen a number of projects either delayed or cancelled in the wake of the global financial crisis. According to Douglas-Westwood, approximately 33% of global oil production was from offshore fields in 2010, a figure that is projected to rise to 35% by 2020. Accounting for just 3% of total production in 2002 and 6% in 2007, deepwater offshore production is on track to reach 10% by 2012 as investment pours into this field. Industry capex investment currently totals USD 250 billion annually, a figure that is forecast to rise roughly 10% annually through 2013.
2010 ReviewIn 2010, we booked orders of USD 3.07 billion and sales of just over KRW 3.4 trillion. Balanced between fabrication and installation, the year’s orders included the USD 1.1 billion Goliat FPSO—the world’s largest cylindrical FPSO to date—from Eni Norge of Norway, the USD 1.4 billion turnkey Shwe gas platform project in Myanmar, and four pipeline projects. Coming on the heels of our groundbreaking win of modules for Australia’s Barrow Island LNG plant in 2009, these projects moved us steadily closer toward our goal of operating in all segments of the offshore and onshore facilities industry.
2011 Outlook Rising demand, lower crude inventories, abundant liquidity, and a weakening US dollar all point to higher international crude oil prices in 2011. These factors, combined with the current ongoing political unrest
across the Middle East and limited OPEC reserve capacity, indicate the likelihood of oil prices rising well above USD 100 per barrel.
As global demand for energy continues to rise, the pace of deepwater energy development will naturally increase. The top-five global majors plan to invest USD 128 billion in 2011, returning investment to its pre-crisis level. Floaters such as FPSOs and, over the longer term, floating LNG (FLNG) units are projected to be in demand in Australia, Africa and Latin America. Petrobras of Brazil has announced ambitious plans that call for an investment of USD 174 billion through 2013 to add dozens of new drilling rigs, floaters, and platforms through 2018. While the opportunities for growth are significant, there are also emerging challenges. Oil producing countries like Brazil, Nigeria, and Angola are becoming increasingly assertive in requiring local fabrication. Other countries such as China, Indonesia, and Malaysia are also adding local content and local contractor requirements to their tenders.
Looking forward, the key drivers of sales and profitability will be integrated onshore and offshore projects as well as onshore oil and gas processing and storage facilities for upstream oil and gas plant projects focusing on Australia, Africa, and the Middle East. In 2011, we are aiming for orders of USD 4.8 billion balanced between our fixed platform, floating unit, and subsea pipeline businesses. We will also be progressively expanding into promising new markets such as onshore plant LNG module fabrication and FLNG units, developing new products, and partnering with local production yards around the world to satisfy local content requirements.
North Rankin B Topsides The North Rankin-2 (NR2) proj-ect for Woodside Energy of Australia is designed to recover the remaining low pressure gas from the North Rankin and Pegasus gas fields off the northwest coast of Western Australia. The 29,000-ton North Rankin B topsides are scheduled for sail-away in December 2011.
Goliat FPSO In February 2010, we won the USD 1.1 billion Goliat FPSO EPC project from Eni Norge of Norway. The world’s larg-est cylindrical FPSO to date, the Goliat will have an oil production capacity of 110,000 bopd, a gas production of 3.9 mmscmd, and an oil storage capacity of 1 mmbbl. It is scheduled to begin production in the Barents Sea off the northern coast of Norway in 2013.
Offshore & Engineering DivisionAt Hyundai Heavy Industries, we build some of the world’s most advanced offshore facilities. The Usan FPSO for Total E&P Nigeria Limited is a prime example of why we are No. 1 in this vessel category. Scheduled to begin production in early 2012, Usan is capable of processing 160,000 bopd and 5 mmscmd. It is our ninth new-build FPSO to date with a capacity of 2 mmbbl or more.
2010 Order Breakdown by Value
1 Fixed Platforms: 49%
2 Floating Units: 42%
3 Pipelines & Others: 9%1
3
2
3,412.8
08
09
10
Sales in KRW billions
3,423.5
3,095.1
08
09
10
Orders in USD millions
2,978
3,069
2,352
Our Growth is Strong & Resilientthe earth is a vast resource that we must develop wisely and sustainably. At Hyundai Heavy industries, our balanced and diversified portfolio of businesses is helping the world build the infrastructure essential to sustainable growth.

review of operations14 Hyundai Heavy industries Annual report 2010 15
iter vacuum vessel project
strong & resilient
In June 2010, we won an EPC project from Dhuruma Electricity Company to build the Riyadh PP11 1,729 MW gas-fired combined-cycle power plant. The plant is scheduled to come on-line by 2013.
saudi Arabia iPP project
In January 2010, we signed an MoU with Korea’s National Fusion Research Institute to provide two vacuum vessels and 35 ports for the ITER fusion energy project in France. Deliveries are expected to begin at the end of 2016.
Gas-to-liquids projects like Qatar Petroleum and Shell’s Pearl GTL in Qatar are the ultimate way to turn natural
gas into cleaner-burning fuels. In March 2011, we completed the EPC feed-gas preparation facilities for the first train. When the second train comes online in late 2011, the project will produce 140,000 bbl/d of clean liquid products, including naphtha and low-sulfur diesel.
Pearl GtL Project
140,000 bbl/dayUSD 1.6 billion USD 119 million

review of operations16 Hyundai Heavy industries Annual report 2010 17
2,010
2010 OverviewThe Middle Eastern power plant market continued to tender both EPC and independent power projects in 2010, with Saudi Arabia and Kuwait leading the way. In contrast, the region’s oil and gas plant market experienced a decline in major tender activity following the award of the USD 1 billion Das Island gas processing facility project in Abu Dhabi in mid-2009. This downturn in demand, combined with an influx of new competitors into the market, made an already intensely competitive environment even more challenging in 2010. That said, stable oil prices during the year allowed a number of plant projects that had been on hold to move forward.
2010 ReviewAlthough orders fell 29% to USD 2.0 billion in 2010 due largely to a lack of oil and gas plant orders, revenues rose 39.3% to KRW 2.6 trillion as we continued to make progress on our multi-year orderbook. In the power plant segment, we won the USD 1.6 billion Riyadh PP11 independent power project from the Dhuruma Electricity Company of Saudi Arabia. This major EPC project includes a 1,729 MW gas-fired combined-cycle power plant scheduled for completion in 2013. In the equipment segment, orders for specialty and high-precision products for projects such as the ITER fusion reactor in France rose 11% for the year, generating USD 264 million of the total.
2011 Outlook Faced by rapidly growing demand for power, the Middle Eastern power plant market is increasingly tendering large-scale plant
projects. Privately-financed projects are gaining momentum as a way to meet the financial challenges of these major tenders. The oil and gas plant market is also primed for growth as rising oil prices set the stage for new investment in the segment. That said, there are a number of formidable challenges ahead. The oil majors are requiring EPC contractors to meet increasingly strict health, safety, and environmental standards. Project owners are also requiring higher local content and participation ratios to bolster local industries.
As a respected EPC player in the Middle Eastern industrial plant market, we are well positioned to benefit from the current market trends. In 2011, we are aiming for orders of USD 3.8 billion and sales of KRW 3.0 trillion. In the power plant segment, we will be targeting combined-cycle power projects with a focus on the six GCC nations. We will also be pursuing combined-cycle and thermal power projects in major markets across Africa, Latin America, and Asia.
In the oil and gas plant segment, we will continue to forge strategic partnerships with engineering firms to increase our odds of success as we bolster sales efforts in traditional markets such as the Middle East and Nigeria—a resurgent market in which we have extensive experience. We will target new industrial facility projects in our home market of Korea as well as Latin America and Central Asia. We also plan to expand into the petrochemical and LNG plant fields, as well as specialty fields such as major equipment for nuclear power plants. In all of the above cases, our extensive onshore and offshore expertise will give us a distinct competitive advantage on projects that have a mixture of onshore and offshore components.
Industrial Plant & Engineering DivisionAt Hyundai Heavy Industries, we build some of the world’s most advanced industrial plant facilities. The Al Dur independent power plant project commissioned by Bahrain’s Ministry of Finance is a prime example. Scheduled for completion in June 2011, this EPC build-own-operate plant will generate 1,234 MW of power and over 218,000 cum/d of water to meet the growing needs of the kingdom.
strong & resilient
08
09
10
1,374.4
Sales in KRW billions
2,644.5
08
09
10
2,076
Orders in USD millions
2,826
2010 Order Breakdown by Value
1 Power Plants: 80%
2 Oil & Gas Plants: 7%
3 Plant Equipment: 13%
1
3
2Mina Al Ahmadi Oil Terminal Project In June 2010, we wrapped up major work on the USD 699 million onshore portion on this USD 1.25 billion terminal expansion project. Won from Kuwait Oil Company back in 2005, the project increases the terminal’s capacity by 1 mmbopd to 3 mmbopd.
Riyadh PP11 IPP Project In June 2010, we won a USD 1.6 billion EPC con-tract with Dhuruma Electricity Company of Saudi Arabia to build a 1,729 MW gas-fired combined-cycle power plant to help meet the kingdom’s long-term power requirements. The plant is scheduled to begin operations in 2013.
1,897.9

review of operations18 Hyundai Heavy industries Annual report 2010 19
In April 2010, we won an order for 120 Packaged Power Station (PPS) contain-erized diesel generating sets from Electricidad de Caracas. The generators are now providing power to 200,000 households in Venezuela’s Moron and Guac-ara regions.
In March 2010, we surpassed the 20 million bhp four-stroke engine produc-tion milestone with the testing of our 9,089th engine. We currently hold a 25% market share in this engine category.
Venezuela PPs order
Four-stroke engine milestone
strong & resilient
The world moves over 90% of international
cargo by ocean today. And two-stroke engines like the Hyundai-MAN B&W and Hyundai-Wärtsilä are the ultimate way to power them. On September 29, 2010 just over 31 years after we delivered our first marine diesel engine in June 1979, we surpassed the 100 million bhp cumulative production milestone as we started up our 3,369th and 3,370th engines. Today, we have a 30 million bhp lead and growing over our closest competitor.
two-stroke engine Production Milestone
100 million bhp
USD 160 million
20 million bhp

review of operations20 Hyundai Heavy industries Annual report 2010 21
2010 OverviewThe global marine engine industry benefitted from rising demand for newbuild vessels as the global economy continued to recover. Lower vessel prices also spurred orders for short-lead-time deliveries. Demand from China was the exception to this upward trend due to rising local capacity as well as national policies favoring locally-built engines.
The power plant engine industry also benefitted from global economic recovery as demand from both national and independent power utilities grew. In the machinery sector, demand for industrial pumps continued to grow primarily due to power and desalination projects in the Middle East. Demand for robotic systems also rebounded as investment in the auto and LCD sectors picked up.
2010 ReviewSteady recovery in the marine engine market and growth in the power plant engine market helped boost orders 57% to nearly USD 2.3 billion in 2010. Orders for marine engines from other Korean shipbuilders grew 20%. Orders from Chinese shipbuilders for short-lead-time deliveries or complete knock-down production rose 93%. We continued to lead the global two-stroke engine segment with a 35% share worldwide and 47% share in Korea as we surpassed the 100 million bhp production milestone.
Our power plant engine business generated order growth of 174% as we won major projects in Ecuador, Venezuela, and Bangladesh and
captured our first nuclear power plant emergency backup generator order. As HiMSEN engine orders surpassed 5,900 units, we also launched the H35G high-output gas engine that is considerably cleaner and greener than its diesel equivalents.
Our machinery business posted its best performance to date as orders rose 51%, making us a major industrial pump player in the Korean marine pump market as well as the global power and desalination plant markets. We also won orders for over 3,200 industrial robots from manufacturers in Russia, China, and Korea.
2011 OutlookDemand for marine engines is poised to rise as Asia’s emerging shipyards win new vessel orders. In the power plant engine field, we expect demand for our Packaged Power Station containerized diesel generating sets to continue to grow in markets such as Panama, Mexico, Brazil, Iran, and Syria. We also expect orders for ballast water management systems, industrial pumps, and robots to be robust.
Our order target for 2011 is USD 3.2 billion. On the engine side, we will be targeting short-lead-time and complete knock-down marine engine orders as well as opportunities in the LNG gas and high-output diesel power plant engine markets. On the machinery side, we will be focusing on new and replacement sales in the industrial robot market.2010 Order Breakdown
by Value
1 Marine Engines: 64%
2 Power Plant Engines: 19%
3 Industrial Pumps: 7%
4 Robotic Systems & Others: 10%
1
4
3
2
Four-Stroke Engine Milestone In March 2010, we set a world record by surpassing the 20 million bhp cumulative production milestone for four-stroke engines in just under 20 years. We have the ability to build over 1,800 four-stroke engines ranging from 600 to 13,000 bhp annually, accounting for roughly 25% of global demand in 2009.
HiMSEN H35G Gas Engine In May 2010, we unveiled Korea’s first high-output gas engine. In addition to advanced lean-burn technology for supe-rior fuel efficiency, the eco-friendly H35G produces 13,000 bhp while generat-ing 20% less CO2 and 97% less NOX over comparable diesel engines.
Engine & Machinery DivisionAt Hyundai Heavy Industries, we build some of the world’s most powerful engines. The massive two-stroke marine engines that power our ships are a prime example. While it took us 13 years to reach the 10 million bhp production milestone, we now deliver over 10 million bhp annually. The world’s No. 1 maker, we have delivered 10 million bhp annually since 2005, surpassing the 100 million bhp milestone in 2010.
strong & resilient
08
09
10
Sales in KRW billions
08
09
10
Orders in USD millions
2,522.1
4,646
2,771.5
2,834.7
1,452
2,283

review of operations22 Hyundai Heavy industries Annual report 2010 23
In May 2010, we signed a ten-year USD 600 million contact to supply Southern California Edison with transformers ranging in capacity from 230 kV to 500 kV through 2019. We now have a 40% market share for high-voltage transformers in North America.
In December 2010, we signed a five-year USD 113 million contract to supply the National Grid of the UK with 400 kV transformers from 2012 through 2016. This contract made us the first Korean transformer maker to surpass USD 1 billion in overseas sales.
Us transformer contract
UK transformer contract
USD 600 million
USD 113 million
strong & resilient
The world’s appetite for power is growing
day by day. And transformers like these 500 kV units are the ultimate way to deliver it. We now produce a full lineup of transformers from 200 kV to 800 kV at a 120,000 MVA facility—the world’s largest of its kind—in Ulsan, Korea and a 5,000 MVA facility in Sofia, Bulgaria. We are now building a 14,000 MVA facility in Montgomery, Alabama in the US that is scheduled to begin production by early 2012.
transformer Production Milestone
700,000 MVA

review of operations24 Hyundai Heavy industries Annual report 2010 25
2010 OverviewThe global electrical equipment industry experienced an overall downturn in demand in 2010 as a sluggish economic recovery in the US and financial instability in southern Europe led to a slowdown in infrastructure investment. The market was driven primarily by firm demand for replacement equipment in the US as well as power infrastructure expansion projects in fast-growing emerging markets in the Middle East, Brazil, and India.
2010 ReviewOrders rose 48.4% to nearly USD 3.79 billion, nearly 20% of which came from our solar and wind businesses. All businesses enjoyed solid growth, led by transformers (+35%), circuit breakers (+57%), switchgear (+24%), rotating machinery (+4%), and photovoltaic systems (+182%). Our fledgling wind business also got off to a strong start with orders of USD 183 million in its first full year in operation.
In the US, our ability to forecast the replacement equipment requirements of existing customers combined with strategic capacity expansion to ensure fast delivery enabled us to be highly competitive and win new orders. As economic recovery continued to drive infrastructure investment in the Middle East and emerging markets, we executed an aggressive marketing strategy to increase our market share, making rapid market penetration a top priority.
We recorded a number of major achievements in 2010. We surpassed the 700,000 MVA transformer shipment milestone. Our 145 kV gas-insulated switchgear and marine ring main unit won
the “World Class Product of Korea” designation in recognition of their global top-5 market share. We broke ground for a 14,000 MVA transformer plant in the US. We signed of a USD 700 million EPC contract with Matinee Energy to build two solar power plants in the US. We also signed an MoU with Saint-Gobain of France to build a 100 MW CIGS thin-film solar module plant in Korea. Last, but not least, we completed a 600 MW capacity wind turbine assembly facility in Korea as we prepared for growth in the renewable energy field.
2011 OutlookThe market for electrical equipment is expected to be flat in developed markets such as North America and Europe in 2011. In emerging markets in Asia and Latin America, steadily rising infrastructure investment is expected to drive demand, with India and Brazil leading the way. In the Middle East, rising demand for power and water will drive expansion of desalination, power, and related infrastructure projects. Across the board, price competition is expected to intensify as market leaders seek to protect their lead and new competitors enter the market.
In 2011, we are targeting orders of USD 3.7 billion and sales of KRW 3.4 trillion, excluding wind and solar, which will be spun off into the new Green Energy division. Dramatically strengthened by our 2010 acquisition of Hyundai Corporation, our expanded global sales network and growing overseas production capability in strategic markets such as the US and India is setting the stage for greater synergy in the coming years.
US Transformer Plant In July 2010, we broke ground for Hyundai Power Transformers USA, our first US transformer production facility. Located in Montgomery, Alabama, the USD 90 million plant will have an annual capacity of 14,000 MVA when it comes online by early 2012, producing transformers of up to 765 kV.
TPRS Transformers In 2006, we developed the world’s first transformer equipped with a tank pressure relief system (TPRS). When standard transformers experience abnormal voltage due to a lightning strike or switching surge, the rapid change in pressure often leads to an explosion. TPRS provides a passive relief mechanism that helps prevent the rupture of insulation-oil tanks.
Electro Electric Systems DivisionAt Hyundai Heavy Industries, we build some of the world’s most advanced power distribution equipment. Our 800 kV gas-insulated switchgear (GIS) that we began deliveries of back in 2000 is a prime example. We are a pioneer in GIS technology, delivering a wide range of solutions to meet the needs of today’s ultra-high-voltage substations.
strong & resilient
08
09
10
1,924.5
2,712.1
Sales in KRW billions
3,242.2
08
09
10
Orders in USD millions
3,793
2010 Order Breakdown by Value
1 Transformers: 39%
2 Circuit Breakers: 14%
3 Switchgear: 10%
4 Rotating Machinery: 13%
5 Solar Power Systems: 15%
6 Wind Power Systems: 5%
7 Others: 4%
1
4
5
6 7
32
2,556
2,281
review of operations26 Hyundai Heavy industries Annual report 2010 27
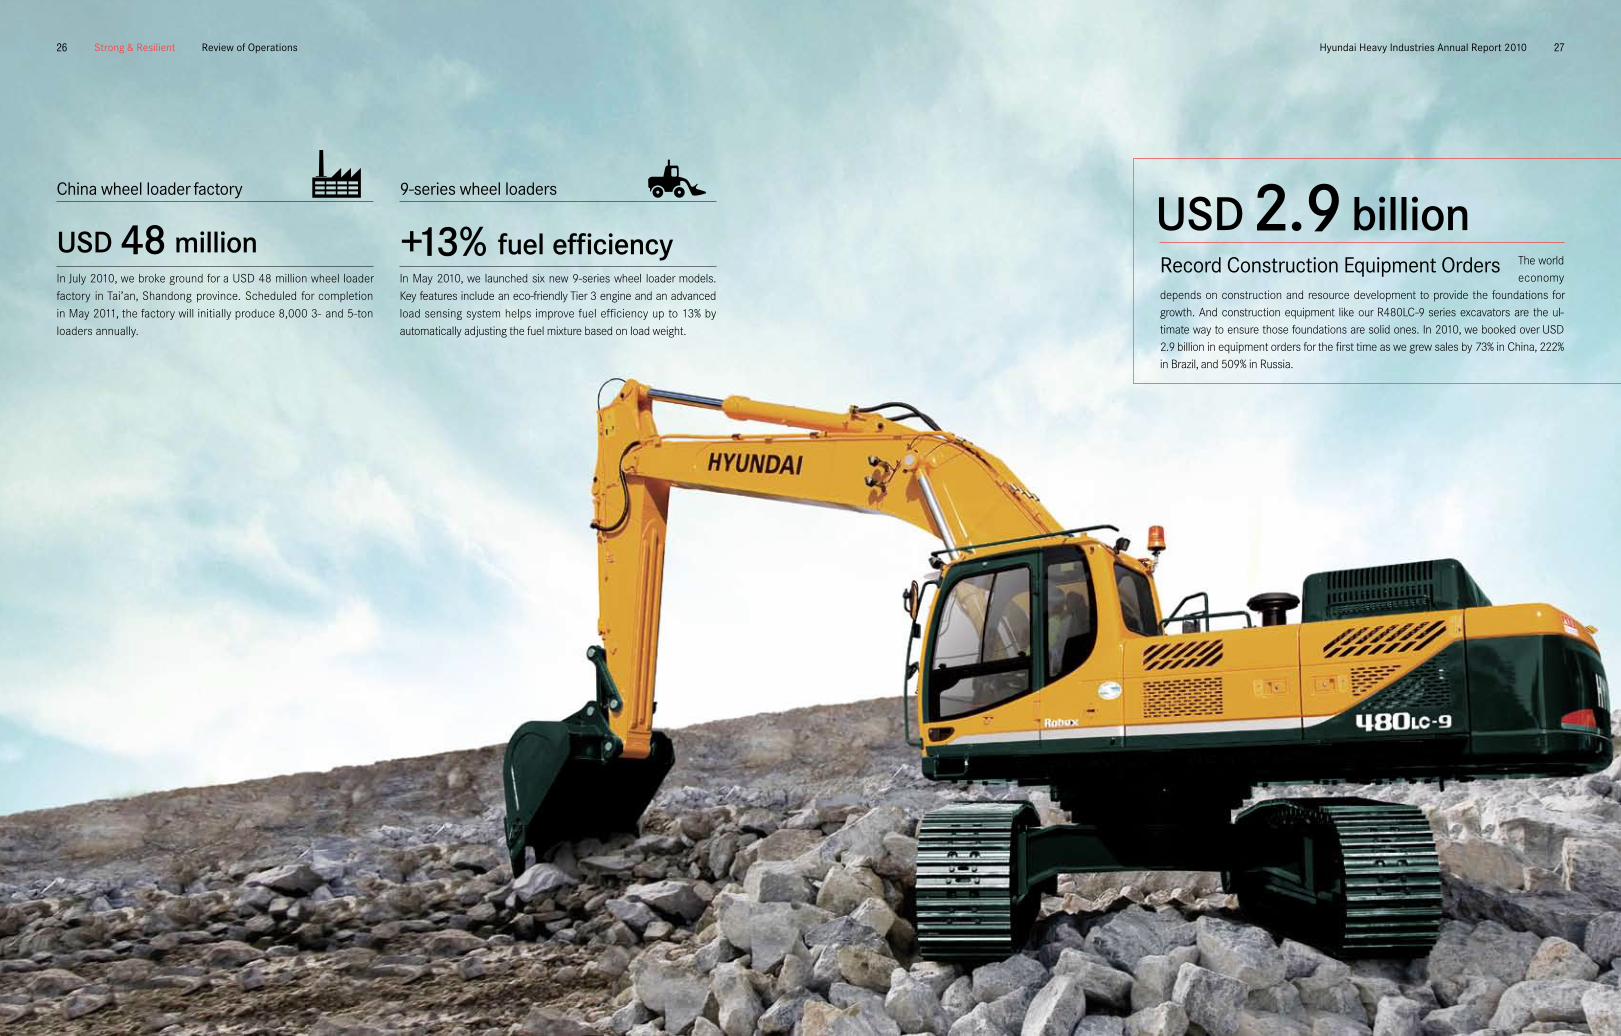
In July 2010, we broke ground for a USD 48 million wheel loader factory in Tai’an, Shandong province. Scheduled for completion in May 2011, the factory will initially produce 8,000 3- and 5-ton loaders annually.
China wheel loader factory
USD 48 millionIn May 2010, we launched six new 9-series wheel loader models. Key features include an eco-friendly Tier 3 engine and an advanced load sensing system helps improve fuel efficiency up to 13% by automatically adjusting the fuel mixture based on load weight.
9-series wheel loaders
+13% fuel efficiency
strong & resilient
The world economy
depends on construction and resource development to provide the foundations for growth. And construction equipment like our R480LC-9 series excavators are the ul-timate way to ensure those foundations are solid ones. In 2010, we booked over USD 2.9 billion in equipment orders for the first time as we grew sales by 73% in China, 222% in Brazil, and 509% in Russia.
record Construction equipment orders
USD 2.9 billion

review of operations28 Hyundai Heavy industries Annual report 2010 29
2010 OverviewThe global construction equipment market enjoyed significantly higher growth in 2010 as emerging markets in China, India, Latin America, and Southeast Asia saw robust economic growth and governments around the world continued to invest in infrastruc-ture. Excavator demand in China rose 75%, supported by economic stimulus programs, major infrastructure projects such as the Great Western Development Strategy, and growing investment in con-struction, making it by far the world’s largest market for construction equipment. The Korean market also saw brisk growth of about 10% for the year, driven primarily by major national projects. While North America, Europe, and other developed markets also showed signs of recovery, it may be a while before demand returns to pre-crisis levels, making China, India, and other emerging markets even more crucial to the continued growth of the industry.
2010 ReviewIn 2010, consolidated sales rose 65% to USD 2.9 billion. Virtually all geographic markets—and emerging markets in particular—enjoyed significant gains due to economic stimulus policies. We continued to deliver strong growth in emerging markets in India, the Middle East, South America, Russia, and Asia, with sales gains exceeding 100%. In China, excavator sales rose over 70% as rapid growth pushed our market share above 11%.
2011 OutlookWe expect the global construction equipment market to continue to grow in 2011, with emerging markets leading the way. In China, rail-way construction and mine development look to spur growth in the construction equipment segment. In India, demand will be driven by accelerating investment in roads, ports, and other infrastructure projects. Growth is also expected to be robust in Brazil, Russia, and other emerging markets due to expanding investment in resource development and infrastructure.
Given the favorable market outlook for 2011, we have set an aggres-sive order target of USD 4.0 billion. We are in the process of upgrad-ing our sales organization and formulating a comprehensive market-ing strategy to ensure a successful entrance into this new market segment. Globally, we will continue to target strategic markets by increasing financial support, expanding our sales network, and de-livering 9-series models tailored to meet local needs. We will also continue to improve customer satisfaction by improving our pre- and post-sale service, leveraging our high-tech Hi-mate remote manage-ment system to help equipment owners ensure their investment is properly protected and maintained. In the first half of the year, we will enter the world’s largest wheel loader market with the comple-tion of a new plant in Tai’an, China.
08
09
10
1,190.4
1,768.5
Salesin KRW billions
2,274.6
Construction Equipment DivisionAt Hyundai Heavy Industries, we build some of the world’s most advanced construction equipment. The cutting-edge technology that goes into our machines is a major differentiator. In 2010, we continued to improve the operating and fuel efficiency of our excavators. We also launched an electric model during the year, and are preparing to launch hybrid diesel-electric models in 2011.
strong & resilient
2010 Order Breakdown by Value
1 Excavators: 77%
2 Wheel Loaders: 7%
3 Fork Lifts: 9%
4 Others: 7%
1
4
3
2
08
09
10
Orders in USD millions
1,993
1,857
1,105
HL770-9 Wheel Loader Launched in May 2010, this new 9-series wheel loader is equipped with a powerful-but-efficient Tier 3 engine paired with an intelligent load sensing system that continuously adjusts fuel injection based on the load, decreasing fuel consumption by 13%.
Hi-Mate Remote Management System A standard feature on all 9-series construction equipment, the Hi-mate remote management system enables owners to monitor the location and operating status of their investments from anywhere in the world using Internet and GPS technology.

Our Growth isSmart & Sustainablethe skies are a vast resource that we are just beginning to tap. At Hyundai Heavy industries, our focus on vertical integration in the solar and wind power fields is enabling the world to make tomorrow’s skies cleaner and bluer.
review of operations32 Hyundai Heavy industries Annual report 2010 33smart & sustainable
The world is actively embracing renew-ables as a key component of its long-
term energy strategy. And wind power will be playing a big part in it. We are gearing up to meet de-mand by launching production at a joint-venture 600 MW plant in Weihai, China in January 2011 with Datang Shandong Power Generation, a subsidiary of that nation’s second-largest state-owned power company. We also plan to set up production facilities in other strategic markets such as the US in the coming years.
JV Wind turbine Plant in China
600 MW
In December 2010, we signed an MoU with Saint-Gobain of France to build a joint-venture thin-film solar module plant in Korea. The 100 MW first phase is scheduled to begin production in the second half of 2012.
CiGs solar module plant
100 MW
offshore wind turbine project
In June 2010, we expanded our alliance with American Su-perconductor to develop a 5.5 MW offshore wind turbine. We plan to begin volume production by the end of 2012.
5.5 MW class

review of operations34 Hyundai Heavy industries Annual report 2010 35
2011, we completed a 600 MW joint-venture production facility in Weihai, China capable of building 300 2.0 MW turbines annually. We also plan to complete a US production facility by 2013 to facilitate our expansion into markets in the Americas.
2010 OverviewThe renewable energy sector enjoyed robust growth in 2010, buoyed by recovering global markets, favorable government policies, and falling costs. The global solar power market recovered strongly from the downturn that hit in 2009 as government incentives and lower material and component costs helped growth more than double from 7.2 GW to 17 GW, led primarily by demand from Europe. The global wind power market also delivered solid growth of 10.3%, add-ing an estimated 42 GW of new capacity during the year, led by ris-ing demand from the US, Southeast Asia, and Europe.
2010 ReviewIn 2010, solar power orders surged 182% to surpass USD 575 mil-lion. Nearly 97% of orders came from overseas customers, including just over 72% from customers in Germany and Italy, two markets that we actively focused on. Wind power orders got off to a solid start, reaching USD 183 million as we moved forward with major projects in Korea and booked and delivered a number of 1.65 MW and 2.0 MW turbine orders from the US, Finland, and other Euro-pean markets.
We significantly enhanced our production capacity and value chain in the photovoltaic field during the year as we continued to pursue turnkey renewable energy projects in our home market. We expand-ed photovoltaic cell capacity from 330 MW to 370 MW and module capacity from 320 MW to 510 MW through efficiency gains at our Eumseong plant. We also have a number of major wind projects un-der construction in Korea, including three sites in Gangwon province
totaling 64 MW and two sites in South Jeolla province totaling 70 MW, with additional projects in Gyeonggi province on the drawing board.
2011 OutlookAlthough shrinking financial incentives will dampen growth as governments tighten their financial belts, global demand for both solar and wind power is projected to steadily rise for the foreseeable future. In 2011, installed solar and wind generation capacity is ex-pected to grow around 20% to 20 GW and 7% to 45 GW, respectively.
We are currently investing to expand our product and solution line-ups and production capabilities in both fields as we gear up to meet demand in upcoming years. On the solar side, we aim to expand our photovoltaic cell capacity from 370 MW to 580 MW and module capacity from 510 MW to 1 GW by the end of 2011. We are evaluat-ing the feasibility of setting up polysilicon ingot and wafer facilities to complete vertical integration in the photovoltaics field. We are also building a joint-venture thin-film solar module plant in Korea with Saint-Gobain of France that is scheduled to begin producing 100 MW of CIGS (copper, indium, gallium, selenide) modules annually starting in the second half of 2012.
On the wind side, we are now expanding our wind turbine lineup to include both onshore and offshore models ranging from 1.65 MW to 5.5 MW as we move forward with plans to expand production output at our Gunsan plant to 800 MW by 2013. We are also moving forward with construction of a number of overseas plants. In early
08
09
10
107
Sales in KRW billions
150
597
08
09
10
128
204
Orders in USD millions
758
1.65 MW Wind Turbine In October 2009, we began volume production of 1.65 MW and 2.0 MW doubly-fed induction wind turbine designs licensed from AMSE Windtec. In June 2010, we deepened our strategic alliance to include the joint develop-ment a 5.5 MW full conversion turbine for the bur-geoning offshore wind industry.
Gunsan Wind Turbine Plant In March 2010, we launched production of 1.65 MW turbines at our Gunsan plant, a 600 MW capacity facility we plan to expand to 800 MW by 2013. We also launched pro-duction at a joint-venture 600 MW facility in Weihai, China in January 2011. We plan to begin deliveries from a US plant in 2013.
Green EnergyDivisionAt Hyundai Heavy Industries, we build some of the world’s most advanced renewable energy solutions. Our state-of-the-art photovoltaic technology and use of high-grade materials to ensure the highest efficiency and reliability are a prime example. The 7.7 MW Dithmarschen Solar Park completed in Germany in May 2010 is just one of a growing number of projects we are installing across Europe.
smart & sustainable

review of operations36 Hyundai Heavy industries Annual report 2010 37
Research &DevelopmentOur leadership in the shipbuilding and heavy manufacturing industries is built on a tradition of innovation. Our unique research organization gives us a powerful competitive advantage that ensures our long-term growth and profitability in the increasingly competitive global marketplace.
smart & sustainable
At Hyundai Heavy Industries, innovation is an integral part of our corporate DNA. On average, our research organization has well over 1,000 projects underway at any given time. Augmented by institutes in Hungary and China as well as a growing number of international partnerships, our four Korea-based research institutes are the cre-ative dynamos that have helped us achieve a top-five global market share in 31 product categories to date, including 2 in 2010. Our goal is to expand this number to 35 categories in 2011.
In 2010, we invested KRW 187 billion in R&D. We plan to invest KRW 295 billion in 2011—a 58% increase and the equivalent of 1.1% of our projected sales—as we continue to innovate to enhance our global competitiveness.
R&D StrategiesIn 2011, we will continue to rely heavily on our world-class R&D orga-nization for the innovations that will drive growth in today’s increas-ingly competitive global marketplace. The following five strategies will guide us over the coming year.
• We will continue to pursue product and process innovation in each of our five r&D areas.• We will strengthen inter-division cooperation.• We will foster elite, world-class research personnel.• We will strengthen and expand our global r&D network.• We will adopt and implement a performance-based evaluation system.
Hyundai Maritime Research Institute (HMRI)Founded in 1984, HMRI brings together the crucial engineering and performance testing capabilities that make our ships, offshore structures, engines, pumps, and construction equipment among the world’s best. Key areas of research include ship hydrodynamics, offshore engineering, structural design, noise and vibration control, engine performance, and machinery design.
In 2010, HMRI developed core engineering technologies related to floating LNG (FLNG) unit hull design and offloading availability. De-veloped as part of a front-end engineering and design (FEED) study for the Petrobras FLNG project in Brazil, these advances give us a valuable competitive edge in a lucrative and increasingly competi-tive new offshore structure segment.
Hyundai Industrial Research Institute (HIRI)Founded in 1983, HIRI’s mission is to optimize every aspect of engi-neering, productivity, and quality from the drawing plans to the dry docks. Key areas of research include welding, casting and forging, materials, manufacturing automation, oil and gas system process optimization, alternative energy, pollution control, coatings, and cor-rosion protection.
In 2010, HIRI completed a 100-ton/day reverse osmosis (RO) desalination pilot plant in collaboration with the Industrial Plant & Engineering Division. RO technology currently accounts for over 45% of the global seawater desalination market, and is growing by 15% annually. In 2011, we plan to develop a 20,000-ton/day RO plant
as we position ourselves for new market opportunities as traditional sources of potable water gradually become more scarce.
Hyundai Electro-Mechanical Research Institute (HEMRI)Founded in 1991, HEMRI covers a broad spectrum of technical disciplines in the fields of electrical and mechanical engineering with applications that span our entire product portfolio. Key areas of research include power conversion systems, electric power machin-ery, plant and ship automation systems, intelligent machines, indus-trial robotics, and photovoltaics.
In 2010, HEMRI developed a smart sensor and monitoring system capable of providing real-time monitoring of high-voltage power transmission and distribution lines. The industry’s first of its kind, the smart sensor helps prevent power outages, manage transmission equipment life, provide economical power distribution control, and monitor wide-area power networks. The system entered trial opera-tion in October 2010 and is expected to be initially deployed by Rus-sian power grid operator FSK for its Far East region smart grid project.
Techno Design Institute (TDI)Founded in 2000, TDI enhances our corporate image through prod-uct design and visual communication design, improving the design quality of major products, visual promotional items, and facilities. TDI designs ship cabin interiors, engine and machinery products, con-struction equipment, electro electric equipment, and naval ships, taking into account aesthetics, technical aspects, and ergonomics.In 2010, TDI made great strides in enhancing the exterior design of
our world-class HiMSEN diesel engine lineup, selecting distinctive colors and materials that emphasize product benefits such as reli-ability, ingenuity, eco-friendliness, and convenience as well as our corporate identity. These efforts earned us recognition at the world’s top design competitions, including the iF Product Design Awards, Red Dot Design Awards, and Germany’s most prestigious design event, the Design Awards of the Federal Republic of Germany.
Technology Management Center (TMC)Founded in 2003, TMC provides the guidance and supporting systems to drive our overall R&D strategy. The center identifies business opportunities by tracking product and technology trends, facilitates knowledge dissemination by gathering, analyzing, and organizing technical data from internal and external sources, and maximizes the value of R&D investments by managing and monetiz-ing our intellectual property portfolio.
Power Line Smart Sensor In 2010, we developed the industry’s first smart sensor and monitoring system for real-time monitoring of high-voltage power transmission and distribution lines. The system is expected to be initially deployed on a smart grid project in the Far East.
HiMSEN Engine Awards In 2010, our updated HiMSEN engine design featuring distinctive colors and materials earned recognition at a trio of major international design com-petitions, including the Design Awards of the Federal Republic of Germany, iF Product Design Awards, and Red Dot Design Awards.
FLNG Hull FEED Study In 2010, we developed the core technologies related to float-ing LNG (FLNG) hull design and other areas as part of a front-end engineering and design study for the Petrobras FLNG project in Brazil. We are well positioned to win future tenders for this new category of offshore production vessels.
RO Desalination Pilot Plant In October 2010, we completed development of a 100-ton/day reverse osmosis desalination plant. We aim to leverage this technology to build a commercial scale 20,000-ton/day plant in 2011 as we prepare to enter this steadily growing segment of the global seawater desalination market.
R&D Expendituresin KRW billions
187
295
164
16708
09
10
11(E)

Our Growth is Global & Unlimited the future is a vast resource that requires vision, hard work, and investment to prepare for. At Hyundai Heavy industries, we are working around the world, around the clock to ensure a solid future for ourselves and our stakeholders.
40 Hyundai Heavy industries Annual report 2010 41Message from the CeosGlobal & Unlimited
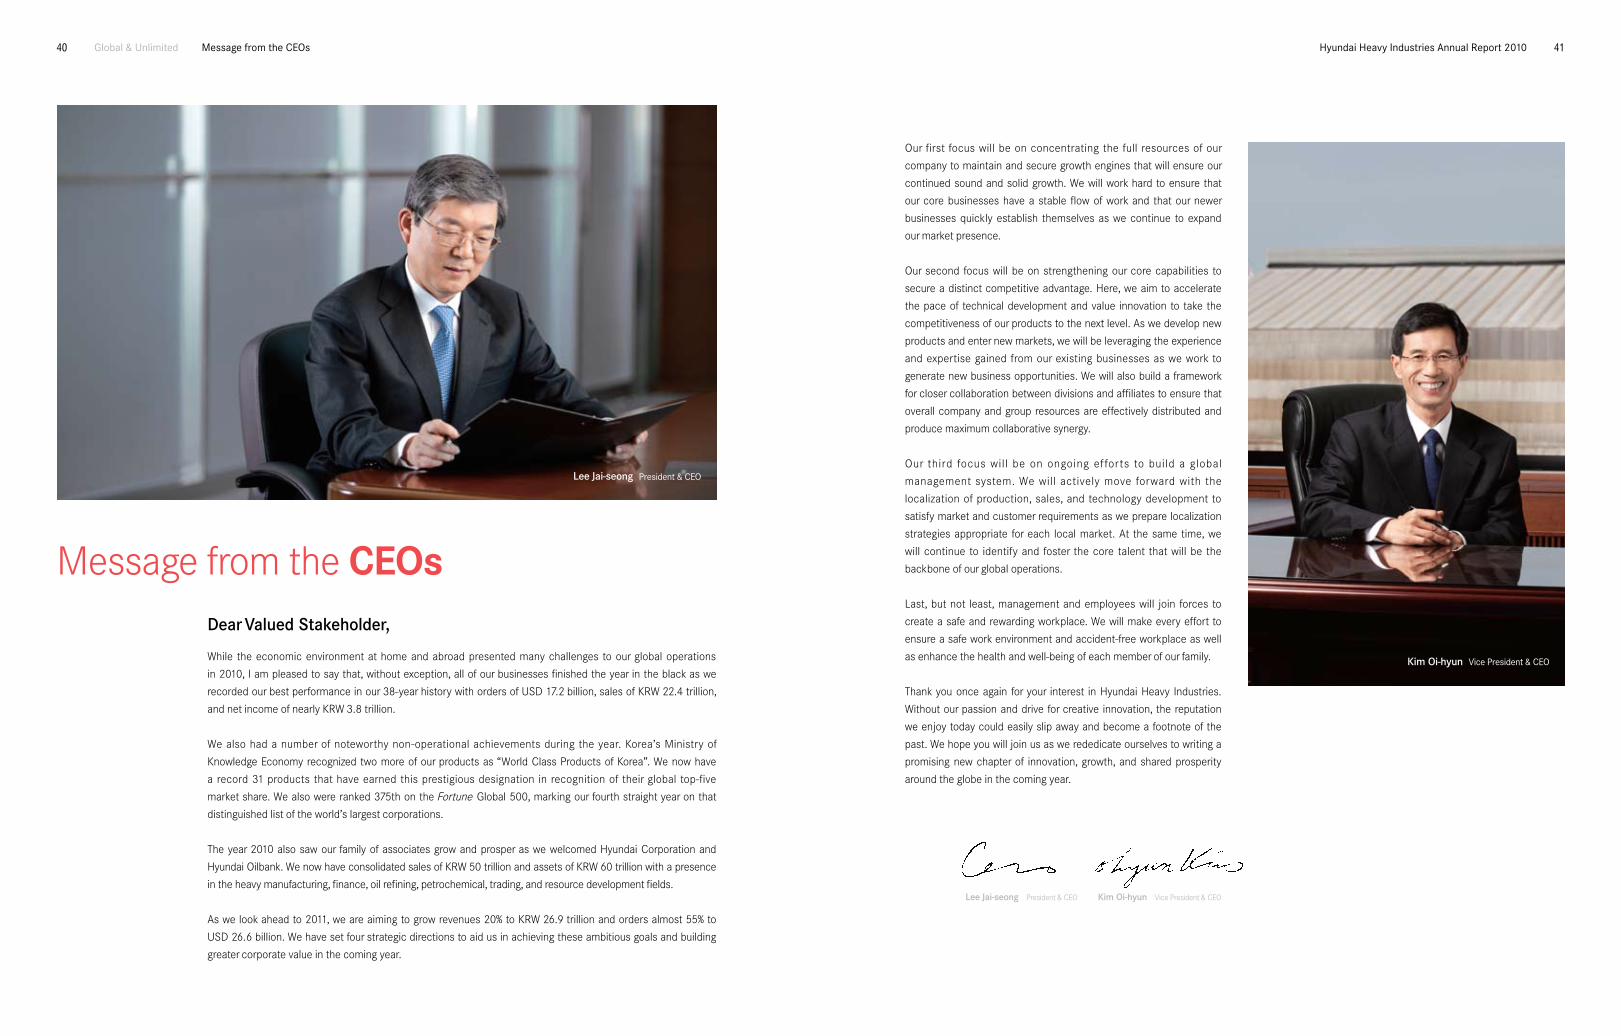
Dear Valued Stakeholder,
While the economic environment at home and abroad presented many challenges to our global operations
in 2010, I am pleased to say that, without exception, all of our businesses finished the year in the black as we
recorded our best performance in our 38-year history with orders of USD 17.2 billion, sales of KRW 22.4 trillion,
and net income of nearly KRW 3.8 trillion.
We also had a number of noteworthy non-operational achievements during the year. Korea’s Ministry of
Knowledge Economy recognized two more of our products as “World Class Products of Korea”. We now have
a record 31 products that have earned this prestigious designation in recognition of their global top-five
market share. We also were ranked 375th on the Fortune Global 500, marking our fourth straight year on that
distinguished list of the world’s largest corporations.
The year 2010 also saw our family of associates grow and prosper as we welcomed Hyundai Corporation and
Hyundai Oilbank. We now have consolidated sales of KRW 50 trillion and assets of KRW 60 trillion with a presence
in the heavy manufacturing, finance, oil refining, petrochemical, trading, and resource development fields.
As we look ahead to 2011, we are aiming to grow revenues 20% to KRW 26.9 trillion and orders almost 55% to
USD 26.6 billion. We have set four strategic directions to aid us in achieving these ambitious goals and building
greater corporate value in the coming year.
Our first focus will be on concentrating the full resources of our
company to maintain and secure growth engines that will ensure our
continued sound and solid growth. We will work hard to ensure that
our core businesses have a stable flow of work and that our newer
businesses quickly establish themselves as we continue to expand
our market presence.
Our second focus will be on strengthening our core capabilities to
secure a distinct competitive advantage. Here, we aim to accelerate
the pace of technical development and value innovation to take the
competitiveness of our products to the next level. As we develop new
products and enter new markets, we will be leveraging the experience
and expertise gained from our existing businesses as we work to
generate new business opportunities. We will also build a framework
for closer collaboration between divisions and affiliates to ensure that
overall company and group resources are effectively distributed and
produce maximum collaborative synergy.
Our third focus will be on ongoing efforts to build a global
management system. We will actively move forward with the
localization of production, sales, and technology development to
satisfy market and customer requirements as we prepare localization
strategies appropriate for each local market. At the same time, we
will continue to identify and foster the core talent that will be the
backbone of our global operations.
Last, but not least, management and employees will join forces to
create a safe and rewarding workplace. We will make every effort to
ensure a safe work environment and accident-free workplace as well
as enhance the health and well-being of each member of our family.
Thank you once again for your interest in Hyundai Heavy Industries.
Without our passion and drive for creative innovation, the reputation
we enjoy today could easily slip away and become a footnote of the
past. We hope you will join us as we rededicate ourselves to writing a
promising new chapter of innovation, growth, and shared prosperity
around the globe in the coming year.
Lee Jai-seong President & CEO Kim Oi-hyun Vice President & CEO
Message from the CEos
Lee Jai-seong President & Ceo
Kim Oi-hyun Vice President & Ceo

42 Hyundai Heavy industries Annual report 2010 43
Board of Directors
Chief Executive Officers
Lee Jai-seongPresident & CEO
Kim Oi-hyunVice President, CEO, andCOO of Shipbuilding Division
Kim Jung-rae
Vice President and Chief of Administration & Assistance Headquarters
Kang Chang-juneSenior EVP and COO of Offshore & Engineering Division
Chun In-sooVice President and COO of Industrial Plant & Engineering
Division
Kwon Oh-shinVice President and COO of Engine & Machinery Division
Kim Kweon-tae
Vice President and COO of Electro Electric Systems Division
and Green Energy Division
Choe Byeong-kuVice President and COO of Construction Equipment Division
Lee Choong-dongSenior EVP and COO of R&D Division
Hwang See-youngVice President and Group CIO
Lee Kun-jongVice President and Head of Seoul Office
About theBoard of Directors
The Hyundai Heavy Industries board is composed of
seven directors, four of which are outside directors.
Collectively, the directors assume ultimate responsibil-
ity for decisions regarding corporate affairs and the
financial well-being of shareholders. All board appoint-
ments are made pursuant to the Articles of Incorpora-
tion, including due consideration of each individual's
professional experience and expertise in fields such as
law, economics, finance, and accounting.
The board meets to discuss and resolve corporate
matters. Its responsibilities include deciding on mate-
rial matters as stipulated in relevant by-laws and the
Articles of Incorporation, dealing with issues delegated
to it at the annual general shareholders’ meeting, and
addressing issues related to the basic direction and
execution of company operations. The board also has
the authority to appoint the CEO and board chair as
well as conduct oversight of its members and com-
pany management. The board held a total of ten meet-
ings in 2010.
Audit CommitteeThe Audit Committee is a standing committee com-
posed of three outside directors. Its responsibilities
include (1) deciding on matters related to sharehold-
ers’ meetings such as the calling of interim share-
holders’ meetings and setting forth its views on the
agenda and the documents to be presented; (2)
conducting oversight of the board and its members,
producing independent annual audits, and supervis-
ing the financial reporting process; and (3) address-
ing matters relating to audits, including contracts
with independent auditors and the evaluation of their
qualifications, eligibility, and performance. The com-
mittee held a total of two meetings in 2010.
Outside Director Nominating CommitteeThe Outside Director Nominating Committee is a
standing committee responsible for nominating quali-
fied individuals to serve as outside directors on the
board. The committee consists of one inside and two
outside directors.
Organization Chart
Executive Directors
Global & Unlimited Corporate Governance & organization
Electro Electric Systems Division
Construction Equipment Division
Engine & Machinery Division
Green EnergyDivision
Industrial Plant & Engineering Division
R&D
Offshore & Engineering Division
Administration & Assistance
Shipbuilding Division
Seoul Office(Corporate Planning, Finance,Internal Audit, Legal Affairs)
Overseas Offices
Inside Directors Lee Jai-seongPresident & CEO
Kim Oi-hyunVice President & CEO
Non-Executive and Non-Outside Director
Choe Weon-gilPresident of Hyundai Mipo Dockyard
Outside Directors Lee Jae-kyu• Dean of KAIST EEWS Initiative • Professor, Graduate School of
Management, KAIST Business School
Song Jung-hoon• Lawyer, Hwang Mok Park• LLM, Harvard University Law School
Pyun Ho-bum• Vice-President,
Deloitte Anjin LLC• PhD, Business Admin.,
Sungkyunkwan University
Lee Chol• Professor, Business Admin.,
Sogang University• PhD, Business Admin.,
University of Texas at Austin
Audit Committee Lee Jae-kyu Song Jung-hoon Pyun Ho-bum
Outside Director Nominating Committee
Lee Jai-seong Song Jung-hoon Lee Chol
Board of Directors
Audit Committee

44 Hyundai Heavy industries Annual report 2010 45
Back in 1972, we booked our first ship order with nothing more
than some seaside property and an ambitious vision of becom-
ing a world-class shipbuilder. Today, that same indomitable spir-
it and passion continues to drive us as we pursue our vision of
shaping the future as a global leader in each of our businesses.
By consistently innovating to deliver the heavy machinery in-
dustry’s finest products, technologies, and service, we aim to
deliver superior satisfaction to our customers, more rewarding
careers for our people, and greater value to our shareholders.
Over the past three decades, our creative, pioneering spirit
and indomitable determination have made us a global leader
in shipbuilding and a number of other heavy manufacturing in-
dustries. Today as we lead these industries into the future, we
also aspire to make a difference around the globe. Our goal
is to generate greater corporate and economic value wher-
ever we do business as we actively fulfill our legal and ethical
responsibilities to each local community. To guide us in this
task, we have established the following five principles as the
framework for our corporate code of conduct.
Our Vision
Our Philosophy
• Satisfy our customers with superior technology and quality
• Provide rewarding careers that help our people achieve their dreams
• Enhance corporate value with world-leading products
our strategies our Code of Conduct
• Pursue market and technology leadership in each core business• Secure core technologies and top talent through strategic expansion,
alliances, and acquisitions• Pursue new business opportunities with high synergy potential• Exit unprofitable businesses
• Expand outsourcing of non-core and low-value-added operations• Implement integrated ERP system
• Make major product lines global leaders• Develop eco-friendly, high-performance, high-efficiency technologies• Pursue innovations in production technology to raise productivity and
reduce costs• Develop and patent innovative core technologies• Commercialize technologies that open opportunities in new fields
• Develop global sales, marketing, and R&D networks• Expand overseas production, service, and parts distribution networks• Enter promising new regional markets
• Maximize efficiency of existing facilities• Streamline and automate facilities• Implement integrated production management system
1 Structural Optimization
3 Operational Innovation
5 Technology Development
2 Network Building
4 Production Optimization
6 Synergy Building
• Package division and affiliate products and services to create new markets• Coordinate sales, procurement, and R&D to reduce costs and raise competitiveness• Expand flexibility in utilizing workforce and facility resources
• We respect laws and uphold business ethics.• We support free market principles through open and fair competition.• We foster fair and clean business relationships with suppliers.
1 We uphold fair and transparent business practices.
• We actively seek out and cultivate businesses with growth potential.• We secure core capabilities essential to future growth.• We build flexible business management systems.• We build a solid global business organization.
2 We enhance corporate value by continually growing.
• We provide pleasant and safe work environments.• We prevent accidents by looking out for our own and others’ safety.• We proactively develop and adopt environmentally friendly technologies.• We strive to make our production activities environmentally sound.
3 We pursue business practices that are safe and green.
• We foster a vibrant organizational culture based on participation and trust.• We faithfully fulfill all duties and responsibilities to enhance corporate competitiveness.• We strive to help our people reach their full potential.and improve their quality of life.
4 We build strong labor-management relations with mutual respect and trust.
• We strive to enhance community culture and welfare.• We contribute to national development through honest tax payment and
job creation.• We contribute to human prosperity by working to create greater value.
5 We contribute to social development as a global corporate citizen.
Vision & PhilosophyGlobal & Unlimited

46 Hyundai Heavy industries Annual report 2010 47
the highest graduate employment rate of any Korean 4-year college and has been ranked one of Korea’s top universities for the past five years. We also operate a “Housewives College” program each spring that provides employee spouses with a wide variety of opportunities for learning and self-development. Over 10,000 spouses have gradu-ated from the program to date, going on to enrich the community through active volunteer service.
Culture & ArtsWe have helped turn one of Korea’s top manufacturing cities into one of its most cultured. The Korean Business Council for the Arts ranked us No. 1 on its annual survey of corporate support for the arts among Korea’s top-500 companies in terms of sales for five straight years between 2004 and 2008.
Over the years, we have helped expand Ulsan’s cultural infrastructure by building a total of seven cultural and arts centers. The largest of these is the Hyundai Arts Center. This multi-purpose facility features a 1,000-seat main hall that hosts world-class concerts, opera, and musi-cals, an art gallery, a movie theater, and a variety of leisure and sports facilities. In the past eleven years since it opened, approximately 11 million people have used this facility, an average of 3,000 per day and 1.1 million per year. These centers also host over 400 lifelong education programs annually, serving more than 17,000 members.
Employees & PartnersThe secret of our success is the 25,000-strong workforce that builds the ships, plants, facilities, and equipments we sell to customers worldwide. Together, we have built an enduring win-win relation-ship that has created an environment of trust and respect that has helped us weather good times and bad. In 2010, we concluded our 16th straight annual collective bargaining agreement without inci-dent. Our commitment to labor harmony was once again recognized by the Ministry of Employment and Labor with a special Minister’s citation in December 2010.
The Hyundai Technical Education Institute (HTEI) has trained skilled professionals in a number of areas since 1972. In 2003, we were selected by Korea’s Ministry of Employment and Labor to be part of a consortium to train small and medium business employees. HTEI runs a total of 13 courses covering shipbuilding, machinery, electri-cal systems, CAD, painting, and other fields. The courses run be-tween three and five months with around 30 total sessions annually. Over 32,000 people have completed training to date, with more than 90% securing employment.
Community ServiceAs a major employer in the Ulsan region, we take social responsibil-ity very seriously. We actively support local agricultural and fisheries
industries through foodstuff purchases by our foodservice and food donation programs. We raise funds to aid parentless families, shut-in seniors, orphanages, and nursing homes as well as adopting schools. Our employees also generously volunteer their time and resources to benefit worthy causes. In March 2010, over 23,000 of them signed up to donate the change from their paychecks to a special charity fund that will provide a total of KRW 600 million to benefit three worthy charities over the next three years. More than 15,300 employees of the Hyundai Heavy Industries Group have also signed organ donation cards to give the gift of life.
Our social commitment extends far beyond Korea. In recent years, we have dispatched excavators and support teams to aid in post-earthquake disaster relief in both Haiti and China as well as donated funds to rebuild schools and hope. In January 2010, our employees donated over KRW 109 million for earthquake relief in Haiti. We also sponsored a temporary medical clinic in Pune, India that provided over 3,000 local residents with medical care, medicine, and first-aid kits in December 2010.
EducationWe are firm believers in the value of a quality education. We oper-ate a number of primary and secondary educational institutions, including the University of Ulsan and Ulsan College. The former has
HHI and theCommunity
HHi and the CommunityGlobal & Unlimited
Technical training programs for small and medium businesses Organ donor campaign Ulsan String Players Chamber Orchestra
Charity donation ceremonyAt Hyundai Heavy Industries, we believe that building win-win
relationships with every stakeholder in our local community is
essential to our success. In our role as an employer, customer,
or neighbor, we work hard to build close relationships with our
people, partners, and community to create greater growth and
prosperity for all.
Labor Relations Awards
Employment and Labor Minister’s CitationMinistry of Employment and Labor, 2010
President’s AwardLabor Relations Grand Prix, 2009

48 Hyundai Heavy industries Annual report 2010 49
Responding to Climate ChangeClimate change is globally recognized as the most pressing envi-ronmental issue of our day. Around the world, efforts to reduce and regulate greenhouse gas emissions are gaining momentum.
As a leader in our field, we at Hyundai Heavy Industries are system-atically working to reduce the carbon footprint of our operations and products. In 2010, we became the world’s first shipbuilder to com-plete a greenhouse gas inventory. Verified by the Korean Standards Association, the inventory gives us a comprehensive understanding of emissions sources and amounts from our operations, providing a framework to systematically manage and reduce our GHG emissions as well as a more accurate, credible, and transparent accounting of environmental responsibility.
CO2 MitigationIn 2010, we entered the CO2 mitigation business by installing a 1.65 MW wind turbine at our Ulsan yard as part of our response to climate change and to secure carbon credits. Our wind turbine installation has passed inspection by the Korea Energy Management Corpora-tion, making us the first in the shipbuilding industry to enter a busi-ness that is projected to earn 2,450 carbon credits annually, one for each ton of carbon emissions that are reduced.
Clean ProductionWe operate and maintain clean production systems as part of our commitment to minimizing pollution at the source. Our comprehen-sive facilities—including regenerative thermal oxidizers, bag filters, and a wastewater treatment plant—are continuously monitored and maintained to ensure optimal performance. We also continue to im-prove our production processes to steadily reduce the environmen-tal load of our operations.
Our internal pollution emissions standards are extremely strict, allow-ing only half of the legally permissible levels. In addition to preventing and reducing waste generation, we also systemically sort and recycle waste to use our resources more effectively and efficiently.
Because of the coastal locations of our production facilities, we have established internal procedures governing marine facility and vessel operation. These include regulations prohibiting ocean dumping of fuel and waste to prevent coastal pollution.
SafetyAt Hyundai Heavy Industries, the safety of our people is our num-ber one priority. We strive to maintain an accident-free workplace through a number of initiatives.
OHSAS 18001
ISO 14001
Major Certifications
Our Incident & Injury Free (IIF) initiative is playing a key role in instill-ing a culture of intuitive safety. Our 16 in-house IIF instructors have trained over 12,000 employees to date. Our annual safety video competition attracted a total of 112 entries in 2010 as teams of em-ployees worked together to create and share their safety knowledge. All these activities as well as safety motto and poster competitions, recognition of collective and individual safety excellence, and a vari-ety of other events are helping make our yards and worksites among the safest in the industry.
HealthCaring for the health and well-being of our people is another one of our top priorities. We operate a wide range of health programs that focus on preventing musculoskeletal and cerebrovascular disorders as well as other occupational diseases.
In 2010, we once again focused on preventing swine influenza and hepatitis A by publicizing common-sense prevention informa-tion as well as expediting treatment of employees with symptoms. We also continued to partner with the local community health center to expand our smoking cessations programs, incentives, and counseling services to help our people fundamentally im-prove their long-term health.
08
09
10
24.4
Hazardous Material Usagein tons/year (Ulsan yard)
22.5
19.5
Wastewater Dischargesin m3/year (Ulsan yard)
08
09
10
15,086
6,392
7,156
HHI and theEnvironment
HHi and the environmentGlobal & Unlimited
Strengthen Environmental Systems
• Adopt systematic worksite monitoring systems
• Bolster workforce environmental training
• Implement environmental information system
Comply with Environmental Regulations
• Comply actively with international conventions on climate change
• Establish proactive response mechanism for international regulations
• Respect domestic environmental regulations
Build Clean Manufacturing Systems
• Minimize resource and energy usage
• Minimize waste generation and maximize recycling
• Optimize operation of pollution prevention facilities
Enhance Environmental Initiatives
• Participate actively in community environmental activities
• Participate actively in voluntary agreements
• Produce and publish environmental reports
Emphasize Eco-Friendly Businesses
• Develop eco-friendly products and technologies
• Expand renewable energy businesses
Environmental Management Strategy
Safety poster competitions
Community cleanup activities
Community cleanup activities
Health Center
As a global leader in a number of heavy manufacturing fields,
we are committed to being a leader in low-carbon green
growth. Since acquiring ISO 14001 certification in 1997, we
have made environmental management a core part of our op-
erations. We are also actively developing and deploying eco-
friendly green technologies such as solar, wind, hybrid ships,
and ballast water treatment systems.

Deep & Wide review of operations50 Hyundai Heavy industries Annual report 2010 51
Our Growth is Solid & Steady solid fundamentals are key to long-term success in the global marketplace. At Hyundai Heavy industries, we are committed to generating quality growth as we explore new frontiers to deliver greater growth and prosperity for all our stakeholders.

52 Hyundai Heavy industries Annual report 2010 53
Stockholders’ EquityStockholders’ equity increased 40.9% to KRW 13,819.0 billion in 2010,
benefitting from a record net income and the disposition of treasury
stock by transfer into an employee stock ownership plan.
At 2010 year-end, the Company’s liabilities-to-equity ratio stood at
109%, a 44.6 percentage-point decline for the year. The debt-to-equity
ratio rose 15 percentage points to 24.9% due to increased borrowings
of KRW 2,500 billion related to the acquisition of Hyundai Oilbank.
Liquidity, Borrowings & Capital Expenditures
LiquidityThe Company’s cash and cash equivalents decreased 1.3% to KRW
624.5 billion and short-term financial instruments dropped 93.6% to
KRW 7.0 billion in 2010. The liquidity ratio decreased 0.9 percentage
points to 81.3% for the year.
BorrowingsThe Company’s borrowings increased by KRW 2,557.7 billion in 2010
due to the acquisition of Hyundai Oilbank. The Company’s borrowing
strategy is designed to ensure an appropriate level of liquidity is
maintained, taking into account the operating environment and
increasing volatility in financial markets.
Capex InvestmentThe Company invested KRW 356.6 billion in 2010, a 63.5% decrease over
2009. It plans to invest KRW 994.0 billion in capital expenditures in 2011.
Management’s Discussion & Analysissolid & steady
Results of Operations
SalesAlthough Shipbuilding Division sales decreased due to a decline in de-
mand for new vessels, Company sales rose 6% to KRW 22,405.2 billion
in 2010 due to a surge in sales from non-shipbuilding businesses pow-
ered by strong order performances in recent years.
Operating IncomeOperating income rose 54.7% to KRW 3,439.4 billion in 2010 due to
improved profitability by all divisions except Engine & Machinery, with
particularly strong performances by Electro Electric Systems and Con-
struction Equipment.
Net IncomeA significant increase in non-operating income due to a large gain on valu-
ation of equity-method investments helped boost income before income
taxes 80.7% to KRW 4,784.3 billion in 2010. After deducting income tax
expense of KRW 1,023.2 billion, net income was KRW 3,761.1 billion.
The following discussion contains forward-looking statements. These
statements are related to future events, rather than historical facts, and
include statements about the Company’s beliefs and expectations re-
garding its future business situation and financial results.
By their nature, forward-looking statements imply uncertainty and are
indicated by phrases that include words such as “expects”, “forecasts”,
“projects”, and “plans”. Examples of uncertainties that may favorably
or unfavorably impact the Company’s business situation and financial
results include orders, exchange rates, and steel plate prices.
Please be aware that these uncertainties may result in the Company’s
actual performance being materially different from these forward-
looking statements, whether explicitly expressed or implied. The Com-
pany expressly disclaims any obligation to publicly update or revise any
of these statements in light of new information that may arise after the
date they are made.
The Company’s financial statements are prepared in accordance with
generally accepted accounting principles in the Republic of Korea (Ko-
rean GAAP). The fiscal 2010 statements were prepared using the same
accounting policies adopted for the fiscal 2009 statements.
Business Overview
While the efforts of the global community to recover from the global
economic crisis of 2008 enjoyed a degree of success in 2010, the
global shipbuilding industry continued to lag behind, experiencing an-
other difficult year. In the face of challenging circumstances, all of the
Company’s divisions delivered profitable performances as it recorded
the best performance in its history with sales of KRW 22,405.2 billion
and a net income of KRW 3,761.1 billion.
The Company strengthened its core competencies in marketing,
production, technical development, and other areas during the year,
securing a strong competitive advantage that continues to make it a
truly world-class company. With the establishment of the Green Energy
Division in January 2011, the Company accelerated its advance into so-
lar and wind power fields, putting in place a solid foundation for sustain-
able growth.
Financial Structure Analysis
AssetsCompany assets increased 16.1% to KRW 28,888.1 billion in 2010.
While cash and cash equivalents and property, plant and equipment
decreased, trade accounts and notes receivable and investment assets
increased.
LiabilitiesLiabilities increased slightly to KRW 15,069.1 billion in 2010. While
advances from customers and derivative liabilities decreased, trade ac-
counts and notes payable and borrowing increased.
in KrW billions
Summary Balance Sheet 2010 2009 2008
Assets
Cash and Cash equivalents 624.5 632.6 667.5
trade Accounts and notes receivable 5,950.8 4,973.5 4,498.9
inventories 2,084.2 1,928.6 2,263.3
investment Assets 9,089.3 4,866.4 3,224.4
Firm Commitment Assets 789.0 1,922.3 4,559.1
Property, Plant and equipment 8,000.2 8,145.5 6,190.0
Total Assets 28,888.1 24,872.6 25,280.4
Liabilities
trade Accounts and notes Payable 1,927.6 1,427.6 2,337.3
Advances from Customers 6,142.7 8,583.5 10,177.4
Derivative Liabilities 708.9 2,126.5 5,616.1
Total Liabilities 15,069.1 15,064.2 19,685.2
Stockholders’ Equity
retained earnings 10,052.9 6,503.9 4,657.1
Capital surplus 2,954.4 2,869.6 2,818.6
Capital Adjustments -1,705.4 -1,697.8 -1,762.0
Accumulated other income 2,137.1 1,752.7 -498.5
Total Stockholders’ Equity 13,819.0 9,808.4 5,595.2
in KrW billions
Financial Stability Ratios 2010 2009 2008
Liabilities-to-Equity 109.0% 153.6% 351.8%
Debt-to-Equity 24.9% 9.1% 0.1%
in KrW billions
Summary Income Statements 2010 2009 2008
sales 22,405.2 21,142.2 19,957.1
Gross Profit 4,670.3 314.5 314.5
selling, General and
Administrative expenses 1,230.9 922.2 938.9
operating income 3,439.4 2,222.6 2,206.2
income Before income taxes 4,784.3 2,648.1 2,949.6
net income 3,761.1 2,146.5 2,256.7
Retained Earnings in KRW billions
10,052.9
6,503.9
4,657.108
09
10
Total Assets in KRW billions
25,280.4
28,888.1
08
09
10
24,872.6
Sales in KRW billions
22,405.2
21,142.2
19,957.108
09
10
Net Income in KRW billions
2,256.7
3,761.1
08
09
10
2,146.5
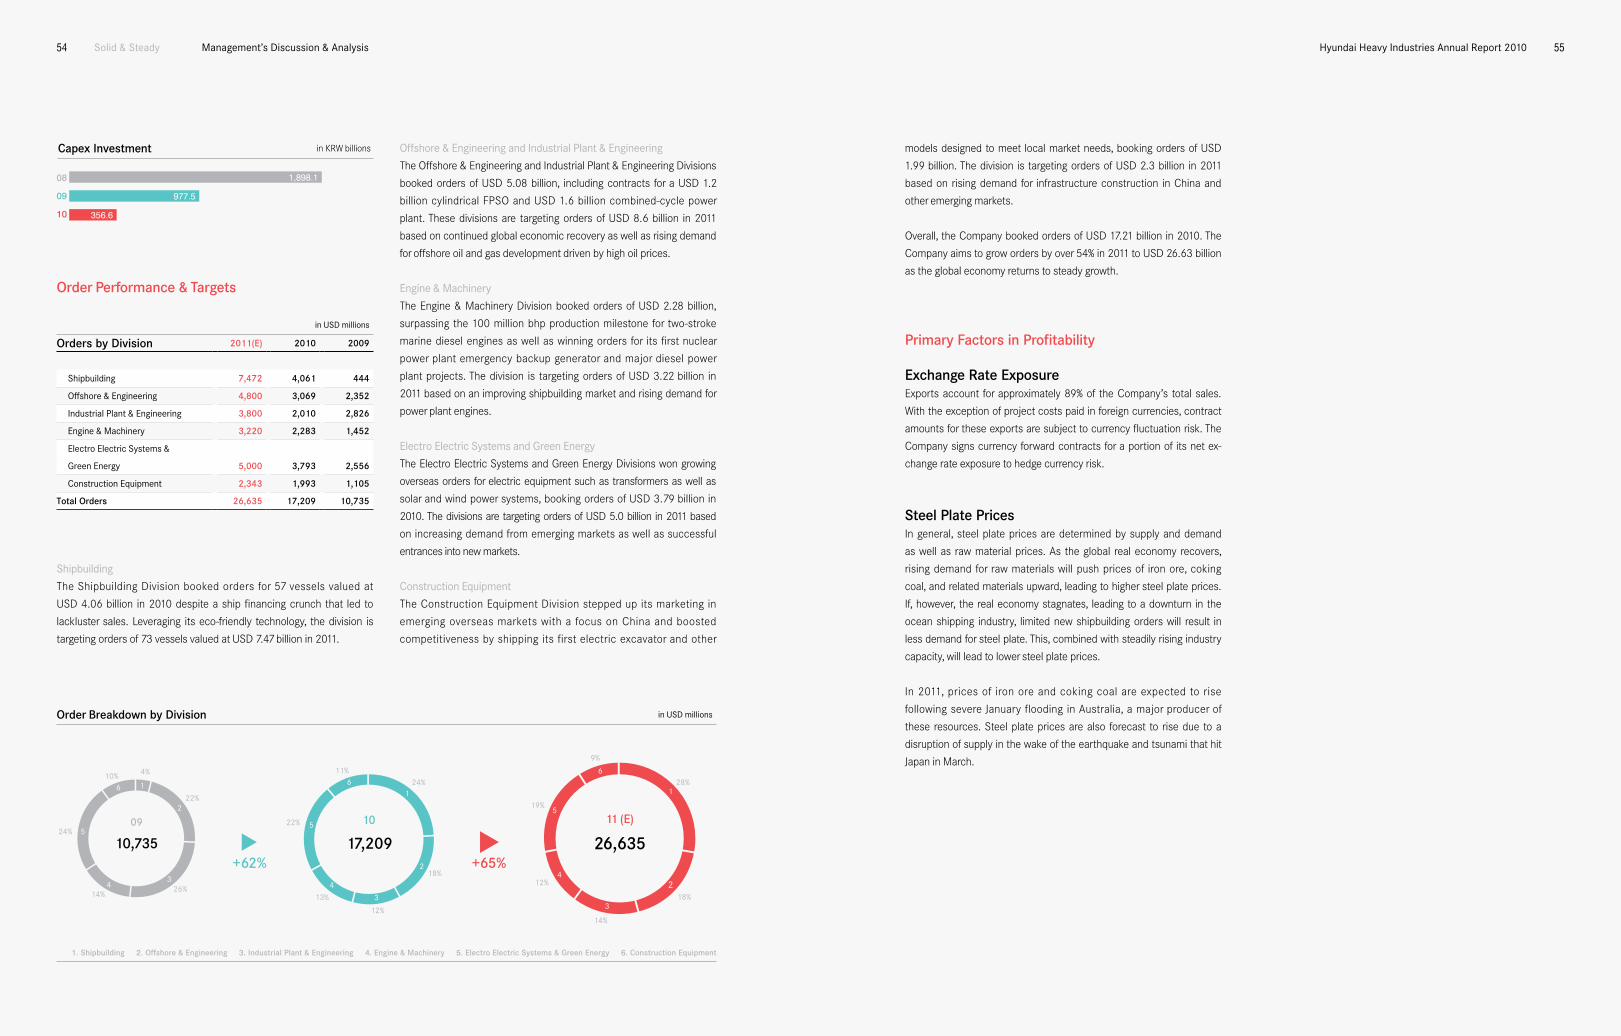
54 Hyundai Heavy industries Annual report 2010 55
Order Performance & Targets
shipbuilding
The Shipbuilding Division booked orders for 57 vessels valued at
USD 4.06 billion in 2010 despite a ship financing crunch that led to
lackluster sales. Leveraging its eco-friendly technology, the division is
targeting orders of 73 vessels valued at USD 7.47 billion in 2011.
offshore & engineering and industrial Plant & engineering
The Offshore & Engineering and Industrial Plant & Engineering Divisions
booked orders of USD 5.08 billion, including contracts for a USD 1.2
billion cylindrical FPSO and USD 1.6 billion combined-cycle power
plant. These divisions are targeting orders of USD 8.6 billion in 2011
based on continued global economic recovery as well as rising demand
for offshore oil and gas development driven by high oil prices.
engine & Machinery
The Engine & Machinery Division booked orders of USD 2.28 billion,
surpassing the 100 million bhp production milestone for two-stroke
marine diesel engines as well as winning orders for its first nuclear
power plant emergency backup generator and major diesel power
plant projects. The division is targeting orders of USD 3.22 billion in
2011 based on an improving shipbuilding market and rising demand for
power plant engines.
electro electric systems and Green energy
The Electro Electric Systems and Green Energy Divisions won growing
overseas orders for electric equipment such as transformers as well as
solar and wind power systems, booking orders of USD 3.79 billion in
2010. The divisions are targeting orders of USD 5.0 billion in 2011 based
on increasing demand from emerging markets as well as successful
entrances into new markets.
Construction equipment
The Construction Equipment Division stepped up its marketing in
emerging overseas markets with a focus on China and boosted
competitiveness by shipping its first electric excavator and other
models designed to meet local market needs, booking orders of USD
1.99 billion. The division is targeting orders of USD 2.3 billion in 2011
based on rising demand for infrastructure construction in China and
other emerging markets.
Overall, the Company booked orders of USD 17.21 billion in 2010. The
Company aims to grow orders by over 54% in 2011 to USD 26.63 billion
as the global economy returns to steady growth.
Primary Factors in Profitability
Exchange Rate ExposureExports account for approximately 89% of the Company’s total sales.
With the exception of project costs paid in foreign currencies, contract
amounts for these exports are subject to currency fluctuation risk. The
Company signs currency forward contracts for a portion of its net ex-
change rate exposure to hedge currency risk.
Steel Plate PricesIn general, steel plate prices are determined by supply and demand
as well as raw material prices. As the global real economy recovers,
rising demand for raw materials will push prices of iron ore, coking
coal, and related materials upward, leading to higher steel plate prices.
If, however, the real economy stagnates, leading to a downturn in the
ocean shipping industry, limited new shipbuilding orders will result in
less demand for steel plate. This, combined with steadily rising industry
capacity, will lead to lower steel plate prices.
In 2011, prices of iron ore and coking coal are expected to rise
following severe January flooding in Australia, a major producer of
these resources. Steel plate prices are also forecast to rise due to a
disruption of supply in the wake of the earthquake and tsunami that hit
Japan in March.
1. Shipbuilding 2. Offshore & Engineering 3. Industrial Plant & Engineering 4. Engine & Machinery 5. Electro Electric Systems & Green Energy 6. Construction Equipment
Order Breakdown by Division in UsD millions
11 (E)
26,635
2
1
4%24% 28%
26%
18%
18%
14%
12%
19%
9%
14% 13%
12%
24%22%
10%11%
3
4
5
6
10
17,2092
1
3
4
5
6
09
10,735+62% +65%
3
2
4
5
6 1
22%
Capex Investment in KRW billions
356.6
977.5
1,898.108
09
10
solid & steady
in UsD millions
Orders by Division 2011(E) 2010 2009
shipbuilding 7,472 4,061 444
offshore & engineering 4,800 3,069 2,352
industrial Plant & engineering 3,800 2,010 2,826
engine & Machinery 3,220 2,283 1,452
electro electric systems &
Green energy 5,000 3,793 2,556
Construction equipment 2,343 1,993 1,105
Total Orders 26,635 17,209 10,735
Management’s Discussion & Analysis

solid & steady independent Auditors’ report56 Hyundai Heavy industries Annual report 2010 57
The Board of Directors and Stockholders Hyundai Heavy Industries Co., Ltd.:
We have audited the accompanying non-consolidated statements of financial position of Hyundai Heavy Industries Co., Ltd. (the “Company”) as of
December 31, 2010 and 2009 and the related non-consolidated statements of income, appropriation of retained earnings, changes in equity and cash
flows for the years then ended. These non-consolidated financial statements are the responsibility of the Company’s management. Our responsibility is
to express an opinion on these non-consolidated financial statements based on our audits.
We conducted our audits in accordance with auditing standards generally accepted in the Republic of Korea. These standards require that we plan and
perform the audit to obtain reasonable assurance about whether the financial statements are free of material misstatement. An audit includes examin-
ing, on a test basis, evidence supporting the amounts and disclosures in the financial statements. An audit also includes assessing the accounting
principles used and significant estimates made by management, as well as evaluating the overall financial statement presentation. We believe that our
audits provide a reasonable basis for our opinion.
In our opinion, the non-consolidated financial statements referred to above present fairly, in all material respects, the financial position of Hyundai
Heavy Industries Co., Ltd. as of December 31, 2010 and 2009 and the results of its operations, the appropriation of its retained earnings, the changes
in its equity and its cash flows for the years then ended in conformity with accounting principles generally accepted in the Republic of Korea.
Without qualifying our opinion, we draw attention to the following:
As discussed in note 2(a) to the non-consolidated financial statements, accounting principles and auditing standards and their application in practice
vary among countries. The accompanying non-consolidated financial statements are not intended to present the financial position, results of opera-
tions, changes in equity and cash flows in accordance with accounting principles and practices generally accepted in countries other than the Repub-
lic of Korea. In addition, the procedures and practices utilized in the Republic of Korea to audit such non-consolidated financial statements may differ
from those generally accepted and applied in other countries. Accordingly, this report and the accompanying non-consolidated financial statements
are for use by those knowledgeable about Korean accounting principles and auditing standards and their application in practice.
Seoul, Korea
February 28, 2011
Notice to ReadersThis report is effective as of February 28, 2011, the audit report date. Certain subsequent events or circumstances, which may occur between the audit report date and the time of reading this report, could have a material impact on the accompanying non-consolidated financial statements and notes thereto. Accordingly, the readers of the audit report should understand that there is a possibility that the above audit report may have to be revised to reflect the impact of such subsequent events or circumstances, if any.
(in thousands of won, except share data)
ASSETS 2010 2009
CURRENT ASSETS
Cash and cash equivalents (note 26) ₩ 624,479,536 ₩ 632,578,218
short-term financial instruments (note 3, 26) 6,967,606 109,033,003
Accounts and notes receivable - trade, less allowance for
doubtful accounts of ₩76,909,350 in 2010 and ₩109,816,750 in 2009 (note 15, 21, 25, 26) 5,950,845,574 4,973,543,411
Accounts receivable - other, less allowance for
doubtful accounts of ₩125,225,202 in 2010 and ₩206,364,299 in 2009 (note 16, 25, 26) 125,889,630 117,586,658
Advance payments, less allowance for
doubtful accounts of ₩9,874,635 in 2010 and ₩13,125,144 in 2009 965,774,062 1,228,556,767
Accrued income (note 26) 38,133,914 37,495,883
Foreign exchange forward contracts (note 15) 896,578,183 1,377,159,343
Current deferred tax assets (note 22, 23) 8,644,036 -
inventories (note 4) 2,084,173,022 1,928,558,515
other current assets (note 5, 21, 26) 173,686,520 205,402,613
Total current assets ₩ 10,875,172,083 ₩ 10,609,914,411
NON-CURRENT ASSETS
Long-term financial instruments (note 3, 26) ₩ 1,450,948 ₩ 3,224,878
Long-term investment securities (note 6) 1,636,986,500 1,174,080,691
equity method investments (note 7) 7,450,873,449 3,689,107,855
Property, plant and equipment, net (note 8, 27) 8,000,158,278 8,145,522,809
intangible assets (note 9, 27) 306,043,280 288,459,041
Long-term accounts and notes receivable - trade, less allowance for
doubtful accounts of ₩212,166,461 in 2010 and ₩27,138,889 in 2009 (note 15, 21, 26) 255,295,030 51,243,264
Foreign exchange forward contracts (note 15) 193,634,449 805,264,651
other non-current assets (note 10, 26) 168,517,079 105,765,901
Total non-current assets ₩ 18,012,959,013 ₩ 14,262,669,090
Total assets ₩ 28,888,131,096 ₩ 24,872,583,501
Independent Auditors’ Report Non-Consolidated Statements of Financial PositionAs of December 31, 2010 and 2009Based on a report originally issued in Korean
(Continued)
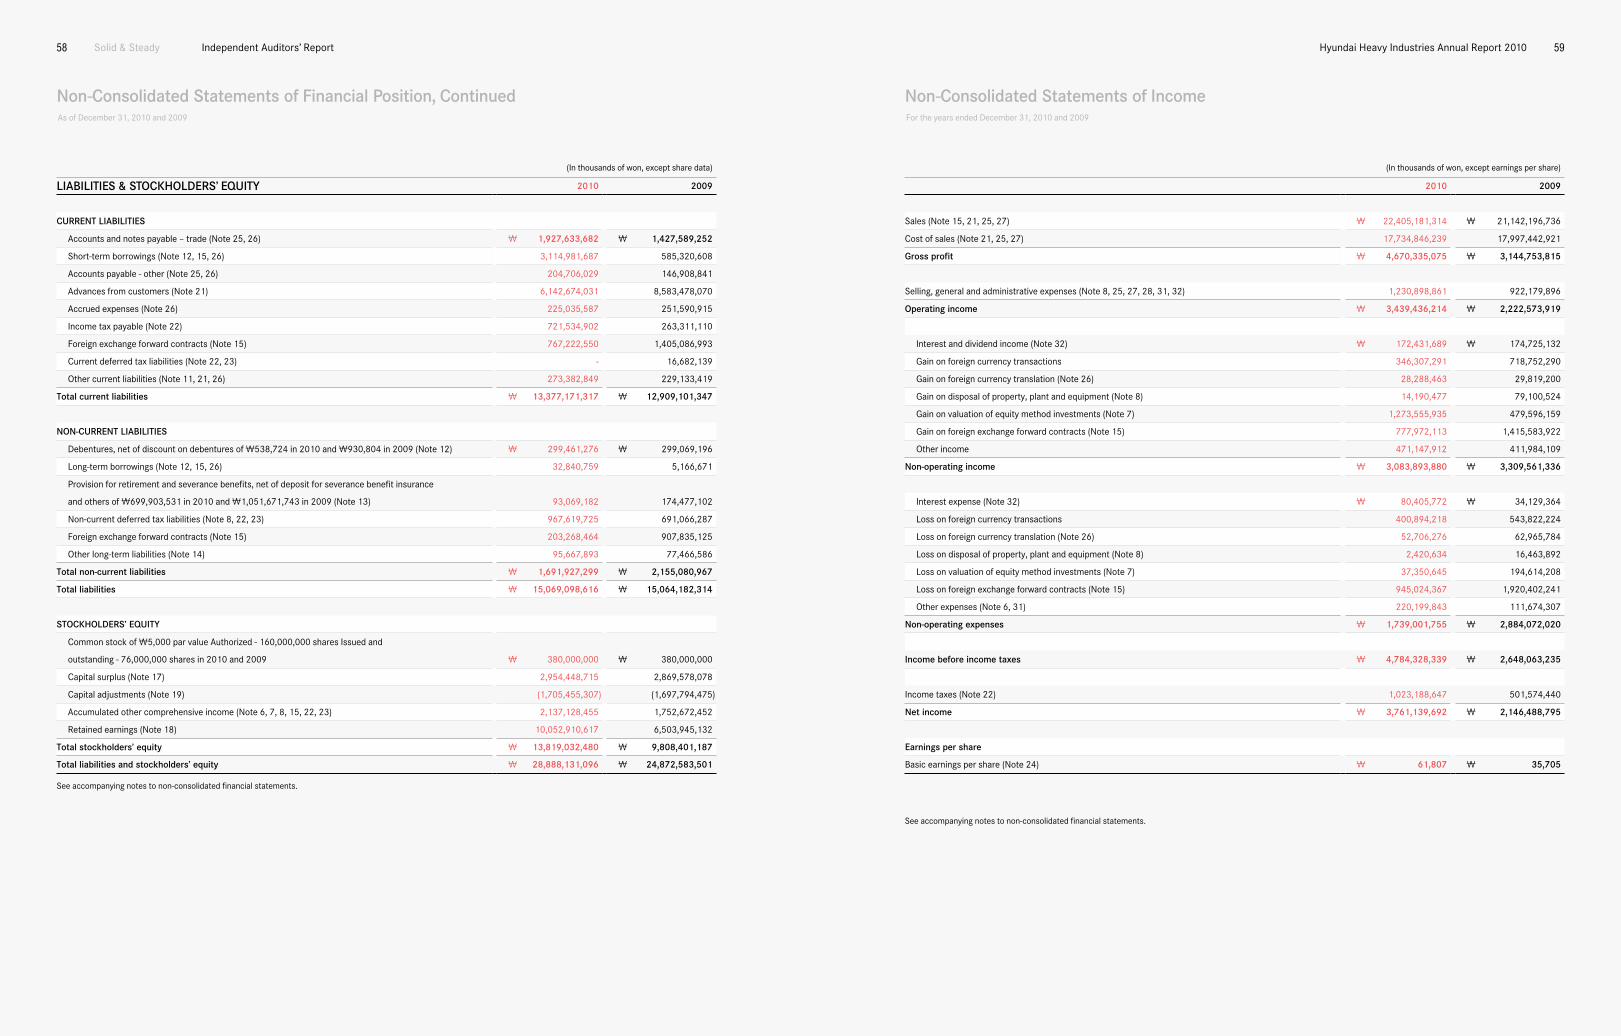
solid & steady independent Auditors’ report58 Hyundai Heavy industries Annual report 2010 59
(in thousands of won, except share data)
LIABILITIES & STOCKHOLDERS’ EqUITY 2010 2009
CURRENT LIABILITIES
Accounts and notes payable – trade (note 25, 26) ₩ 1,927,633,682 ₩ 1,427,589,252
short-term borrowings (note 12, 15, 26) 3,114,981,687 585,320,608
Accounts payable - other (note 25, 26) 204,706,029 146,908,841
Advances from customers (note 21) 6,142,674,031 8,583,478,070
Accrued expenses (note 26) 225,035,587 251,590,915
income tax payable (note 22) 721,534,902 263,311,110
Foreign exchange forward contracts (note 15) 767,222,550 1,405,086,993
Current deferred tax liabilities (note 22, 23) - 16,682,139
other current liabilities (note 11, 21, 26) 273,382,849 229,133,419
Total current liabilities ₩ 13,377,171,317 ₩ 12,909,101,347
NON-CURRENT LIABILITIES
Debentures, net of discount on debentures of ₩538,724 in 2010 and ₩930,804 in 2009 (note 12) ₩ 299,461,276 ₩ 299,069,196
Long-term borrowings (note 12, 15, 26) 32,840,759 5,166,671
Provision for retirement and severance benefits, net of deposit for severance benefit insurance
and others of ₩699,903,531 in 2010 and ₩1,051,671,743 in 2009 (note 13) 93,069,182 174,477,102
non-current deferred tax liabilities (note 8, 22, 23) 967,619,725 691,066,287
Foreign exchange forward contracts (note 15) 203,268,464 907,835,125
other long-term liabilities (note 14) 95,667,893 77,466,586
Total non-current liabilities ₩ 1,691,927,299 ₩ 2,155,080,967
Total liabilities ₩ 15,069,098,616 ₩ 15,064,182,314
STOCKHOLDERS’ EqUITY
Common stock of ₩5,000 par value Authorized - 160,000,000 shares issued and
outstanding - 76,000,000 shares in 2010 and 2009 ₩ 380,000,000 ₩ 380,000,000
Capital surplus (note 17) 2,954,448,715 2,869,578,078
Capital adjustments (note 19) (1,705,455,307) (1,697,794,475)
Accumulated other comprehensive income (note 6, 7, 8, 15, 22, 23) 2,137,128,455 1,752,672,452
retained earnings (note 18) 10,052,910,617 6,503,945,132
Total stockholders’ equity ₩ 13,819,032,480 ₩ 9,808,401,187
Total liabilities and stockholders’ equity ₩ 28,888,131,096 ₩ 24,872,583,501
see accompanying notes to non-consolidated financial statements.
(in thousands of won, except earnings per share)
2010 2009
sales (note 15, 21, 25, 27) ₩ 22,405,181,314 ₩ 21,142,196,736
Cost of sales (note 21, 25, 27) 17,734,846,239 17,997,442,921
Gross profit ₩ 4,670,335,075 ₩ 3,144,753,815
selling, general and administrative expenses (note 8, 25, 27, 28, 31, 32) 1,230,898,861 922,179,896
Operating income ₩ 3,439,436,214 ₩ 2,222,573,919
interest and dividend income (note 32) ₩ 172,431,689 ₩ 174,725,132
Gain on foreign currency transactions 346,307,291 718,752,290
Gain on foreign currency translation (note 26) 28,288,463 29,819,200
Gain on disposal of property, plant and equipment (note 8) 14,190,477 79,100,524
Gain on valuation of equity method investments (note 7) 1,273,555,935 479,596,159
Gain on foreign exchange forward contracts (note 15) 777,972,113 1,415,583,922
other income 471,147,912 411,984,109
Non-operating income ₩ 3,083,893,880 ₩ 3,309,561,336
interest expense (note 32) ₩ 80,405,772 ₩ 34,129,364
Loss on foreign currency transactions 400,894,218 543,822,224
Loss on foreign currency translation (note 26) 52,706,276 62,965,784
Loss on disposal of property, plant and equipment (note 8) 2,420,634 16,463,892
Loss on valuation of equity method investments (note 7) 37,350,645 194,614,208
Loss on foreign exchange forward contracts (note 15) 945,024,367 1,920,402,241
other expenses (note 6, 31) 220,199,843 111,674,307
Non-operating expenses ₩ 1,739,001,755 ₩ 2,884,072,020
Income before income taxes ₩ 4,784,328,339 ₩ 2,648,063,235
income taxes (note 22) 1,023,188,647 501,574,440
Net income ₩ 3,761,139,692 ₩ 2,146,488,795
Earnings per share
Basic earnings per share (note 24) ₩ 61,807 ₩ 35,705
see accompanying notes to non-consolidated financial statements.
Non-Consolidated Statements of Financial Position, Continued Non-Consolidated Statements of IncomeAs of December 31, 2010 and 2009 For the years ended December 31, 2010 and 2009

solid & steady independent Auditors’ report60 Hyundai Heavy industries Annual report 2010 61
Non-Consolidated Statements of Appropriation of Retained Earnings Non-Consolidated Statements of Changes in EquityFor the years ended December 31, 2010 and 2009
Date of Appropriation for 2010: March 11, 2011
Date of Appropriation for 2009: March 12, 2010
For the years ended December 31, 2010 and 2009
(in thousands of won)
2010 2009
Unappropriated retained earnings
Balance at beginning of year ₩ 10 ₩ 5
net income 3,761,139,692 2,146,488,795
Balance at end of year before appropriation ₩ 3,761,139,702 ₩ 2,146,488,800
Transfer from voluntary reserves
reserve for research and human development ₩ 76,666,667 ₩ 76,666,667
Unappropriated retained earnings available for appropriation ₩ 3,837,806,369 ₩ 2,223,155,467
Appropriation of retained earnings
Legal reserve ₩ 100,000,000 ₩ 300,000,000
reserve for research and human development 3,308,787,280 1,710,981,250
Dividends – 140% on par value at ₩7,000 per share - 70% on par value at ₩3,500 per share (note 20) 429,019,080 212,174,207
Unappropriated retained earnings to be carried over to subsequent year ₩ 9 ₩ 10
(in thousands of won)
Accumulated other Total
Capital comprehensive stockholders’
Common stock Capital surplus adjustments income Retained earnings equity
Balance at January 1, 2009 ₩ 380,000,000 ₩ 2,818,590,688 ₩(1,762,040,031) ₩ (498,454,758) ₩ 4,657,123,617 ₩ 5,595,219,516
Dividends - - - - (299,667,280) (299,667,280)
Balance after appropriation - - - - 4,357,456,337 5,295,552,236
net income - - - - 2,146,488,795 2,146,488,795
Changes in other capital surplus - 50,987,390 - - - 50,987,390
Changes in treasury stock - - 65,469,293 - - 65,469,293
Changes in capital adjustments
on valuation of equity
method investments - - (1,223,737) - - (1,223,737)
Changes in gain and loss on
valuation of investment securities - - - 534,950,242 - 534,950,242
Changes in equity arising on
application of the equity method - - - 263,582,652 - 263,582,652
negative changes in equity
arising on application of
the equity method - - - 133,368,767 - 133,368,767
Changes in gain and loss on
valuation of derivatives - - - 354,767,062 - 354,767,062
Changes in gain and loss on
revaluation of land - - - 964,458,487 - 964,458,487
Balance at December 31, 2009 ₩ 380,000,000 ₩ 2,869,578,078 ₩(1,697,794,475) ₩ 1,752,672,452 ₩ 6,503,945,132 ₩ 9,808,401,187
see accompanying notes to non-consolidated financial statements.
(Continued)

solid & steady independent Auditors’ report62 Hyundai Heavy industries Annual report 2010 63
Non-Consolidated Statements of Changes in Equity, Continued Non-Consolidated Statements of Cash FlowsFor the years ended December 31, 2010 and 2009 For the years ended December 31, 2010 and 2009
(in thousands of won)
Accumulated other Total
Capital comprehensive stockholders’
Common stock Capital surplus adjustments income Retained earnings equity
Balance at January 1, 2010 ₩ 380,000,000 ₩ 2,869,578,078 ₩ (1,697,794,475) ₩ 1,752,672,452 ₩ 6,503,945,132 ₩ 9,808,401,187
Dividends - - - - (212,174,207) (212,174,207)
Balance after appropriation - - - - 6,291,770,925 9,596,226,980
net income - - - - 3,761,139,692 3,761,139,692
Changes in other capital surplus - 84,870,637 - - - 84,870,637
Changes in treasury stock - - 63,517,054 - - 63,517,054
Changes in capital adjustments
on valuation of equity
method investments - - (71,177,886) - - (71,177,886)
Changes in gain and loss on
valuation of investment securities - - - 404,589,747 - 404,589,747
Changes in equity arising on
application of the equity method - - - 33,025,683 - 33,025,683
negative changes in equity
arising on application of
the equity method - - - (19,938,337) - (19,938,337)
Changes in gain and loss on
valuation of derivatives - - - (24,579,758) - (24,579,758)
Changes in gain and loss on
revaluation of land - - - (8,641,332) - (8,641,332)
Balance at December 31, 2010 ₩ 380,000,000 ₩ 2,954,448,715 ₩ (1,705,455,307) ₩ 2,137,128,455 ₩ 10,052,910,617 ₩ 13,819,032,480
(in thousands of won)
2010 2009
Cash flows from operating activities
Net income ₩ 3,761,139,692 ₩ 2,146,488,795
Adjustments for:
Depreciation ₩ 440,045,046 ₩ 399,694,162
Accrual for retirement and severance benefits 231,060,703 138,734,091
Accrual for allowance for doubtful accounts 206,638,605 48,943,879
Loss on foreign currency translation 52,412,507 61,923,820
Loss on disposal of property, plant and equipment 2,420,634 16,463,892
Loss on valuation of equity method investments 37,350,645 194,614,208
Amortization of development costs 50,107,514 43,937,229
Loss on valuation of foreign exchange forward contracts 1,280,506,612 3,465,964,718
Accrual for foreseeable losses on construction contracts 10,354,528 -
Gain on foreign currency translation (27,911,838) (29,530,267)
Gain on valuation of equity method investments (1,273,555,935) (479,596,159)
Gain on valuation of foreign exchange forward contracts (498,359,191) (1,123,079,572)
reversal of allowance for doubtful accounts (56,794,398) (91,734,801)
others, net 149,783,637 (143,154,232)
₩ 4,365,198,761 ₩ 4,649,669,763
Changes in assets and liabilities:
Accounts and notes receivable - trade ₩ (1,378,288,653) ₩ (539,653,977)
Accounts receivable - other (24,979,429) 125,837,400
Accrued income (829,100) 21,236,562
Advance payments 265,253,124 (379,742,025)
inventories (155,614,507) 303,820,209
Foreign exchange forward contracts (910,339,445) (2,781,147,823)
Accounts and notes payable – trade 505,971,242 (900,841,316)
Accounts payable - other 58,022,624 (34,330,548)
Advances from customers (2,595,327,513) (1,545,942,898)
Accrued expenses (20,637,658) (23,925,895)
income tax payable 431,127,890 (210,026,183)
Deposit for severance benefit insurance 338,766,711 57,442,086
Payment of retirement and severance benefits (664,236,835) (164,508,686)
Deferred tax assets (728,039) 99,969,668
Deferred tax liabilities 163,045,987 41,635,138
others, net 311,698,727 322,518,271
Net cash provided by (used in) operating activities ₩ 688,103,887 ₩ (957,990,254)
see accompanying notes to non-consolidated financial statements.
(Continued)

solid & steady independent Auditors’ report64 Hyundai Heavy industries Annual report 2010 65
(in thousands of won)
2010 2009
Cash flows from investing activities
Disposal of short-term financial instruments ₩ 169,033,609 ₩ 1,687,213,470
Disposal of short-term investment securities - 102,966,108
Disposal of short-term loans - 30,000,000
Disposal of long-term financial instruments - 11,947,520
Disposal of long-term investment securities 44,622,312 54,916,202
Disposal of equity method investments 32,350,013 19,773
Disposal of long-term loans 1,751,400 -
Disposal of other non-current assets 2,890,924 24,744,631
Disposal of property, plant and equipment 6,844,088 128,172,881
Acquisition of short-term financial instruments (65,500,605) (119,852,680)
Acquisition of long-term financial instruments - (43,008)
Acquisition of long-term investment securities (36,009,126) (41,682,718)
Acquisition of equity method investments (2,695,131,696) (272,547,011)
Acquisition of long-term loans - (2,107,387)
Acquisition of other non-current assets (67,138,052) (15,975,956)
Acquisition of property, plant and equipment (371,784,649) (1,178,859,217)
Acquisition of intangible assets (69,731,036) (72,139,257)
Net cash provided by (used in) investing activities ₩ (3,047,802,818) ₩ 336,773,351
Cash flows from financing activities
Proceeds from short-term borrowings ₩ 5,660,186,509 ₩ 2,024,861,331
Proceeds from debentures - 298,797,600
Proceeds from long-term borrowings 27,729,941 1,852,037
repayment of short-term borrowings (3,124,141,994) (1,439,540,723)
Dividends paid (212,174,207) (299,667,280)
Net cash provided by financing activities ₩ 2,351,600,249 ₩ 586,302,965
Net decrease in cash and cash equivalents ₩ (8,098,682) ₩ (34,913,938)
Cash and cash equivalents at beginning of year 632,578,218 667,492,156
Cash and cash equivalents at end of year ₩ 624,479,536 ₩ 632,578,218
1. Organization and Description of Business
Hyundai Heavy Industries Co., Ltd. (the “Company”) was incorporated in 1973, under the Commercial Code of the Republic of Korea, and is engaged in
the manufacture and sale of ships, offshore structures, plants, engines and other items.
The Company listed its shares on the Korea Stock Exchange in August 1999, and a total of 76,000,000 shares (par value: ₩5,000, authorized:
160,000,000 shares) of common stock were issued and outstanding as of December 31, 2010. Of the total issued shares, the company’s major stock-
holders Mong-Joon Chung, Hyundai Mipo Dockyard Co., Ltd., KCC Corporation, Mirae Asset Investment Management Co., Ltd. and National Pension
Service own 10.80%, 7.98%, 6.72%, 4.27% and 3.68%, respectively.
Under the Articles of Incorporation, the Company is authorized to issue 20,000,000 shares of cumulative, participating, non-voting preferred stock and
to issue convertible debentures and debentures with common or preferred stock purchase options up to ₩400,000 million each, depository receipts
free from any preemptive rights of shareholders by the approval of the board of directors and grant stock options to the Company’s employees and di-
rectors of up to 15% of issued common stock; however, no preferred stock, convertible debentures or debentures with stock options and depository re-
ceipts have been issued, and no stock options have been granted to the Company’s employees and directors as of December 31, 2010. The Company
may also raise capital by obtaining the approval of the Board of Directors by issuing stock to old shareholders, issuing stock through a general public
subscription totaling under 30% of outstanding shares, issuing stock through the issue of depository receipts under the Securities and Exchange Act
and issuing stock to employees under certain circumstances.
2. Basis of Presenting Financial Statements and Summary of Significant Accounting Policies
(a) Basis of Presenting Financial Statements
The Company maintains its accounting records in Korean won and prepares statutory non-consolidated financial statements in the Korean language in
conformity with accounting principles generally accepted in the Republic of Korea. Certain accounting principles applied by the Company that conform
with financial accounting standards and accounting principles in the Republic of Korea may not conform with generally accepted accounting principles
in other countries. Accordingly, these financial statements are intended solely for use by those who are informed about Korean accounting principles
and practices. The accompanying non-consolidated financial statements have been condensed, restructured and translated into English from the Ko-
rean language non-consolidated financial statements.
The Company prepare the non-consolidated financial statements in accordance with generally accepted accounting principles in the Republic of Korea
and applied the same accounting policies that were adopted in the previous year’s non-consolidated financial statements.
(b) Cash Equivalents
The Company considers short-term deposits with maturities of three months or less on acquisition date to be cash equivalents.
(c) Allowance for Doubtful Accounts
Allowance for doubtful accounts is estimated based on an analysis of individual accounts and past experience of collection and presented as a deduc-
tion from trade receivables.
Non-Consolidated Statements of Cash Flows, Continued Notes to Non-Consolidated Financial StatementsFor the years ended December 31, 2010 and 2009 For the years ended December 31, 2010 and 2009
see accompanying notes to non-consolidated financial statements.

solid & steady Financial statements66
Notes to Non-Consolidated Financial StatementsDecember 31, 2010 and 2009
Hyundai Heavy industries Annual report 2010 67
(d) Inventories
Inventories are stated at the lower of cost or net realizable value. Net realizable value is the estimated selling price in the ordinary course of business,
less the estimated selling costs. The cost of inventories is determined by the moving-average method. Amounts of inventory written down to net realiz-
able value due to losses occurring in the normal course of business are recognized as cost of goods sold and are deducted as an allowance from the
carrying value of inventories.
The Company recognizes interest costs and other financial charges on borrowings associated with inventories that require a long period for acquisition,
construction or production as an expense in the period in which they are incurred.
(e) Investments in Securities
Classification
Upon acquisition, the Company classifies debt and equity securities (excluding investments in subsidiaries, associates and joint ventures) into the fol-
lowing categories: held-to-maturity, trading, or available-for-sale securities.
Investments in debt securities where the Company has the positive intent and ability to hold to maturity are classified as held-to-maturity. Securities
that are acquired principally for the purpose of selling in the short term are classified as trading securities. Investments not classified as either held-to-
maturity or trading securities are classified as available-for-sale securities.
Initial recognition
Investments in securities (excluding investments in subsidiaries, associates and joint ventures) are initially recognized at cost.
Subsequent measurement and income recognition
Trading securities are subsequently carried at fair value. Gains and losses arising from changes in the fair value of trading securities are included in
the statement of income in the period in which they arise. Available-for-sale securities are subsequently carried at fair value. Gains and losses arising
from changes in the fair value of available-for-sale securities are recognized as accumulated other comprehensive income, net of tax, directly in equity.
Investments in available-for-sale securities that do not have readily determinable fair values are recognized at cost, less impairment, if any. Held-to-
maturity investments are carried at amortized cost with interest income and expense recognized in the statement of income using the effective interest
method.
Fair value information
The fair value of marketable securities is determined using quoted market prices as of the period end. Non-marketable debt securities are fair valued
by discounting cash flows using the prevailing market rates for debt with a similar credit risk and remaining maturity. Credit risk is determined using the
Company’s credit rating as announced by accredited credit rating agencies in Korea. The fair value of investments in money market funds is determined
by investment management companies.
Presentation
Trading securities, available-for-sale securities which mature within one year from the end of the reporting period or where the likelihood of disposal
within one year from the end of the reporting period is probable, held-to-maturity securities which mature within one year from the end of the report-
ing period, short-term deposits and short-term loans are combined and presented as current assets. All other available-for-sale securities and held-to-
maturity securities are combined and presented as long-term investments.
Impairment
The Company reviews investments in securities whenever events or changes in circumstances indicate that the carrying amount of the investments
may not be recoverable. Impairment losses are recognized when the reasonably estimated recoverable amounts are less than the carrying amount and
there is no clear evidence that impairment is unnecessary.
An impairment loss is reversed if the reversal can be related objectively to an event occurring after the impairment loss was recognized and a reversal
of an impairment loss shall not exceed the carrying amount that would have been determined net of amortization had no impairment loss been recog-
nized in the asset in prior years. For financial assets measured at amortized cost and available-for-sale assets that are debt securities, the reversal is
recognized in profit or loss. For available-for-sale financial assets that are equity securities, the reversal is recognized directly in equity.
(f) Investments in Associates and Subsidiaries
Associates are entities of the Company and its subsidiaries over which the Company has the ability to significantly influence financial and operating
policies. Significant influence is presumed if the Company holds, directly or indirectly, 20 percent or more of the voting power unless it can be clearly
demonstrated that this is not the case. Subsidiaries are entities controlled by the Company.
Investments in associates and subsidiaries are accounted for using the equity method of accounting and are initially recognized at cost.
The Company’s investments in associates and subsidiaries include goodwill identified on the acquisition date. Goodwill is calculated as the excess of
the acquisition cost of an investment in an associates or subsidiary over the Company’s share of the fair value of the identifiable net assets acquired.
Goodwill is amortized using the straight-line method over its estimated useful life. Amortization of goodwill is recorded together with equity income
(losses).
When events or circumstances indicate that the carrying value of goodwill may not be recoverable, the Company reviews goodwill for impairment and
records any impairment loss immediately in the statement of income.
The Company’s share of its post-acquisition profits or losses in investments in associates and subsidiaries is recognized in the statement of income,
and its share of post-acquisition movements in equity is recognized in equity. The cumulative post-acquisition movements are adjusted against the
carrying amount of each investment. Changes in the carrying amount of an investment resulting from dividends by an associate or subsidiary are rec-
ognized when the associate or subsidiary declares the dividend. When the Company’s share of losses in an associate or subsidiary equals or exceeds
its interest in the associate or subsidiary, including preferred stock or other long term loans and receivables issued by the associate or subsidiary, the
Company does not recognize further losses, unless it has incurred obligations or made payments on behalf of the associate or subsidiary.
If the investee is a subsidiary, net income and net assets of the parent company’s separate financial statements should agree with the parent com-
pany’s share in the net income and net assets of the consolidated financial statements, except when the Company discontinues the application of the
equity method due to its investment in a subsidiary being reduced to zero.
Unrealized gains on transactions between the Company and its associates or subsidiaries are eliminated to the extent of the Company’s interest in
each associate or subsidiary.
(g) Property, Plant and Equipment
Property, plant and equipment are stated at cost, except in the case of revaluations made in accordance with the Asset Revaluation Law, which allowed
for asset revaluation prior to the Law being revoked on December 31, 2000. Assets acquired through investment in kind or donations are recorded at
their fair value upon acquisition. For assets acquired in exchange for a non-monetary asset, the fair value of the asset given up is used to measure the
cost of the asset received unless the fair value of the asset received is more clearly evident.
solid & steady Financial statements68
Notes to Non-Consolidated Financial StatementsDecember 31, 2010 and 2009
Hyundai Heavy industries Annual report 2010 69
Significant additions or improvements extending the useful lives of assets are capitalized. Normal maintenance and repairs are charged to expense as
incurred.
Depreciation is computed using the straight-line method, based on the estimated useful lives of the assets as described below:
The Company recognizes interest costs and other financial charges on borrowings associated with the production, acquisition or construction of prop-
erty, plant and equipment as an expense in the period in which they are incurred.
The Company reviews property, plant and equipment for impairment whenever events or changes in circumstances indicate that the carrying amount
of an asset may not be recoverable. An impairment loss is recognized when the expected estimated undiscounted future net cash flows from the use of
the asset and its eventual disposal are less than its carrying amount.
As of January 1, 2009, the Company adopted the revaluation model in accordance with the revised Statements of Korea Accounting Standards
(“SKAS”) No. 5 Property, Plant and Equipment. The book value of land is accounted at fair value as of the date of the revaluation, less accumulated
impairment loss. If an asset’s book value increases as a result of the revaluation, the amount of the increase is recognized in other comprehensive in-
come, of which the amount of the increase that reverses a revaluation decrease of the same asset previously recognized in profit and loss is recognized
in profit and loss in the current period. On the other hand, if an asset’s book value decreases as a result of the revaluation, that decrease is recognized
as a loss for the current period, and the portion of the amount of decrease included in the credit balance in the revaluation surplus recorded in other
comprehensive income is deducted from other comprehensive income.
(h) Intangible Assets
Intangible assets are stated at cost less accumulated amortization and impairment losses, if any. Impairment losses are determined as the amount re-
quired to reduce the carrying amount of an intangible asset to its recoverable amount.
The criteria for determining whether an incurred cost qualifies as an intangible asset and the periods of amortization for each classification of intangible
asset are described below.
(i) Research and development costs
To assess whether an internally generated intangible asset meets the criteria for recognition, the Company classifies the expense generation process
into a research phase and a development phase. All costs incurred during the research phase are expensed as incurred. Costs incurred during the
development phase are recognized as assets only if the following criteria are met for recognition in SKAS No. 3 Intangible Assets: (1) completion of the
intangible asset is technically feasible so that it will be available for use or sale; (2) the Company has the intention and ability to complete the intangible
asset and use or sell it; (3) there is evidence that the intangible asset will generate probable future economic benefit; (4) the Company has adequate
technical, financial and other resources to complete the development of the intangible asset and the intangible asset will be available; and (5) the ex-
penditures attributable to the intangible asset during its development can be reliably determined.
Useful lives (years)
Buildings and structures 20, 40
Machinery and equipment 10
ships 12
Vehicles 5
tools, furniture and fixtures 5
If the costs incurred fail to satisfy these criteria, they are recorded as expenses as incurred. Where development costs satisfy the criteria, they are capi-
talized and amortized on a straight-line basis over five years. The expenditure capitalized includes the cost of materials, direct labor and an appropriate
proportion of overhead.
(ii) Other intangible assets
Other intangible assets, which consist of usage rights for the donated properties, are amortized using the straight-line method over 20~40 years.
(i) Discount on Debentures
Discount on debentures issued, which represents the difference between the face value and issuance price of debentures, is amortized using the ef-
fective interest rate method over the life of the debentures. The amount amortized is included in interest expense.
(j) Retirement and Severance Benefits
Employees who have been with the Company for more than one year are entitled to lump-sum payments based on salary rates and length of service
at the time they leave the Company. The Company’s estimated liability under the plan, which would be payable if all employees left at the end of the
reporting period, is accrued in the accompanying non-consolidated statements of financial position. A portion of the liability is covered by an employ-
ees’ severance benefits trust where the employees have a vested interest in the deposit with the insurance company in trust. The deposit for severance
benefits held in trust is, therefore, reflected in the accompanying non-consolidated statements of financial position as a reduction of the liability for
retirement and severance benefits.
Through March 1999, under the National Pension Scheme of Korea, the Company transferred a certain portion of retirement allowances for employees
to the National Pension Fund. The amount transferred reduced the retirement and severance benefit amount to be paid to the employees when they
leave the Company and is accordingly reflected in the accompanying non-consolidated financial statements as a reduction of the retirement and sev-
erance benefits liability. However, due to regulation effective April 1999, such transfers to the National Pension Fund are no longer required.
(k) Foreign Currency Translation
Monetary assets and liabilities denominated in foreign currencies are translated into Korean won at the foreign exchange rate at the end of the report-
ing period, with the resulting gains or losses recognized in the statement of income. Non-monetary assets and liabilities denominated in foreign curren-
cies, which are stated at historical cost, are translated into Korean won at the foreign exchange rate on the date of the transaction.
Foreign currency assets and liabilities of foreign-based operations and companies accounted for using the equity method are translated at the rate of
exchange at the end of the reporting period. Foreign currency amounts in the statement of income are translated using an average rate, and foreign
currency balances in the capital account are translated using the historical rate. Translation gains and losses arising from collective translation of the
foreign currency financial statements of foreign-based operations are recorded net of accumulated other comprehensive income. These gains and
losses are subsequently recognized as income in the year the foreign operations or the companies are liquidated or sold.
(l) Derivatives and Hedge Accounting
The Company holds derivative financial instruments to hedge its foreign currency and interest rate risk exposures. Embedded derivatives are separated
from the host contract and accounted for separately if the economic characteristics and risks of the host contract and the embedded derivatives are
not closely related and a separate instrument with the same terms as the embedded derivative would meet the definition of a derivative.
Derivatives are initially recognized at fair value on the date a derivative contract is entered into and are subsequently remeasured at their fair value. At-
tributable transaction costs are recognized in profit or loss when incurred.

solid & steady Financial statements70
Notes to Non-Consolidated Financial StatementsDecember 31, 2010 and 2009
Hyundai Heavy industries Annual report 2010 71
Hedge accounting
Where a derivative, which meets certain criteria, is used for hedging the exposure to changes in the fair value of a recognized asset, liability or firm com-
mitment, it is designated as a fair value hedge. Where a derivative, which meets certain criteria, is used for hedging the exposure to the variability of the
future cash flows of a forecasted transaction, it is designated as a cash flow hedge.
The Company documents, at the inception of the transaction, the relationship between hedging instruments and hedged items, as well as its risk man-
agement objective and strategy for undertaking various hedging transactions. The Company also documents its assessment, both at hedge inception
and on an ongoing basis, of whether the derivatives that are used in hedging transactions are highly effective in offsetting the changes in fair values or
cash flows of hedged items.
Fair value hedge
Changes in the fair value of derivatives that are designated and qualify as fair value hedges are recorded in the statement of income, together with any
changes in the fair value of the hedged asset or liability that are attributable to the hedged risk.
Cash flow hedge
The effective portion of changes in the fair value of derivatives that are designated and qualified as cash flow hedges are recognized in equity. The gain
or loss relating to any ineffective portion is recognized immediately in the statement of income. Amounts accumulated in equity are recycled to the
statement of income in the periods in which the hedged item will affect income or expense. When a hedging instrument expires or is sold, or when a
hedge no longer meets the criteria for hedge accounting, any cumulative gain or loss existing in equity at the time remains in equity and is recognized
when the forecast transaction is ultimately recognized in the statement of income. When a forecast transaction is no longer expected to occur, the cu-
mulative gain or loss that was reported in equity is immediately transferred to the statement of income.
Derivatives that do not qualify for hedge accounting
Changes in the fair value of derivative instruments that are not designated as fair value or cash flow hedges are recognized immediately in the state-
ment of income.
Separable embedded derivatives
Changes in the fair value of separable embedded derivatives are recognized immediately in the statement of income.
(m) Provisions, Contingent Assets and Contingent Liabilities
Provisions are recognized when all of the following are met: (1) an entity has a present obligation as a result of a past event; (2) it is probable that an
outflow of resources embodying economic benefits will be required to settle the obligation, and (3) a reliable estimate can be made of the amount of
the obligation. Where the effect of the time value of money is material, a provision is recorded at the present value of the expenditures expected to be
required to settle the obligation.
Where the expenditure required to settle a provision is expected to be reimbursed by another party, the reimbursement is recognized as a separate as-
set when, and only when, it is virtually certain that reimbursement will be received if the Company settles the obligation. The expense generated by the
provision is presented net of the amount of expected reimbursement.
(n) Revenue Recognition
Revenues from long-term contracts, including shipbuilding contracts, are recognized using the percentage-of-completion method, measured by the
units of work performed. Revenues from other sales are recognized upon delivery of goods.
Under the percentage-of-completion method, revenues are recognized based on the percentage of costs incurred (including man hours and raw mate-
rial costs) over total estimated costs for each contract. As a result, the timing of revenue recognition of which the Company reports may differ materi-
ally from the timing of actual contract payments received. The Company’s estimates reflect the most current information from construction activities.
In addition, since most contracts are completed over several months, the timing of the recognition of related revenues could have a significant impact
on quarterly operating results.
The revenue recognized in excess of the payment received by the Company is reflected as accounts receivable, while the payments received in excess
of the revenue recognized by the Company are reflected as advances from customers. The expenditures incurred before the construction contract is
entered into are recognized as prepaid construction costs if they are directly related to making a contract, separately identifiable and reliably measur-
able, and a contract is probable. The prepaid construction costs are transferred to construction cost at the commencement of the construction.
(o) Income Taxes
Income tax on the income or loss for the year comprises current and deferred tax. Income tax is recognized in the statement of income except to the
extent that it relates to items recognized directly in equity, in which case it is recognized in equity.
Current tax is the expected tax payable on the taxable income for the year using tax rates enacted.
Deferred tax is calculated using the asset and liability method, providing for temporary differences between the carrying amounts of assets and liabili-
ties for financial reporting purposes and the amounts used for tax purposes. The amount of deferred tax provided is based on the expected manner of
realization or settlement of the carrying amount of assets and liabilities, using tax rates enacted or substantively enacted at the end of the reporting
period.
A deferred tax asset is recognized only to the extent that it is probable that future taxable income will be available against which the unused tax losses
and credits can be utilized. Deferred tax assets are reduced to the extent that it is no longer probable that the related tax benefit will be realized.
Deferred tax assets and liabilities are classified as current or non-current based on the classification of the related asset or liability for financial report-
ing or the expected reversal date of the temporary difference for those with no related asset or liability such as loss carry-forwards and tax credit carry-
forwards. The deferred tax amounts are presented as a net current asset or liability and a net non-current asset or liability.
Changes in deferred taxes due to a change in the tax rate, except for those related to items initially recognized outside profit or loss (either in other
comprehensive income or directly in equity), are recognized as income in the current year.
(p) Earnings per Share
Earnings per share are calculated by dividing net income by the weighted-average number of shares outstanding during the period.
(q) Use of Estimates
The preparation of non-consolidated financial statements in accordance with accounting principles generally accepted in the Republic of Korea re-
quires management to make estimates and assumptions that affect the amounts reported in the non-consolidated financial statements and related
notes to non-consolidated financial statements. Actual results could differ from those estimates.
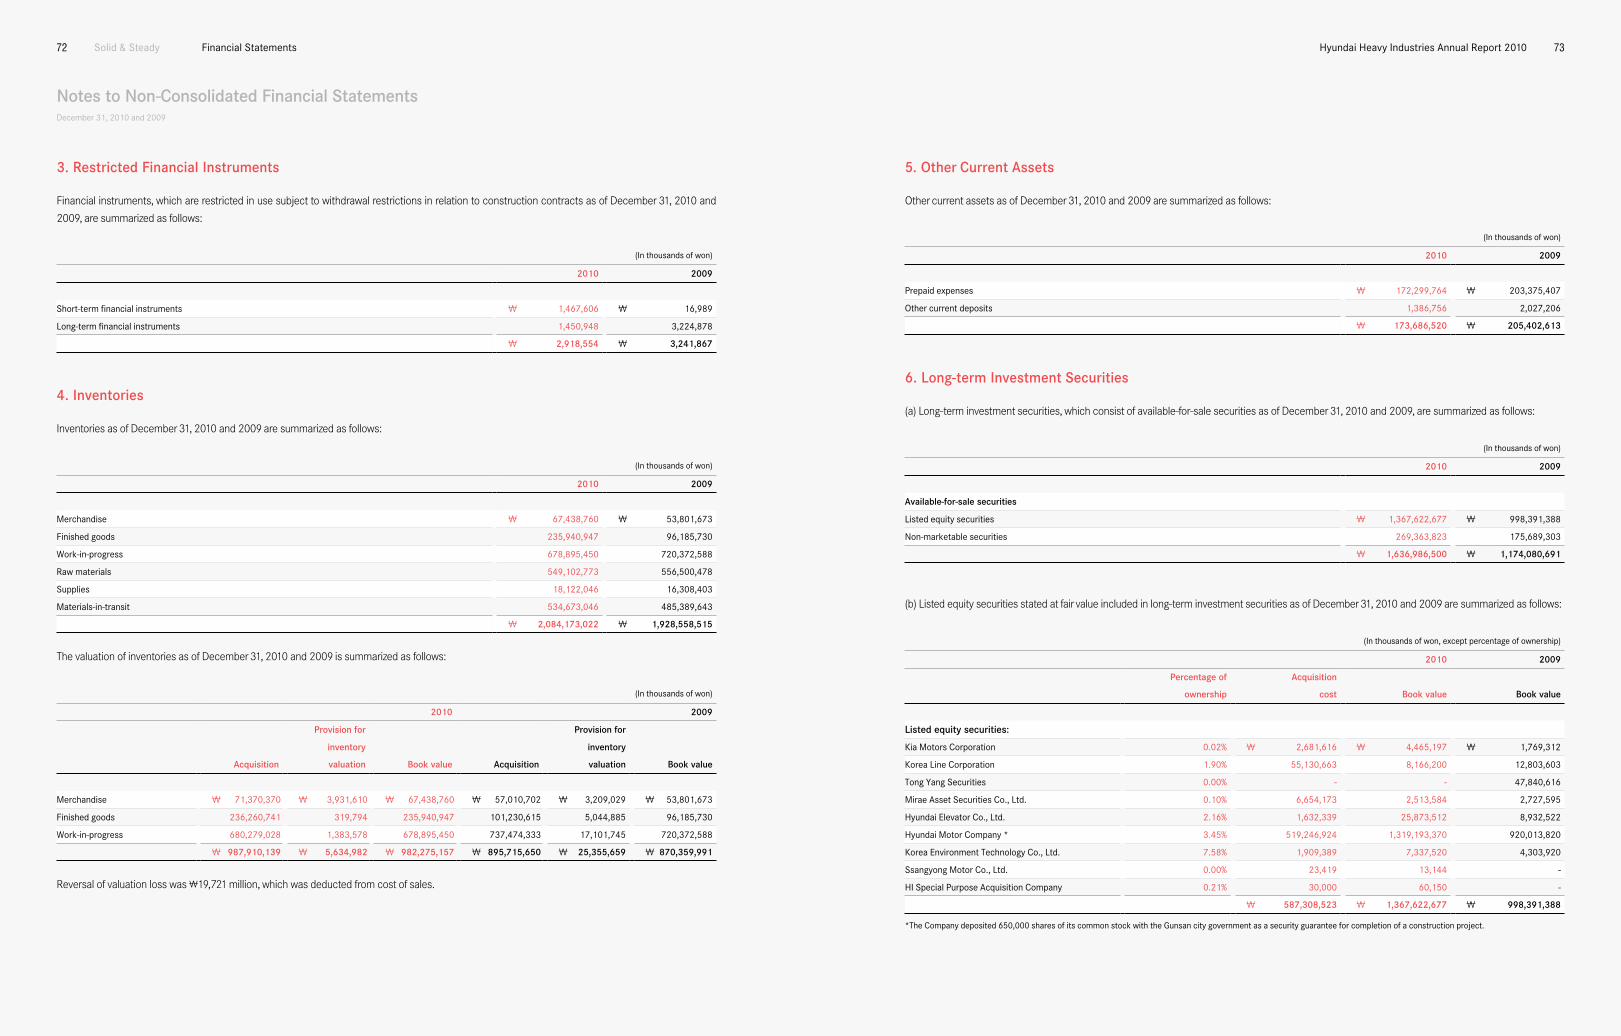
solid & steady Financial statements72
Notes to Non-Consolidated Financial StatementsDecember 31, 2010 and 2009
Hyundai Heavy industries Annual report 2010 73
3. Restricted Financial Instruments
Financial instruments, which are restricted in use subject to withdrawal restrictions in relation to construction contracts as of December 31, 2010 and
2009, are summarized as follows:
4. Inventories
Inventories as of December 31, 2010 and 2009 are summarized as follows:
The valuation of inventories as of December 31, 2010 and 2009 is summarized as follows:
Reversal of valuation loss was ₩19,721 million, which was deducted from cost of sales.
(in thousands of won)
2010 2009
short-term financial instruments ₩ 1,467,606 ₩ 16,989
Long-term financial instruments 1,450,948 3,224,878
₩ 2,918,554 ₩ 3,241,867
(in thousands of won)
2010 2009
Merchandise ₩ 67,438,760 ₩ 53,801,673
Finished goods 235,940,947 96,185,730
Work-in-progress 678,895,450 720,372,588
raw materials 549,102,773 556,500,478
supplies 18,122,046 16,308,403
Materials-in-transit 534,673,046 485,389,643
₩ 2,084,173,022 ₩ 1,928,558,515
(in thousands of won)
2010 2009
Provision for Provision for
inventory inventory
Acquisition valuation Book value Acquisition valuation Book value
Merchandise ₩ 71,370,370 ₩ 3,931,610 ₩ 67,438,760 ₩ 57,010,702 ₩ 3,209,029 ₩ 53,801,673
Finished goods 236,260,741 319,794 235,940,947 101,230,615 5,044,885 96,185,730
Work-in-progress 680,279,028 1,383,578 678,895,450 737,474,333 17,101,745 720,372,588
₩ 987,910,139 ₩ 5,634,982 ₩ 982,275,157 ₩ 895,715,650 ₩ 25,355,659 ₩870,359,991
5. Other Current Assets
Other current assets as of December 31, 2010 and 2009 are summarized as follows:
6. Long-term Investment Securities
(a) Long-term investment securities, which consist of available-for-sale securities as of December 31, 2010 and 2009, are summarized as follows:
(b) Listed equity securities stated at fair value included in long-term investment securities as of December 31, 2010 and 2009 are summarized as follows:
(in thousands of won)
2010 2009
Prepaid expenses ₩ 172,299,764 ₩ 203,375,407
other current deposits 1,386,756 2,027,206
₩ 173,686,520 ₩ 205,402,613
(in thousands of won)
2010 2009
Available-for-sale securities
Listed equity securities ₩ 1,367,622,677 ₩ 998,391,388
non-marketable securities 269,363,823 175,689,303
₩ 1,636,986,500 ₩ 1,174,080,691
(in thousands of won, except percentage of ownership)
2010 2009
Percentage of Acquisition
ownership cost Book value Book value
Listed equity securities:
Kia Motors Corporation 0.02% ₩ 2,681,616 ₩ 4,465,197 ₩ 1,769,312
Korea Line Corporation 1.90% 55,130,663 8,166,200 12,803,603
tong Yang securities 0.00% - - 47,840,616
Mirae Asset securities Co., Ltd. 0.10% 6,654,173 2,513,584 2,727,595
Hyundai elevator Co., Ltd. 2.16% 1,632,339 25,873,512 8,932,522
Hyundai Motor Company * 3.45% 519,246,924 1,319,193,370 920,013,820
Korea environment technology Co., Ltd. 7.58% 1,909,389 7,337,520 4,303,920
ssangyong Motor Co., Ltd. 0.00% 23,419 13,144 -
Hi special Purpose Acquisition Company 0.21% 30,000 60,150 -
₩ 587,308,523 ₩ 1,367,622,677 ₩ 998,391,388
*the Company deposited 650,000 shares of its common stock with the Gunsan city government as a security guarantee for completion of a construction project.

solid & steady Financial statements74
Notes to Non-Consolidated Financial StatementsDecember 31, 2010 and 2009
Hyundai Heavy industries Annual report 2010 75
(c) Unlisted equity securities, beneficiary certificates and investments in capital included in long-term investment securities as of December 31, 2010
and 2009 are summarized as follows:
(in thousands of won, except percentage of ownership)
2010 2009
Percentage of Acquisition
ownership cost Book value Book value
Unlisted equity securities: *1
Gangwon Football Club Co., Ltd. 0.01% ₩ 1,000 ₩ 1,000 ₩ 1,000
Kuk Dong Heavy Conveyance Co., Ltd. 7.50% 501,720 501,720 501,720
novelis Korea Ltd. 0.45% 14,598,913 1,405,452 1,405,452
Daehan oil Pipeline Corporation 6.39% 14,511,802 14,511,802 14,511,802
Dong-A Precision Machinery. Co., Ltd. 0.01% 35,640 - -
Doosan Capital Co., Ltd. *2 9.99% 10,000,000 22,866,000 24,762,000
Bexco, Ltd. 7.96% 9,460,000 9,460,000 9,460,000
Chonggu Co., Ltd. 0.00% 188,260 - -
Postec electronic Power Fund Co. 1.75% 500,000 500,000 500,000
Hanwha electric Venture Fund 2.00% 500,000 500,000 500,000
Hyundai research institute 14.40% 1,440,000 1,440,000 1,440,000
Hyundai Climate Control Co., Ltd. 10.00% 50,000 50,000 50,000
enova system inc. 1.43% 1,314,583 1,314,583 1,314,583
Pt. Golden Hyundai Machinery *3 20.83% 155,250 155,250 155,250
HHi Mauritius Limited *3 100.00% 122 122 122
Hynix semiconductor America inc. 1.33% 34,525,619 - -
Hyundai Heavy industries France sAs *3 100.00% 22,787 22,787 22,787
Hyundai (Malaysia) sDn BHD *3 100.00% 17,286 - -
Hyundai technologies Center Hungary Kft. *3 100.00% 26,302 26,302 26,302
KC Karpovsky BV 10.00% 2,443 - 2,443
Korea ship Finance Co., Ltd. 2.36% 200,000 200,000 200,000
nikorma transport Limited 11.50% 10,914 10,914 10,914
PHeCo inc. *3 100.00% 2,303,555 236,621 236,621
Kimpo solar Co., Ltd. 14.29% 50,000 50,000 -
osX Construcao naval s.A. 10.01% 29,968,867 29,968,867 -
₩ 120,385,063 ₩ 83,221,420 ₩ 55,100,996
Beneficiary certificates 63,455,026 180,949,593 115,427,397
Investments in capital 5,192,810 5,192,810 5,160,910
₩ 189,032,899 ₩ 269,363,823 ₩ 175,689,303
*1 the book values of unlisted equity securities were recorded at their acquisition cost because the fair values cannot be estimated reliably.
*2 the fair value was calculated by using the free cash flows to shareholders method and estimation of stock price distribution.
*3 in conformity with financial accounting standards in the republic of Korea, the equity securities were not accounted for using the equity method of accounting since the Company
believes the changes in the investment value resulting from the changes in the net assets of the investees, whose individual beginning balance of total assets as of December 31,
2010 and 2009, is less than ₩10,000 million, are not material.
(d) Valuation of available-for-sale securities in accumulated other comprehensive income (net of tax effect), all of which are classified into long-term
investment securities stated at fair value as of December 31, 2010 is summarized as follows:
(in thousands of won)
2010
Balance at
Balance at Increase December 31,
January 1, 2010 (decrease) 2010
Kia Motors Corporation ₩ (711,597) ₩ 2,102,790 ₩ 1,391,193
Korea Line Corporation (33,015,107) 33,015,107 -
tong Yang securities 3,527,406 (3,527,406) -
Mirae Asset securities Co., Ltd. (3,062,730) (166,929) (3,229,659)
Hyundai elevator Co., Ltd. 5,694,143 13,213,971 18,908,114
Hyundai Motor Company 312,598,179 311,360,049 623,958,228
Korea environment technology Co., Ltd. (323,006) 2,366,208 2,043,202
ssangyong Motor Co., Ltd. - (8,015) (8,015)
Hi special Purpose Acquisition Company - 23,517 23,517
Doosan Capital Co., Ltd. 11,514,360 (1,478,880) 10,035,480
₩ 296,221,648 ₩ 356,900,412 ₩ 653,122,060
Beneficiary certificates 43,956,427 47,689,335 91,645,762
₩ 340,178,075 ₩ 404,589,747 ₩ 744,767,822
Valuation of available-for-sale securities in accumulated other comprehensive income (net of tax effect), all of which are classified into long-term invest-
ment securities stated at fair value as of December 31, 2009, is summarized as follows:
(in thousands of won)
2009
Balance at
Balance at Increase December 31,
Equity securities: January 1, 2009 (decrease) 2009
Kia Motors Corporation ₩ (1,640,817) ₩ 929,220 ₩ (711,597)
Korea Line Corporation (26,925,588) (6,089,519) (33,015,107)
tong Yang securities (14,974,952) 18,502,358 3,527,406
Mirae Asset securities Co., Ltd. (2,911,530) (151,200) (3,062,730)
sK Broadband Corporation 5,084 (5,084) -
Hyundai elevator Co., Ltd. 6,535,032 (840,889) 5,694,143
Hyundai Motor Company (170,751,231) 483,349,410 312,598,179
Hyundai Corporation 340,402 (340,402) -
Korea environment technology Co., Ltd. - (323,006) (323,006)
Daehan oil Pipeline Corporation 12,120,881 (12,120,881) -
Doosan Capital Co., Ltd. 11,214,840 299,520 11,514,360
₩ (186,987,879) ₩ 483,209,527 ₩ 296,221,648
Subordinated bonds (1,734,668) 1,734,668 -
Beneficiary certificates (7,914,149) 51,870,576 43,956,427
₩ (196,636,696) ₩ 536,814,771 ₩ 340,178,075
(e) The Company recognizes impairment losses when the recoverable amount of securities is less than the carrying amount or the acquisition cost. Im-
pairment losses in the amount of ₩46,966,905 thousand were recognized during the year ended December 31, 2010.

solid & steady Financial statements76
Notes to Non-Consolidated Financial StatementsDecember 31, 2010 and 2009
Hyundai Heavy industries Annual report 2010 77
7. Equity Method Investments
(a) Investments in companies accounted for using the equity method as of December 31, 2010 are summarized as follows:
(in thousands of won, except share data and percentage of ownership)
Percentage of
Company Number of shares ownership Acquisition cost Book value
Hyundai oilbank Co., Ltd. *1 223,331,529 91.13% ₩ 2,893,338,693 ₩ 3,059,896,991
Hyundai Finance Corporation *1 12,350,000 67.49% 78,197,738 99,604,004
Hyundai samho Heavy industries Co., Ltd. *1 37,967,000 94.92% 204,259,700 2,521,330,622
Hyundai Heavy industries Co. Bulgaria *1 12,155,829 99.09% 11,620,593 48,477,517
new Korea Country Club 16,457 20.00% 500,000 4,379,248
Hyundai Heavy industries europe n.V. *1 10 100.00% 35,656,728 17,812,756
Hyundai Vinashin shipyard *1, 2, 3 - 10.00% 2,543,678 26,057,614
Hyundai Construction equipment U.s.A. *1 23,900,000 100.00% 26,712,810 6,344,545
Vladivostok Business Center *1, 2 - 100.00% 5,891,667 24,524,528
HHi China investment Co., Ltd. *1, 2 - 100.00% 160,804,529 408,011,011
Hyundai Merchant Marine Co., Ltd.
(common stock) *4 23,424,037 16.35% 404,039,118 461,102,841
Hyundai Merchant Marine Co., Ltd.
(preferred stock) *4 1,758,344 17.58% 26,375,160 28,151,727
Qinhuangdao shouqin Metal Materials Co., Ltd. *2 - 20.00% 67,658,226 106,913,874
Hyundai ideal electric Co. *1 1,000 100.00% 18,119,600 26,269,951
Hyundai Financial Leasing Co., Ltd. *1, 2 - 41.26% 37,622,743 48,679,279
Hyundai Construction equipment india Private Ltd. *1 17,184,775 100.00% 39,354,139 23,111,115
Wärtsilä-Hyundai engine Company Ltd. *2 - 50.00% 33,930,000 44,125,623
Ulsan Hyundai Football Club Co., Ltd. 2,800,000 100.00% 14,000,000 3,070,386
Hyundai Heavy Material service *1 29,600,000 100.00% 148,000,000 158,229,616
KAM Corporation 23,520,000 49.00% 117,600,000 112,004,485
Grand China Hyundai shipping Company Ltd. 1,000,000 50.00% 1,016,600 1,030,961
KoMAs Corporation 754,414 100.00% 3,772,070 2,446,104
Hotel Hyundai Co., Ltd. 80,000 100.00% 1,397,000 2,453,011
Khorol Zerno Ltd. *2 - 80.79% 6,641,016 6,125,571
Hyundai Primorye Ltd. (formerly Khorol Agro Ltd.) *2 - 49.99% 3,573,517 3,147,244
Hyundai Corporation *5 4,992,782 22.36% 105,134,024 100,388,980
Hyundai-Avancis Co., Ltd. 8,000,000 50.00% 40,000,000 39,832,383
taebaek Wind Power Co., Ltd. 703,500 35.00% 3,517,500 3,445,752
Muju Wind Power Co., Ltd. 1,026,000 45.00% 5,130,000 5,045,339
Jinan Jangsu Wind Power Co., Ltd. 25,600 32.00% 128,000 128,000
Pyeongchang Wind Power Co., Ltd. 3,500 35.00% 17,500 15,122
Changjuk Wind Power Co., Ltd. 34,400 43.00% 172,000 171,103
Hyundai (shandong) Heavy industry
Machinery Co., Ltd. *1, 2 - 100.00% 33,183,027 30,462,756
Hyundai Power transformers UsA inc. *1 100 100.00% 29,080,000 28,083,390
₩ 4,558,987,376 ₩ 7,450,873,449
Investments in companies accounted for using the equity method as of December 31, 2009 are summarized as follows:
(in thousands of won, except share data and percentage of ownership)
Percentage of
Company Number of shares ownership Acquisition cost Book value
Hyundai oilbank Co., Ltd. 51,773,884 21.13% ₩ 312,249,753 ₩ 373,656,633
Hyundai Finance Corporation *1 12,350,000 67.49% 78,197,738 90,726,376
Hyundai samho Heavy industries Co., Ltd. *1 37,967,000 94.92% 204,259,700 1,817,689,776
Hyundai Heavy industries Co. Bulgaria *1 12,155,829 99.09% 11,620,593 46,768,262
new Korea Country Club 16,457 20.00% 500,000 4,045,252
Hyundai Heavy industries europe n.V. *1 10 100.00% 35,656,728 10,322,118
Hyundai Vinashin shipyard *1, 2, 3 - 10.00% 2,543,678 20,148,716
Hyundai Construction equipment U.s.A. *1 23,900,000 100.00% 26,712,810 -
Vladivostok Business Center *1, 2 - 57.14% 5,891,667 -
HHi China investment Co., Ltd. *1, 2 - 100.00% 160,804,529 286,425,278
Hyundai Merchant Marine Co., Ltd. (common stock) *4 23,424,037 17.60% 404,039,118 360,633,965
Hyundai Merchant Marine Co., Ltd. (preferred stock) *4 3,516,688 17.58% 52,750,320 56,303,455
Qinhuangdao shouqin Metal Materials Co., Ltd. *2 - 20.00% 67,658,226 128,357,731
Hyundai ideal electric Co. *1 1,000 100.00% 18,119,600 25,493,855
Hyundai Financial Leasing Co., Ltd. *1, 2 - 66.02% 37,622,743 44,416,791
Hyundai Construction equipment india Private Ltd. *1 17,184,775 100.00% 39,354,139 22,226,238
Wärtsilä Hyundai engine Company Ltd. *2 - 50.00% 33,930,000 40,496,305
Ulsan Hyundai Football Club Co., Ltd. 2,000,000 100.00% 10,000,000 913,199
Hyundai Heavy Material service *1 29,600,000 100.00% 148,000,000 122,135,871
KAM Corporation 23,520,000 49.00% 117,600,000 117,667,618
Grand China Hyundai shipping Company Ltd. 1,000,000 50.00% 1,016,600 1,045,336
KoMAs Corporation 754,414 100.00% 3,772,070 1,634,795
Hotel Hyundai Co., Ltd. 80,000 100.00% 1,397,000 1,806,723
Khorol Zerno Ltd. *2 - 67.60% 5,546,562 5,380,910
Khorol Agro Ltd. *2 - 49.99% 2,335,741 2,196,010
Hyundai Corporation 4,992,782 22.36% 105,134,024 105,134,024
taebaek Wind Power Co., Ltd. 703,500 35.00% 3,517,500 3,482,618
₩ 1,890,230,839 ₩ 3,689,107,855
*1 Company subsidiary.
*2 number of shares is not presented because they are non-par stock.
*3 since the percentage of ownership of the Company and its subsidiary is more than 20% and the Company has the ability to significantly influence financial and operating policy
decision, equity securities are accounted for using the equity method.
*4 since the percentage of ownership of the Company and its subsidiary is more than 20% and the Company has the ability to significantly influence financial and
operating policy decision, equity securities are accounted for using the equity method. in addition, the closing common stock price of Hyundai Merchant Marine Co.,
Ltd. on the stock market of the republic of Korea was ₩38,550 per share at December 31, 2010. its preferred stock has no market price because it is unlisted.
*5 the closing common stock price of Hyundai Corporation on the stock market of the republic of Korea was ₩25,650 per share at December 31, 2010.

solid & steady Financial statements78
Notes to Non-Consolidated Financial StatementsDecember 31, 2010 and 2009
Hyundai Heavy industries Annual report 2010 79
(in thousands of won)
Balance at Accumulated other Balance at
January Net income comprehensive Other increase December
Company 1, 2010 (loss) income (decrease) 31, 2010
Vladivostok Business Center - 138,263,211 (113,738,683) - 24,524,528
HHi China investment Co., Ltd. 286,425,278 113,843,137 7,742,596 - 408,011,011
Hyundai Merchant Marine Co., Ltd. (common stock) 360,633,965 75,230,777 36,950,117 (11,712,018) 461,102,841
Hyundai Merchant Marine Co., Ltd. (preferred stock) 56,303,455 1,055,006 - (29,206,734) 28,151,727
Qinhuangdao shouqin Metal Materials Co., Ltd. 128,357,731 (22,262,136) 818,279 - 106,913,874
Hyundai ideal electric Co. 25,493,855 1,409,892 (633,796) - 26,269,951
Hyundai Financial Leasing Co., Ltd. 44,416,791 8,170,128 (3,907,640) - 48,679,279
Hyundai Construction equipment india Private Ltd. 22,226,238 492,775 392,102 - 23,111,115
Wärtsilä-Hyundai engine Company Ltd. 40,496,305 3,629,318 - - 44,125,623
Ulsan Hyundai Football Club Co., Ltd. 913,199 (1,821,269) (21,544) 4,000,000 3,070,386
Hyundai Heavy Material service 122,135,871 3,741,942 32,351,803 - 158,229,616
KAM Corporation 117,667,618 (5,663,133) - - 112,004,485
Grand China Hyundai shipping Company Ltd. 1,045,336 10,644 (25,019) - 1,030,961
KoMAs Corporation 1,634,795 811,309 - - 2,446,104
Hotel Hyundai Co., Ltd. 1,806,723 646,288 - - 2,453,011
Khorol Zerno Ltd. 5,380,910 33,610 (383,403) 1,094,454 6,125,571
Hyundai Primorye Ltd. (formerly Khorol Argo Ltd.) 2,196,010 (141,660) (144,882) 1,237,776 3,147,244
Hyundai Corporation 105,134,024 (4,678,040) (67,004) - 100,388,980
Hyundai-Avancis Co., Ltd. - 24,383 (192,000) 40,000,000 39,832,383
taebaek Wind Power Co., Ltd. 3,482,618 (36,866) - - 3,445,752
Muju Wind Power Co., Ltd. - (84,661) - 5,130,000 5,045,339
Jinan Jangsu Wind Power Co., Ltd. - - - 128,000 128,000
Pyeongchang Wind Power Co., Ltd. - (2,378) - 17,500 15,122
Changjuk Wind Power Co., Ltd. - (897) - 172,000 171,103
Hyundai (shandong) Heavy industry Machinery Co., Ltd. - (2,264,564) (455,706) 33,183,026 30,462,756
Hyundai Power transformers UsA inc. - (395,041) (601,569) 29,080,000 28,083,390
₩3,689,107,855 ₩ 1,236,205,290 ₩ (71,166,418) ₩ 2,596,726,722 ₩ 7,450,873,449
(b) Changes in goodwill for equity method accounted investments for the year ended December 31, 2010 are summarized as follows:
(in thousands of won)
Balance at Balance at
Company January 1, 2010 Increase Amortized amount December 31, 2010
Hyundai oilbank Co., Ltd. ₩ 25,428,599 ₩ 995,955,671 ₩ (23,411,640) ₩ 997,972,630
Hyundai Merchant Marine Co., Ltd. (common stock) 20,259,048 - (16,495,697) 3,763,351
Qinhuangdao shouqin Metal Materials Co., Ltd. 5,681,673 - (2,843,063) 2,838,610
Hotel Hyundai Co., Ltd. 315,760 - (78,940) 236,820
Khorol Zerno Ltd. 1,185,644 - (253,776) 931,868
Hyundai Primorye Ltd. (formerly Khorol Argo Ltd.) 721,863 - (157,074) 564,789
Hyundai Corporation 72,334,654 - (14,466,931) 57,867,723
Hyundai (shandong) Heavy
industry Machinery Co., Ltd. - 7,688,942 (768,894) 6,920,048
₩ 125,927,241 ₩ 1,003,644,613 ₩ (58,476,015) ₩ 1,071,095,839
(c) Changes in the opening and closing balances of investments in companies accounted for using the equity method for the year ended December 31,
2010 are summarized as follows:
(in thousands of won)
Balance at Accumulated other Balance at
January Net income comprehensive Other increase December
Company 1, 2010 (loss) income (decrease) 31, 2010
Hyundai oilbank Co., Ltd. ₩ 373,656,633 ₩ 98,931,637 ₩ 21,067,687 ₩ 2,566,241,034 ₩ 3,059,896,991
Hyundai Finance Corporation 90,726,376 8,029,351 2,083,277 (1,235,000) 99,604,004
Hyundai samho Heavy industries Co., Ltd. 1,817,689,776 785,148,937 (43,541,091) (37,967,000) 2,521,330,622
Hyundai Heavy industries Co. Bulgaria 46,768,262 8,778,511 (4,867,940) (2,201,316) 48,477,517
new Korea Country Club 4,045,252 383,996 - (50,000) 4,379,248
Hyundai Heavy industries europe n.V. 10,322,118 10,281,360 (2,790,722) - 17,812,756
Hyundai Vinashin shipyard 20,148,716 7,658,038 (564,140) (1,185,000) 26,057,614
Hyundai Construction equipment U.s.A. - 6,981,685 (637,140) - 6,344,545
(d) Gain or loss on valuation of investment securities is accounted for after eliminating unrealized gains (losses) from inter-company transactions. As of De-
cember 31, 2010 and 2009, eliminated unrealized gains under the equity method of accounting are ₩79,113 million and ₩119,825 million, respectively.(Continued)
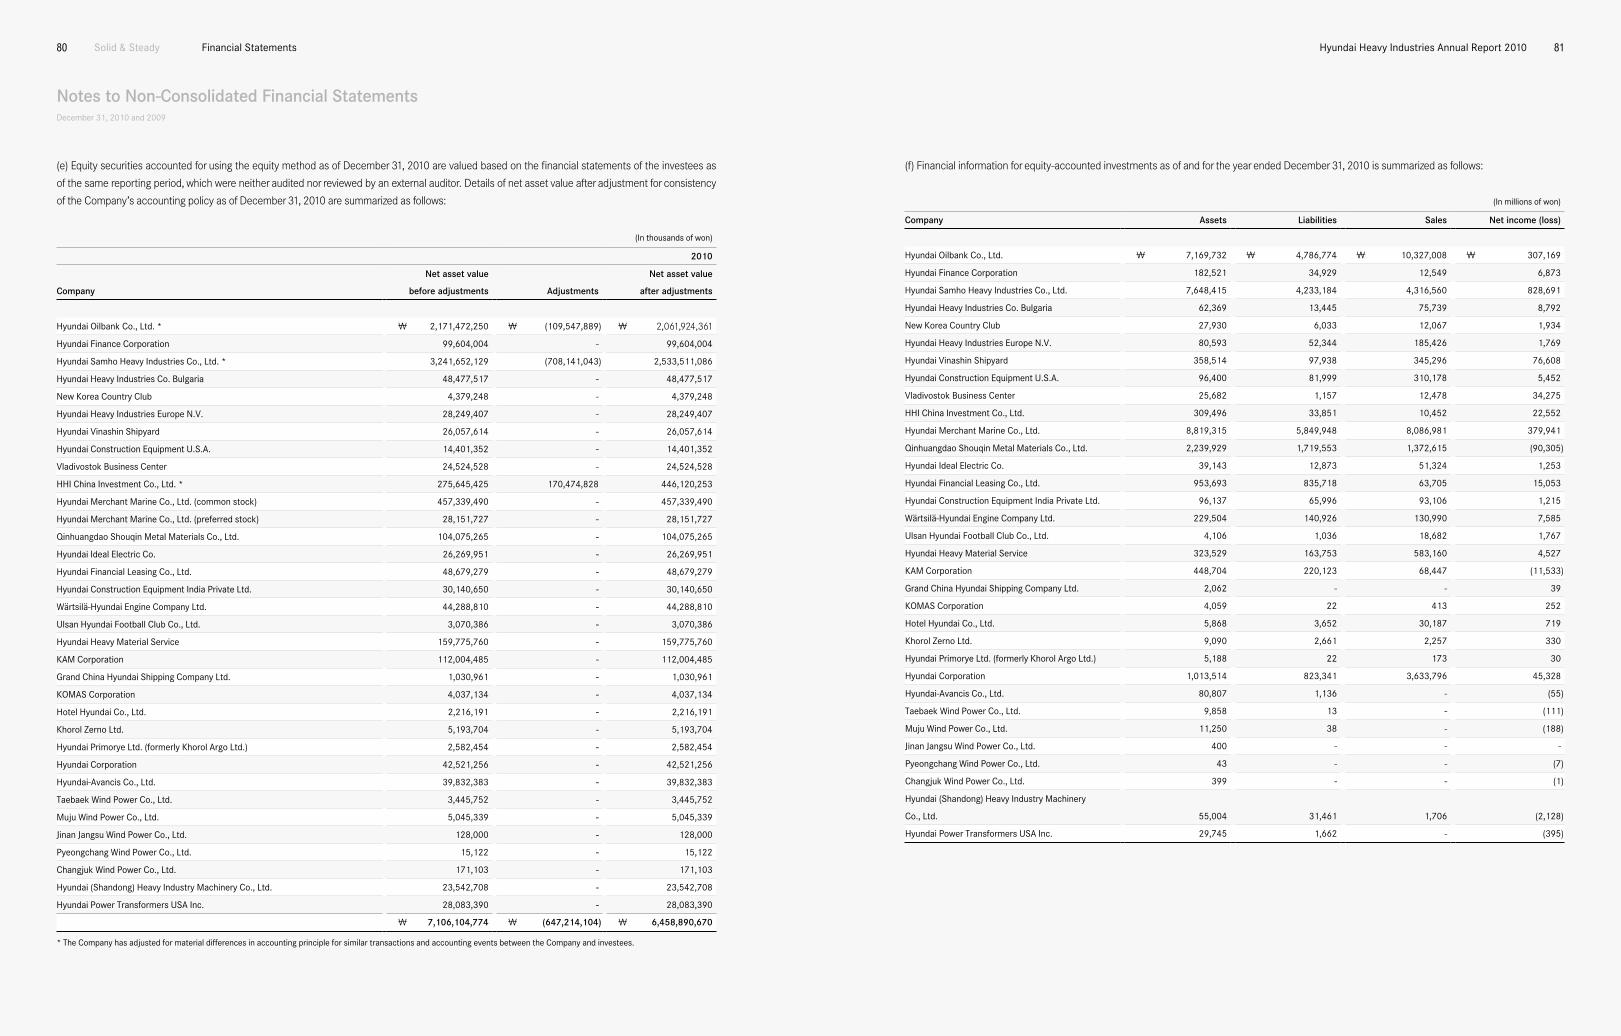
solid & steady Financial statements80
Notes to Non-Consolidated Financial StatementsDecember 31, 2010 and 2009
Hyundai Heavy industries Annual report 2010 81
(e) Equity securities accounted for using the equity method as of December 31, 2010 are valued based on the financial statements of the investees as
of the same reporting period, which were neither audited nor reviewed by an external auditor. Details of net asset value after adjustment for consistency
of the Company’s accounting policy as of December 31, 2010 are summarized as follows:
(in thousands of won)
2010
Net asset value Net asset value
Company before adjustments Adjustments after adjustments
Hyundai oilbank Co., Ltd. * ₩ 2,171,472,250 ₩ (109,547,889) ₩ 2,061,924,361
Hyundai Finance Corporation 99,604,004 - 99,604,004
Hyundai samho Heavy industries Co., Ltd. * 3,241,652,129 (708,141,043) 2,533,511,086
Hyundai Heavy industries Co. Bulgaria 48,477,517 - 48,477,517
new Korea Country Club 4,379,248 - 4,379,248
Hyundai Heavy industries europe n.V. 28,249,407 - 28,249,407
Hyundai Vinashin shipyard 26,057,614 - 26,057,614
Hyundai Construction equipment U.s.A. 14,401,352 - 14,401,352
Vladivostok Business Center 24,524,528 - 24,524,528
HHi China investment Co., Ltd. * 275,645,425 170,474,828 446,120,253
Hyundai Merchant Marine Co., Ltd. (common stock) 457,339,490 - 457,339,490
Hyundai Merchant Marine Co., Ltd. (preferred stock) 28,151,727 - 28,151,727
Qinhuangdao shouqin Metal Materials Co., Ltd. 104,075,265 - 104,075,265
Hyundai ideal electric Co. 26,269,951 - 26,269,951
Hyundai Financial Leasing Co., Ltd. 48,679,279 - 48,679,279
Hyundai Construction equipment india Private Ltd. 30,140,650 - 30,140,650
Wärtsilä-Hyundai engine Company Ltd. 44,288,810 - 44,288,810
Ulsan Hyundai Football Club Co., Ltd. 3,070,386 - 3,070,386
Hyundai Heavy Material service 159,775,760 - 159,775,760
KAM Corporation 112,004,485 - 112,004,485
Grand China Hyundai shipping Company Ltd. 1,030,961 - 1,030,961
KoMAs Corporation 4,037,134 - 4,037,134
Hotel Hyundai Co., Ltd. 2,216,191 - 2,216,191
Khorol Zerno Ltd. 5,193,704 - 5,193,704
Hyundai Primorye Ltd. (formerly Khorol Argo Ltd.) 2,582,454 - 2,582,454
Hyundai Corporation 42,521,256 - 42,521,256
Hyundai-Avancis Co., Ltd. 39,832,383 - 39,832,383
taebaek Wind Power Co., Ltd. 3,445,752 - 3,445,752
Muju Wind Power Co., Ltd. 5,045,339 - 5,045,339
Jinan Jangsu Wind Power Co., Ltd. 128,000 - 128,000
Pyeongchang Wind Power Co., Ltd. 15,122 - 15,122
Changjuk Wind Power Co., Ltd. 171,103 - 171,103
Hyundai (shandong) Heavy industry Machinery Co., Ltd. 23,542,708 - 23,542,708
Hyundai Power transformers UsA inc. 28,083,390 - 28,083,390
₩ 7,106,104,774 ₩ (647,214,104) ₩ 6,458,890,670
(f) Financial information for equity-accounted investments as of and for the year ended December 31, 2010 is summarized as follows:
* the Company has adjusted for material differences in accounting principle for similar transactions and accounting events between the Company and investees.
(in millions of won)
Company Assets Liabilities Sales Net income (loss)
Hyundai oilbank Co., Ltd. ₩ 7,169,732 ₩ 4,786,774 ₩ 10,327,008 ₩ 307,169
Hyundai Finance Corporation 182,521 34,929 12,549 6,873
Hyundai samho Heavy industries Co., Ltd. 7,648,415 4,233,184 4,316,560 828,691
Hyundai Heavy industries Co. Bulgaria 62,369 13,445 75,739 8,792
new Korea Country Club 27,930 6,033 12,067 1,934
Hyundai Heavy industries europe n.V. 80,593 52,344 185,426 1,769
Hyundai Vinashin shipyard 358,514 97,938 345,296 76,608
Hyundai Construction equipment U.s.A. 96,400 81,999 310,178 5,452
Vladivostok Business Center 25,682 1,157 12,478 34,275
HHi China investment Co., Ltd. 309,496 33,851 10,452 22,552
Hyundai Merchant Marine Co., Ltd. 8,819,315 5,849,948 8,086,981 379,941
Qinhuangdao shouqin Metal Materials Co., Ltd. 2,239,929 1,719,553 1,372,615 (90,305)
Hyundai ideal electric Co. 39,143 12,873 51,324 1,253
Hyundai Financial Leasing Co., Ltd. 953,693 835,718 63,705 15,053
Hyundai Construction equipment india Private Ltd. 96,137 65,996 93,106 1,215
Wärtsilä-Hyundai engine Company Ltd. 229,504 140,926 130,990 7,585
Ulsan Hyundai Football Club Co., Ltd. 4,106 1,036 18,682 1,767
Hyundai Heavy Material service 323,529 163,753 583,160 4,527
KAM Corporation 448,704 220,123 68,447 (11,533)
Grand China Hyundai shipping Company Ltd. 2,062 - - 39
KoMAs Corporation 4,059 22 413 252
Hotel Hyundai Co., Ltd. 5,868 3,652 30,187 719
Khorol Zerno Ltd. 9,090 2,661 2,257 330
Hyundai Primorye Ltd. (formerly Khorol Argo Ltd.) 5,188 22 173 30
Hyundai Corporation 1,013,514 823,341 3,633,796 45,328
Hyundai-Avancis Co., Ltd. 80,807 1,136 - (55)
taebaek Wind Power Co., Ltd. 9,858 13 - (111)
Muju Wind Power Co., Ltd. 11,250 38 - (188)
Jinan Jangsu Wind Power Co., Ltd. 400 - - -
Pyeongchang Wind Power Co., Ltd. 43 - - (7)
Changjuk Wind Power Co., Ltd. 399 - - (1)
Hyundai (shandong) Heavy industry Machinery
Co., Ltd. 55,004 31,461 1,706 (2,128)
Hyundai Power transformers UsA inc. 29,745 1,662 - (395)

solid & steady Financial statements82
Notes to Non-Consolidated Financial StatementsDecember 31, 2010 and 2009
Hyundai Heavy industries Annual report 2010 83
8. Property, Plant and Equipment
(a) Property, plant and equipment as of December 31, 2010 and 2009 is summarized as follows:
(b) Changes in property, plant and equipment for the year ended December 31, 2010 are summarized as follows:
(in thousands of won)
2010 2009
Buildings and structures ₩ 3,967,946,407 ₩ 3,929,329,068
Machinery and equipment 3,313,661,846 2,945,351,323
ships 211,489,020 211,401,759
Vehicles 37,482,581 35,148,987
tools, furniture and fixtures 1,292,881,658 1,223,446,599
₩ 8,823,461,512 ₩ 8,344,677,736
Less: Accumulated depreciation (3,866,827,891) (3,474,615,628)
₩ 4,956,633,621 ₩ 4,870,062,108
Land 2,857,626,759 2,871,363,776
Construction-in-progress 185,897,898 404,096,925
₩ 8,000,158,278 ₩ 8,145,522,809
(in thousands of won)
2010
Machinery and
Land Buildings Structures equipment Others Total
Beginning of period ₩ 2,871,363,776 ₩ 2,508,553,039 ₩ 1,420,776,029 ₩ 2,945,351,323 ₩ 1,874,094,270 ₩11,620,138,437
Acquisition and other 17,653,698 38,324,677 62,929,400 376,357,297 (125,106,670) 370,158,402
Disposal (31,390,715) (61,353,008) (1,283,730) (8,046,774) (21,236,443) (123,310,670)
End of period ₩ 2,857,626,759 ₩ 2,485,524,708 ₩ 1,482,421,699 ₩ 3,313,661,846 ₩ 1,727,751,157 ₩11,866,986,169
Depreciation - (63,651,905) (36,237,950) (201,408,112) (138,747,079) (440,045,046)
Accumulated depreciation - (496,806,241) (246,146,392) (1,959,851,737) (1,164,023,521) (3,866,827,891)
₩ 2,857,626,759 ₩ 1,988,718,467 ₩ 1,236,275,307 ₩ 1,353,810,109 ₩ 563,727,636 ₩ 8,000,158,278
Changes in property, plant and equipment for the year ended December 31, 2009 are summarized as follows:
(c) The Company adopted the revaluation model in the previous year and land was stated at revalued amounts as of December 1, 2009. The fair value
of the assets was based on the results of an appraisal by the Korea Appraisal Board, an independent appraiser. As the result of land revaluation, the
book value of land was ₩2,871,364 million including revaluation gain of ₩1,236,485 million as of December 31, 2009. In addition, other comprehensive
income of ₩964,458 million and deferred tax liabilities of ₩272,027 million were recognized, respectively.
(d) A substantial portion of buildings, machinery and equipment were insured against fire and other casualty losses up to approximately ₩2,981,712 mil-
lion as of December 31, 2010. The Company maintains insurance coverage against fire and other casualty losses of up to ₩11,591,833 million for ships
and sea structures under construction. Insurance proceeds of ₩3,036,019 million are pledged as collateral for the guarantees from the Export-Import
Bank of Korea as of December 31, 2010.
In addition to the above insurance, most valuable property owned by the Company is covered by a general liability insurance policy up to ₩19,450,108
million as of December 31, 2010. The Company also maintains insurance on cargo against damage and claims losses of up to ₩8,217,176 million for
products being exported and imported as of December 31, 2010.
(e) Construction-in-progress included the Ihwa industrial park project and a new building for the Offshore & Engineering Division as of December 31, 2010.
(f) As of December 31, 2010 and 2009, the officially declared value of land owned by the Company was ₩1,458,571 million and ₩1,461,080 million,
respectively, as announced by the Minister of Construction and Transportation.
(in thousands of won)
2009
Machinery and
Land Buildings Structures equipment Others Total
Beginning of period ₩ 1,586,959,576 ₩ 2,132,007,385 ₩ 917,521,401 ₩ 2,404,550,660 ₩ 2,343,057,412 ₩ 9,384,096,434
Acquisition and other 49,377,185 405,362,786 503,983,391 672,021,254 (446,430,398) 1,184,314,218
Disposal (1,458,224) (28,817,132) (728,763) (131,220,591) (22,532,744) (184,757,454)
revaluation 1,236,485,239 - - - - 1,236,485,239
End of period ₩ 2,871,363,776 ₩ 2,508,553,039 ₩ 1,420,776,029 ₩ 2,945,351,323 ₩ 1,874,094,270 ₩11,620,138,437
Depreciation - (60,944,830) (29,758,181) (176,653,522) (132,337,629) (399,694,162)
Accumulated depreciation - (450,454,692) (210,230,889) (1,766,226,220) (1,047,703,827) (3,474,615,628)
₩ 2,871,363,776 ₩ 2,058,098,347 ₩ 1,210,545,140 ₩ 1,179,125,103 ₩ 826,390,443 ₩ 8,145,522,809

solid & steady Financial statements84
Notes to Non-Consolidated Financial StatementsDecember 31, 2010 and 2009
Hyundai Heavy industries Annual report 2010 85
9. Intangible Assets
(a) Intangible assets as of December 31, 2010 and 2009 are summarized as follows:
(b) Changes in intangible assets for the years ended December 31, 2010 and 2009 are summarized as follows:
Research costs amounting to ₩27,049 million and ₩19,629 million, and ordinary development costs amounting to ₩87,310 million and ₩72,728 mil-
lion are included in selling, general and administrative expenses for the years ended December 31, 2010 and 2009, respectively. Amortized develop-
ment costs of ₩50,107 million and ₩43,937 million are included in the cost of sales and selling, general and administrative expenses for the years
ended December 31, 2010 and 2009, respectively.
10. Other Non-current Assets
Other non-current assets as of December 31, 2010 and 2009 are summarized as follows:
(in thousands of won)
Development cost Usage right for donated properties
2010 2009 2010 2009
Beginning balance ₩ 270,363,193 ₩ 242,161,165 ₩ 18,095,848 ₩ 20,135,131
Capitalized 69,731,036 72,139,257 - -
Amortized (50,107,514) (43,937,229) (2,039,283) (2,039,283)
Ending balance ₩ 289,986,715 ₩ 270,363,193 ₩ 16,056,565 ₩ 18,095,848
(in thousands of won)
2010 2009
Development costs ₩ 289,986,715 ₩ 270,363,193
Usage right for donated properties 16,056,565 18,095,848
₩ 306,043,280 ₩ 288,459,041
(in thousands of won)
2010 2009
Guarantee deposits ₩ 11,942,657 ₩ 9,933,113
Long-term loans 261,947 2,019,948
other non-current assets 156,312,475 93,812,840
₩ 168,517,079 ₩ 105,765,901
11. Other Current Liabilities
Other current liabilities as of December 31, 2010 and 2009 are summarized as follows:
12. Debentures, Short-term and Long-term Borrowings
(a) Debentures as of December 31, 2010 and 2009 are summarized as follows:
(b) Short-term borrowings as of December 31, 2010 and 2009 are summarized as follows:
(in thousands of won)
Description Maturity Annual interest rate 2010 2009
112th non-guaranteed debentures 2012.04.13 5.43% ₩ 300,000,000 ₩ 300,000,000
(in thousands of won)
2010 2009
income tax withholdings ₩ 247,748,503 ₩ 213,815,078
Unearned revenues - 38,523
Provision for construction losses 25,634,346 15,279,818
₩ 273,382,849 ₩ 229,133,419
(in thousands of won)
Type of borrowing Lender Annual interest rate 2010 2009
network loan export-import Bank of Korea 3.70% ₩ 74,966,175 ₩ 301,916,695
Collaborated guaranty loan Korea exchange Bank (KeB) - - 103,118,913
Pre-shipment credit export-import Bank of Korea - - 180,285,000
General loan shinhan Capital Co., Ltd. 4.45% 1,500,000,000 -
Commercial Paper shinhan Bank 2.99% 1,000,000,000 -
Usance L/C shinhan Bank and others 0.91~2.63% 540,015,512 -
₩ 3,114,981,687 ₩ 585,320,608

solid & steady Financial statements86
Notes to Non-Consolidated Financial StatementsDecember 31, 2010 and 2009
Hyundai Heavy industries Annual report 2010 87
(c) Long-term borrowings denominated in foreign currency as of December 31, 2010 and 2009 are summarized as follows:
(d) The general loan in foreign currency from the Export-Import Bank of Korea in relation to the Company’s overseas resource development business
has a three-year maturity. Payment will be made in lump sum on the loan maturity date of October 1, 2013. The maturities of long-term borrowings from
Korea National Oil Corporation as of December 31, 2010 are not readily determinable since the long-term borrowing is paid by installment in the event
of successful commercial production by the Company’s oil development business.
13. Retirement and Severance Benefits
Changes in retirement and severance benefits for the years ended December 31, 2010 and 2009 are summarized as follows:
The Company maintains an employees’ severance benefit trust arrangement with Kyobo Life Insurance Co., Ltd. and other insurance companies. Un-
der this arrangement, the Company has made a deposit in the amount equal to 86.2% and 83.4% of the reserve balances of retirement and severance
benefits as of December 31, 2010 and 2009, respectively. This deposit is to be used to guarantee the required payments to retirees and is accounted
for as a reduction in the reserve balance.
(in thousands of won and in dollars)
2010 2009
Annual Foreign Won Foreign Won
Type of borrowing interest rate currency equivalent currency equivalent
General loan in foreign currency from
export-import Bank of Korea 2.04% $ 23,272,500 ₩ 26,505,050 $ - ₩ -
Business loans from Korea national oil Corporation 1.75% 5,494,765 6,335,709 4,888,535 5,166,671
$ 28,767,265 ₩ 32,840,759 $ 4,888,535 ₩ 5,166,671
(in thousands of won)
2010 2009
Estimated retirement and severance benefits at beginning of year ₩ 1,226,148,845 ₩ 1,251,923,440
Payments (664,236,835) (164,508,686)
Accrual for retirement and severance benefits 231,060,703 138,734,091
Estimated retirement and severance benefits at end of year ₩ 792,972,713 ₩ 1,226,148,845
Deposit for severance benefit insurance (683,855,161) (1,022,621,872)
transfer to national Pension Fund (16,048,370) (29,049,871)
Net balance at end of year ₩ 93,069,182 ₩ 174,477,102
14. Other Long-term Liabilities
Other long-term liabilities as of December 31, 2010 and 2009 are summarized as follows:
15. Commitments and Contingencies
(a) The Company has entered into bank overdraft agreements with eight banks amounting to ₩238,000 million as of December 31, 2010.
(b) As of December 31, 2010, the Company has entered into credit facilities agreements such as letters of credit with various banks for the Company’s
exports and imports totaling USD 2,423,538 thousand.
(c) In order to secure bank loans and construction contract performance guarantees, the Company has provided ten blank notes and one check as of
December 31, 2010.
(d) The outstanding balance of note receivables guaranteed by the importers’ Government or others and sold to financial institutions with recourse is
USD 13,377 thousand, equivalent to ₩15,235 million, as of December 31, 2010. The Company’s outstanding balance of trade receivables sold with re-
course amount to ₩4,642 million as of December 31, 2010.
(e) As of December 31, 2010, the Company is contingently liable for loan guarantees of its foreign subsidiaries and associated companies amounting
to USD 193,330 thousand. The Company has provided certain performance guarantees for bareboat charter amounting to USD 475,226 thousand to
ship owners on behalf of Hyundai Merchant Marine Co., Ltd. Furthermore, the Company has provided performance guarantees for the mining business
in relation to overseas resource developments amounting to USD 61,925 thousand and guarantees on debt obligations for the business participant,
Sherritt International Corporation, amounting to USD 24,058 thousand. The Company has also entered into joint shipbuilding contracts with Hyundai
Samho Heavy Industries Co., Ltd., one of the Company’s subsidiaries, for the construction of four ships at a contract amount of USD 534,179 thousand.
(f) In connection with the Company’s contract performance guarantees, the Company has also been provided with guarantees up to ₩1,230,877 mil-
lion and USD 12,721,988 thousand by various banking facilities.
(in thousands of won)
2010 2009
Deposits received ₩ 13,498,575 ₩ 13,922,260
Provision for construction warranties 30,013,337 29,070,486
Provision for product warranties 52,155,981 34,473,840
₩ 95,667,893 ₩ 77,466,586

solid & steady Financial statements88
Notes to Non-Consolidated Financial StatementsDecember 31, 2010 and 2009
Hyundai Heavy industries Annual report 2010 89
(g) In an effort to alleviate fluctuations on the future cash flows that would be incurred out of the timing difference between the receipt of the ship sales
amounts and the payment of imported raw materials, the Company has entered into currency forward contracts with 22 banks, including Korea Ex-
change Bank. As of December 31, 2010, the valuation and gain (loss) on transaction of the forward contracts are summarized as follows:
As of December 31, 2010, the Company applies cash flow hedge accounting, out of which the Company accounted for the effective portion of the
hedge amounting to ₩12,706 million, net of deferred tax adjustment of ₩3,978 million, as gain (loss) on valuation of derivatives in accumulated other
comprehensive income (net of tax effect). The expected period of exposure to cash flow risk, where cash flow hedge accounting is applied, is approxi-
mately within 24 months, and the amount among gain (loss) on valuation of foreign exchange contracts that is expected to be realized as addition to
transaction gain or deduction from transaction loss within 12 months from December 31, 2010 is ₩14,007 million. The valuation of the ineffective por-
tion of the hedge and the valuation of other derivatives to which cash flow hedge accounting is not applied, are reflected in current income.
In relation to the shipbuilding contracts in foreign currency as of December 31, 2010, the Company entered into foreign exchange forward contracts
and accounted for such contracts as fair value hedges. As a result, the net balance of firm commitment assets and liabilities was ₩527,397 million and
related gain and loss on valuation of the firm commitments were recorded as ₩110,064 million and ₩493,079 million, respectively, in non-operating
income and expenses.
Gain and loss on derivatives transactions that mature within the current year are recorded as ₩279,613 million and ₩312,471 million, respectively in
non-operating income and expenses. Gain and loss on valuation of derivatives are recorded as ₩388,295 million and ₩139,474 million, respectively in
non-operating income and expenses.
In relation to valuation of derivatives that have not reached their maturity dates, the Company accounted for derivative assets of ₩301,201 million and
derivative liabilities of ₩708,876 million.
(in millions of won and in thousands of foreign currency)
Description
Cash flow hedge Fair value hedge For trading Total
Contract amount UsD 1,110,027 UsD 10,548,497 UsD 1,475,478 UsD 13,134,002
eUr 32,718 eUr 78,724 - eUr 111,442
KrW 55,800 - KrW 1,035,521 KrW 1,091,321
Adjustment to sales ₩ 47,982 ₩ (695,935) ₩ - ₩ (647,953)
non–operating income (expense) (1,728) 35,733 (201,057) (167,052)
other comprehensive income 16,684 - - 16,684
Firm commitment assets - 789,012 - 789,012
Firm commitment liabilities - 261,615 - 261,615
Derivatives assets 301,201
Derivatives liabilities 708,876
16. Litigation
(a) Hynix Semiconductor Inc. (“HSI") sold 13 million shares of Hyundai Investment Trust & Securities Co., Ltd. (“HITS”) for USD 13.46 per share to Ca-
nadian Imperial Bank of Commerce (“CIBC”) on June 4, 1997. In relation to this transaction, the Company made a share option agreement with CIBC
under which the Company was obligated to buy back the 13 million shares of HITS for USD 16.96 per share, if CIBC exercised its option. Based on this
agreement, the Company was provided a written promissory note from HSI and Hyundai Securities Co., Ltd. (“HSC”) on July 1, 1997 to compensate
the Company for losses incurred in connection with the transaction with CIBC under certain circumstances. Based on the above agreement, on July
20, 2000, the Company repurchased the 13 million shares from CIBC for USD 220,480 thousand. The Company required HSI and HSC to honor their
written promissory note; however, HSI and HSC refused. Accordingly, the Company filed a lawsuit against HSI and HSC on July 28, 2000 and deposited
the stocks repurchased from CIBC in Suwon District Court. On January 25, 2002, the Company partially won the litigation for the settlement of claim
amounting to ₩171,800 million of principal and accrued interest thereon and recovered ₩220,933 million. However, the Company did not accept the
court’s decision. Pursuant to the resolution of the board of directors on January 27, 2002, the Company filed an appeal claiming the whole amount of
the principal and accrued interest. Also, the Company has filed a lawsuit for the advance payments and reimbursable expenses from those companies
that were not covered in the litigation above. In relation to the intermediate appeal for a partial settlement of the claim, the Company partially won the
litigation at Seoul High Court on June 14, 2006 for the settlement of the claim amounting to ₩192,900 million of principal and accrued interest. How-
ever, the Company did not accept the Court’s decision and filed an appeal with the Supreme Court of Korea. The Supreme Court of Korea annulled the
original judgment on March 26, 2009. On August 21, 2009, the Company won its claim amounting to ₩241,200 million of principal, excluding ₩4,300
million and accrued interest thereon, and recovered ₩86,200 million. The Company filed an appeal to the Supreme Court claiming the principal
amount of ₩4,300 million, which was pending as of December 31, 2010. In addition, on October 22, 2009, the Company won its claim for incidental
expenses amounting to ₩50,300 million of principal and accrued interest thereon and recovered ₩73,700 million. However, Hynix Semiconductor Inc.
filed an appeal, which was pending as of December 31, 2010.
(b) The National Tax Service imposed additional income tax amounting to ₩107,600 million on March 27, 2006. The assessment resulted from the
participation in the capital increase of Hyundai Space and Aircraft Co., Ltd. when Korea was experiencing a foreign currency exchange crisis in the
late 1990s. The National Tax Service ruled this capital increase to be unfair financial support for the insolvent associate. The Company’s appeal to the
National Tax Tribunal was dismissed, but was partially successful. On April 27, 2009, the Company filed administrative litigation. However, the Company
lost the first trial on January 5, 2011 and appealed on January 25, 2011. The litigation is currently in pendency.
(c) As of March 25, 2008, the Company determined that International Petroleum Investment Co. (hereafter “IPIC”), the major shareholder of Hyundai
Oilbank, breached the contract between shareholders entered into with the former shareholders of the Hyundai Group, including Hyundai Heavy Indus-
tries, and notified IPIC of its intention to exercise IPIC’s deemed offer (stock purchase option) against its 171,557,695 shares (70%) of Hyundai Oilbank.
The Company also filed for arbitration at the International Court of Arbitration of the International Chamber of Commerce (hereafter “ICC”), in regard
to IPIC’s breach of contract and exercise of the deemed offer. On November 12, 2009, the arbitrators passed judgment on IPIC’s significant breach of
contract, ordering IPIC to sell its 171,557,695 shares (70%) of Hyundai Oilbank at the price of ₩15,000 per share in accordance with the deemed offer.
However, IPIC did not accept the arbitration decision and on December 2, 2009, the Company filed a lawsuit in Seoul Central District Court for approval
of the arbitration decision and enforcement claim. On July 9, 2010, the Company won its claim. The Company paid the acquisition cost on August 12,
2010 and IPIC issued 171,557,695 shares of Hyundai Oilbank to the Company.
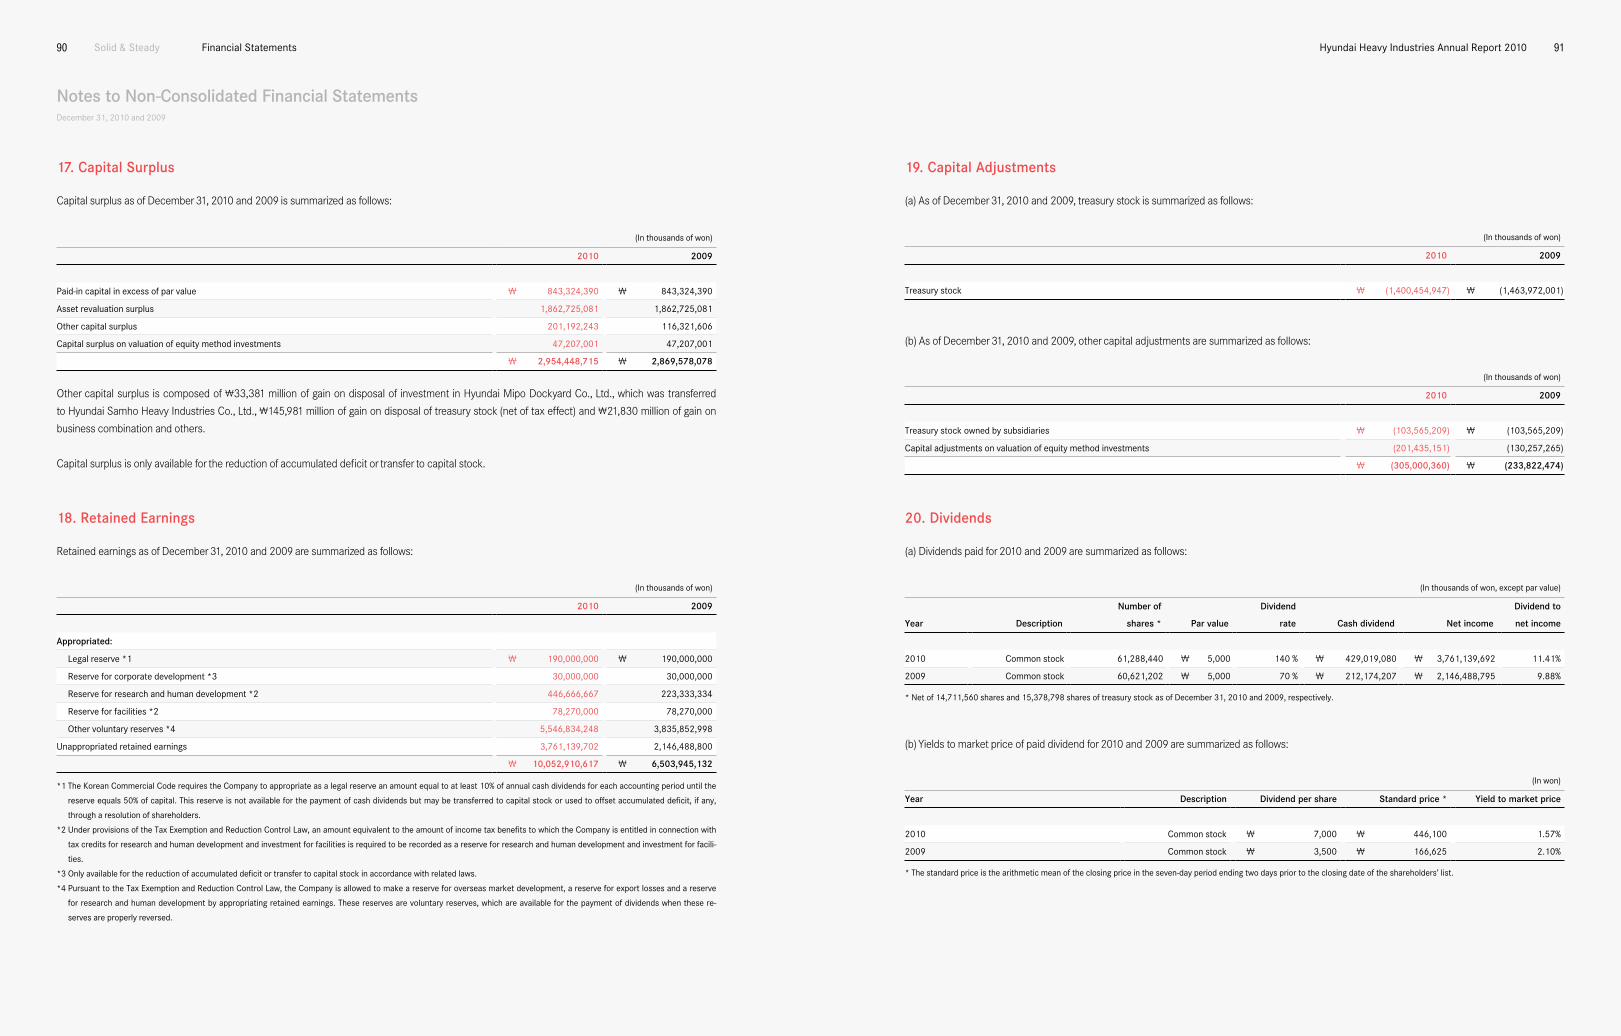
solid & steady Financial statements90
Notes to Non-Consolidated Financial StatementsDecember 31, 2010 and 2009
Hyundai Heavy industries Annual report 2010 91
17. Capital Surplus
Capital surplus as of December 31, 2010 and 2009 is summarized as follows:
Other capital surplus is composed of ₩33,381 million of gain on disposal of investment in Hyundai Mipo Dockyard Co., Ltd., which was transferred
to Hyundai Samho Heavy Industries Co., Ltd., ₩145,981 million of gain on disposal of treasury stock (net of tax effect) and ₩21,830 million of gain on
business combination and others.
Capital surplus is only available for the reduction of accumulated deficit or transfer to capital stock.
18. Retained Earnings
Retained earnings as of December 31, 2010 and 2009 are summarized as follows:
(in thousands of won)
2010 2009
Paid-in capital in excess of par value ₩ 843,324,390 ₩ 843,324,390
Asset revaluation surplus 1,862,725,081 1,862,725,081
other capital surplus 201,192,243 116,321,606
Capital surplus on valuation of equity method investments 47,207,001 47,207,001
₩ 2,954,448,715 ₩ 2,869,578,078
(in thousands of won)
2010 2009
Appropriated:
Legal reserve *1 ₩ 190,000,000 ₩ 190,000,000
reserve for corporate development *3 30,000,000 30,000,000
reserve for research and human development *2 446,666,667 223,333,334
reserve for facilities *2 78,270,000 78,270,000
other voluntary reserves *4 5,546,834,248 3,835,852,998
Unappropriated retained earnings 3,761,139,702 2,146,488,800
₩ 10,052,910,617 ₩ 6,503,945,132
*1 the Korean Commercial Code requires the Company to appropriate as a legal reserve an amount equal to at least 10% of annual cash dividends for each accounting period until the
reserve equals 50% of capital. this reserve is not available for the payment of cash dividends but may be transferred to capital stock or used to offset accumulated deficit, if any,
through a resolution of shareholders.
*2 Under provisions of the tax exemption and reduction Control Law, an amount equivalent to the amount of income tax benefits to which the Company is entitled in connection with
tax credits for research and human development and investment for facilities is required to be recorded as a reserve for research and human development and investment for facili-
ties.
*3 only available for the reduction of accumulated deficit or transfer to capital stock in accordance with related laws.
*4 Pursuant to the tax exemption and reduction Control Law, the Company is allowed to make a reserve for overseas market development, a reserve for export losses and a reserve
for research and human development by appropriating retained earnings. these reserves are voluntary reserves, which are available for the payment of dividends when these re-
serves are properly reversed.
19. Capital Adjustments
(a) As of December 31, 2010 and 2009, treasury stock is summarized as follows:
(b) As of December 31, 2010 and 2009, other capital adjustments are summarized as follows:
20. Dividends
(a) Dividends paid for 2010 and 2009 are summarized as follows:
(b) Yields to market price of paid dividend for 2010 and 2009 are summarized as follows:
(in thousands of won)
2010 2009
treasury stock owned by subsidiaries ₩ (103,565,209) ₩ (103,565,209)
Capital adjustments on valuation of equity method investments (201,435,151) (130,257,265)
₩ (305,000,360) ₩ (233,822,474)
(in thousands of won)
2010 2009
treasury stock ₩ (1,400,454,947) ₩ (1,463,972,001)
* net of 14,711,560 shares and 15,378,798 shares of treasury stock as of December 31, 2010 and 2009, respectively.
* the standard price is the arithmetic mean of the closing price in the seven-day period ending two days prior to the closing date of the shareholders’ list.
(in thousands of won, except par value)
Number of Dividend Dividend to
Year Description shares * Par value rate Cash dividend Net income net income
2010 Common stock 61,288,440 ₩ 5,000 140 % ₩ 429,019,080 ₩ 3,761,139,692 11.41%
2009 Common stock 60,621,202 ₩ 5,000 70 % ₩ 212,174,207 ₩ 2,146,488,795 9.88%
(in won)
Year Description Dividend per share Standard price * Yield to market price
2010 Common stock ₩ 7,000 ₩ 446,100 1.57%
2009 Common stock ₩ 3,500 ₩ 166,625 2.10%

solid & steady Financial statements92
Notes to Non-Consolidated Financial StatementsDecember 31, 2010 and 2009
Hyundai Heavy industries Annual report 2010 93
21. Sales and Cost of Sales
(a) Sales and cost of sales, by major industry segment, for the years ended December 31, 2010 and 2009 are summarized as follows:
(b) The Company’s outstanding contracts as of December 31, 2010 are summarized as follows:
As of December 31, 2010, in connection with construction contracts, the Company has provided a certain amount of financial institution guarantee
deposits or letters of guarantees from various financial institutions to the customers (see note 15).
(in thousands of won)
2010 2009
Sales Cost of sales Sales Cost of sales
shipbuilding ₩ 7,849,210,418 ₩ 6,353,403,786 ₩ 9,002,641,240 ₩ 8,315,385,400
offshore & engineering 3,412,757,735 2,606,361,177 3,423,456,902 2,876,852,425
industrial Plant & engineering 2,644,514,489 2,239,862,118 1,897,902,597 1,607,475,797
engine & Machinery 2,834,722,044 2,013,806,450 2,771,471,593 1,886,042,960
electro electric systems 3,242,218,942 2,553,343,440 2,712,142,548 2,138,464,785
Construction equipment 2,274,585,216 1,831,676,448 1,190,382,638 1,037,553,822
others 147,172,470 136,392,820 144,199,218 135,667,732
₩ 22,405,181,314 ₩ 17,734,846,239 ₩ 21,142,196,736 ₩ 17,997,442,921
(in millions of won)
Shipbuilding Others Total
Beginning of period * ₩ 20,320,557 ₩ 18,340,636 ₩ 38,661,193
increase during the period 4,678,942 15,016,879 19,695,821
recognized as revenue in current income (7,849,210) (14,555,971) (22,405,181)
End of period ₩ 17,150,289 ₩ 18,801,544 ₩ 35,951,833
* the beginning of period balances for backlog were recalculated with the appropriate exchange rate in effect at the end of 2009.
(c) As of December 31, 2010, accumulated cost of construction and others connected with construction in progress by major industry segments are
summarized as follows:
22. Income Taxes
(a) The Company was subject to income taxes on taxable income at the following normal tax rates for the years ended December 31, 2010 and 2009.
In December 2009, the Korean government postponed the reduction of the corporate income tax rate (including resident tax) from 24.2% to 22%, until
2012.
(b) Income tax expense for the years ended December 31, 2010 and 2009 is summarized as follows:
Tax rates
Taxable income 2009 2010 & 2011 Thereafter
Up to ₩200 million 12.1% 11.0% 11.0%
over ₩200 million 24.2% 24.2% 22.0%
* industry segment recognized revenues by delivery basis.
** For those contracts whose contract costs will exceed contract revenue, the Company recognized the estimated loss on the construction contracts amounting to ₩25,634 million.
(in millions of won)
Billed Unbilled
Accumulated Advances on receivables on receivables on
cost of Accumulated construction Accounts construction construction
construction profit and loss contracts receivable contracts contracts
shipbuilding ₩ 12,606,097 ₩ 3,122,692 ₩ 3,968,842 ₩ 3,048,381 ₩ 37,488 ₩ 3,010,893
offshore & engineering 8,124,401 1,785,482 804,009 454,491 148,138 306,353
industrial Plant & engineering 7,197,827 939,535 620,603 392,497 24,012 368,485
engine & Machinery 4,557,155 2,153,713 672,630 507,625 263,019 244,606
electro electric systems 45,518 21,350 74,596 1,178,127 979,416 198,711
Construction equipment * - - 1,289 286,121 286,121 -
others * - - 705 627,974 627,974 -
₩ 32,530,998 ₩ 8,022,772 ₩ 6,142,674 ₩ 6,495,216 ₩ 2,366,168 ₩ 4,129,048
(in thousands of won)
2010 2009
Current income tax ₩ 887,966,602 ₩ 376,247,930
Changes in deferred taxes due to temporary differences 251,227,263 786,712,935
Changes in deferred taxes directly adjusted in equity (116,005,218) (661,386,425)
income tax expense ₩ 1,023,188,647 ₩ 501,574,440
income before income taxes ₩ 4,784,328,339 ₩ 2,648,063,235
Effective tax rate 21.4% 18.9%

solid & steady Financial statements94
Notes to Non-Consolidated Financial StatementsDecember 31, 2010 and 2009
Hyundai Heavy industries Annual report 2010 95
(c) For the years ended December 31, 2010 and 2009, the differences between income before income taxes in financial accounting and taxable in-
come pursuant to Corporate Income Tax Law of Korea are summarized as follows:
(d) Details of changes in and effects on income tax expense of cumulative temporary differences for the years ended December 31, 2010 and 2009 are
summarized as follows:
(in thousands of won)
2010 2009
Income before income taxes ₩ 4,784,328,339 ₩ 2,648,063,235
temporary differences (1,221,041,975) (912,311,773)
non-temporary differences 173,788,955 54,546,759
Taxable income ₩ 3,737,075,319 ₩ 1,790,298,221
(in thousands of won)
2010 2009
Balance at Balance at Balance at Balance at
January 1, 2010 December 31, 2010 January 1, 2009 December 31, 2009
equity method investments * ₩ (1,177,392,317) ₩ (1,946,795,088) ₩ (788,296,615) ₩ (1,177,392,317)
impairment losses on investments 66,610,466 113,577,371 74,558,133 66,610,466
reserve for research and human development (446,666,667) (470,000,000) (223,333,333) (446,666,667)
Allowance for doubtful accounts * 98,663,216 230,639,235 158,039,183 98,663,216
Accrued income (825,057) (490,045) (56,690,429) (825,057)
revaluation of land (1,236,485,239) (1,225,406,608) - (1,236,485,239)
Currency forward contracts (196,074,996) (291,771,264) 710,042,273 (196,074,996)
others (310,701,132) (772,305,920) 396,816,190 (310,701,132)
₩ (3,202,871,726) ₩ (4,362,552,319) ₩ 271,135,402 ₩ (3,202,871,726)
tax rate 22.0% (24.2%) 22.0% (24.2%)
Deferred tax assets (liabilities), end of period ₩ (958,975,689) ₩ (707,748,426)
Deferred tax assets (liabilities), beginning of period (707,748,426) 78,964,509
Changes in deferred taxes on temporary differences ₩ (251,227,263) ₩ (786,712,935)
* temporary differences amounting to ₩(952,330) million, which were not recognized as deferred taxes, were deducted.
(e) Deferred tax assets and liabilities that were directly charged or credited to accumulated other comprehensive income as of December 31, 2010 are
summarized as follows:
(f) Deferred tax assets (liabilities) as of December 31, 2010 are summarized as follows:
(in thousands of won)
2010
other capital surplus ₩ (27,095,903)
Capital adjustments on valuation of equity method investments 20,075,814
Gain and loss on valuation of investment securities (114,115,057)
Changes in equity arising on application of the equity method (10,171,176)
negative changes in equity arising on application of the equity method 4,947,807
Gain and loss on valuation of derivatives 7,915,998
Gain and loss on revaluation of land 2,437,299
(in thousands of won)
Current Non-current Total
Accumulated temporary differences ₩ 35,719,159 ₩ (4,398,271,478) ₩ (4,362,552,319)
tax rate 24.2% 22.0% 22.0% (24.2%)
tax effects ₩ 8,644,036 ₩ (967,619,725) ₩ (958,975,689)
Deferred tax assets (liabilities) ₩ 8,644,036 ₩ (967,619,725) ₩ (958,975,689)
23. Comprehensive Income
Comprehensive income for the years ended December 31, 2010 and 2009 is summarized as follows:
(in thousands of won)
2010 2009
Net income ₩ 3,761,139,692 ₩ 2,146,488,795
Other comprehensive income 384,456,003 2,251,127,210
Gain on valuation of investment securities, net of tax effects of
₩(114,115,057) in 2010 and ₩(150,814,023) in 2009 404,589,747 534,950,242
Changes in equity arising on application of the equity method, net of
tax effects of ₩(10,171,176) in 2010 and ₩(71,908,150) in 2009 33,025,683 263,582,652
negative changes in equity arising on application of the equity method,
net of tax effects of ₩4,947,807 in 2010 and ₩(37,616,832) in 2009 (19,938,337) 133,368,767
Gain (loss) on valuation of derivatives, net of tax effects of
₩7,915,998 in 2010 and ₩(113,087,528) in 2009 (24,579,758) 354,767,062
Gain (loss) on revaluation of land, net of tax effects of
₩2,437,299 in 2010 and ₩(272,026,753) in 2009 (8,641,332) 964,458,487
Comprehensive income ₩ 4,145,595,695 ₩ 4,397,616,005

solid & steady Financial statements96
Notes to Non-Consolidated Financial StatementsDecember 31, 2010 and 2009
Hyundai Heavy industries Annual report 2010 97
24. Earnings per Share
Basic earnings per share for the years ended December 31, 2010 and 2009 are summarized as follows:
2010 2009
net income (in thousands of won) ₩ 3,761,139,692 ₩ 2,146,488,795
Weighted average number of common shares outstanding (in thousands of shares) 60,853 60,118
earnings per share (in won) ₩ 61,807 ₩ 35,705
Subsidiary Business fields
Hyundai samho Heavy industries Co., Ltd. shipbuilding
Hyundai Mipo Dockyard Co., Ltd. shipbuilding
Hyundai oilbank Co., Ltd. Manufacturing of petroleum products
Hyundai Finance Corporation Granting of credit
Hyundai Venture investment Corporation Granting of credit
Hyundai Futures Corporation entrust and brokerage of futures transactions
HViC it Fund 3rd other financial intermediation
Hyundai investment Fund 1 on Patent technology other financial intermediation
Mipo engineering Co., Ltd. other engineering services
Hyundai Heavy industries europe n.V. sale of machinery equipment for construction
Beijing Hyundai Jingcheng Construction Machinery Co., Ltd. sale and manufacture of machinery equipment for construction
Hyundai Construction equipment U.s.A. sale of machinery equipment for construction
Hyundai Heavy industries Co. Bulgaria sale and manufacture of transformers
Vladivostok Business Center Hotel operation
Hyundai Vinashin shipyard repairing of ships
Yantai Hyundai Moon Heavy industries Co., Ltd. sale and manufacture of industrial boilers
Hyundai Heavy industries (China) electric Co., Ltd. sale and manufacture of switchboards for electric distribution
Hyundai Jiangsu Construction Machinery Co., Ltd. sale and manufacture of machinery equipment for construction
HHi China investment Co., Ltd. Holding company
Changzhou Hyundai Hydraulic Machinery Co., Ltd. sale and manufacture of hydraulic cylinders for construction equipment
Hyundai technologies Center Hungary Kft. research and development of technology
Hyundai (Malaysia) sDn BHD trading
HHi Mauritius Limited Manufacturing
PHeCo inc. Design services for offshore facilities
Hyundai Heavy industries France sAs Manufacturing
Hyundai ideal electric Co. sale and manufacture of industrial electric equipment
Hyundai Financial Leasing Co., Ltd. Financial and operating leases
Subsidiary Business fields
Hyundai Construction equipment india Private Ltd. sale and manufacture of machinery equipment for construction
Ulsan Hyundai Football Club Co., Ltd. Football club
Hyundai Heavy Material service sale and manufacture of machinery equipment for shipbuilding
KoMAs Corporation shipbuilding
Hi investment & securities Co., Ltd. securities brokerage
Hi Management Co., Ltd Asset management
Hotel Hyundai Co., Ltd. Hotel operation
Khorol Zerno Ltd. Agriculture
Muju Wind Power Co., Ltd. Wind power generation
Changjuk Wind Power Co., Ltd. Wind power generation
Hyundai (shandong) Heavy industry Machinery Co., Ltd. sale and manufacture of wheel loaders
Hyundai Power transformers UsA, inc. sale and manufacture of industrial electric equipment
Weihai Hyundai Wind Power technology Co., Ltd. sale and manufacture of facilities for wind power generation
HDos Pte. Ltd. trading of crude oil and petroleum products, chartering
25. Transactions and Balances with Related Companies
(a) The Company is the ultimate holding company and its subsidiaries as of December 31, 2010 are summarized as follows:
(in thousands of won)
Sales Purchases Receivables Payables
Hyundai samho Heavy industries Co., Ltd. ₩ 622,175,759 ₩ 4,267,707 ₩ 231,256,072 ₩ 1,976,599
Hyundai Mipo Dockyard Co., Ltd. 392,051,504 16,073,096 122,538,638 1,855,021
Hyundai oilbank Co., Ltd. 22,162,049 2,999,041 727,484 917,564
Beijing Hyundai Jingcheng
Construction Machinery Co., Ltd. 157,555,652 1,915,927 30,149,423 37,536
Hyundai Heavy industries europe n.V. 141,468,368 4,484,868 9,584,335 386,843
Hyundai Construction equipment U.s.A. 185,168,146 1,935,546 25,502,872 209,698
Hyundai Jiangsu Construction Machinery Co., Ltd. 458,801,092 1,098,000 110,055,707 79,675
Yantai Hyundai Moon Heavy industries Co., Ltd. - 82,632,252 - -
Hyundai Heavy industries (China) electric Co., Ltd. 6,555,016 16,891,382 4,445,690 1,150,797
Hyundai Heavy Material service 9,354,188 412,347,517 2,456,143 63,617,743
Hyundai Construction equipment india Private Ltd. 75,390,841 774,640 47,191,016 64,935
Hyundai ideal electric Co. 11,308,540 527,033 5,659,591 186,706
₩ 2,081,991,155 ₩ 545,947,009 ₩ 589,566,971 ₩ 70,483,117
(b) Significant transactions and outstanding balances with subsidiaries and associated companies within the Hyundai Heavy Industries Group of com-
panies and former associated companies of Hyundai Group for the year ended and as of December 31, 2010 are summarized as follows:
(c) The Company has entered into rental agreements (deposits received of ₩990 million) with Hyundai Mipo Dockyard Co., Ltd. and other associated
companies as of December 31, 2010. In addition, the Company is contingently liable for loan guarantees and performance guarantees of construction con-
tracts of Hyundai Samho Heavy Industries Co., Ltd. (HSHI) and other associated companies, including joint construction contracts with HSHI (see note 15).
(Continued)
(d) Compensation for key management of the Company for the year ended December 31, 2010 was ₩3,625,399 thousand. Key management is defined
as directors and internal auditors who have important rights and responsibilities involving the planning, operation and control of the Company.
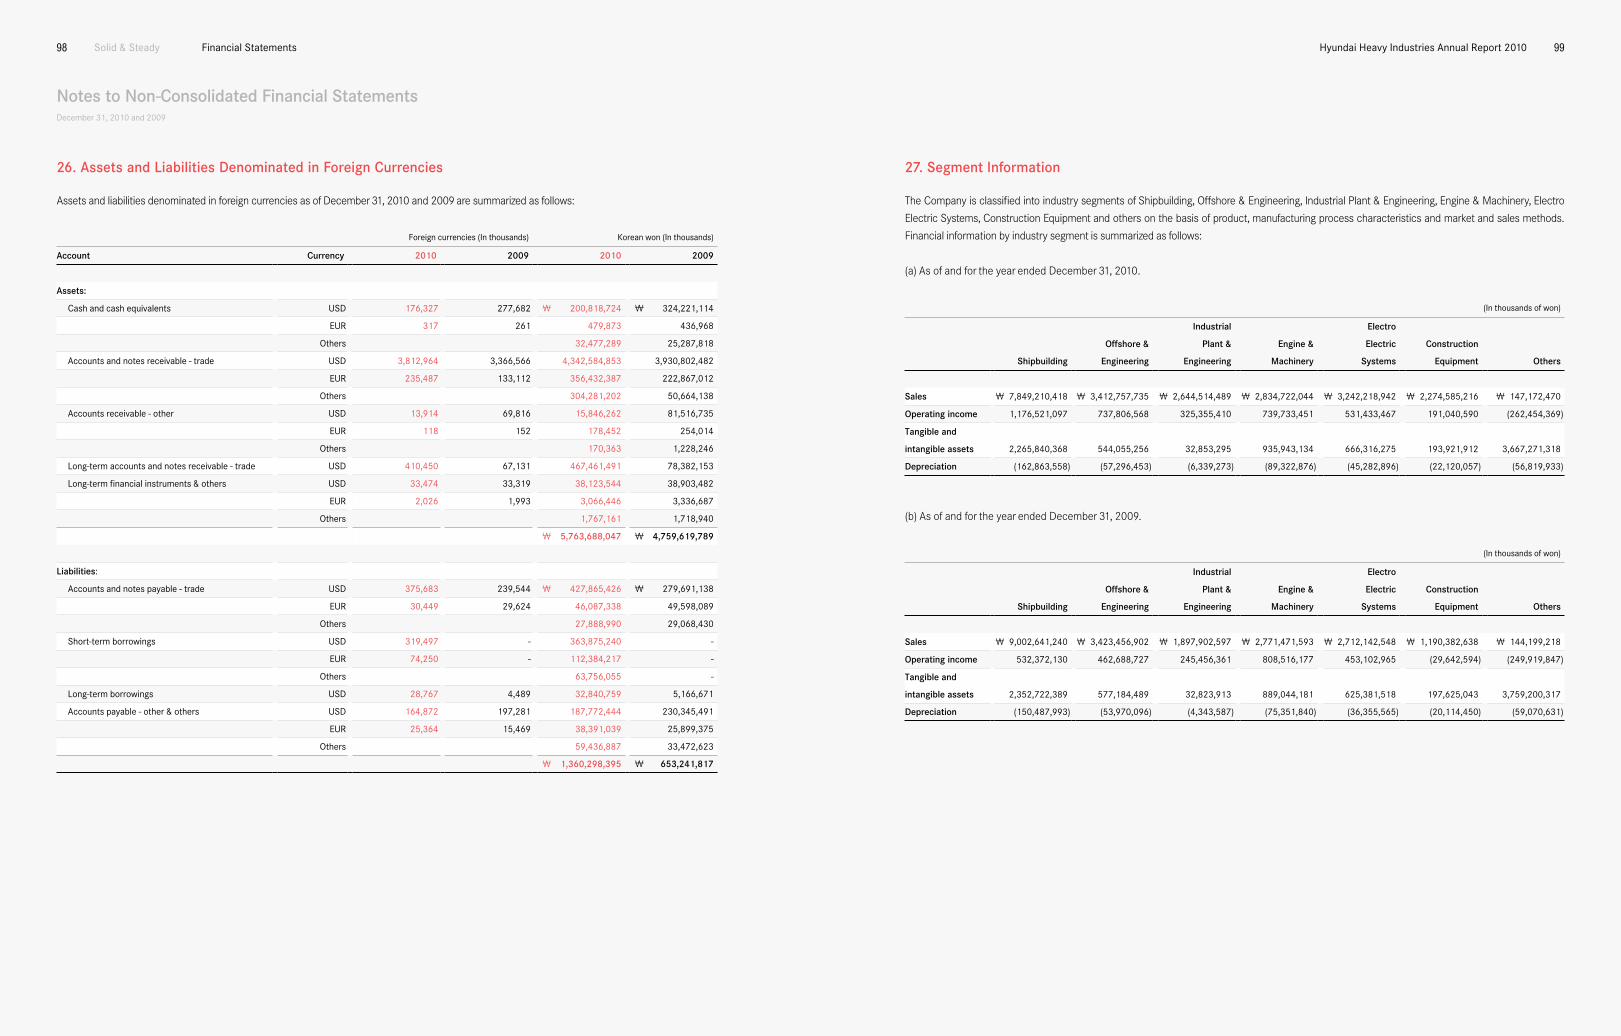
solid & steady Financial statements98
Notes to Non-Consolidated Financial StatementsDecember 31, 2010 and 2009
Hyundai Heavy industries Annual report 2010 99
26. Assets and Liabilities Denominated in Foreign Currencies
Assets and liabilities denominated in foreign currencies as of December 31, 2010 and 2009 are summarized as follows:
Foreign currencies (in thousands) Korean won (in thousands)
Account Currency 2010 2009 2010 2009
Assets:
Cash and cash equivalents UsD 176,327 277,682 ₩ 200,818,724 ₩ 324,221,114
eUr 317 261 479,873 436,968
others 32,477,289 25,287,818
Accounts and notes receivable - trade UsD 3,812,964 3,366,566 4,342,584,853 3,930,802,482
eUr 235,487 133,112 356,432,387 222,867,012
others 304,281,202 50,664,138
Accounts receivable - other UsD 13,914 69,816 15,846,262 81,516,735
eUr 118 152 178,452 254,014
others 170,363 1,228,246
Long-term accounts and notes receivable - trade UsD 410,450 67,131 467,461,491 78,382,153
Long-term financial instruments & others UsD 33,474 33,319 38,123,544 38,903,482
eUr 2,026 1,993 3,066,446 3,336,687
others 1,767,161 1,718,940
₩ 5,763,688,047 ₩ 4,759,619,789
Liabilities:
Accounts and notes payable - trade UsD 375,683 239,544 ₩ 427,865,426 ₩ 279,691,138
eUr 30,449 29,624 46,087,338 49,598,089
others 27,888,990 29,068,430
short-term borrowings UsD 319,497 - 363,875,240 -
eUr 74,250 - 112,384,217 -
others 63,756,055 -
Long-term borrowings UsD 28,767 4,489 32,840,759 5,166,671
Accounts payable - other & others UsD 164,872 197,281 187,772,444 230,345,491
eUr 25,364 15,469 38,391,039 25,899,375
others 59,436,887 33,472,623
₩ 1,360,298,395 ₩ 653,241,817
27. Segment Information
The Company is classified into industry segments of Shipbuilding, Offshore & Engineering, Industrial Plant & Engineering, Engine & Machinery, Electro
Electric Systems, Construction Equipment and others on the basis of product, manufacturing process characteristics and market and sales methods.
Financial information by industry segment is summarized as follows:
(a) As of and for the year ended December 31, 2010.
(in thousands of won)
Industrial Electro
Offshore & Plant & Engine & Electric Construction
Shipbuilding Engineering Engineering Machinery Systems Equipment Others
Sales ₩ 7,849,210,418 ₩ 3,412,757,735 ₩ 2,644,514,489 ₩ 2,834,722,044 ₩ 3,242,218,942 ₩ 2,274,585,216 ₩ 147,172,470
Operating income 1,176,521,097 737,806,568 325,355,410 739,733,451 531,433,467 191,040,590 (262,454,369)
Tangible and
intangible assets 2,265,840,368 544,055,256 32,853,295 935,943,134 666,316,275 193,921,912 3,667,271,318
Depreciation (162,863,558) (57,296,453) (6,339,273) (89,322,876) (45,282,896) (22,120,057) (56,819,933)
(in thousands of won)
Industrial Electro
Offshore & Plant & Engine & Electric Construction
Shipbuilding Engineering Engineering Machinery Systems Equipment Others
Sales ₩ 9,002,641,240 ₩ 3,423,456,902 ₩ 1,897,902,597 ₩ 2,771,471,593 ₩ 2,712,142,548 ₩ 1,190,382,638 ₩ 144,199,218
Operating income 532,372,130 462,688,727 245,456,361 808,516,177 453,102,965 (29,642,594) (249,919,847)
Tangible and
intangible assets 2,352,722,389 577,184,489 32,823,913 889,044,181 625,381,518 197,625,043 3,759,200,317
Depreciation (150,487,993) (53,970,096) (4,343,587) (75,351,840) (36,355,565) (20,114,450) (59,070,631)
(b) As of and for the year ended December 31, 2009.

solid & steady Financial statements100
Notes to Non-Consolidated Financial StatementsDecember 31, 2010 and 2009
Hyundai Heavy industries Annual report 2010 101
30. The Company’s Environmental Standards and Policies
The Company has adopted and implemented an environmental management system, run by its environmental management group, to effectively man-
age the environmental impact of its operations. The Company has obtained ISO 14001 certification for its environmental management system from
DNV-QA (Det Norske Veritas QA Ltd.) to ensure transparency in the environmental management system and prepare for the expected imposition of
environmental standards-based trade barriers. To maintain and develop its environmental management system, the Company continuously works to
minimize the environmental effects from its overall business activities, from research and development, purchasing, and production to transport and
disposal by adopting advanced environmental management practices such as the periodic evaluation of the activities of the environment management
group, environmental protection plans and the evaluation of environmental performance.
The Company operates air pollution control and wastewater treatment facilities to handle pollutants generated by its manufacturing operations. It has ad-
opted its own environmental standards, which are twice as strict as current regulations in the Republic of Korea. In addition to maintaining emissions below
20% of the legal mandate, the Company has achieved a waste reclamation rate of 51% by minimizing the generation of waste and sorting it at the source. The
Company also operates an incinerator equipped with advanced emissions control equipment that has the capacity to handle 400 tons of waste per day.
29. Results of Operations for the Last Interim Period
(in thousands of won)
2010 2009
salaries ₩ 305,896,412 ₩ 284,957,403
Accrual for retirement and severance benefits 34,312,658 20,692,285
employee welfare 69,812,130 70,534,297
Advertising 48,935,300 37,384,930
ordinary development costs 87,310,379 72,727,985
Accrual for allowance for doubtful accounts 206,638,605 48,943,879
Depreciation 36,389,718 39,414,918
service charges 81,188,755 87,083,387
transportation 102,016,738 58,444,377
sales commissions 63,434,541 54,544,572
After-sale service expenses 48,738,916 28,870,517
others 146,224,709 118,581,346
₩ 1,230,898,861 ₩ 922,179,896
(in thousands of won except earnings per share)
2010 2009
4th quarter 4th quarter
sales ₩ 6,429,857,151 ₩ 5,331,696,473
net income for the period ₩ 1,061,007,731 ₩ 721,318,978
earnings per share ₩ 17,312 ₩ 11,899
28. Selling, General and Administrative Expenses
Details of selling, general and administrative expenses for the years ending December 31, 2010 and 2009 are summarized as follows:
32. Value Added Information
Details of accounts included in the computation of value added for the years ended December 31, 2010 and 2009 are summarized as follows:
31. Employee Welfare and Contributions to Society
For employee welfare, the Company granted scholarship funds of ₩53,038 million for the middle school, high school and college age children of em-
ployees and ₩10,398 million for medical benefits, such as health examinations and medical treatment, to its employees and their families during the
year ended December 31, 2010. In addition, the Company provided 16,000 apartment units for employee housing, achieving a 94% housing-supply ra-
tio. The Company also operates seven cultural and arts centers, including the Hyundai Arts Center established in December 1998 to provide members
of the community and its employees with a wide variety of cultural and leisure opportunities.
(in thousands of won)
2010 2009
income before income taxes ₩ 4,784,328,339 ₩ 2,648,063,235
salaries and wages 2,638,034,716 2,472,398,578
Financial expenses (82,097,382) (133,138,279)
rent 15,905,609 25,288,708
taxes and dues 16,381,800 16,026,109
Depreciation and amortization 440,045,046 399,694,162
₩ 7,812,598,128 ₩ 5,428,332,513
(in millions of won)
2010 2009
support for employee development ₩ 76,917 ₩ 13,596
Donations to social welfare and religious organizations 16,837 5,432
Donations for infrastructure and support of national and local governments 1,014 83
₩ 94,768 ₩ 19,111

solid & steady Financial statements102
Notes to Non-Consolidated Financial StatementsDecember 31, 2010 and 2009
Hyundai Heavy industries Annual report 2010 103
34. Planning and Adoption of K-IFRS (Korean International Financial Reporting Standards)
(a) K-IFRS Adoption Plan and current status of progress
The Company subsequently plans to issue financial statements prepared in accordance with K-IFRS from 2011. The Company organized a task force
team to perform preliminary analysis of the effects of K-IFRS adoption and establish accounting systems to apply the new accounting treatments, and
trained its relevant personnel internally and externally. The task force team regularly reports the details and status of the adoption plan to its board of
directors and management. The details of the K-IFRS Adoption Plan are as follows:
33. Non-cash Investing and Financing Activities
Significant non-cash investing and financing activities for the years ended December 31, 2010 and 2009 are summarized as follows:
Main Activities Preparation Plan State at December 31, 2010
Formation of the K-IFRS
Establishment of the task force
team and analysis of the likely ef-
fects of K-IFRS adoption
Complete the K-iFrs adoption plan by the end of 2010. June 2008: established the K-iFrs adoption task force team.
oct. - Dec. 2008: engaged an accounting firm to carry out an
analysis of the likely effects of K-iFrs adoption. Apr. - Aug.
2009: engaged an accounting firm to carry out an establish-
ment of closing process and basic design of it.
Training Acquire the skills required for iFrs conversion by the end
of 2010.
oct. 2008 - present: Held training for in-charge staff (train-
ing provided by the Korean Accounting standards Board).
Alignment of accounting systems Complete the establishment of accounting systems to ap-
ply the new accounting treatments under K-iFrs by the end
of 2010.
sep. - Dec. 2009: Completed the analysis of the scope of
required changes to the system.
(in thousands of won)
2010 2009
transfer of long-term trade accounts to current assets ₩ 29,304,284 ₩ 42,918,226
transfer of trade accounts to non-current assets 419,227,577 -
transfer of construction-in-progress to plant assets 416,179,719 1,263,083,487
Capital adjustments on valuation of equity method investments 71,177,886 1,223,737
Gain and loss on valuation of available-for-sale securities 362,262,688 534,950,242
Changes in equity arising on application of the equity method 33,025,683 263,582,652
negative changes in equity arising on application of the equity method 19,938,337 133,368,767
Gain and loss on valuation of derivatives 24,579,758 354,767,062
Gain and loss on revaluation of land 8,641,332 964,458,487
(b) Differences between accounting under K-IFRS and under K-GAAP expected to have a material effect on the Company are as follows:
Area K-IFRS Current K-GAAP
First-time
adopt ion
of K-IFRS
Employee benefits All cumulative actuarial gains (losses) on defined benefit
plans as of January 1, 2010 (the date of transition to K-
iFrs) will be recognized as equity.
-
Equity method the book value under the previous GAAP would be utilized
as the deemed cost and cost method would be applied
after January 1, 2010 (the date of transition to K-iFrs).
the Company accounts for associates and subsidiaries us-
ing the equity method.
Property, plant and
equipment
the book value under the previous GAAP would be utilized
as the deemed cost and cost method would be applied
after January 1, 2010 (the date of transition to K-iFrs).
-
Borrowing costs interest expenses are capitalized after January 1, 2010 (the
date of transition to K-iFrs).
All interest is presented as expense.
Employee benefits Under the Projected Unit Credit method, the Company
recognizes a defined benefit obligation calculated using an
actuarial technique and a discount rate based on the pres-
ent value of the projected benefit obligation.
the Company establishes an allowance for severance li-
ability equal to the amount which would be payable if all
employees left at the end of the reporting period.
Allowance for doubtful accounts impairment losses for financial instruments (receivables
and held-to-maturity investments) that are recorded at
amortized cost are recognized when there is objective evi-
dence that an impairment event has occurred.
the Company recognizes allowance for doubtful accounts
by estimating bad debt losses on receivables with uncer-
tain collection based on reasonable and objective criteria.
Recognition of warranty costs in
relation to percentage of comple-
tion method
the Company excludes expected warranty costs from
costs incurred to date for determining the stage of comple-
tion.
the Company includes expected warranty costs in costs in-
curred to date for determining the stage of completion and
recognizes warranty costs as a cost in the fiscal year of the
contract’s completion.
Classification of due from custom-
ers for contract work and due to
customers for contract work
if costs incurred plus recognized profits (less recognized
losses) exceed progress billings, the net amount shall
be accounted for due from customers for contract work.
However, if progress billings exceed costs incurred plus
recognized profits (less recognized losses), the net amount
shall be accounted for due to customers for contract work.
-
Change in revenue recognition cri-
teria of large engines for vessels
revenue is recognized when significant risks and rewards
of ownership of the goods are transferred to the buyer.
revenue is recognized based on the percentage of comple-
tion method.
Reclassification of guarantee de-
posits for membership, etc.
the Company recognizes guarantee deposits for member-
ship as intangible assets with an indefinite useful life.
Guarantee deposits for membership are recognized as
other non-current assets.

solid & steady Financial statements104 Hyundai Heavy industries Annual report 2010 105
To the Board of Directors and Internal Auditor (Audit Committee) of Hyundai Heavy Industries Co., Ltd.
I, as the Internal Accounting Control Officer (“IACO”) of Hyundai Heavy Industries Co., Ltd (the “Company”), have assessed the status of the design
and operations of the Company’s internal accounting control system (“IACS”) as of December 31, 2010.
The Company’s management, including IACO, is responsible for the design and operations of its IACS. I, as the IACO, have assessed whether the IACS
has been effectively designed and is operating to prevent and detect any error or fraud which may cause any misstatement of the financial statements,
for the purpose of establishing the reliability of financial statement preparation and presentation for external uses. I, as the IACO, applied the IACS Stan-
dards established by the IACS Operations Committee for the assessment of design and operations of the IACS.
Based on the assessment of the operations of the IACS, the Company’s IACS has been effectively designed and is operating as of December 31, 2010,
in all material respects, in accordance with the IACS Standards issued by the IACS Operations Committee.
January 27, 2011
Sul Kwang-woo, Internal Accounting Control Officer
Lee Jai-seong, Chief Executive Officer
Report on the Operations of Internal Accounting Control Systemenglish translation of a report originally issued in Korean
To the President ofHyundai Heavy Industries Co., Ltd.:
We have reviewed the accompanying Report on the Operations of Internal Accounting Control System (“IACS”) of Hyundai Heavy Industries Co., Ltd.
(the “Company”) as of December 31, 2010. The Company’s management is responsible for designing and maintaining an effective IACS and for its
assessment of the effectiveness of the IACS. Our responsibility is to review management’s assessment and issue a report based on our review. In the
accompanying report of management’s assessment of the IACS, the Company’s management stated: “Based on the assessment on the operations of
the IACS, the Company’s IACS has been effectively designed and is operating as of December 31, 2010, in all material respects, in accordance with the
IACS Framework issued by the Internal Accounting Control System Operation Committee.”
We conducted our review, in accordance with IACS Review Standards, issued by the Korean Institute of Certified Public Accountants. Those Standards
require that we plan and perform the review to obtain assurance of a level less than that of an audit as to whether the Report on the Operations of the
Internal Accounting Control System is free of material misstatement. Our review consists principally of obtaining an understanding of the Company’s
IACS, inquiries of company personnel about the details of the report, and tracing to related documents we considered necessary in the circumstances.
We have not performed an audit and, accordingly, we do not express an audit opinion.
A company’s IACS is a process designed to provide reasonable assurance regarding the reliability of financial reporting and the preparation of financial
statements for external purposes in accordance with generally accepted accounting principles. Because of its inherent limitations, however, the IACS
may not prevent or detect misstatements. Also, projections of any evaluation of effectiveness to future periods are subject to the risk that controls may
become inadequate because of changes in conditions, or that the degree of compliance with the policies or procedures may deteriorate.
Based on our review, nothing has come to our attention that the Report on the Operations of the Internal Accounting Control System as of December
31, 2010 is not prepared in all material respects, in accordance with the IACS Framework issued by the Internal Accounting Control System Operation
Committee.
This report applies to the Company’s IACS in existence as of December 31, 2010. We did not review the Company’s IACS subsequent to December 31,
2010. This report has been prepared for Korean regulatory purposes, pursuant to the External Audit Law, and may not be appropriate for other purposes
or for other users.
February 28, 2011
Notice to ReadersThis report is annexed in relation to the audit of the non-consolidated financial statements as of December 31, 2010 and the review of internal accounting control system pursuant to Article 2-3 of the Act on External Audit for Stock Companies of the Republic of Korea.
Independent Accountants’ Review Report on Internal Accounting Control Systemenglish translation of a report originally issued in Korean

Hyundai Heavy industries Annual report 2010 107106 overseas network
OVERSEAS OFFICES
OVERSEAS INCORPORATED FIRMS
EUROPELONDON2ND FLOOR, THE TRIANGLE 5-17 HAMMERSMITH GROVELONDON, W6 0LG, UKTEL: 44-20-8741-0501FAX: 44-20-8741-5620
OSLOHYUNDAI OSLO (LIAISON) OFFICERAADHUSGT. 20, 0151OSLO, NORWAYTEL: 47-2310-0890FAX: 47-2310-0899
ATHENS73, POSIDONOS AVENUE175 62, PALEO FALIROATHENS, GREECETEL: 30-210-428-2992~3FAX: 30-210-428-2144
ROTTERDAMFOLKERT ELSINGASTRAAT 73067 NW, ROTTERDAMTHE NETHERLANDSTEL: 31-10-212-1567FAX: 31-10-212-5134
MADRID PASEO DE LA CASTELLANA 216PLANTA 0, 28046 MADRID SPAINTEL: 34-91-732-0454FAX: 34-91-733-2389
NORTH AMERICAISTANBULDEREBOYU CADDESI MEYDAN SOKAK BEYBI GIZ PLAZAKAT.8 NO. 30 MASLAK,ISTANBUL, TURKEYTEL: 90-212-290-2860~1FAX: 90-212-290-2862
MOSCOWWORLD TRADE CENTER, ENT.3, #1902 KRASNOPRESNENSKAYA NAB.12 MOSOW, 123610, RUSSIA TEL: 7-495-258-1381FAX: 7-495-258-1382
NEW JERSEY300 SYLVAN AVENUEENGLEWOOD CLIFFSNJ 07632, U.S.A.TEL: 1-201-816-4080~2FAX: 1-201-816-4083
HOUSTON1400 BROADFIELD, SUITE 110PARK 10 CENTER, HOUSTONTEXAS 77084, U.S.A.TEL: 1-281-578-7097, 7802FAX: 1-281-578-8317, 7330
ORLANDO4700 MILLENIA BLVD, SUITE 370 ORLANDO, FLORIDA 32839 U.S.A.TEL: 1-407-249-7350FAX: 1-407-275-4940
ASIAPANAMAAVE. SAMUEL LEWIS, EDIF. HSBC, PISO 12, OBARRIO PANAMA CITYREP OF PANAMATEL: 507-213-7657~9FAX: 507-213-7660
TOKYO8TH FLOOR, YURAKUCHO DENKI BLDG.,1-7-1 YURAKU-CHO CHIYODA-KU, TOKYO 100-0006 JAPANTEL: 81-3-3211-0742~4FAX: 81-3-3211-2093
OSAKAI-ROOM 5TH FLOOR NAGAHORI PLAZA BLDG. 2-4-8 MINAMI SENBA, CHUO-KU OSAKA 542-0081, JAPAN TEL: 81-6-6261-5766~7 FAX: 81-6-6261-5818
SINGAPORE7 TEMASEK BOULEVARD#41-02, SUNTEC TOWER ONE038987, SINGAPORETEL: 65-6337-2366FAX: 65-6333-8966
MUMBAI5TH FLOOR, EAST QUADRANTTHE IL&FS FINANCIAL CENTRE PLOT NO. C-22, G-BLOCK BANDRA-KURLA COMPLEX BANDRA(E), MUMBAI 400 051, INDIATEL: 91-22-2653-3420~26FAX: 91-22-2653-3429~30
MIDDLE EAST AFRICADUBAI205, BUILDING 4, EMAARSQUARE, SHEIKH ZAYED ROAD POBOX 252458, DUBAI, UAETEL: 971-4-425-7995FAX: 971-4-425-7996
RIYADHOLAYA STREET, RIYADH, THE PLAZA 2nd FLOOR, OFFICE NO.230 KINGDOM OF SAUDI ARABIATEL: 966-5006-31123
KUWAITFLOOR 15, AL SOUR TOWER AL SOUR STREET AL-QIBLAH, KUWAITTEL: 965-9490-4864
LUANDARUA LUCRECIA PAIM NO. 28/30LUANDA, ANGOLATEL: 244-222-370-669FAX: 244-222-370-667
EUROPEGEEL(HYUNDAI HEAVY INDUSTRIESEUROPE N.V.) VOSSENDAAL11, 2440 GEEL, BELGIUMTEL: 32-14-56-2211FAX: 32-14-59-3405
SOFIA(HYUNDAI HEAVY INDUSTRIES CO. - BULGARIA) 1271, SOFIA 41ROJEN BLVD, BULGARIATEL: 359-2-809-3200, 3210, 3220FAX: 359-2-803-3203, 3242
BOCHUM(JAHNEL-KESTERMANN GETRIBEWRKE GMBH) HUNSCHEIDTSTR. 116, 44789 BOCHUM, GERMANYTEL: 49-234-339-332FAX: 49-234-339-200
PARIS(HYUNDAI HEAVY INDUSTRIES FRANCE SAS) 17, RUE BEFFROY, 92200 NEUILLY-SUR-SEINE, FRANCETEL: 33-1-4637-1761FAX: 33-1-4637-1295
BUDAPEST(HYUNDAI TECHNOLOGIES CENTER HUNGARY LTD.) 1146, BUDAPESTHERMINA UT 22, HUNGARYTEL: 36-1-273-3730, 3733FAX: 36-1-220-6708
NORTH AMERICA ASIAVLADIVOSTOK(HOTEL HYUNDAI VLADIVOSTOK)29, SEMENOVSKAYA STREETVLADIVOSTOK, 690091, RUSSIATEL: 7-4232-40-7300FAX: 7-4232-40-7007
CHICAGO(HYUNDAI CONSTRUCTION EQUIPMENT AMERICAS, INC.) 955 ESTES AVENUEELK GROVE VILLAGE, IL 60007, U.S.A.TEL: 1-847-228-8847, 8832FAX: 1-847-437-3574, 3572
OHIO(HYUNDAI IDEAL ELECTRIC CO.)330 EAST FIRST STREETMANSFIELD, OH 44902, U.S.A.TEL: 1-419-522-3611FAX: 1-419-522-9386
BEIJING(BEIJING HYUNDAI JINGCHENG CONSTRUCTION MACHINERY CO., LTD.) NO. 2, NANLI, LUGUOQIAOFENGTAI DISTRICT, BEIJING, CHINATEL: 86-10-8321-8347~8 FAX: 86-10-8321-1353 8321-4730 (Factory)
CHANGZHOU(HYUNDAI (JIANG SU) CONSTR-UCTION MACHINERY CO., LTD.) 288, HEHAI WEST ROAD, XINBEI DISTRICT, CHANGZHOUJIANGSU, 213022, CHINA TEL: 86-519-8519-1002, 1020FAX: 86-519-8519-1385(Sales) 8519-1089(Admin)
CHANGZHOU(CHANGZHOU HYUNDAI HYDRAULIC MACHINERY CO., LTD.)326, HUANGHE WEST ROAD CHANGZHOU, JIANGSU, CHINATEL: 86-519-8302-1726FAX: 86-519-8302-1710
TAI’AN(HYUNDAI(SHANDONG) HEAVY INDUSTRIES MACHINERY. CO., LTD.)YITIANMEN AVENUE MIDDLE TAIANHIGH-TECHZONE, SHANDONG CHINATEL: 86-538-349-0110FAX: 86-538-349-0098
YANGZHONG(HYUNDAI HEAVY INDUSTRIES (CHINA) ELECTRIC CO., LTD.) NO. 9 XIANDAI ROAD, XINBA SCIENTIFIC AND TECHNOLOGIC ZONE YANGZHONG, JIANGSU, P.R.C. ZIP: 212212, CHINATEL: 86-511-8842-0666, 0500 0212, 0250FAX: 86-511-8842-0668,0231
YANTAI(YANTAI HYUNDAI MOON HEAVY INDUSTRIES CO., LTD.)No. 333 CHANGJIANG ROADYANTAI ETDA, SHANDONG, CHINATEL: 86-535-216-5800~1FAX: 86-535-216-5810, 5830
SHANGHAI(HHI CHINA INVESTMENT CO., LTD.) ROOM 2002, NORTH TOWER SHANGHAI STOCK EXCHANGE BUILDING, #528, PUDONG SOUTH ROAD, SHANGHAI, CHINATEL: 86-21-6880-0808 (ARS 201~203,208)FAX: 86-212-6880-0608
AFRICASHANGHAI(HYUNDAI FINANCIAL LEASING CO., LTD.) ROOM 3301, CHINA MERCHANTS TOWER #161 EAST LU JIA ZUI ROAD SHANGHAI, CHINA (200120)TEL: 86-21-6888-0505FAX: 86-21-5876-4027
SHANGHAI(GRAND CHINA HYUNDAI SHIPPING CO., LTD.) 8F YOU YOU INTERNATIONAL PLAZA, NO.76 PUJIAN ROAD PUDONG SHANGHAI, 200127TEL: 86-21-5881-4784FAX: 86-21-5881-4744
PUNE(HYUNDAI CONSTRUCTION EQUIPMENT INDIA PVT., LTD.)PLOT NO. A-2, MIDC CHAKAN PHASE - II, VILL.-KHALUMBRE.PUNE 410 501, INDIATEL: 91-21-3530-1700FAX: 91-21-3530-1712
ABUJA(HYUNDAI HEAVY INDUSTRIES CO. NIGERIA LTD.) 4th FLOOR OAKLAND CENTER, PLOT 2940, AGUIYI IRONSI STREET, MAITAMA, ABUJA, NIGERIATEL: 234-807-276-9160
ABUJA(NIKORMA TRANSPORT LTD.)NO.7A LAKE CHAD CRESCENT MAITAMA, ABUJA, NIGERIATEL: 234-9-460-85503 234-803-775-6984 (M.P)
oFFiCes
inCorPorAteD FirMs
ROTTERDAM NETHERLANDS OSLO NORWAY
ATHENS GREECE
SOFIA BULGARIA
BUDAPEST HUNGARYGEEL BELGIUM
PARIS FRANCE
ABUJA NIGERIA
MADRID SPAIN
MOSCOW RUSSIA
BOCHUM GERMANYLONDON U.K.
ISTANBUL TURKEY
LUANDA ANGOLA
MUMBAI INDIA
PUNE INDIA
SINGAPORE
DUBAI U.A.E.
TOKYO JAPAN
BEIJING CHINA
VLADIVOSTOK RUSSIA
RIYADH SAUDI ARABIA
KUWAIT
TAI’AN CHINA
CHANGZHOU CHINA
YANTAI CHINA
YANGZHONG CHINA
SHANGHAI CHINA
OSAKA JAPAN
NEW JERSEY U.S.A.HOUSTON U.S.A.
PANAMA CITY PANAMA
ORLANDO U.S.A.OHIO U.S.A.
CHICAGO U.S.A.
HHIGlobalNetwork
solid & steady

108 Affiliated Companies
Paid-in CapitalKRW 380 billion
Common Stock76,000,000 shares
Number of Employees24,222
General Shareholders’ MeetingMarch 11, 2011
ListingListed on the Korea Stock Exchange inAugust 1999.KSE Ticker: 009540
Investor Relations TeamGeneral Manager: Kwon Ki-hyeong(822-746-4729, [email protected])
Manager: Son Sung-min(822-746-4728, [email protected])
Associate Manager: Kim Jong-yoon(822-746-4546, [email protected])
Associate Manager: Choi Jung-in(822-746-4775, [email protected])
Assistant Manager: Min Byung-kee(822-746-4583, [email protected])
Oum Yi-jung(822-746-7677, [email protected])
Head Office#1, Jeonha-dong, Dong-guUlsan 682-792, Republic of KoreaTel: 82-52-202-2114Fax: 82-52-202-3432
Seoul OfficeHyundai Building, 14th FloorGye-dong Jongno-gu Seoul 100-793, Republic of KoreaTel: 82-2-746-4603Fax: 82-2-746-4662
Date of EstablishmentDecember 28, 1973
HYUNDAI MIPO DOCKYARD CO., LTD. HYUNDAI SAMHO HEAVY INDUSTRIES CO., LTD.Business Line Major shareholder Paid-in Capital
Shipbuilding, Conversion & Repairs
Hyundai Samho Heavy Industries Co., Ltd. (46.03%)
KRW 100,000 million
Shipbuilding
Hyundai Heavy Industries Co., Ltd. (94.92%)
KRW 200,000 million
HYUNDAI OILBANK CO., LTD. HYUNDAI FINANCE CORP.Business Line Major shareholder Paid-in Capital
Petroleum Refining
Hyundai Heavy Industries Co., Ltd (91.13%)
KRW 1,225,412 million
Corporate Financing, Management Consulting
Hyundai Heavy Industries Co., Ltd. (67.49%)
KRW 91,500 million
HYUNDAI VENTURE INVESTMENT CORP. MIPO ENGINEERING CO., LTD.Business Line Major shareholder Paid-in Capital
Venture Fund Investments
Hyundai Finance Corp. (68.38%)
KRW 30,000 million
Ship Design & Engineering
Hyundai Mipo Dockyard Co., Ltd (100%)
KRW 1,400 million
HYUNDAI FUTURES CORP. WÄRTSILÄ-HYUNDAI ENGINE CO., LTD.Business Line Major shareholder Paid-in Capital
Overseas Futures & Options Brokerage
Hyundai Finance Corp. (65.22%)
KRW 23,000 million
Manufacturing of Dual-Fuel Engines
Hyundai Heavy Industries Co., Ltd. (50%)
KRW 67,860 million
ULSAN HYUNDAI FOOTBALL CLUB HYUNDAI HEAVY MATERIAL SERVICEBusiness Line Major shareholder Paid-in Capital
Professional Sports Club
Hyundai Heavy Industries Co., Ltd. (100%)
KRW 14,000 million
Manufacturing of Ship Components
Hyundai Heavy Industries Co., Ltd. (100%)
KRW 148,000 million
KOMAS HI INVESTMENT AND SECURITIESBusiness Line Major shareholder Paid-in Capital
Shipping
Hyundai Heavy Industries Co., Ltd. (100%)
KRW 3,772 million
Securities Services
Hyundai Mipo Dockyard Co., Ltd. (83.24%)
KRW 175,692 million
HI ASSET MANAGEMENT HOTEL HYUNDAIBusiness Line Major shareholder Paid-in Capital
Securities Services
Hyundai Mipo Dockyard Co., Ltd. (7.57%),
HI Investment and Securities (92.41%)
KRW 34,408 million
Hospitality
Hyundai Heavy Industries Co., Ltd. (100%)
KRW 400 million
TAEBAEK WIND POWER HYUNDAI CORPORATIONBusiness Line Major shareholder Paid-in Capital
Wind Power
Hyundai Heavy Industries Co., Ltd. (35%)
KRW 10,050 million
Trading
Hyundai Heavy Industries Co., Ltd. (22.36%)
KRW 111,649 million
HC PETROCHEM MUJU WIND POWERBusiness Line Major shareholder Paid-in Capital
Manufacturing of Petrochemicals
Hyundai Oilbank Co., Ltd (50.00%)
KRW 357,000 million
Wind Power
Hyundai Heavy Industries Co., Ltd (45.00%)
KRW 11,400 million
CHANGJUK WIND POWER HYUNDAI-AVANCISBusiness Line Major shareholder Paid-in Capital
Wind Power
Hyundai Heavy Industries Co., Ltd (43.00%)
KRW 400 million
Solar Module Manufacturing & Sales
Hyundai Heavy Industries Co., Ltd (50.00%)
KRW 80,000 million
CORPORATE DATA
solid & steady
AFFILIATED COMPANIES
