fubon financial 2014 q1 interim results and 2013...
TRANSCRIPT

2014.5.15
Fubon Financial 2014 Q1 Interim Results
and
2013 Embedded Value of Fubon Life

2
Disclaimer
This meeting may contain forward-looking statements with respect to the financial
condition, results of operations and business of the company. These forward-looking
statements represent the company’s expectations or beliefs concerning future events
and involve known and unknown risks and uncertainty that could cause actual
results, performance or events to differ materially from those expressed. Certain
statements, such as those that include the words “potential”, “estimated”, and similar
expressions or variations on such expressions may be considered “forward-looking
statements”. Financial numbers in this report may include preliminary unaudited
numbers or management accounts.

3
� Performance review by subsidiary
• Fubon Life
• Fubon Securities
� Performance highlights of Fubon Financial Holdings
• Fubon Insurance
Agenda
• Taipei Fubon Bank
• Fubon Bank (China)
� 2013 Embedded Value of Fubon Life

4
Fubon Financial Holdings: Operation highlights
Taipei Fubon Bank
� Earning momentum recovery and net profits doubled
� Aiming to capture new business opportunity
Fubon Life
Fubon Insurance
Fubon Securities
Net profits NT$13,866 million in 1Q14 with 37% yoy growth
� Premium growth above expectation with total premium grew 26% yoy
� Consistent investment performance
� Balance growth from all source of revenue
� Asset quality remains benign
� Leading position in premium income with 21% market share
� Strong underwriting performance

3.39
3.07 3.31
2011 2012 2013
10.1
13.9
3M13 3M14
30.7 29.1 32.7
2011 2012 2013
1.06
1.35
3M13 3M14
5
Fubon Financial Holdings: ProfitabilityNet profits
EPS
NT$
+37%
+27%
8.03(1)
0.90(1)
Note: (1) Disposal gains of Fubon Multimedia Technology of NT$8 bn and NT$0.8 bn are recognized in 2011 and 2012 respectively(2) Data in 2012 and 2013 are T-IFRS basis, and data in 2011 are ROC GAAP basis
NT$bn

Taipei Fubon Bank, 5.9, 42%
Fubon Life, 5.8 , 42%
Fuobn P&C, 0.8, 6%
Fubon Securities,
0.5, 4%
Others, 0.9, 6%
6
Fubon Financial Holdings: Net profits by subsidiary
YoY changes by subsidiary Net profits composition
Note: Fubon Bank (China) contributed 3% profits on 80% stake holding basis
Note: NT$781m of committed compensation to government regarding sports lottery business was recognized in 1Q2013
NT$bn NT$bn
10.1
3.8
5.4
0.8 0.2
13.9
5.9 5.8
0.8 0.5
Fubon FHC Taipei FubonBank
Fubon Life Fuobn P&C FubonSecurities
3M13 3M14

4,237
5,015
3M13 3M14
7
Fubon Financial Holdings: Asset and net worth
Total assets
Net worth
234
306 316
2011 2012 2013
305
348
3M13 3M14
+18%
+14%
NT$bn
NT$bn
3,623 4,106
4,571
2011 2012 2013

8
Fubon Financial Holdings: ROA & ROE
ROA
ROE
0.87%
0.75% 0.75%
2011 2012 2013
13.54%
10.71% 10.50%
2011 2012 2013
0.97%
1.16%
3M13 3M14
13.27%
16.69%
3M13 3M14
9
� Performance review by subsidiary
• Fubon Life
• Fubon Securities
� Performance highlights of Fubon Financial Holdings
• Fubon Insurance
Agenda
• Taipei Fubon Bank
• Fubon Bank (China)
� 2013 Embedded Value of Fubon Life

3.75.4
2.1
2.62.0
3.3
1Q13 1Q14
Treasury & others
Net fee income
Net interest income
10
Taipei Fubon Bank: Revenue
Revenue composition of Taipei Fubon Bank
NT$bn
Non-NII as% of total revenue
11.4
53% 52%
� Revenue growth across all revenue lines
7.8
13.9 14.6 15.8
8.1 8.38.4
3.46.3
9.4
2011 2012 2013
25.5
29.2
33.6
45% 50% 53%
Note: Consolidated basis; Fubon Bank (China) accounted starting from Jan 2014

205.7 185.1
473.5 542.9
13.4
63.7
334.6
353.9 26.7
27.8
18.9
18.6 7.4
7.1
Mar-13 Mar-14
Credit card revolving
Consumer - unsecured loan
Consumer - secured loan
Mortgage loan
Forfaiting & factoring
Corporate loan
Government loan
11
Taipei Fubon Bank: Credit composition
Loans and A/R by type
NT$bn
1,080.0
1,199.1 YoY +11.0%
YoY -4.3%
YoY -1.6%
YoY +4.4%
YoY +5.8%
YoY +14.7%
YoY +377.3%
YoY -10%
Note: Ending balance and stand-alone basis
� Growth from corporate loan and forfaiting & factoring are key drivers

12
Taipei Fubon Bank: Credit composition
Corporate loan growth (yoy) by currency
FX loan as % of corporate loan
Yoy growth in forfaiting & factoring
16.0%13.0%
16.6%
23.8% 24.2%
2.6% 3.4%6.6%
3.9% 5.7%
1Q13 2Q13 3Q13 4Q13 1Q14
FX NTD
-29.3% -16.9%
90.4%127.1%
265.4%
1Q13 2Q13 3Q13 4Q13 1Q14
Forfaiting & factoring as % of total credit
35.5%35.9%
37.4%
39.3% 39.3%
1Q13 2Q13 3Q13 4Q13 1Q14
1.7% 1.9%
3.2%
4.4%
5.7%
1Q13 2Q13 3Q13 4Q13 1Q14
Note: Average balance and stand-alone basis

13
Taipei Fubon Bank: Interest yield and margin
NIM and loan-to-deposit spread
Loan yield and deposit yield
0.99% 1.01% 1.05%
1.34% 1.33% 1.33%
2011 2012 2013
NIM Loan-to-deposit spread
1.98% 2.06% 2.04%
0.64% 0.73% 0.71%
2011 2012 2013
Loan rate Deposit rate
2.04% 2.06%
0.70% 0.77%
1Q13 1Q14
1.03% 1.10%
1.34% 1.29%
1Q13 1Q14
Note: Stand-alone basis; loan rate calculation inclusive of credit card revolving
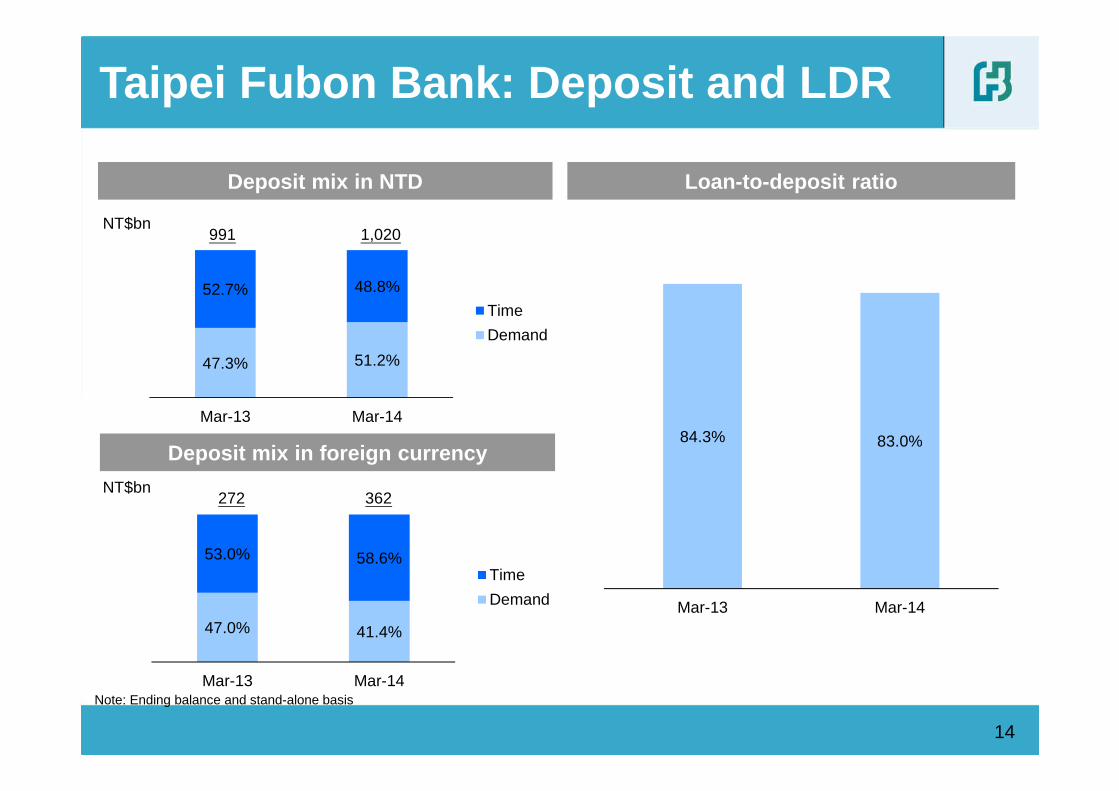
47.3% 51.2%
52.7% 48.8%
Mar-13 Mar-14
Time
Demand
47.0% 41.4%
53.0% 58.6%
Mar-13 Mar-14
Time
Demand
14
Taipei Fubon Bank: Deposit and LDR
Loan-to-deposit ratioDeposit mix in NTD
Deposit mix in foreign currency
NT$bn
NT$bn
84.3% 83.0%
Mar-13 Mar-14
991 1,020
272 362
Note: Ending balance and stand-alone basis

15
Taipei Fubon Bank: Fee and wealth management revenue
Sources of fee income
Wealth management revenue
706 662 774 984 1,007 71 61
59 38 47
827 851 533 662
895 194 203 423
228 213
1Q13 2Q13 3Q13 4Q13 1Q14
DCI,SI and others
Mutual funds
Custodian and trust
Insurance commission
1,798 1,778 1,789 1,9122,162
Note: Data inclusive of Taipei Fubon Bank standalone & Taipei Fubon Bank Life Insurance Agency
NT$m
NT$m
� Growth in fee income along with wealth management business
2,122
1,604
261 42
2,570
1,949
264 178
Total fee income Wealth management Credit card Sydication loan
1Q13 1Q14

16
Taipei Fubon Bank: Loan book quality
NPL ratio
NPL ratio by business Provision (NT$m)
Coverage ratio
691.1%790.2%
1068.2%974.0%
1211.1%
Mar-13 Jun-13 Sep-13 Dec-13 Mar-14
0.12%0.11% 0.11%
0.12%
0.09%
Mar-13 Jun-13 Sep-13 Dec-13 Mar-14
0.12%
0.02%0.0%
0.2%
0.4%
0.6%
Jun-11 Dec-11 Jun-12 Dec-12 Jun-13 Dec-13
Corporate loan Mortgage loan
Note: stand-alone basis
(206)
3,857
(150)
1Q13 2013 1Q14
17
� Performance review by subsidiary
• Fubon Life
• Fubon Securities
� Performance highlights of Fubon Financial Holdings
• Fubon Insurance
Agenda
• Taipei Fubon Bank
• Fubon Bank (China)
� 2013 Embedded Value of Fubon Life

222.8249.7
212.9
145.4
171.0207.2
2011 2012 2013
Renewal premium
FYP
35.156.1
52.4
54.5
1Q13 1Q14
1818
Fubon Life: Total premium� Strong premium growth in FYP and steady renewal premium in 1Q14
420.1
368.2
420.7
NT$bn
87.5
110.6

FYP composition
FYP market share by channel
Fubon Life: First year premium (FYP)
11.4%
13.1%
1Q13 1Q14
14.8%
22.6%
1Q13 1Q14
20.6%
24.4%
1Q13 1Q14
Tied agents Bancassurance Brokers
NT$bn 1Q13 % 1Q14 %
Traditional life: Regular-paid 8.7 24.8% 7.2 12.8%
Traditional life: Single-paid 17.1 48.6% 41.5 74.0%
Interest-sensitive annuity 6.6 18.8% 4.6 8.2%
Investment-linked 1.5 4.3% 1.5 2.7%
Health, accidents and others 1.2 3.5% 1.3 2.2%
Total 35.1 100.0% 56.1 100.0%
19
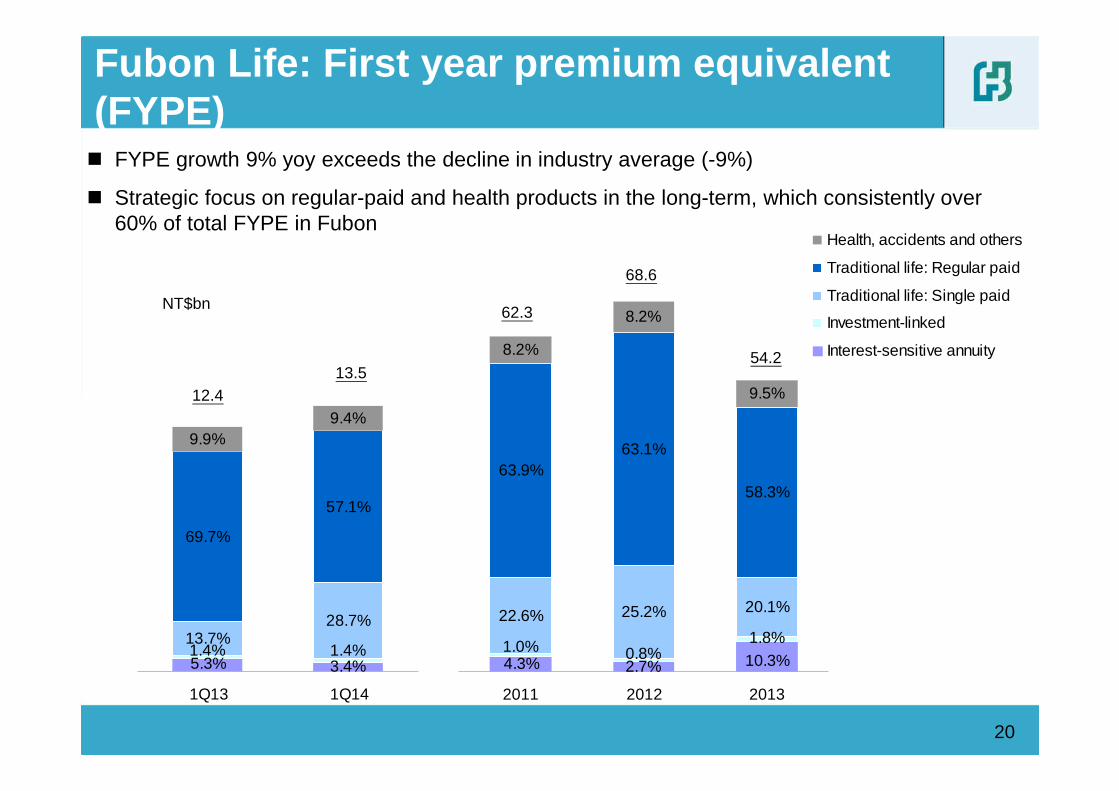
3.4%5.3%1.4%1.4%
28.7%13.7%
57.1%
69.7%
9.4%9.9%
1Q13 1Q14
4.3% 2.7% 10.3%1.0% 0.8%
1.8%22.6% 25.2% 20.1%
63.9%63.1%
58.3%
8.2%
8.2%
9.5%
2011 2012 2013
Health, accidents and others
Traditional life: Regular paid
Traditional life: Single paid
Investment-linked
Interest-sensitive annuity
20
Fubon Life: First year premium equivalent (FYPE)
12.413.5
54.2
68.6
62.3NT$bn
� FYPE growth 9% yoy exceeds the decline in industry average (-9%)
� Strategic focus on regular-paid and health products in the long-term, which consistently over 60% of total FYPE in Fubon

FYP by channel
21
Fubon Life: Sales channel
Size of tied agency
� Top 1 position in bancassurance and broker channels
� Size of tied agents grow ahead of market
9.8 12.4
12.9
26.26.8
10.6
5.7
6.9
1Q13 1Q14
Other
Bancassurance: through Taipei Fubon bank
Bancassurance: through external banks
Tied agents
35.1
56.1NT$bn
14,337
15,377
Mar-13 Mar-14

2222
Fubon Life: Composition of investment income� Investment income mainly come from recurring revenue
� Realized gain from equity investment as economy recovery
Growth rate
NT$bn 1Q13 1Q14 2011 2012 2013 1Q14
Recurring investment income 14.8 18.2 52.0 62.7 74.4 23.0%
Realized gains from fixed income investment 2.3 1.6 2.6 7.9 8.0 -30.4%
Realized gains from equity investment 3.3 5.7 5.1 4.5 3.7 72.7%
FX and others -0.5 -1.3 -5.0 -6.4 -5.9 N.M.
investment income 19.9 24.2 54.7 68.6 80.2 21.6%
Total investment assets 2,002.9 2,318.7 1,573.2 1,932.3 2,203.7 15.8%

2323
Fubon Life: Investment portfolio
� Investment assets growth 16% yoy
� Investment portfolio toward overseas fixed income and equity investment
((((NT$bn)))) Amount % Amount %
Deposit and cash equivalent 116.6 5.8% 109.3 4.7%
Domestic fixed income 595.8 29.7% 650.3 28.0%
Overseas fixed income 865.6 43.2% 1,015.2 43.8%
Domestic equity 203.3 10.1% 235.2 10.1%
Overseas equity 43.3 2.2% 103.8 4.5%
Mortgage loans 39.8 2.0% 56.8 2.5%
Policy loans 46.5 2.3% 49.2 2.1%
Real estate 92.0 4.6% 98.9 4.3%
Total Investments 2,002.9 100.0% 2,318.7 100.0%
Domestic 1,094.0 54.6% 1,199.7 51.7%
Overseas 908.9 45.4% 1,119.0 48.3%
2014/3/312013/3/31

23.5%
49.3% 51.5%
28.8% 25.0%
21.9%
Mar-13 Mar-14
Europe
North America
Asia & Other
2424
Fubon Life: Overseas fixed income portfolio
Overseas fixed income by asset type Overseas fixed income by region
11.0% 8.4%
44.1% 43.4%
7.0%
43.1%37.9%
5.1%
Mar-13 Mar-14
Others
Corporate credit
Financial bond
Government bond

2525
Fubon Life: Overseas fixed income portfolio
Hedging cost Hedging structure
48bps
bps 56bps
-14
21
-77
-241Q13 1Q14
FX gain/loss
CS cost
Fully hedge79.3%
Othercurrencies
4.2%
Equities/mutualfunds13.1%
Unhedge3.3%
Recurring return before hedge Deployment in overseas fixed income
3.17%
3.34%
Mar-13 Mar-14
60~65bps in May
1.7
3.7
1.4
3.14%
3.68%3.75%
0.0
0.5
1.0
1.5
2.0
2.5
3.0
3.5
4.0
1H13 2H13 1Q14
2.8%
3.0%
3.2%
3.4%
3.6%
3.8%
Net incremental position in overseas fixed income (left)
Average 30-year US treausry(right)US$bn
2626
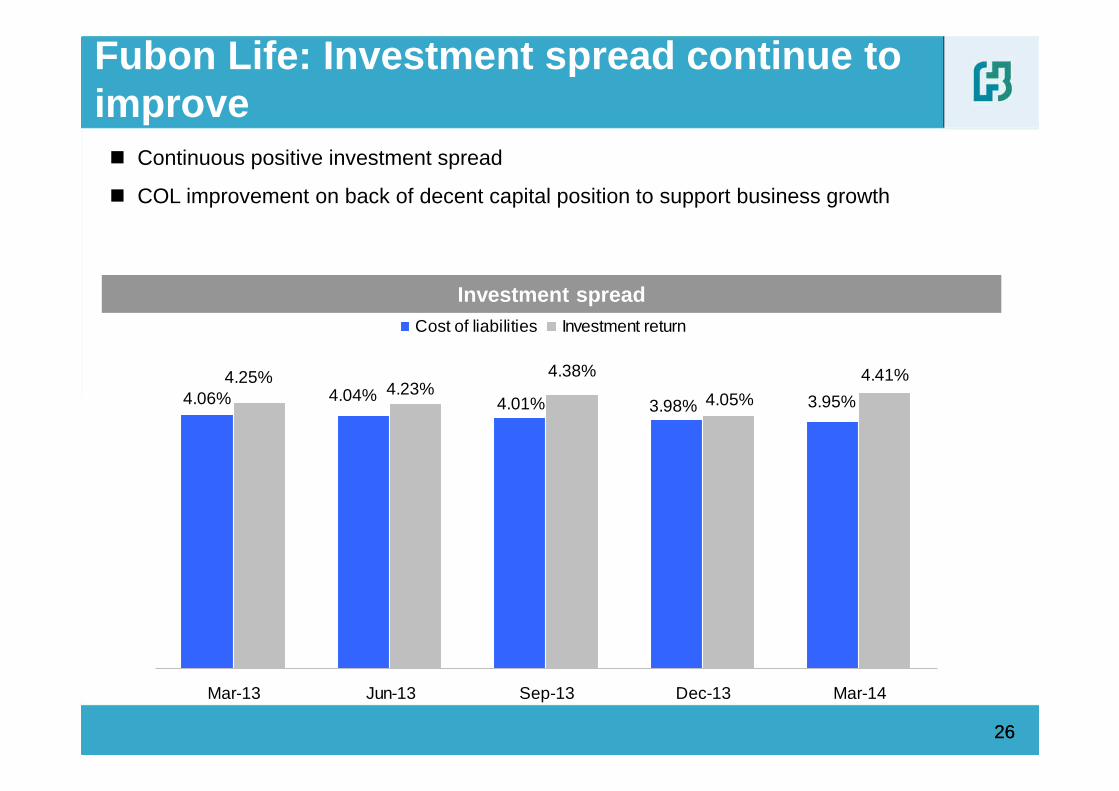
Fubon Life: Investment spread continue to improve
Investment spread
� Continuous positive investment spread
� COL improvement on back of decent capital position to support business growth
4.06% 3.95%3.98%4.01%4.04%4.41%
4.05%
4.38%4.23%
4.25%
Mar-13 Jun-13 Sep-13 Dec-13 Mar-14
Cost of liabilities Investment return

64.4
42.8
29.238.1
55.7
Mar-13 Jun-13 Sep-13 Dec-13 Mar-14
2727
Fubon Life: Track record in investment
� Recovery in unrealized gains support the growth of book value in Fubon Life
Unrealized gains under shareholder equity
Net worth of Fubon Life
NT$bn
160.1142.3 136.1
147.8171.3
Mar-13 Jun-13 Sep-13 Dec-13 Mar-14
NT$bn

28
� Performance review by subsidiary
• Fubon Life
• Fubon Securities
� Performance highlights of Fubon Financial Holdings
• Fubon Insurance
Agenda
• Taipei Fubon Bank
• Fubon Bank (China)
� 2013 Embedded Value of Fubon Life

51.2% 52.6%
33.3%33.7%
1Q13 1Q14
Net Claim ratio Net Expense ratio
29
Fubon Insurance: Operating snapshot
Direct written premium by product Net combined ratio
29
NT$bn6.7
6.9
84.5% 86.3%
� Top 1 market position with 21% market share
� Underwriting performance remains outstanding
Note: Standalone basis Note: Exclusive of auto compulsory line given those claims are reimbursed.
3.3 3.5
1.01.1
0.50.40.3 0.2
0.9 1.0
0.60.7
1Q13 1Q14
Auto Fire Marine Engineering Health/Injury Others

30
� Performance review by subsidiary
• Fubon Life
• Fubon Securities
� Performance highlights of Fubon Financial Holdings
• Fubon Insurance
Agenda
• Taipei Fubon Bank
• First Sino Bank
� 2013 Embedded Value of Fubon Life

31
Fubon Securities: Earnings growth
Revenue mix in 1Q14Net profits
Market share & Market turnover
242
550
1Q13 1Q14
Brokerage commissions,
46%
Net interest income, 13%
Fee income, 3%
Net principal transactions,
31%
Net financial products
gains, -3%
Other income, 10%
5.58% 6.06%
95.6
132.7
Mar-13 Mar-14
Brokerage market share Market turnover (NT$bn)
NT$m

32
� Performance review by subsidiary
• Fubon Life
• Fubon Securities
� Performance highlights of Fubon Financial Holdings
• Fubon Insurance
Agenda
• Taipei Fubon Bank
• Fubon Bank (China)
� 2013 Embedded Value of Fubon Life

31,031 31,799
2013 Mar-14
33
Fubon Bank (China): Key balance sheet items
Assets
DepositsLoans
Net worth
49,401 50,513
2013 Mar-14
44,070
40,225
2013 Mar-14
3,062
4,178
2013 Mar-14
RMB$m

34
Fubon Bank (China): Financial highlight
ROAA & ROAE
Loan to deposit spreadNet Profits
NPL ratio & Coverage ratio
3.73%
2.97%
2013 1Q14
RMB$m277
99
2013 1Q14
Note: ROAA and ROAE are annualized basis
0.59%0.79%
9.39%
10.92%
2013 1Q14
ROAA ROAE
0.86%1.24%
290.5%
201.2%
2013 Mar-14
NPL ratio Coverage ratio

35
� Performance review by subsidiary
• Fubon Life
• Fubon Securities
� Performance highlights of Fubon Financial Holdings
• Fubon Insurance
Agenda
• Taipei Fubon Bank
• Fubon Bank (China)
� 2013 Embedded Value of Fubon Life

Value Creation Summary
Items 2012 2013 YoY Diff Impact
Net Worth (Book Value) 165.6 147.8 -10.8% -17.9
Adjusted Net Worth 101.1 133.8 32.4% 32.7
VIF (before CoC) 175.1 229.9 31.3% 54.8
Cost of Capital (CoC) (58.4) (68.0) -16.5% -9.6
VIF (After CoC) 116.8 161.9 38.7% 45.1
Embedded Value 217.9 295.7 35.7% 77.9
FYP 249.7 212.9 -14.8% -36.9
FYPE 68.6 54.2 -21.1% -14.5
APE 71.7 54.5 -24.0% -17.2
VNB 31.7 31.8 0.3% 0.1
VNB margin (VNB/FYP) 12.7% 15.0% 17.7% 2.2%
VNB margin (VNB/FYPE) 46.2% 58.8% 27.1% 12.5%
VNB margin (VNB/APE) 44.2% 58.4% 32.0% 14.2%
Multiplier 8.84 8.84 0.0% 0.0
Appraisal Value 498.4 577.2 15.8% 78.7
Outstanding shares (FHC) 9.5 10.2 7.3% 0.7
Embedded Value 22.8 28.9 26.5% 6.0
Appraisal Value 52.3 56.4 7.9% 4.1
Value per FHCshare
InforceValue Creation
New SalesValue Creation
Appraisal Value (20 year NB)
NT$bn
36
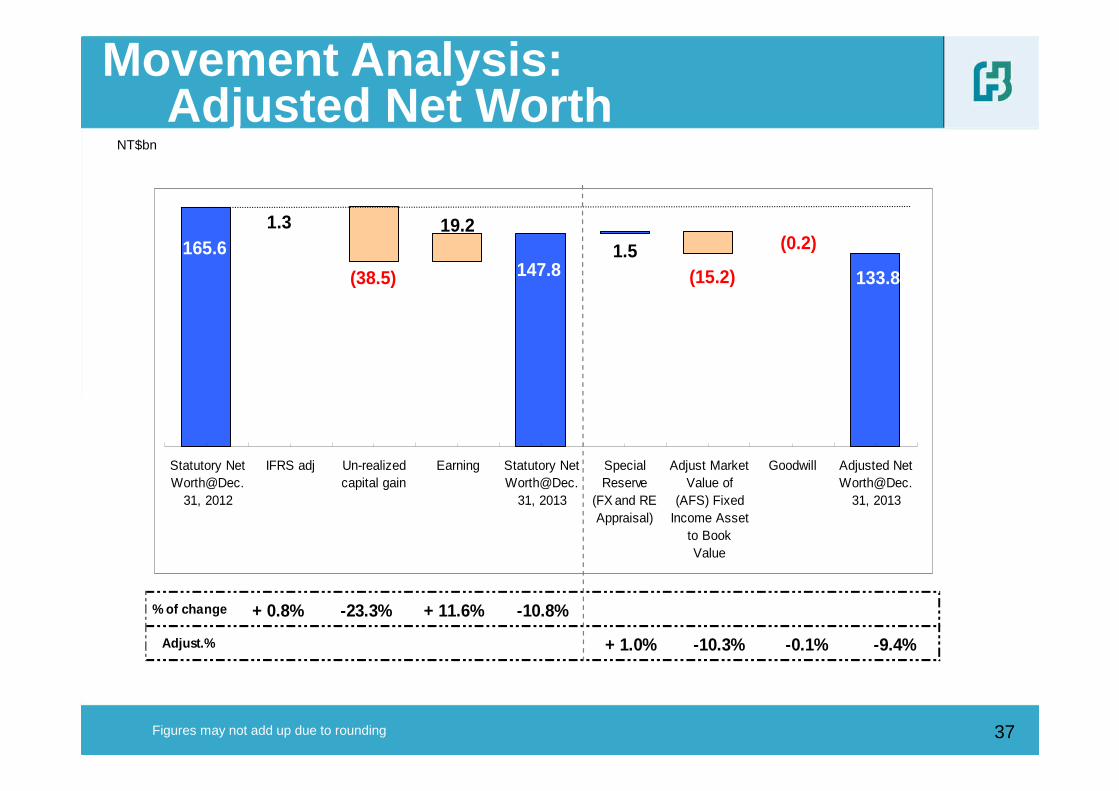
Movement Analysis: Adjusted Net Worth
% of change + 0.8% -23.3% + 11.6% -10.8%
Adjust.% + 1.0% -10.3% -0.1% -9.4%
(38.5) (15.2) 133.8
(0.2)1.5165.61.3 19.2
147.8
- 40.0
10.0
60.0
110.0
160.0
Statutory NetWorth@Dec.
31, 2012
IFRS adj Un-realizedcapital gain
Earning Statutory NetWorth@Dec.
31, 2013
SpecialReserve
(FX and REAppraisal)
Adjust MarketValue of
(AFS) FixedIncome Asset
to BookValue
Goodwill Adjusted NetWorth@Dec.
31, 2013
Figures may not add up due to rounding
NT$bn
37
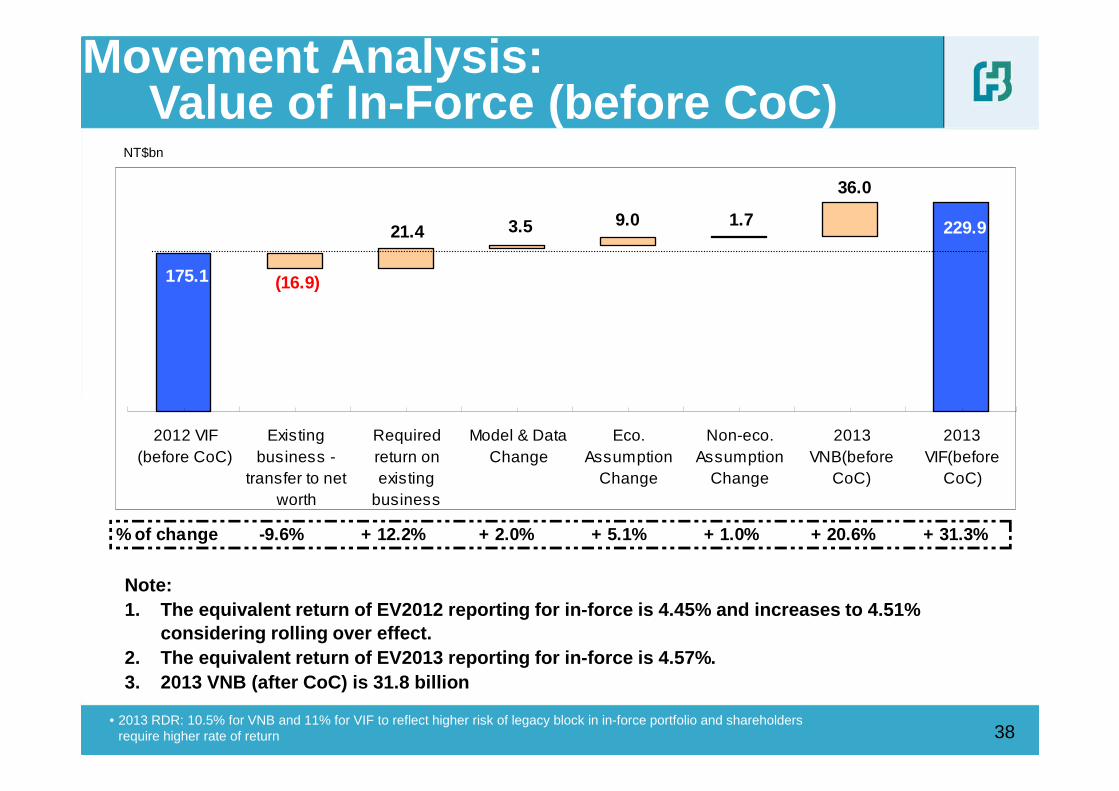
Movement Analysis:Value of In-Force (before CoC)
• 2013 RDR: 10.5% for VNB and 11% for VIF to reflect higher risk of legacy block in in-force portfolio and shareholders require higher rate of return
Note:1. The equivalent return of EV2012 reporting for in- force is 4.45% and increases to 4.51%
considering rolling over effect.2. The equivalent return of EV2013 reporting for in- force is 4.57%.3. 2013 VNB (after CoC) is 31.8 billion
% of change -9.6% + 12.2% + 2.0% + 5.1% + 1.0% + 20.6% + 3 1.3%
229.9
36.0
1.79.03.521.4
175.1 (16.9)
- 2 0 .0
3 0 .0
8 0 .0
1 3 0 .0
1 8 0 .0
2 3 0 .0
2012 VIF(before CoC)
Existingbusiness -
transfer to networth
Requiredreturn onexisting
business
Model & DataChange
Eco.Assumption
Change
Non-eco.Assumption
Change
2013VNB(before
CoC)
2013VIF(before
CoC)
NT$bn
38

Movement Analysis: Value of New Business
• 2013 Risk Discount Rate: 10.5% for VNB
% of change -24.0% + 7.9% + 12.6% + 3.8% + 0.3%
VNB/APE 44.2% 0.0% + 4.6% + 7.3% + 2.2% 58.4%
31.7
1.2
(7.6)
2.5
4.0
31.8
- 8.0
- 6.0
- 4.0
- 2.0
0.0
2.0
4.0
6.0
8.0
10.0
12.0
14.0
16.0
18.0
20.0
22.0
24.0
26.0
28.0
30.0
32.0
34.0
36.0
38.0
40.0
2012 VNB Sales Volume Product Mix Econ. Change Non-Econ. Change 2013 VNB
Note:1. The equivalent return of EV2012 reporting for NB is 4.41% and changes to 4.23%
considering rolling over effect and reflecting 2013 sales portfolio.2. The equivalent return of EV2013 reporting for NB is 4.50%.
NT$bn
39

Economic Assumption
Note:• The FX reserve mechanism stipulated from 2012, its respective cost is reflected in the derivation of
portfolio return.
Year 2012 Year 2013
Investment return
VIF
NTD Traditional Policies:
Year 2013 to Year 2051 at 3.88%~5.32%(2052+)
USD Policies :
Year 2013 to Year 2017 at 5.16%~5.18%(2018+)
V1NB
NTD Traditional Policies :
Year 2013 to Year 2051 at 3.39%~5.32%(2052+)
USD Policies :
Year 2013 to Year 2020 at 4.83%~5.18%(2021+)
ISAAverage retained spread for the Interest sensitive business is around 100bps.
VIF
NTD Traditional Policies :
Year 2014 to Year 2051 at 3.94%~5.32%(2052+)
USD Policies :
Year 2014 to Year 2036 at 5.16%~5.94%(2037+)
V1NB
NTD Traditional Policies :
Year 2014 to Year 2048 at 3.74%~5.32%(2049+)
USD Policies :
Year 2014 to Year 2032 at 5.14%~5.94%(2033+)
ISAAverage retained spread for the Interest sensitive business is around 100bps.
Risk Discount Rate 11% for VIF; 10.5% for V1NB 11% for VIF; 10.5% for V1NB
Equivalent ReturnVIF : 4.45% (rolling over to 2013: 4.51%)
V1NB: 4.41% (rolling over to 2013: 4.23%)
VIF: 4.57%
V1NB: 4.50 %
YC (10 year)
Initial / ultimate
TWD: 1.29% / 3.50%
USD : 1.84% / 5.25%
TWD: 1.72% / 3.50%
USD : 3.09% / 5.25%
40

Economic Assumption: VIF Portfolio Return
41

Economic Assumption: V1NB Portfolio Return
42

Economic Assumption: Discount Rate
Fubon Life 2012/12/31 2013/12/31
Risk Free Rate 1.29%~3.5% 1.72%~3.5%
Equity plus Country Risk Premium 7.00% 6.50%
Beta 1.2 1.2
Calculated RDR 9.7%~11.9% 9.5%~11.3%
RDR used in the valuationVIF:11%
VNB:10.5%
VIF:11%
VNB:10.5%
• RDR: According to CAPM (Capital Asset Pricing Model);RDR = Risk Free Rate + Beta * Equity and Country Premium.RDR used for 2013 VIF calculation is 11% and 10.5% for 2013 V1NB calculation.
43

Cost of Capital
Cost of Capital projection� Project future cost of capital is based on future c apital
requirement maintaining regulatory minimum RBC leve l of 200% considering following factors:
1) K factor:0.50 from 2013 in line with current RBC regulation;2) Add 10% C3 risk capital of previous year for all traditional products
every year (excludes investment-linked product);3) Reflect current business operation and future strategy.
� Risk-based capital (RBC) regulation changes & adjus tments in 2013:
1) Modification of concentration risk calculation basis by dividing total overseas investment into six subgroups.
2) Re-classification of C1s by including equity-type funds3) Revision of extension period calculation basis of naked real estate
for risk capital calculation.
44

Sensitivity Summary:Portfolio Return
Note: ANW will not be affected by portfolio return
-17.5% 17.5% -26.6% 26.6%
-14.6% 14.6% -13.6% 13.6%
(40.2)
229.9
40.2
Return - 0.25% Base Return + 0.25%
43.1(43.1)
295.7
Return - 0.25% Base Return + 0.25%
43.1
161.9
(43.1)
Return - 0.25% Base Return + 0.25%
4.3
(4.3)
31.8
Return - 0.25% Base Return + 0.25%
VIF (before CoC) VIF
EV VNB
NT$bn
45

8.2% -6.9% 14.3% -12.0%
7.8% -6.6% 13.9% -11.8%
18.8
229.9
(15.8)
RDR - 1% Base RDR + 1%
23.1
295.7
(19.4)
RDR - 1% Base RDR + 1%
(19.4)
161.9
23.1
RDR - 1% Base RDR + 1%
31.84.4
(3.8)
RDR - 1% Base RDR + 1%
Note: ANW will not be affected by RDR
VIF (before CoC) VIF
EV VNB
Sensitivity Summary: Risk Discount Rate
NT$bn
46

7.2%
8.7%8.0%
12.7%12.6%
15.0%
EV2008 EV2009 EV2010 EV2011 EV2012 EV2013
CAGR: 16% (2.1x)
11.8
17.9
24.828.0
31.831.7
EV2008 EV2009 EV2010 EV2011 EV2012 EV2013
CAGR: 22% (2.7x)
38.552.5
73.688.7
116.8
161.9
EV2008 EV2009 EV2010 EV2011 EV2012 EV2013
CAGR: 33% (4.2x)
77.7
128.8155.5
176.0
217.9
295.7
EV2008 EV2009 EV2010 EV2011 EV2012 EV2013
CAGR: 31% (3.8x)
Value of New Business
Value of In-force
VNB as % of FYP
Embedded Value
2013 Summary: Track record of Fubon Life’s Value Creation
NT$bn
47

Investment Return:Assumption vs. Actual
3.683.87 3.88
3.974.06
3.78 3.80
4.01 4.05
EV2009 EV2010 EV2011 EV2012 EV2013
Assumption Actual
48

4949
Independent Review by Deloitte Actuarial
The Engagement• Deloitte Actuarial and Insurance Solutions (Hong Kong) Limited (“Deloitte Actuarial”) were retained by Fubon
Life to perform an independent review of the Embedded Value (EV) as at 31 December 2013 and the Valueof One Year’s New Business (V1NB) written over the period of 1 January 2013 to 31 December 2013.
Scope of Deloitte Actuarial’s Involvement• Review and opine on the reasonableness of the EV and V1NB as calculated by the Company;
• Review of the reasonableness of the assumptions used in the calculations, taking into consideration both theCompany’s recent experience and the experience of the Taiwanese life insurance market;
• Review, at a high-level, model changes to the actuarial projection model since the previous valuation date;• Review of the Company’s projection approach of the Cost of Capital;• Review of the data put through the model compared to the policy data on the Company’s policy
administration systems to judge the extent to which the business has been valued in the financial model and to identify the portion (if any) omitted and how that was valued;
• Review of the approach used to determine the Adjusted Net Worth (“ANW”), in particular, the adjustments made in deriving the ANW, and any other adjustments made outside of the actuarial projection model;
• Review of the Company's analysis of change in the Value of In-Force Business (“VIF”) between 31 December 2012 and 31 December 2013.
Deloitte Actuarial

5050
Risk Adjusted Discount RatesFubon Life calculated the EV and V1NB at Risk Adjusted Discount Rates (“RDR”) of 11.0% and 10.5% respectively.
RFR based on current government
bond yield
RFR based on Company’s long-
term view
Equivalent RFR for New Business
Equivalent RFR for In-Force Business
Risk Free Rate (“RFR”) 1.72% 3.50% 2.66% 2.78%
Equity and Country Risk Premium 6.50% 6.50% 6.50% 6.50%
Beta 1.20 1.20 1.20 1.20
Calculated Risk Discount Rate 9.52% 11.30% 10.46% 10.58%
Risk Discount Rate used in the Valuation for VIF 11.00%
Risk Discount Rate used in the Valuation for V1NB 10.50%
Reference – RDR based on Capital Asset Pricing Model (CAPM):
RDR = RFR + Beta * Equity and Country Risk Premium

5151
Comments on the Risk Adjusted Discount Rates
Deloitte Actuarial independently derived a range of RDRs using the CAPM approach:
� The low end of the RDR is developed based on the current yield on 10-year Taiwan government bonds.
� The high end of the RDR is developed based on the Company’s view of the 10-year Taiwan government bond in the future.
� The equivalent RFR is the RFR equivalent to using a set of graded-up RFR from 1.72% to 3.50% that derives the same VIF and V1NB.
� The Equity and Country Risk Premium was developed based on the Country Default Spreads and Risk Premiums research published by New York University.
� The Beta of 1.2 was set using a risk profiling approach which considers risks related to the product range, distribution diversification/vulnerability, regulatory intervention and investments. Note that this beta value is consistent with that used in previous valuations.
� The RDR assumption applied by Fubon Life in the valuation lies within the range of RDR that we derived.
� In particular, we feel comfortable with different RDRs being used for the valuation of the in-force and new business, given the specific market conditions in Taiwan: it is well-known that the legacy business has a much riskier profile than the current new business, and hence it is reasonable for shareholders to be expecting a higher rate of return for the higher risk level. We feel that Fubon Life has taken a good approach in splitting up the RDR assumption for the two distinctively different blocks of business.
Deloitte Actuarial

5252
Comments on Investment Return (1)
A set of rising investment return assumption has been used in this valuation which is considered reasonable for the present market conditions.
Deloitte Actuarial
Fubon Life’s derivation of the investment return assumption is featured by the following:• Derivation methodology is consistent with that applied in previous valuations;• The methodology involves:
� For VIF, the investment return assumption was derived from a combination of the investmentreturn generated by the run-off of the existing asset portfolio and of that from future purchasesof new assets;
� For V1NB, the new business is not supported by returns on existing assets and theinvestment return was derived from future purchases of new assets;
• New assets are purchased at the prevailing new money rates, which are set to equal to the expectedfuture risk free rates plus a risk margin for each asset type;
• Future risk free rates are set starting off with the actual yield curves as at the valuation date and areassumed to rise to a long-term level over a 10-year period. For New Taiwan Dollar and US Dollarrespectively, the initial risk free rates are 1.72% and 3.09% and a long-term risk free rate of 3.50%and 5.25% is assumed.
• Different assumptions were derived for different types of business, which were assumed to have adifferent long-term asset allocation.
• For some business lines, the investment return assumption derived in the above-mentioned mannerwas capped at a certain level for conservative reasons.

5353
Comments on Investment Return (2)
It is in Deloitte Actuarial’s view that:
Methodology• Fubon Life’s derivation methodology for the investment return assumption is reasonable and
consistent with the way that the ANW is calculated;Economic Assumptions
• The expected long-term risk-free rate for New Taiwan Dollar yield and US Dollar yield aremaintained at 3.5% and 5.25% respectively.
• We note that taking a view on the future capital market is not uncommon under the traditionalEmbedded Value methodology. On a macro-economic level the arguments put forward forrising interest rates are plausible, and we note that the expected future rise in yields is spreadout over a reasonably long period of 10 years.
• Readers should be aware that capital market conditions are subject to the impact of manyforces. Yields and prices of financial instruments can move dramatically in a short period oftime. As a result, it is difficult to predict the interest rate level in the future with great certainty.Readers should refer to the sensitivity tests to develop a broader understanding of the impact ofthe investment return assumption on the assessment of the economic value of Fubon Life.
• Overall, the economic assumptions appear to be reasonable.
Deloitte Actuarial

5454
Comments on EV and V1NB ResultsDeloitte Actuarial
Deloitte Actuarial have reviewed the Embedded Value and Val ue of OneYear’s New Business results at a high-level under the genera lly acceptedmethod for calculating traditional embedded values in Taiw an:
•Review of the changes in the VIF relative to the assumption changes and modelchanges from 2012 to 2013;
•Review of the changes in the new business profit margin relative to that in 2012 basedon information on changes in sales mix, sales volume and valuation assumptions;
•Review of the sensitivities relative to the base case results.
The Embedded Value and Value of One Year’s New Business resul tsappear to be reasonable within the above context.Deloitte Actuarial’s detailed opinion can be found in their opinion letter.

5555
Comments on Non-Economic Assumptions
Non-Economic Assumptions• The non-economic assumptions reflect Fubon Life’s best estimate of future operating
experience, and are appropriately supported by the company’s historical operating experience.
Deloitte Actuarial

Thank you

Fubon Financial - Financial summary
NT$ millions, except for percentages 2012 2013 YoY 1Q13 2Q13 3Q13 4Q13 1Q14
Income Statement DataNet interest income 65,891 73,264 11.2% 17,325 17,382 18,808 19,749 21,794Insurance income 281,320 266,318 -5.3% 59,369 66,009 71,720 69,220 61,087Net gains (losses) on FX and financial assets 26,293 37,776 43.7% 10,289 10,628 12,302 4,557 13,949Others (4,471) (3,237) -27.6% (884) (984) (1,129) (240) 553Net revenue 369,033 374,121 1.4% 86,099 93,035 101,702 93,285 97,382Bad debt expense and reserve for guarantee (512) 4,083 N.M (190) 116 3,890 267 (13)Net change in insurance reserve (292,919) (288,362) -1.6% (63,848) (72,192) (77,583) (74,739) (69,112)Operating expense (43,129) (43,443) 0.7% (10,143) (10,351) (10,526) (12,423) (11,447)Income before tax 33,497 38,233 14.1% 12,297 10,377 9,703 5,856 16,836Net income 29,149 32,659 12.0% 10,146 7,753 8,965 5,795 13,935Net income to parent company 29,149 32,709 12.2% 10,146 7,753 8,980 5,830 13,866
Balance Sheet DataTotal assets 4,105,866 4,570,547 11.3% 4,236,602 4,318,841 4,416,672 4,570,547 5,014,513 Equity attributable to parent company 306,429 316,458 3.3% 305,475 283,046 301,708 316,458 348,073 Outstanding shares (million shares) 9,527 10,234 7.4% 9,535 9,535 10,234 10,234 10,234
Key MetricsReturn on average assets 0.75% 0.75% 0.97% 0.74% 0.84% 0.53% 1.16%Return on average equity 10.71% 10.50% 13.27% 10.52% 11.81% 7.49% 16.69%Equity / assets 7.46% 6.93% 7.21% 6.55% 6.84% 6.93% 7.09%Double leverage 108.87% 108.84% 111.18% 115.43% 106.28% 108.84% 111.47%Capital adequacy ratio 143.51% 144.20% 130.08% 144.20%Cash dividend per share 1.00 1.00
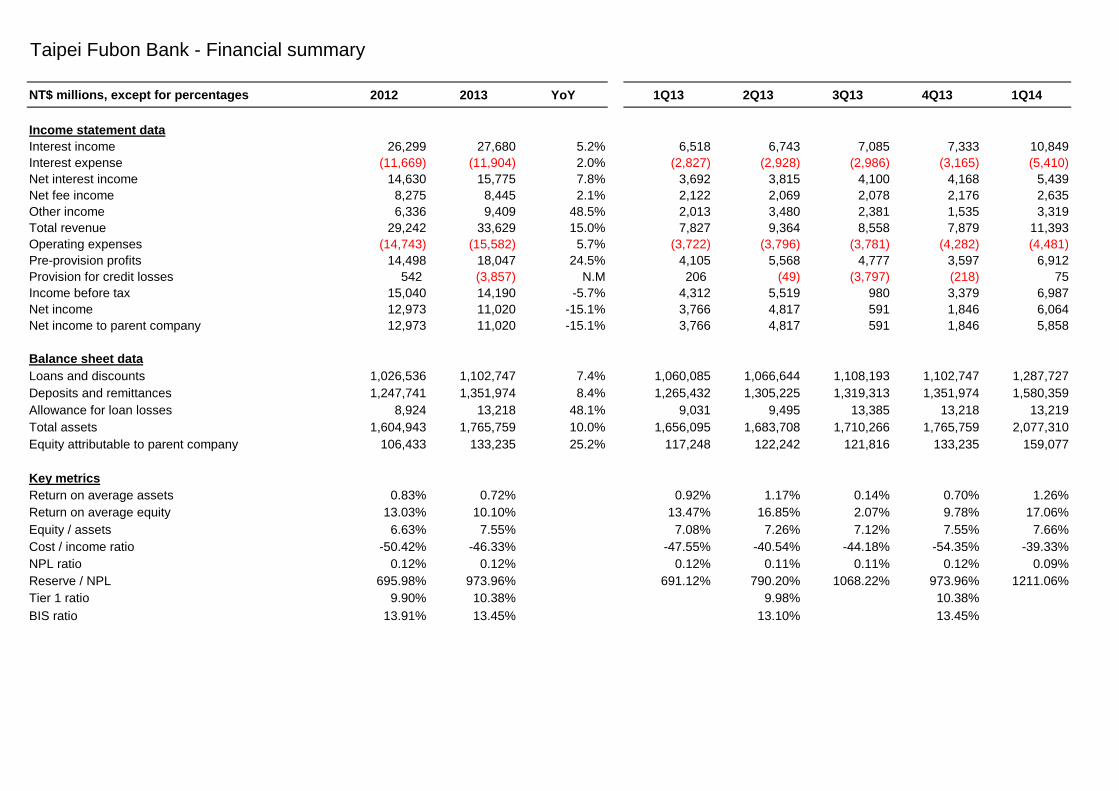
Taipei Fubon Bank - Financial summary
NT$ millions, except for percentages 2012 2013 YoY 1Q13 2Q13 3Q13 4Q13 1Q14
Income statement dataInterest income 26,299 27,680 5.2% 6,518 6,743 7,085 7,333 10,849Interest expense (11,669) (11,904) 2.0% (2,827) (2,928) (2,986) (3,165) (5,410)Net interest income 14,630 15,775 7.8% 3,692 3,815 4,100 4,168 5,439Net fee income 8,275 8,445 2.1% 2,122 2,069 2,078 2,176 2,635Other income 6,336 9,409 48.5% 2,013 3,480 2,381 1,535 3,319Total revenue 29,242 33,629 15.0% 7,827 9,364 8,558 7,879 11,393Operating expenses (14,743) (15,582) 5.7% (3,722) (3,796) (3,781) (4,282) (4,481)Pre-provision profits 14,498 18,047 24.5% 4,105 5,568 4,777 3,597 6,912Provision for credit losses 542 (3,857) N.M 206 (49) (3,797) (218) 75Income before tax 15,040 14,190 -5.7% 4,312 5,519 980 3,379 6,987Net income 12,973 11,020 -15.1% 3,766 4,817 591 1,846 6,064Net income to parent company 12,973 11,020 -15.1% 3,766 4,817 591 1,846 5,858
Balance sheet dataLoans and discounts 1,026,536 1,102,747 7.4% 1,060,085 1,066,644 1,108,193 1,102,747 1,287,727Deposits and remittances 1,247,741 1,351,974 8.4% 1,265,432 1,305,225 1,319,313 1,351,974 1,580,359Allowance for loan losses 8,924 13,218 48.1% 9,031 9,495 13,385 13,218 13,219Total assets 1,604,943 1,765,759 10.0% 1,656,095 1,683,708 1,710,266 1,765,759 2,077,310Equity attributable to parent company 106,433 133,235 25.2% 117,248 122,242 121,816 133,235 159,077
Key metricsReturn on average assets 0.83% 0.72% 0.92% 1.17% 0.14% 0.70% 1.26%Return on average equity 13.03% 10.10% 13.47% 16.85% 2.07% 9.78% 17.06%Equity / assets 6.63% 7.55% 7.08% 7.26% 7.12% 7.55% 7.66%Cost / income ratio -50.42% -46.33% -47.55% -40.54% -44.18% -54.35% -39.33%NPL ratio 0.12% 0.12% 0.12% 0.11% 0.11% 0.12% 0.09%Reserve / NPL 695.98% 973.96% 691.12% 790.20% 1068.22% 973.96% 1211.06%Tier 1 ratio 9.90% 10.38% 9.98% 10.38%BIS ratio 13.91% 13.45% 13.10% 13.45%

Fubon Securities - Financial summary
NT$ millions, except for percentages 2012 2013 YoY 1Q13 2Q13 3Q13 4Q13 1Q14
Income statement dataBrokerage commissions 2,680 2,537 -5.3% 571 635 643 689 759Net interest income 881 827 -6.1% 190 214 209 214 223Fee income 390 271 -30.5% 61 52 74 84 50Net principal transactions 211 806 282.2% 212 70 217 308 522Net financial products gains 376 66 -82.4% 50 89 15 -88 -57Other income 1,037 1,116 7.6% 171 177 588 181 168Total operating revenue 5,575 5,624 0.9% 1,254 1,237 1,745 1,388 1,665Total operating expense (4,973) (4,774) -4.0% (1,135) (1,196) (1,157) (1,285) (1,196)Net non-operating income / (expenses) 590 569 -3.6% 140 125 157 147 128 Income before tax 1,178 1,414 20.0% 259 165 741 249 597 Net income 1,073 1,349 25.7% 242 134 754 219 550 Net income to parent company 1,073 1,349 25.7% 242 134 754 219 550
Balance sheet dataMargin loans 12,739 14,581 14.5% 13,150 13,754 13,664 14,581 15,718 Total assets 55,442 57,347 3.4% 51,162 53,174 56,333 57,347 57,704 Equity attributable to parent company 29,678 30,088 1.4% 29,817 29,964 30,089 30,088 30,602
Key metricsReturn on average assets 1.91% 2.39% 1.82% 0.99% 5.40% 1.55% 3.82%Return on average equity 3.46% 4.51% 3.25% 1.80% 10.09% 2.93% 7.25%Equity / assets 53.5% 52.5% 58.3% 56.4% 53.4% 52.5% 53.03%Expenses / revenues -89.2% -84.9% -90.5% -96.7% -66.3% -92.6% -71.83%Margin loans / total assets 23.0% 25.4% 25.7% 25.9% 24.3% 25.4% 27.24%Margin loans / shareholders' equity 42.9% 48.5% 44.1% 45.9% 45.4% 48.5% 51.36%

Fubon Bank (China) - Financial Summary
RMB millions, except for percentages 2012 2013 YoY 1Q14
Income Statement DataInterest income 2,126 2,243 5.5% 606Interest expense (1,395) (1,361) -2.5% (433)Net interest income 731 882 20.7% 173Net fee income 260 157 -39.7% 17Other income (50) (40) -21.3% 25Operating expenses (306) (322) 5.3% (72)Pre-provision profits 635 677 6.7% 143Provision for credit losses (143) (337) 135.1% (19)Income before tax 491 341 -30.7% 124Net income 388 277 -28.7% 99
Balance Sheet DataLoans 27,386 31,031 13.3% 31,799 Deposits 40,932 44,070 7.7% 40,225 Total assets 44,702 49,401 10.5% 50,513 Total equity 2,838 3,062 7.9% 4,178
Key metricsReturn on average assets 0.91% 0.59% 0.79%Return on average equity 14.66% 9.39% 10.92%Equity / assets 6.35% 6.20% 8.27%Cost / income ratio 29.43% 28.99% 30.19%NPL ratio 0.28% 0.86% 1.24%Reserve / NPL 563.40% 290.53% 201.22%Loan to deposit ratio 70.68% 71.07% 73.58%Tier 1 ratio 12.48% 11.02% 15.64%BIS ratio 12.48% 12.16% 16.78%

Fubon Life - Financial summary
Income statement dataFirst year premium 249,507 212,818 -15% 35,049 54,101 53,635 70,033 56,140Retained earned premium 392,307 386,587 -1% 79,872 92,214 102,796 111,705 103,469Total investment income 68,641 80,238 17% 19,845 20,110 23,525 16,759 24,231 Recurring investment income 62,669 74,417 19% 14,750 16,326 25,647 17,694 18,171 Other investment income 5,972 5,821 -3% 5,094 3,784 (2,122) (936) 6,060 Realized gains (losses) from fixed income 7,886 7,984 1% 2,297 5,241 241 205 1,635 Realized gains (losses) from equity 4,468 3,775 -16% 3,333 341 (558) 659 5,739 FX and others (6,382) (5,938) -7% (536) (1,797) (1,805) (1,799) (1,314)Other income 2,343 2,868 22% 896 773 676 523 547Total operating revenue 463,291 469,693 1% 100,613 113,097 126,997 128,986 128,247Retained claim payment 115,187 126,814 10% 22,162 27,978 33,138 43,535 44,552Net commission expense 24,121 21,744 -10% 5,192 5,285 5,456 5,811 5,355Net change in insurance liability 295,058 288,276 -2% 63,596 72,699 77,628 74,352 67,741General and administrative expense 13,304 12,222 -8% 2,767 3,003 3,200 3,252 3,054Other expenses 1,960 897 -54% 207 231 220 239 226Total operating costs and expenses 449,630 449,951 0% 93,924 109,196 119,642 127,189 120,928Net non-operating income / (expenses) 328 476 45% 81 63 184 148 72Income before tax 13,989 20,218 45% 6,769 3,963 7,540 1,945 7,390Net income 12,895 19,150 49% 5,427 3,719 7,456 2,548 5,794Net income to parent company 12,895 19,150 49% 5,427 3,719 7,456 2,548 5,794
Balance sheet dataTotal assets 2,158,813 2,412,115 12% 2,214,569 2,262,762 2,318,323 2,412,115 2,524,659Total assets (general account) 2,011,132 2,270,357 13% 2,063,483 2,124,028 2,176,200 2,270,357 2,380,576Insurance liabilities 1,695,726 1,986,309 17% 1,764,847 1,835,722 1,910,582 1,986,309 2,059,626Total liabilities 1,991,904 2,264,326 14% 2,054,429 2,120,479 2,182,187 2,264,326 2,353,394Total liabilities (general account) 1,844,223 2,122,568 15% 1,903,343 1,981,745 2,040,064 2,122,568 2,209,311Equity attributable to parent company 166,909 147,789 -11% 160,140 142,283 136,135 147,789 171,265
Key matricesReturn on average assets 0.65% 0.84% 0.99% 0.67% 1.33% 0.45% 0.94%Return on average equity 9.65% 12.17% 13.27% 9.62% 19.68% 6.48% 14.53%Equity / Assets 7.73% 6.13% 7.23% 6.29% 5.87% 6.13% 6.78%Claims and benefits ratio 29.36% 32.80% 27.75% 30.34% 32.24% 38.97% 43.06%Expense ratio 3.39% 3.16% 3.46% 3.26% 3.11% 2.91% 2.95%Persistency ratio - 13th month 95.80% 94.40% 93.30% 92.50% 92.50% 94.40% 95.42%Persistency ratio - 25th month 87.28% 91.17% 89.56% 90.57% 91.38% 91.17% 88.18%
NT$ millions, except for percentages 2012 2013 1Q142Q13 3Q13 4Q13yoy 1Q13

Fubon Insurance - Financial summary
Income statement dataDirect written premiums 27,559 29,448 6.9% 7,064 8,377 6,857 7,150 7,541Retention of earned premiums 19,556 22,152 13.3% 5,241 5,436 5,746 5,729 5,824Net income from investment 2,310 2,299 -0.5% 584 421 968 326 555Other operating revenue 916 877 -4.2% 248 217 194 218 234Retained insurance payments 10,886 11,517 5.8% 2,764 2,784 3,031 2,938 2,909Net change in liability reserve (804) 731 -191.0% 80 92 338 222 275Commission and operating expenses 9,242 9,975 7.9% 2,265 2,570 2,400 2,740 2,505Non-Operating Income (72) (67) -7.0% (23) (3) (25) (16) (29)Income before tax 3,386 3,038 -10.3% 942 624 1,115 357 895Net income 2,864 2,495 -12.9% 793 523 939 240 765Net income to parent company 3,056 2,827 -7.5% 842 635 1,004 347 809
Balance sheet dataTotal assets 71,712 72,534 1.1% 71,444 72,785 72,361 72,534 71,402Investment assets 50,050 52,679 5.3% 51,023 50,570 52,019 52,679 51,287Policy reserve 39,267 40,586 3.4% 38,906 40,424 40,509 40,586 41,108Equity attributable to parent company 21,732 22,861 5.2% 22,621 22,047 22,494 22,861 21,150
Summary ratiosReturn on average assets 4.06% 3.46% 4.43% 2.90% 5.21% 1.33% 4.25%Return on average equity 13.60% 12.68% 15.19% 11.60% 18.16% 6.22% 14.71%Total investment return 4.71% 4.48% 4.62% 3.99% 5.15% 4.48% 4.27%Solvency margin (NWP/equity) 95.73% 101.17% 98.92% 112.56% 97.61% 102.21% 114.39%Retention ratio 72.49% 75.36% 75.80% 71.26% 76.78% 78.37% 76.84%
2Q13 3Q13 4Q13 1Q14NT$ millions, except for percentages 2012 2013 yoy 1Q13