“fuel cell material handling: u.s. - uk hfca · fuel cell material handling: u.s. success and...
TRANSCRIPT

Celia Greaves +44 (0) 1206 241360
Webinar 27th November, 2013
“Fuel Cell Material Handling: U.S. success and European growth”
Representing the UK Hydrogen and Fuel Cell Industry

by enabling
accelerated innovation
access to funding
partnerships
international engagement
cross-sector links
technology deployment
Energy Generation & Supply KTN A dynamic network delivering strategic value
to the UK energy sector
Representing the UK Hydrogen and Fuel Cell Industry

Wave & Tidal
Fuel Cells & Hydrogen Maximising Oil & Gas
Resources
Future & Emerging Opportunities
Offshore Wind
Carbon Abatement Technologies
Large Power Stations
Nuclear
EG&S KTN Priority Areas Representing the UK Hydrogen and Fuel Cell Industry

Benefits of membership
greater awareness of developments in the energy space, particularly the cross-cutting issues
the opportunity to attend regular workshops and networking events,
the opportunity to participate in webinars,
access to reports and other KTN materials,
participation in focus working groups, and
insights into new funding opportunities and key developments across the fuel cell and hydrogen landscape
…over 4,500 members
Membership of the EG&S KTN is free of charge and provides multiple benefits, including:
Representing the UK Hydrogen and Fuel Cell Industry

Events Representing the UK Hydrogen and Fuel Cell Industry
Events: Stimulating access to funding
Fuel cells manufacturing and supply chain Competition – Consortium Building Event, November 2013
Joint TSB and EG&S KTN workshops on “Fuel Cell Manufacturing and Supply Chain”, August / September 2013
Joint TSB, EG&S KTN and RCUK workshop on “Outstanding Business and Research Challenges for Hydrogen”, May 2013
Joint EG&S KTN and EU Energy Focus webinar on the FCH JU 2013 Call, March 2013
Expanding your reach into energy – we can help you:
Find new partners / build new relationships
Gain deeper understanding of challenges and opportunities and how you can respond
Access new funding
Events: Exploring specific themes
Fuel Cell Material Handling: U.S. success and European growth- webinar, November 2013
Power to Gas: New Opportunities - webinar, March 2013
Facilitating on-line collaboration
Focus work groups to support new Calls
On-line sub-groups to provide a focus for specific interests / activities
Private groups to allow sharing and exchange

Representing the UK Hydrogen and Fuel cell industry.
Accelerating the commercialization of fuel cell and hydrogen energy.
Helping fuel cells and hydrogen energy to become a key component of a low carbon economy – reducing greenhouse gases, enhancing energy security and delivering ‘green collar’ jobs.
We cover:
All fuel cell types and applications;
The full fuel cell supply chain (from research into material science through to systems integration and distribution);
Hydrogen production and storage;
Hydrogen infrastructure; and
Other issues around the delivery, storage and use of associated fuels.
UK HFCA
Representing the UK Hydrogen and Fuel Cell Industry

Representing the UK Hydrogen and Fuel Cell Industry Representing the UK Hydrogen and Fuel Cell Industry

Webinar tips
Please type any questions that arise during the presentations in the
chat box. These will be addressed to speakers during the Q&A part of
the webinar.
If you face any technical difficulties please send Nikoleta a private note
via the chat box by choosing her name from the list, give her a call on
07580 945008 or send an e-mail at [email protected].
Please keep your microphones muted throughout the session to avoid
interference.
Representing the UK Hydrogen and Fuel Cell Industry

This event will:
Provide an overview of U.S. and European developments in fuel cell material handling
Explain how DOE support and other activities have helped stimulate the sector
Give a commercial view of recent progress and prospects for further growth, both in the U.S. and Europe
Webinar objectives
Representing the UK Hydrogen and Fuel Cell Industry

Agenda 14.00pm Introduction, Celia Greaves, Energy Generation and Supply KTN
and UK Hydrogen and Fuel Cell Association
14.10pm U.S. DOE funded performance validation of fuel cell material handling deployments and current status, Jennifer Kurtz, National Renewable Energy Laboratory
14.40pm Fuel Cell Material Handling: Commercial progress and prospects for further growth in U.S. and Europe, Warren Brower, Plug Power / HyPulsion
15.10pm Q&A session
15.30pm Close
Representing the UK Hydrogen and Fuel Cell Industry

NREL is a na*onal laboratory of the U.S. Department of Energy, Office of Energy Efficiency and Renewable Energy, operated by the Alliance for Sustainable Energy, LLC.
U.S. DOE Funded Performance Valida7on of Fuel Cell Material Handling Equipment
UK Hydrogen and Fuel Cell Associa7on Webinar
Jennifer Kurtz, Sam Sprik, Todd Ramsden, Genevieve Saur, Chris Ainscough, MaN Post, Mike Peters
November 27, 2013

2
FCMHE Valida7on Overview
• U.S. DOE enabling early fuel cell markets • Na7onal Fuel Cell Technology Evalua7on Center objec7ves
• FCMHE Performance Status

3 | Fuel Cell Technologies Office eere.energy.gov
Enabling Early Markets Deployments help catalyze market penetration and ensure continued technology
utilization growth while providing data and lessons learned.
Leveraging DOE Funds: Government as “catalyst” for market success of emerging technologies.
0
1,000
2,000
3,000
4,000
5,000
6,000
7,000
8,000
9,000
10,000
Cost Share Deployments ~1,600
Additional Purchases without DOE Funding
~9,000
Lift Trucks BU Power
Backup Power
Lift Trucks
DOE cost-shared deployments led to >5X additional purchases and orders.
~9,000 ADDITIONAL FUEL CELL LIFT TRUCKS AND BACKUP POWER UNITS PLANNED OR INSTALLED with NO DOE funding Examples of industry* sectors in DOE ARRA projects
• Telecommunications (e.g. AT&T, PG&E. Sprint, etc.) • Distribution Centers/Warehouses (e.g. FedEx, Genco,
Sysco, Wegmans, Whole Foods, etc.)
*Provided as examples and not intended as endorsement
DOE FCTO Fall 2013 http://www1.eere.energy.gov/hydrogenandfuelcells/presentations.html
4 | Fuel Cell Technologies Office eere.energy.gov
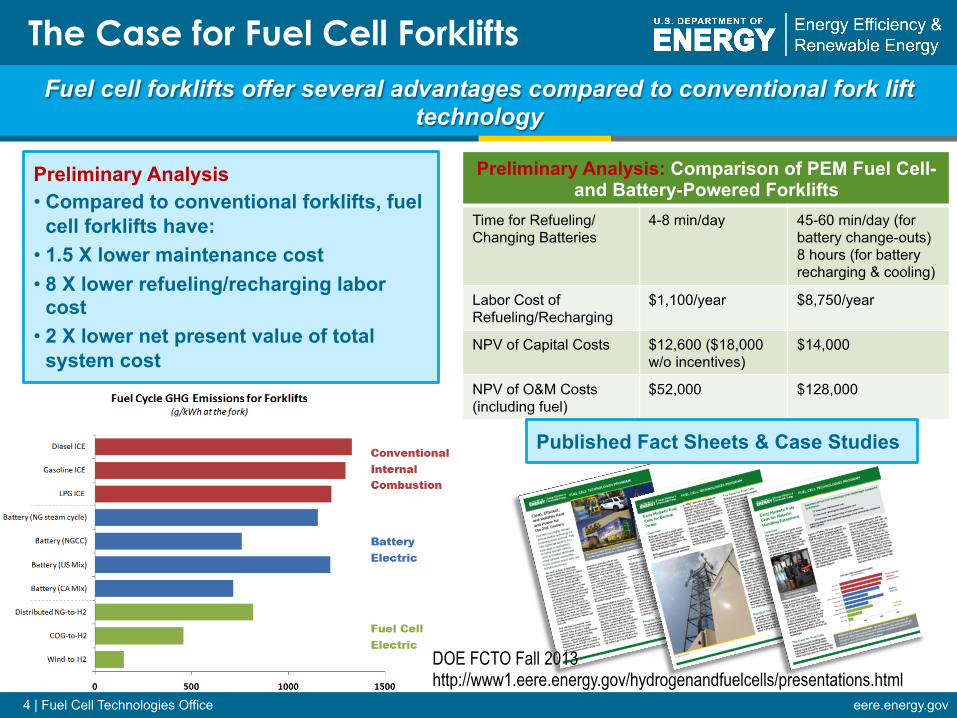
The Case for Fuel Cell Forklifts Fuel cell forklifts offer several advantages compared to conventional fork lift
technology
Preliminary Analysis • Compared to conventional forklifts, fuel
cell forklifts have: • 1.5 X lower maintenance cost • 8 X lower refueling/recharging labor
cost • 2 X lower net present value of total
system cost
Preliminary Analysis: Comparison of PEM Fuel Cell- and Battery-Powered Forklifts
Time for Refueling/ Changing Batteries
4-8 min/day 45-60 min/day (for battery change-outs) 8 hours (for battery recharging & cooling)
Labor Cost of Refueling/Recharging
$1,100/year $8,750/year
NPV of Capital Costs $12,600 ($18,000 w/o incentives)
$14,000
NPV of O&M Costs (including fuel)
$52,000 $128,000
Published Fact Sheets & Case Studies
DOE FCTO Fall 2013 http://www1.eere.energy.gov/hydrogenandfuelcells/presentations.html

5
www.nrel.gov/hydrogen/proj_tech_valida5on.html
NFCTEC Analysis Approach
National Fuel Cell Technology Evaluation Center
NFCTEC
Analysis and repor7ng of real-‐world opera7on data

6
Objec7ves
• Assess technology o Perform independent technology assessment in real world opera*on condi*ons o Focus on fuel cell system and hydrogen infrastructure: performance, opera*on, and
safety o Leverage data processing and analysis capabili*es developed under the fuel cell vehicle
Learning Demonstra*on project o Evaluate material handling equipment (MHE) and backup power o Analysis includes up to 1,000 fuel cell systems deployed with American Recovery and
Reinvestment Act (ARRA) funds
• Support market growth o Provide analyses and results relevant to the markets’ value proposi*on o Report on technology status to fuel cell and hydrogen communi*es and other key
stakeholders such as end users
Assess the technology status in real world operations, establish performance baselines, report on fuel cell and hydrogen
technology, and support market growth by evaluating performance relevant to the markets’ value proposition

7
74 MHE CDPs—Count and Category
Deployment & Site Overview (1, 40)
Fuel Cell Opera7on (2, 7, 8, 11, 15,
16, 17, 23, 24, 63) Fuel Cell Reliability (28, 29, 30, 31)
Fuel Cell Safety (26, 27, 53, 56, 57)
Infra. Safety (25, 41, 46, 51, 55)
Infra. Reliability (45, 48, 49, 50)
FC Maintenance (12, 13, 14, 43, 54, 61)
NREL cdp_mhe_58 Created: Sep-23-11 4:32 PM
Cost of Ownership (58, 59, 60,64)
NREL cdp_mhe_59 Created: Sep-23-11 4:32 PM
Fuel Cell Durability (32, 33, 34, 38, 39, 73)
< 10000 hours > 10000 hours 0%
10%
20%
30%
40%
50%
60%
70%
80%
90%
100%Fuel Cell Stacks Projected Hours to 10% Voltage Degradation
Projected Hours to 10% Voltage Degradation 1,3
FC S
tack
s [%
]
In ServiceNot In Service2
NREL cdp_mhe_97
Created: Apr-02-13 9:36 AM | Data Range: 2009Q1-2012Q4
1) Projection using field data, calculated at high stack current, from operation hour 0. Projected hours may differ from an OEM's end-of-life criterion and does not address "catastrophic" failure modes.2) Indicates stacks that are no longer accumulating hours either a) temporarily or b) have been retired for non- stack performance related issues or c) removed from DOE program.3) Projected hours limited based on demonstrated hours.
0 10 20 30 40 50 600
1
2
3
4
5
6
7
8
9
10
Amount Fueled in an Hour [kg]
Freq
uenc
y [%
of t
otal
]
Hydrogen Dispensed Per Hour - ARRA
NREL cdparra_mhe_69
Created: Apr-02-13 8:41 AM | Data Range: 2010Q1-2012Q4
Average: 4.8 kgs per hourMedian: 3.5 kgs per hourMax: 52.5 kgs per hour
Infra. Opera7on (3, 4, 5, 6, 9, 10, 21, 22, 35, 37, 42, 62, 65, 68, 69, 70,
71)
1 2 3 4 5 6 7 80
10
20
30
40
50
60
70
80
90
100
Station (Sorted By Increasing Max Daily Amount)
Cap
acity
Util
izat
ion
2 [%]
Station Capacity Utilization
Max Daily20 kg
Max Daily25 kg
Max Daily64 kg
Max Daily99 kg
Max Daily102 kg
Max Daily135 kg
Max Daily293 kg
Max Daily358 kg
42.9%
Average Daily Utilization1
Maximum Daily Utilization
NREL cdparra_mhe_71NREL cdparra_mhe_71
Created: Apr-02-13 10:48 AM | Data Range: 2009Q4-2012Q4
1Maximum quarterly utilization considers all days; average daily utilization considers only days when at least one filling occurred2100% represents maximum daily amount dispensed for each individual site
1 2 3 4 5 6 7 80
50
100
150
200
250
Station (Sorted By Increasing Max Daily Amount)
Fills
Per
Day
Station Usage
Maximum Daily Fills
Average Daily Fills1
NREL cdparra_mhe_70
Created: Apr-02-13 8:52 AM | Data Range: 2010Q1-2012Q4
1Average daily fills considers only days when at least one fill occurred
0 5 10 15 20 25 30 35 40 450
2
4
6
8
10
12
Number of Fuelings in an Hour
Freq
uenc
y [%
of t
otal
]
Number of Fuelings Per Hour - ARRA
NREL cdparra_mhe_68
Created: Apr-02-13 8:25 AM | Data Range: 2010Q1-2012Q4
Average: 7.3 per hourMedian: 5.0 per hourMax: 39.0 per hour
<0 0 2 4 6 8 10 12 14 16 18 200
5
10
15
20
25
30
Sim
ulta
neou
s Fi
lls
Back-to-Back Fills
36 % of fills are within 0-5 minutes of each other23 % of fills have more than 20 minutes between them228912 Total Fills
Time Between Fuelings* [min]
# of
Fue
lings
[% o
f tot
al]
Histogram of Time Between Fuelings
All Sites CombinedIndividual Sites
200 225 250 275 300 325 350 375 400 425 4500
1
2
3
4
5x 10⁴ Final Pressures for Fills with <5 Minutes in Between
# of
Fue
lings
Final Pressure [bar]
Previous FillNext Fill
NREL cdparra_mhe_65
Created: Apr-02-13 8:12 AM | Data Range: 2010Q1-2012Q4 *Time is from end of fill to start of next fill.
Infra. Maintenance (18, 19, 20, 44, 47, 52,
66, 67, 72,76,77)
0
50
100
150
200
250
AIR SYSTEM
CONTROL ELECTRONICS
DISPENSER
FITTINGS&PIPIN
G
HYDROGEN COMPRESSOR
VALVES
MTB
F (D
ays)
MTBF by Equipment Category: Infrastructure (Delivered H2 Only)
Median SiteLowest Site
NREL cdparra_mhe_72
Created: Apr-02-13 11:01 AM | Data Range: 2010Q1-2012Q4
Jan Feb Mar Apr May Jun Jul Aug Sep Oct Nov Dec0
20
40
60
80
100
120
140
160
Month
Cou
nt o
f Mai
nten
ance
Eve
nts
Infrastructure Maintenance by Month
UnscheduledScheduled
NREL cdp_mhe_67
Created: Apr-02-13 9:36 AM | Data Range: 2009Q1-2012Q4
8%
19%
23%
50%
Total Events = 1,0581
64% unscheduled
entiresystem 46
misc 124
multiplesystems 221
classifiedevents1 667
Event Count
8%
19%
17%
56%
Total Hours = 7,08062% unscheduled
hydrogen compressor
control electronics
dispenser
air system
NREL cdp_mhe_66
Created: Apr-02-13 9:35 AM | Data Range: 2009Q1-2012Q4
Delivered Hydrogen Infrastructure Maintenance By Equipment Type
MISC includes the following failure modes: seal, fuel system, safety,thermal management, storage, electrical, software, fittings&piping, valves,
sensors, other
0
10
20
30
40
50
60
70
80
90
100
Apr-201
0
Jul-2
010
Oct-20
10
Jan-20
11
Apr-201
1
Jul-2
011
Oct-20
11
Jan-20
12
Apr-201
2
Jul-2
012
Oct-20
12
Jan-20
13
Apr-201
3
% o
f Tot
al M
onth
ly M
aint
enan
ce L
abor
Hou
rs
Equipment Percentage of Repair Labor Hours Over Time*
HYDROGEN COMPRESSORCONTROL ELECTRONICSDISPENSERAIR SYSTEMNREL cdparra_mhe_77
Created: Sep-30-13 12:56 PM | Data Range: 2010Q10-2013Q2
*Calculated as a percentageof all maintenance each month; bars maynot total to 100% if other maintenancecategories were present.
0123456789
101112
AIR SYSTEM
CONTROL ELECTRONICS
DISPENSER
ELECTRICAL
ENTIRE SYSTEM
FITTINGS&PIPIN
G
FUEL SYSTEM
HYDROGEN COMPRESSOR
MULTIPLE SYSTEMS
OTHER
SAFETY
SENSORS
SOFTWARE
STORAGE
THERMAL MANAGEMENT
VALVES
Rep
air L
abor
Tim
e (H
ours
)
Equipment Category Repair Time: Infrastructure (Delivered H2 Only)
NREL cdparra_mhe_76
Created: Sep-28-13 10:08 AM | Data Range: 2010Q10-2013Q2
75% Percentile
Median
25% Percentile
Mean

8
MHE Opera7on Summary 2009 Q4–2013 Q2
Units in opera*on*
Hydrogen fills
Hydrogen dispensed in kg
Opera*on hours
Average opera*on hours between fills
Average fill amount in kg
Average fill *me in minutes *One project has completed
Valida*on of MHE is based on real-‐world opera*on data from high-‐use facili*es

9
Study of FC Voltage Degrada7on Against 10,000 Hours
< 10000 hours > 10000 hours 0%
10%
20%
30%
40%
50%
60%
70%
80%
90%
100%Fuel Cell Stacks Projected Hours to 10% Voltage Degradation
Projected Hours to 10% Voltage Degradation 1,3
FC S
tack
s [%
]
In ServiceNot In Service2
NREL cdp_mhe_97
Created: Sep-28-13 12:46 PM | Data Range: 2009Q1-2013Q2
1) Projection using field data, calculated at high stack current, from operation hour 0. Projected hours may differ from an OEM's end-of-life criterion and does not address "catastrophic" failure modes.2) Indicates stacks that are no longer accumulating hours either a) temporarily or b) have been retired for non- stack performance related issues or c) removed from DOE program.3) Projected hours limited based on demonstrated hours.
More than 50% of stacks have projected hours to 10% voltage degrada*on >10,000 hours.
10
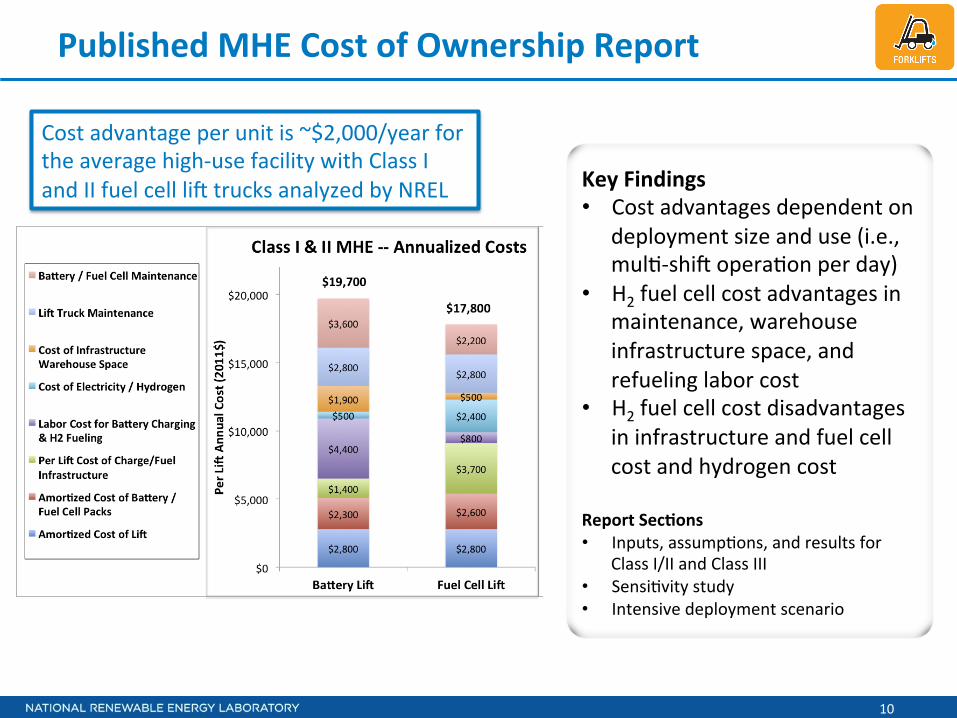
Published MHE Cost of Ownership Report
Key Findings • Cost advantages dependent on
deployment size and use (i.e., mul*-‐shi_ opera*on per day)
• H2 fuel cell cost advantages in maintenance, warehouse infrastructure space, and refueling labor cost
• H2 fuel cell cost disadvantages in infrastructure and fuel cell cost and hydrogen cost
Report Sec7ons • Inputs, assump*ons, and results for
Class I/II and Class III • Sensi*vity study • Intensive deployment scenario (1) Total cost represents the annualized cost of ownership of Class I, II, and III forklifts on a net present value basis, accounting for
capital, operating, and maintenance costs of forklifts, power packs, and infrastructure (labor costs for maintenance and for charging or fueling are included, but labor costs of forklift material handling operations are excluded). Costs are calculated assuming that the material handling operations are ongoing, with equipment replacements made as necessary. Capital, operating, and maintenance costs are assumed to remain constant in real-dollar terms, and capital purchases are discounted using a discount rate representing the time value of money. Fuel cell system costs reflect the current fuel cell tax credit of $3,000/kW or 30% of purchase price. Analysis does not consider the potential productivity increases resulting from the constant power output of fuel cell systems, which may be significant. Costs of ownership of Class II forklifts are expected to be similar for Class I forklifts, though the cost of the lift itself is expected to be higher. Costs are based on information provided by deployment host partners (end-users) based on a questionnaire developed by NREL, supplemented with data provided by project partners, and are reflective of the material handling operations of these deployments. Where appropriate, fuel cell deployment data were used in place of end-user questionnaire data; in particular, data from CDPs 1, 6, 8, 14, and 22 were used. Cost assessment will be further refined as additional data are available.
Total Cost of Ownership for Class I, II & III Forklifts1
NREL cdp_mhe_58 Created: Sep-23-11 4:32 PM
Cost advantage per unit is ~$2,000/year for the average high-‐use facility with Class I and II fuel cell li_ trucks analyzed by NREL

11
Study of Infrastructure Usage by Daily Fills
1 2 3 4 5 6 7 80
50
100
150
200
250
Station (Sorted By Increasing Max Daily Amount)
Fills
Per
Day
Station Usage
Maximum Daily Fills
Average Daily Fills1
NREL cdparra_mhe_70
Created: Sep-26-13 10:20 AM | Data Range: 2009Q4-2013Q2
1Average daily fills considers only days when at least one fill occurred
The maximum daily fill count for two sites was >200 fills. Those two sites average nearly 100 fills per day.

12
0 25 50 75 100 125 150 175 200 225 250 275 3000
1
2
3
4
5
6
7
8
9
10
Site MTBF1 (Days)
Cou
nt o
f Site
sSite MTBF (Calendar Days In Operation): Infrastructure
NREL cdp_mhe_48
Created: Sep-28-13 12:45 PM | Data Range: 2009Q1-2013Q21. Cumulative Mean Time Between Failure
Infrastructure Reliability Analysis
Infrastructure consistently delivering 250 and 350 bar fills even though the majority of the sites have a MTBF of 25 days or less
Compressor 51%
Control Electronics 20%
Dispenser 19%
Air System 10%
Delivered H2 Maintenance Count by Category 1,330 Maintenance Events
63% unscheduled
13
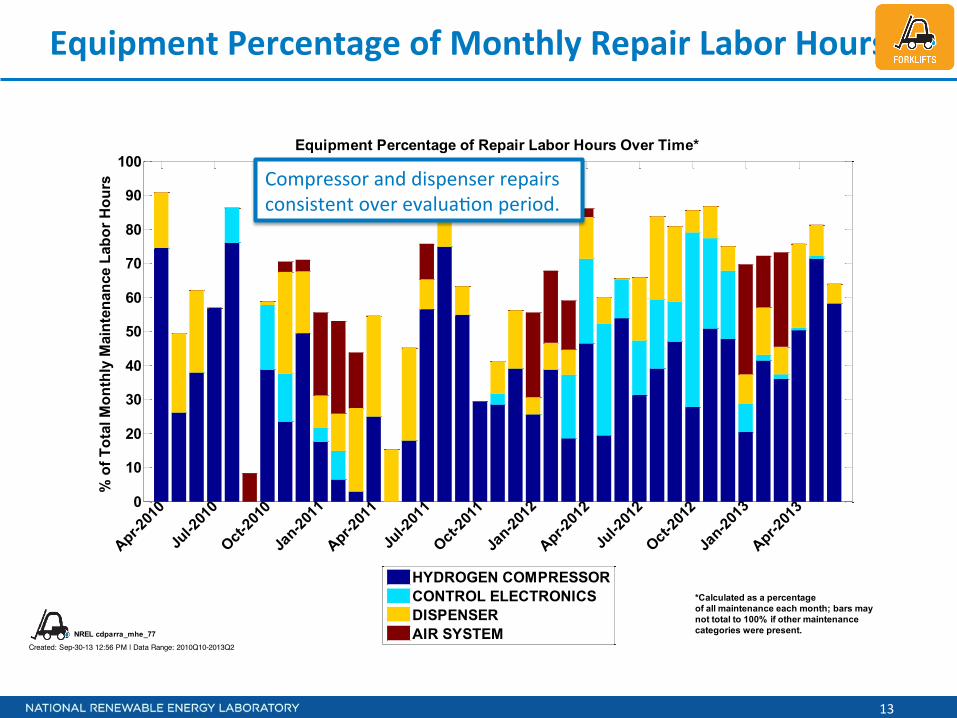
Equipment Percentage of Monthly Repair Labor Hours
0
10
20
30
40
50
60
70
80
90
100
Apr-201
0
Jul-2
010
Oct-20
10
Jan-20
11
Apr-201
1
Jul-2
011
Oct-20
11
Jan-20
12
Apr-201
2
Jul-2
012
Oct-20
12
Jan-20
13
Apr-201
3
% o
f Tot
al M
onth
ly M
aint
enan
ce L
abor
Hou
rs
Equipment Percentage of Repair Labor Hours Over Time*
HYDROGEN COMPRESSORCONTROL ELECTRONICSDISPENSERAIR SYSTEMNREL cdparra_mhe_77
Created: Sep-30-13 12:56 PM | Data Range: 2010Q10-2013Q2
*Calculated as a percentageof all maintenance each month; bars maynot total to 100% if other maintenancecategories were present.
Compressor and dispenser repairs consistent over evalua*on period.

14
0
50
100
150
200
250
AIR SYSTEM
CONTROL ELECTRONICS
DISPENSER
FITTINGS&PIPIN
G
HYDROGEN COMPRESSOR
SENSORS
VALVES
MTB
F (D
ays)
MTBF by Equipment Category: Infrastructure (Delivered H2 Only)
Median SiteLowest Site
NREL cdparra_mhe_72
Created: Sep-26-13 10:24 AM | Data Range: 2010Q1-2013Q2
Breakdown of MTBF by Key Delivered Hydrogen Infrastructure Categories
Consistent across all sites are failures with control electronics and hydrogen compressors. These two categories have low MTBF.

15
Breakdown of Failure Modes for Top Four Maintenance Categories for Infrastructure
0 100 200 300 400
HYDROGEN COMPRESSOR
DISPENSER
CONTROL ELECTRONICS
AIR SYSTEM
Event Count
51%*
20%*
19%*
10%*
DATA ERROR
DRIVE OFF
EXCESSIVE NOISE
FAILED CLOSED
HYDROGEN LEAK
INSPECT TROUBLE ALARM OR REPORT
LIGHTNING STRIKE
METAL FATIGUE
MOISTURE INFILTRATION
OUT OF CALIBRATION
PRESSURE LOW
REPLACE FAILED PARTS
TEMPERATURE HIGH
MISC
0 500 1000 1500 2000 2500 3000 3500
HYDROGEN COMPRESSOR
DISPENSER
CONTROL ELECTRONICS
AIR SYSTEM
Labor Hours
58%*
18%*
14%*
9%*
NREL cdp_mhe_52
Created: Sep-26-13 9:51 AM | Data Range: 2009Q1-2013Q2
Failure Modes for Top Four Infrastructure Equipment Categories
* Percentage of total events or hours, reference CDP 66.
MISC includes the following failure modes: ambient temperature too low, broken wire,cavitation, data error, debris infiltration, electrical short, failed closed, false alarm, flow
high, flow low, fluid leak non-hydrogen, fluid leak non_hydrogen, fluidleak_non_hydrogen, inspect trouble alarm or report, maintenance error, manufacturing
defect, metal fatigue, moisture infiltration, network malfunction, operator protocol, other,power outage, pressure high, pressure low, replace failed parts, software bug,
unspecified electronics failure, vandalism, voltage low, other
There are many different failure modes for the top four categories and these modes provide insight for RD&D needs
16
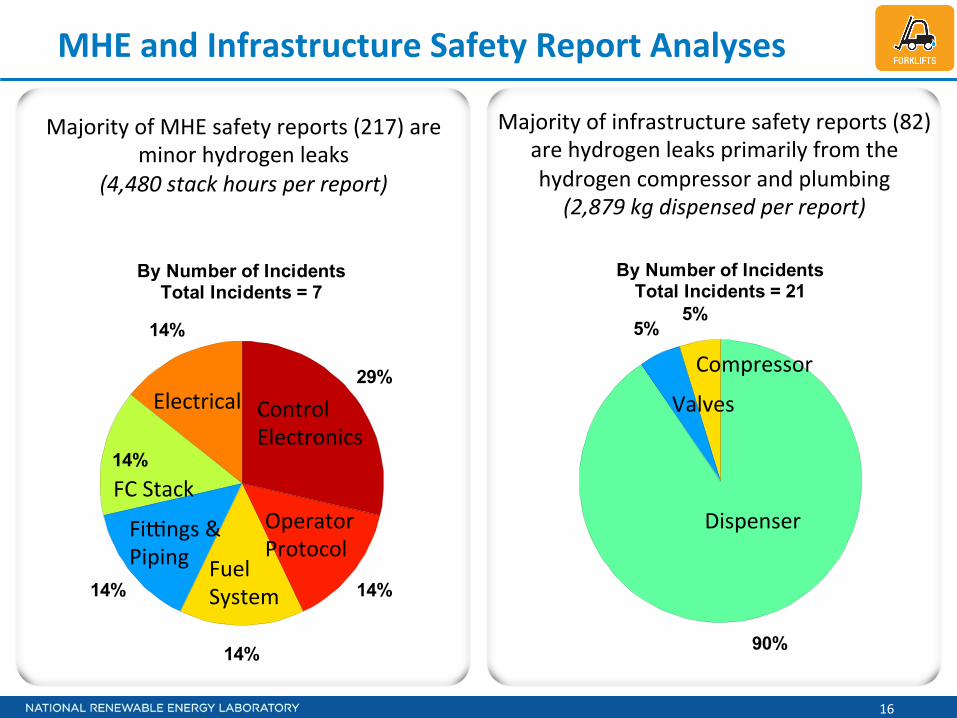
MHE and Infrastructure Safety Report Analyses
5%5%
7%
10%
21%
50%
By Number of ReportsTotal Near Miss Reports = 210
14%
14%
14%
14%
14%
29%
By Number of IncidentsTotal Incidents = 7
control electronics
operator protocol
electrical
fuel system
fc stack
valves
air system
fittings & piping
thermal management
Misc
NREL cdparra_mhe_57
Created: Mar-26-12 4:23 PM
Safety Reports By Equipment Category: ARRA MHE
MISC includes the following categories:SOFTWAREELECTRICALREFORMERSENSORS
SEALOTHER
An INCIDENT is an event that results in: - a lost time accident and/or injury to personnel - damage/unplanned downtime for project equipment, facilities or property - impact to the public or environment - any hydrogen release that unintentionally ignites or is sufficient to sustain a flame if ignited - release of any volatile, hydrogen containing compound (other than the hydrocarbons used as common fuels)A NEAR-MISS is: - an event that under slightly different circumstances could have become an incident - unplanned H2 release insufficient to sustain a flame
Control Electronics
Operator Protocol
Fuel System
Fikngs & Piping
FC Stack
Electrical
Majority of MHE safety reports (217) are minor hydrogen leaks
(4,480 stack hours per report)
Majority of infrastructure safety reports (82) are hydrogen leaks primarily from the hydrogen compressor and plumbing
(2,879 kg dispensed per report)
18%
20%
48%
By Number of ReportsTotal Near Miss Reports = 71
5%5%
90%
By Number of IncidentsTotal Incidents = 21hydrogen compressor
fittings & piping
dispenser
seal
valves
reformer
Misc
NREL cdp_mhe_46
Created: Sep-26-13 2:14 PM | Data Range: 2009Q1-2013Q2
Safety Reports By Equipment Category: Infrastructure
MISC includes the following categories:STORAGE
FUEL SYSTEMOTHER
An INCIDENT is an event that results in: - a lost time accident and/or injury to personnel - damage/unplanned downtime for project equipment, facilities or property - impact to the public or environment - any hydrogen release that unintentionally ignites or is sufficient to sustain a flame if ignited - release of any volatile, hydrogen containing compound (other than the hydrocarbons used as common fuels)A NEAR-MISS is: - an event that under slightly different circumstances could have become an incident - unplanned H2 release insufficient to sustain a flame
Dispenser
Compressor
Valves

17
Technical Summary—What We’ve Learned
• Opera*ng with an average availability of ~98% at eight end-‐user facili*es.
• Most systems operate at least 6 hours a day.
• Cost of ownership comparison between fuel cell and balery MHE indicate significant cost savings for refueling labor and infrastructure space but much greater cost for hydrogen infrastructure and fuel.
• MHE infrastructure can provide insight into infrastructure performance for the light duty vehicle applica*on.
Aggregated data showcase performance over the last two
years in MHE and backup power.
Performance results address a need for published results on
the technology status.
Data analyses develop as systems operate and based on the key performance areas in
the markets.

18
This project is supported by the U.S. Department of Energy Fuel Cell Technology Office EERE, Jason
Marcinkoski, Sara Dillich, & Pete Devlin
Jennifer Kurtz jennifer.kurtz nrel.gov @
Image Source: NREL

1 1
Fuel Cell Material Handling:
U.S. Success & European Growth
Warren Brower, November 27, 2013
The content of this presentation is
PLUG POWER INC. PROPRIETARY AND
CONFIDENTIAL.
Copyright 2013 by Plug Power Inc.

2
This communication contains statements that are not historical facts and are considered forward-looking within the meaning of Section 27A of the
Securities Act and Section 21E of the Exchange Act. These forward-looking statements contain projections of our future results of operations or of our
financial position or state other forward-looking information. We believe that it is important to communicate our future expectations to our investors.
However, there may be events in the future that we are not able to accurately predict or control and that may cause our actual results to differ
materially from the expectations we describe in our forward-looking statements. Investors are cautioned not to unduly rely on forward-looking
statements because they involve risks and uncertainties, and actual results may differ materially from those discussed as a result of various factors,
including, but not limited to: the risk that we continue to incur losses and might never achieve or maintain profitability, the risk that we expect we will
need to raise additional capital to fund our operations and such capital may not be available to us; the risk that we do not have enough cash to fund
our operations to profitability and if we are unable to secure additional capital, we may need to reduce and/or cease our operations; the risk that a
"going concern” opinion from our auditors, KPMG LLP, could impair our ability to finance its operations through the sale of equity, incurring debt, or
other financing alternatives; the recent restructuring plan we adopted may adversely impact management’s ability to meet financial reporting
requirements; our lack of extensive experience in manufacturing and marketing products may impact our ability to manufacture and market products
on a profitable and large-scale commercial basis; the risk that unit orders will not ship, be installed and/or converted to revenue; the risk that pending
orders may not convert to purchase orders; the risk that our continued failure to comply with NASDAQ’s listing standards may result in our common
stock being delisted from the NASDAQ stock market, which may severely limit our ability to raise additional capital; the cost and timing of developing,
marketing and selling our products and our ability to raise the necessary capital to fund such costs; the ability to achieve the forecasted gross margin
on the sale of our products; the actual net cash used for operating expenses may exceed the projected net cash for operating expenses; the cost and
availability of fuel and fueling infrastructures for our products; market acceptance of our GenDrive systems; our ability to establish and maintain
relationships with third parties with respect to product development, manufacturing, distribution and servicing and the supply of key product
components; the cost and availability of components and parts for our products; our ability to develop commercially viable products; our ability to
reduce product and manufacturing costs; our ability to successfully expand our product lines; our ability to improve system reliability for our GenDrive
systems; competitive factors, such as price competition and competition from other traditional and alternative energy companies; our ability to protect
our intellectual property; the cost of complying with current and future federal, state and international governmental regulations; and other risks and
uncertainties discussed under “Item IA—Risk Factors” in Plug Power’s annual report on Form 10-K for the fiscal year ended December 31, 2012, filed
with the Securities and Exchange Commission (“SEC”) on April 1, 2013 and as amended on April 30, 2013 and the reports Plug Power filed from time
to time with the SEC. These forward-looking statements speak only as of the date on which the statements were made and are not guarantees of
future performance. Except as may be required by applicable law, we do not undertake or intend to update any forward-looking statements after the
date of this communication.
3
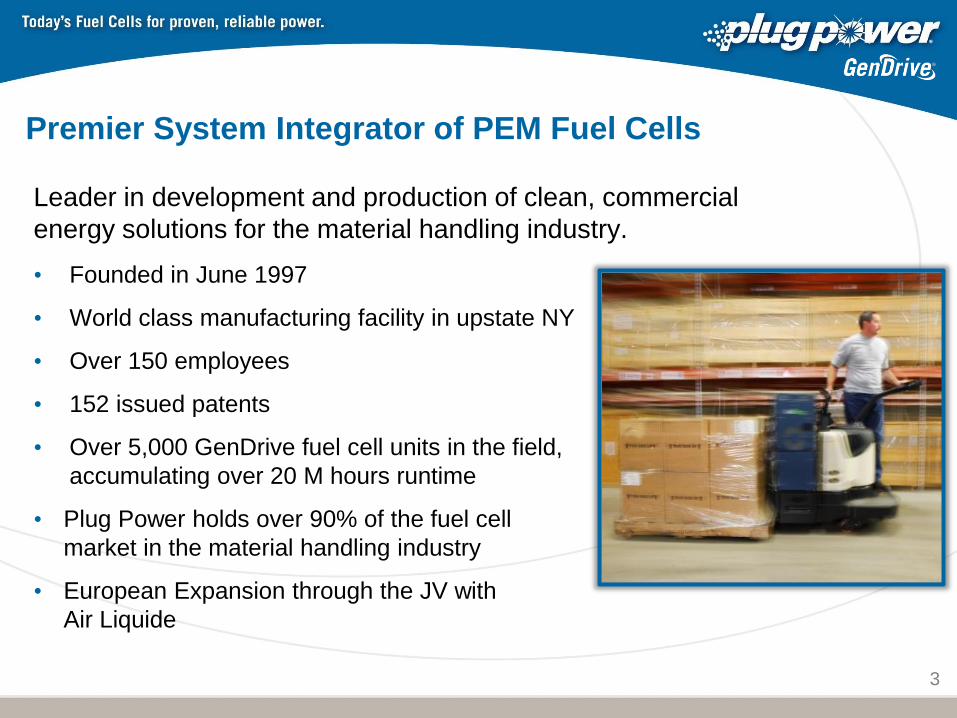
Leader in development and production of clean, commercial
energy solutions for the material handling industry.
• Founded in June 1997
• World class manufacturing facility in upstate NY
• Over 150 employees
• 152 issued patents
• Over 5,000 GenDrive fuel cell units in the field,
accumulating over 20 M hours runtime
• Plug Power holds over 90% of the fuel cell
market in the material handling industry
• European Expansion through the JV with
Air Liquide
Premier System Integrator of PEM Fuel Cells

Plug Power: Poised for Profitability
Today’s focus: material handling market
• Endorsed via an investment by Air Liquide, a leading industrial gas firm
• Significant and new customers are buying
• Quality problems behind us
• EBITDA profitability within reach
• Success in materials transport is generating interest (and development funds)
from adjacent markets
4
This is the first step toward Plug Power’s long-term
goal to displace lead-acid batteries and diesel engines
in a broad array of applications.

HyPulsion - European Joint Venture Created 2012
• Luc VANDEWALLE : Managing Director
• Warren BROWER : Product, Marketing, OEM Director
• Paul DEPREZ : Sales & After Sales Director
• Sosthene GRANDJEAN : Program Management
• Camille VRIGNAUD : Customer Support – Service Technician
• Arnaud CERCEAU : Operations & Manufacturing
• Michael NINDEL : Business Dev. Germany
• Ranjieve WILLIAMS : Engineering Director European Team
• US Engineers : 7 Design Engineers (Plug Power)

6
• HyPulsion has completed one year of business and product development activities
• Shipment of product has begun in multiple countries with multiple OEMs
• Market opportunity greater than North America
• 9 CE certified products with multiple configurations available for deployment
• Collaboration projects in place with 7 fork lift OEMs
• Includes Jungheinrich, TMHE, Linde/Fenwick, Still, Crown, NACCO, Airmarrel
HyPulsion JV is Bearing Fruit

GenDrive Benefits
Operational Benefits
• Increased Productivity
• Reduced Operational Costs
• Additional Commercial Space
• Reduced Carbon Emissions
GenDrive® Products
Counterbalanced Trucks
Reach Trucks
Rider Order Picking Trucks
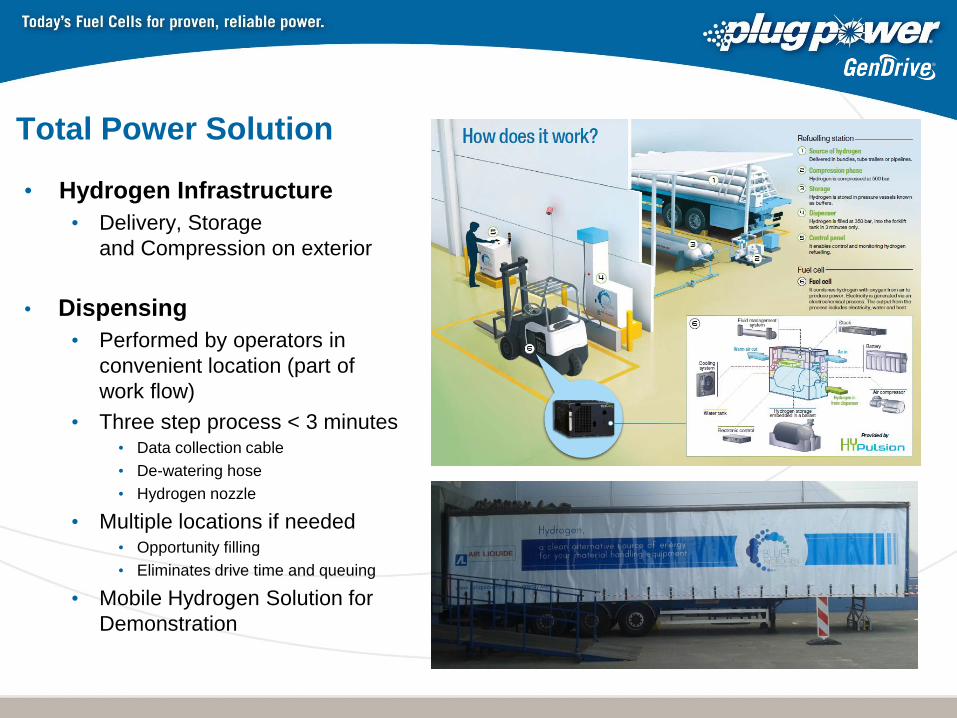
Total Power Solution
• Hydrogen Infrastructure
• Delivery, Storage
and Compression on exterior
• Dispensing
• Performed by operators in
convenient location (part of
work flow)
• Three step process < 3 minutes • Data collection cable
• De-watering hose
• Hydrogen nozzle
• Multiple locations if needed • Opportunity filling
• Eliminates drive time and queuing
• Mobile Hydrogen Solution for
Demonstration

9
Applications and Markets
Market Opportunity*
• Full suite of GenDrive fuel cell products to meet
material handling customer needs
• SAM Address 40% of today’s TAM*
• Address greenfield/brownfield sites in the markets:
• Retail and Food Distribution
• Manufacturing
• Potential for market expansion into Asia
*SAM: Serviceable Addressable Market
TAM: Total Available Market

Segment Experience Hydrogen Solutions Market Size
QTY*
Market Size
USD**
North
America Large
6 Years
(1 Year onsite
generation)
• Delivery with on-site liquefied storage
• Large on-site generation w/ gaseous
storage
15% (~180 K)
$ 4.2 Billion Medium
6 Years
(1 Year onsite
generation)
• Delivery with on-site liquefied or
gaseous storage
• Small on-site generation w/ gaseous
storage
25% (~300 K)
Small 1-3 Years
• Delivery with gaseous storage
• Small on-site generation w/gaseous
storage
20% (~240 K)
Retail Under development • Under development 40% (~480 K)
Europe All 1 Year • AL advanced hydrogen fueling stations ~1,700 K $5.7 Billion
Japan &
China All N/A • Under review N / A $7.8 Billion
ROW All N/A • Under review N / A $2.1 Billion
10
Expanding the Opportunity in the
$20B Material Handling Industry
* Sources: Analysis of Industrial Truck Association data, JVIA, and ongoing management discussions with OEM’s
North American shipments have been isolated to 40% of the total fork truck population
Low-cost Hydrogen Infrastructure is Crucial to Expansion

11 11 11
• 44 total site deployments with 24
different customers
• 29 brownfield sites
• 15 greenfield sites
• More than 5,000 units shipped
• >8,000 fills per day by customer
• More than 5,000 kg of H2 dispensed
per day
NA Customer Base Continues to Grow

European Customer Traction Growing
High Throughput
Distribution Centers
Consumer & Retail
Distribution Centers
Manufacturing
Facilities

Future Market Expansion
• Targeting adjacent markets that have the same
dynamics as materials handling
• Ground Support Equipment – 60,000 units deployed
• Big Rig Transportation Refrigeration Units – 290,000
units deployed
• Range extenders for heavy-duty electric vehicles
• President Obama target: 1M electric vehicles by 2015
• Significant development funds provided by external
agencies
• DOE: grant for Bridge Terminal Transport tuggers
(BTT)
• $2.5 Million
• NYSERDA: $500,000 for TRUs
• DOE RFP: planned application for range extenders
13
Charlatte BTT
Heavy Duty Electric Car
Transportation Refrigeration Unit

Summary
14
• Plug Power is the premier system integrator
for PEM fuel cells
• Materials handling first mover advantage – 90% market share;
HyPulsion JV gives us same advantage in Europe
• Air Liquide now a key strategic investor and joined board of
directors
• Compelling customer experience with Fortune 500 client list –
4,000 units to 24 firms
• Growing opportunities in adjacent markets with outside entities
committing development funds
• Momentum in lower-cost Hydrogen solutions is rapidly
expanding our opportunities
• Material handling success is the first step to
our goal of profitably displacing diesel engines
and batteries with fuel cells in a wide array of
applications

15 15