fuel-cladding interaction between u-pu-zr fuel and fe
TRANSCRIPT

Fuel-Cladding Interaction Between U-Pu-Zr Fueland Fe
ASSEL AITKALIYEVA, JAMES W. MADDEN, BRANDON D. MILLER,CYNTHIA A. PAPESCH, and JAMES I. COLE
This work investigates fuel-cladding chemical interaction (FCCI) between U-25Pu-14Zr (inwt pct) fuel and pure Fe at elevated temperatures, understanding of which is critical forevaluation of the fuel performance. Phases and microstructure formed in the quaternaryuranium-plutonium-zirconium-iron (U-Pu-Zr-Fe) system were characterized using thetransmission electron microscopy technique. Phases formed within the FCCI layer wereidentified using selective area electron diffraction (SAED) analysis as Fe2U (Fd- m), Fe2Zr(Fd-3m), a-U (Cmcm), Fe2Pu (Fd-3m), b-Pu (C12/m1), and b-Zr (Im-3m).
DOI: 10.1007/s40553-015-0059-4� ASM International (ASM) and The Minerals, Metals & Materials Society (TMS) 2015
I. INTRODUCTION
METALLIC fuels are one of the most promisingcandidates for next generation fast reactors. They havethe advantage of simple fabrication, high burn-up, goodthermal response, and relatively simple recycling usingmelt refining or electro-refining processes.[1] Ura-nium-plutonium-zirconium (U-Pu-Zr) alloys comprisethe leading metallic fuel candidates for fast reactor andtransmutation fuel applications. However, metallic fuelshave several disadvantages as compared to alternativefast reactor fuels, such as an affinity for fuel-claddingchemical interaction (FCCI).
Solid-state diffusion under gradients of temperatureand concentration during irradiation causes constituentredistribution inmetallic fuels, which affects homogeneityof the fuel alloy. The inhomogeneity of fuel alloys can leadto phase transformations, changes in solidus temperature,and local changes in fissile atom density.[2] This can altermechanical and physical properties of the fuel alloy, andmodify behavior and performance of the fuel. Potentialeutectic melting of the interaction products, formed as aresult of FCCI, at temperatures lower than the meltingtemperature of the fuel is a limiting factor in theperformance of the metallic fuel. Additionally, formationof an interaction layer can reduce cladding thickness anddecreases its load-bearing capability, consequentlydecreasing the life of a fuel-bearing element.[3]
Understanding fuel constituent redistribution thatalters alloy composition and affects fuel performanceis imperative for safe operation of the reactor. However,to comprehend irradiation-induced changes in U-Pu-Zr
alloys and consequent FCCI, the phases and microstruc-ture of unirradiated fuels should be characterized first.Out-of-pile annealing tests on diffusion couples havebeen conducted to investigate FCCI behavior betweenU-Zr and U-Pu-Zr fuel alloys and Fe, Fe-12Cr, andHT-9 cladding.[4–11] The most inclusive study of qua-ternary U-Pu-Zr-Fe system at 973 K (700 �C) has beenconducted using thermal analysis and energy-dispersivespectroscopy (EDS) in scanning electron microscope(SEM).[9] However, there are issues associated with thecharacterization of Pu phases using EDS such asunavailability of U and Pu standards for appropriateEDS calibration, spatial resolution, magnification-de-pendent sensitivity of the technique, and overlaps of Uand Pu EDS peaks, all of which restrict accuratequantitative chemical analysis of Pu-based phases inSEM. To address the limitations of SEM analysis,detailed structural and chemical composition analysis offormed complex phases needs to be conducted intransmission electron microscope (TEM). In this work,transmission electron microscopy has been implementedto attain better understanding of compatibility betweenU-Pu-Zr fuel and Fe cladding and investigate diffusionzone structure at the fuel-cladding interface.
II. MATERIALS AND METHODS
A fuel alloy with nominal composition ofU-25Pu-14Zr (in wt pct) was arc cast in an inertatmosphere glove box using a drop-casting technique.After casting, the cylindrical alloy was sectioned intoseveral pieces. The surfaces of pure Fe (99.995 pctpurity, obtained from Alfa Aesar, Ward Hill, MA)cladding and fuel slug were polished through a 3 lmdiamond solution to a mirror polish. The fuel slug wasplaced in contact with Fe cladding material and com-pressed in a Kovar steel device, lined with tantalum foilon the interior to prevent an undesirable reactionbetween diffusion couples and the jig.
ASSEL AITKALIYEVA, CYNTHIA A. PAPESCH, and JAMESI. COLE, Materials Scientists, JAMES W. MADDEN, SeniorMicroscopist, and BRANDON D. MILLER, Nuclear Engineer, arewith the Idaho National Laboratory, P.O. Box 1625, M.S. 6188, IdahoFalls, ID 83415-6188. Contact e-mail: [email protected]
U.S. Government Work. Not Protected by U.S. Copyright.Manuscript submitted June 23, 2015.Article published online November 19, 2015
220—VOLUME 2E, DECEMBER 2015 METALLURGICAL AND MATERIALS TRANSACTIONS E

The diffusion couple was placed in a furnace andannealed at 973 K (700 �C) for 75 h under continuousargon flow. Annealing temperature was selected tosimulate normal fuel operating temperatures [823 K to1223 K (550 �C to 950 �C)]. Other diffusion coupleswere annealed at temperatures ranging from 823 K to1223 K (550 �C to 950 �C) and the results from thoseexperiments will be published at a later date. In additionto varying temperatures, fuel compositions ranged from10 at. pct Zr to 40 at. pct Zr and from 20 at. pct Pu to30 at. pct Pu. However, this manuscript concentrates onthe fuel composition containing 30 at. pct Zr and 20at. pct Pu. The varying Pu and Zr compositions wereselected to investigate the influence of these elements onphase formation and constituent migration.
Note that the formation of oxides on the initialinterface is likely, since even ultra-high purity argon cancontain oxygen and other reacting gases. Therefore,phases formed upon heat treatment could have beenstabilized by impurities. Immediately after annealing,the assembly was quenched in water to preserve thephases formed during heat treatment. The diffusioncouple was then removed from the compression device,embedded in epoxy, and polished through a 3 lmdiamond solution prior to analysis.
Cross-sectional specimens for transmission electronmicroscopy (TEM) were prepared in a FEI QUANTA3D field emission gun (FEG) dual beam-focused ionbeam/scanning electron microscope (FIB/SEM) using alift-out approach. Prior to TEM specimen preparation,surface of the diffusion couple was examined in SEM todetermine the exact location of the fuel-cladding inter-action zone and perform initial examination of theformed microstructure. To reduce charging, a layer ofPd coating was applied to the sample surface prior toanalysis in SEM. Specimens for TEM were character-ized at 200 kV in a JEOL JEM 2010 TEM equippedwith Bruker Quantax 200 Esprit 1.9 software and aBruker 133 silicon drift detector.
Seven cross-sectional specimens were prepared fromthe FCCI region, shown in Figure 1, and characterizedin TEM. Several lift-outs were prepared to ensurethorough characterization and identification of allphases. The lamella had approximate dimensions of15 9 10 9 0.1 lm3. Identification of formed phases wasconducted by comparing experimental selective areadiffraction (SAD) patterns to simulated patterns from
published crystal structures produced using JEMSsoftware.[12] In addition, d spacing of each diffractionpattern was measured and compared to the publishedcrystallographic data. The data from two cross-sectionallift-outs are provided in this work, since the phasespresent in the other lift-outs were consistent with datashown here.
III. RESULTS AND DISCUSSION
Figure 1 shows an overview of the diffusion couple, inwhich the formed FCCI layer has been identified withwhite dot lines. The acquired micrographs and X-raymaps revealed substantial diffusion of the fuel into thecladding that resulted in the formation of a pronouncedFCCI layer. The width of FCCI layer was non-uniformwith average value of about 454 ± 32 lm.Figure 2 shows elemental X-ray maps and corre-
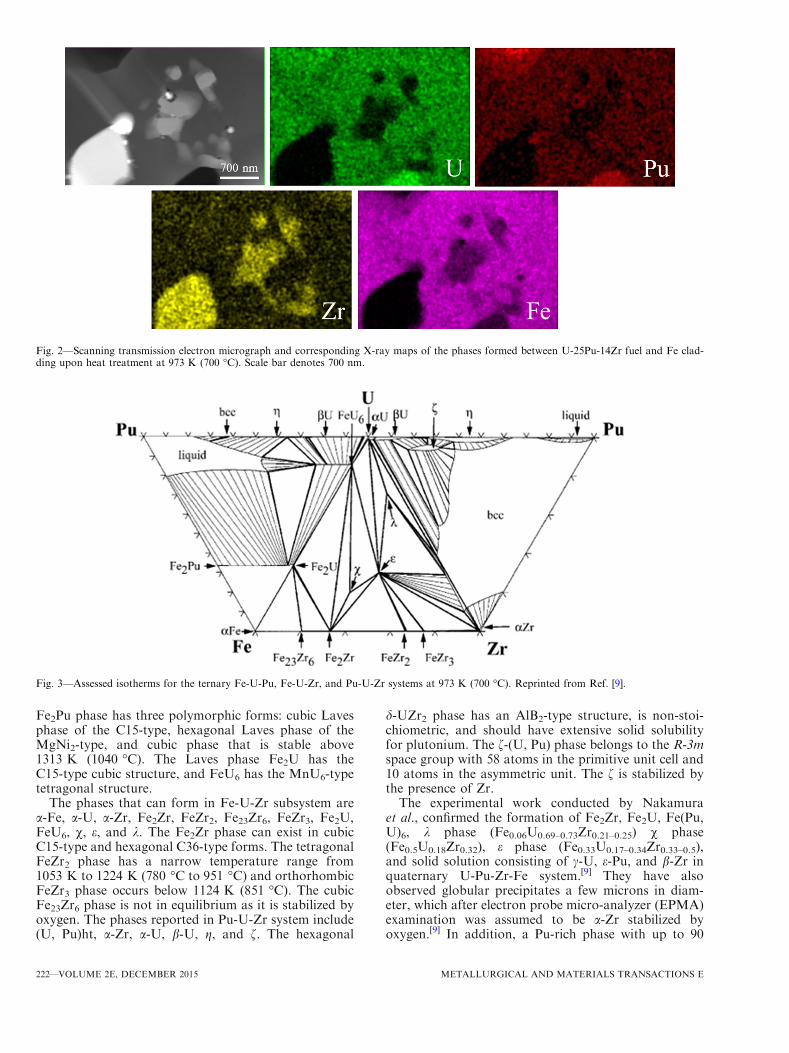
sponding scanning transmission electron micrographcollected from the first lift-out. EDS point scans werecollected but not quantified due to unavailability ofstandards for transuranic elements. X-ray maps depict-ing spatial distributions of various elements were col-lected by individually mapping characteristic X-raysfrom each element of interest with the EDS spectrometerin the TEM. Each map was adjusted for contrast andbrightness to emphasize spatial variations in the inten-sity. Brighter areas in each map represent higherconcentrations of the element of interest than less brightareas in the same map. Note that equally bright areas indifferent maps do not represent comparable concentra-tions due to this adjustment. Elemental X-ray mapsshown in Figure 2 revealed segregation of U with Pu inthe matrix, Fe with U, Fe with Zr in globular features,and Zr in the lightest feature shown in the bottom-leftcorner of the micrograph. This suggests formation offour distinctive phases within the formed FCCI region.Previously conducted phase diagram evaluations
show that in the fuel operating temperatures 823 K to1223 K (550 �C to 950 �C) and specifically at 973 K(700 �C), selected in this study, a number of differentphases can form in U-Pu-Zr-Fe system.[6–9,13] Figure 3shows isothermal sections for three ternary subsystemsat 973 K (700 �C). Different phases can form inFe-U-Pu subsystem, such as FeU6, Fe2U, Fe2Pu, b-U,g, a-Fe, and bcc phase, also known as (U, Pu)ht. The
Fig. 1—Overview of the cladding, formed fuel-cladding interaction layer, and fuel after annealing at 973 K (700 �C). Two white dot lines depictthe FCCI layer, and red dot line shows the location of the initial fuel-cladding interface. White rectangular boxes identify approximate locationof the lift-outs prepared from the FCCI region. Scale bar denotes 300 lm (Color figure online).
METALLURGICAL AND MATERIALS TRANSACTIONS E VOLUME 2E, DECEMBER 2015—221
Fe2Pu phase has three polymorphic forms: cubic Lavesphase of the C15-type, hexagonal Laves phase of theMgNi2-type, and cubic phase that is stable above1313 K (1040 �C). The Laves phase Fe2U has theC15-type cubic structure, and FeU6 has the MnU6-typetetragonal structure.
The phases that can form in Fe-U-Zr subsystem area-Fe, a-U, a-Zr, Fe2Zr, FeZr2, Fe23Zr6, FeZr3, Fe2U,FeU6, v, e, and k. The Fe2Zr phase can exist in cubicC15-type and hexagonal C36-type forms. The tetragonalFeZr2 phase has a narrow temperature range from1053 K to 1224 K (780 �C to 951 �C) and orthorhombicFeZr3 phase occurs below 1124 K (851 �C). The cubicFe23Zr6 phase is not in equilibrium as it is stabilized byoxygen. The phases reported in Pu-U-Zr system include(U, Pu)ht, a-Zr, a-U, b-U, g, and f. The hexagonal
d-UZr2 phase has an AlB2-type structure, is non-stoi-chiometric, and should have extensive solid solubilityfor plutonium. The f-(U, Pu) phase belongs to the R-3mspace group with 58 atoms in the primitive unit cell and10 atoms in the asymmetric unit. The f is stabilized bythe presence of Zr.The experimental work conducted by Nakamura
et al., confirmed the formation of Fe2Zr, Fe2U, Fe(Pu,U)6, k phase (Fe0.06U0.69–0.73Zr0.21–0.25) v phase(Fe0.5U0.18Zr0.32), e phase (Fe0.33U0.17–0.34Zr0.33–0.5),and solid solution consisting of c-U, e-Pu, and b-Zr inquaternary U-Pu-Zr-Fe system.[9] They have alsoobserved globular precipitates a few microns in diam-eter, which after electron probe micro-analyzer (EPMA)examination was assumed to be a-Zr stabilized byoxygen.[9] In addition, a Pu-rich phase with up to 90
Fig. 2—Scanning transmission electron micrograph and corresponding X-ray maps of the phases formed between U-25Pu-14Zr fuel and Fe clad-ding upon heat treatment at 973 K (700 �C). Scale bar denotes 700 nm.
Fig. 3—Assessed isotherms for the ternary Fe-U-Pu, Fe-U-Zr, and Pu-U-Zr systems at 973 K (700 �C). Reprinted from Ref. [9].
222—VOLUME 2E, DECEMBER 2015 METALLURGICAL AND MATERIALS TRANSACTIONS E
at. pct Pu was noted but not identified. All phases wereidentified using X-ray mapping and EDS point scananalysis, which does not provide any crystallographicinformation. However, based on their observations, theFe(Pu, U)6, Fe2Zr, Fe2U, and v phases should be inequilibrium with a liquid phase, and Fe(Pu, U)6 and v inequilibrium with the k phase.[9]
Based on the segregation of the elements in X-raymaps, initial phase identification was conducted byconsulting existing ternary phase diagrams. TheFe-Zr-enriched phases could correspond to Fe2Zr,FeZr2, Fe23Zr6, and FeZr3. The Fe-U-enriched regioncould be either Fe2U or FeU6. The Zr-enriched precip-itate can be a-Zr or b-Zr. The matrix can correspond to
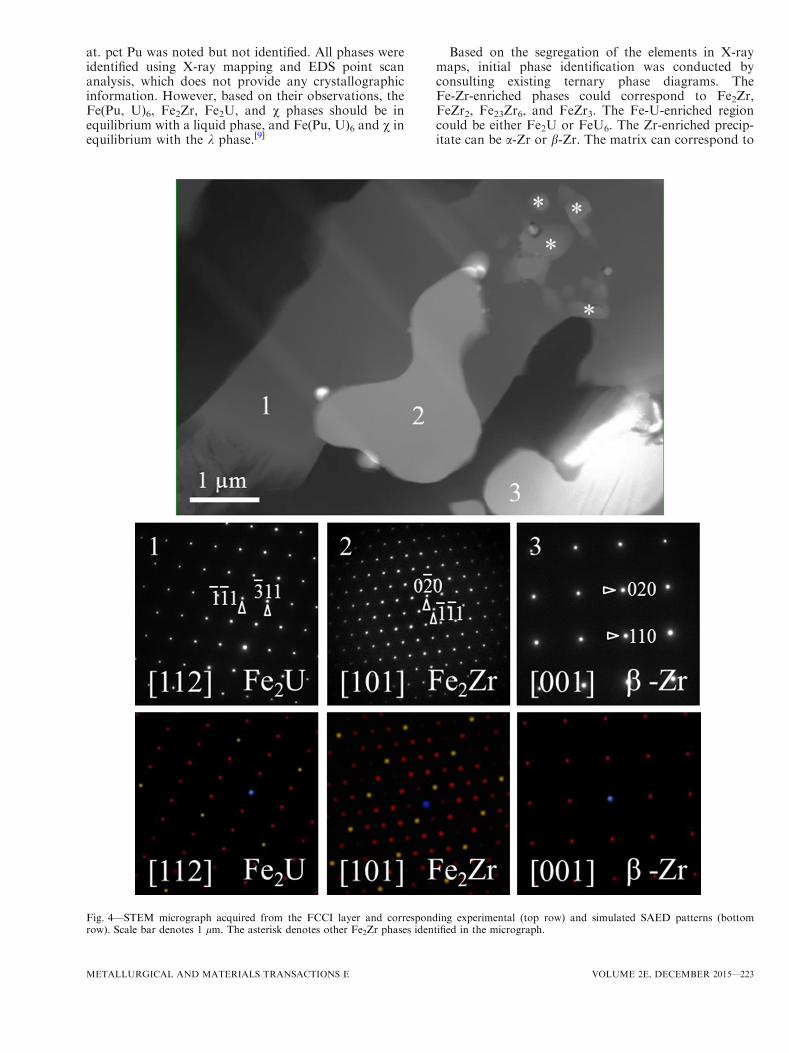
Fig. 4—STEM micrograph acquired from the FCCI layer and corresponding experimental (top row) and simulated SAED patterns (bottomrow). Scale bar denotes 1 lm. The asterisk denotes other Fe2Zr phases identified in the micrograph.
METALLURGICAL AND MATERIALS TRANSACTIONS E VOLUME 2E, DECEMBER 2015—223

(U, Pu)ht, f-(U, Pu), a-U, or b-U. Selective areadiffraction (SAD) patterns of phases shown inFigure 3 were collected, analyzed, and are shown inFigure 4. The Fe-U-enriched phase was identified asFe2U, while Fe-Zr phase corresponds to Fe2Zr, andZr-enriched precipitate is consistent with b-Zr. Due tothe varying FIB milling rates and subsequent specimenthickness variation, the Pu-U-enriched matrix was notsufficiently thin for SAD analysis; therefore, identifica-tion of the Pu-U-enriched phase has not beenconducted.
Multiple cross-sectional TEM specimens containingU-Pu-enriched matrix have been prepared in the FIBtool but due to differential thinning of diverse phaseconstituents in these multi-component diffusion couples,some U-Pu-enriched phases were not sufficiently thin to
acquire SAD patterns. Since both U and Pu have largeratomic masses as compared to other elements in thesesamples, U-Pu-enriched phases thin at a much slowerrate. In addition, Pu-enriched phases oxidized morerapidly during specimen transfer between instrumentsthan other phases within prepared lamella. In somecases, when U-Pu matrix was thinned more compared tothe other phases within same lamella, rapid oxidation ofthe matrix leads to the U-Pu matrix transformation intoa brittle and highly unstable phase upon exposure to airfor short periods of time (20 minutes or less). Because ofthese issues, identification of U-Pu-enriched phases inTEM has not been conducted. Further work will beconducted to overcome these issues.Formation of Zr-enriched precipitates is not an
anticipated phenomenon, as the existing phase diagrams
Fig. 5—Transmission electron micrograph acquired from the first lift-out and corresponding experimental (top row) and simulated SAED pat-terns (bottom row). Scale bar denotes 1 lm. The asterisk denotes the location of Fe2U phase identified in the micrograph.
224—VOLUME 2E, DECEMBER 2015 METALLURGICAL AND MATERIALS TRANSACTIONS E
do not predict the formation of Zr precipitates in thealloys of interest. The Zr-rich precipitates, stabilized bydissolved impurities such as N, O, and C, have beenobserved in a variety of transmutation fuels.[14–20] Inprevious studies, these Zr-rich precipitates were assumedto be a-Zr that formed during alloy preparation becauseof the interstitial impurities present in the feedstock.[14]
Our previous investigation of the U-Pu-Zr fuel showedthe formation of Zr precipitates in the vicinity of thespecimen surface.[20] It is believed that migration ofzirconium to the surface of the sample during annealingleads to the separation of Zr phase from the matrix andformation of a thin layer on the surface of the fuel.[15]
Formation of this oxygenated surface upon exposure ofthe sample to air combined with migration of Zr towardthe oxygen upon heating of the specimen results information of the a-Zr.[15] However, in the diffusioncouple under observation, only b-Zr phase has beenobserved. Formation of face-centered cubic (fcc) Zr, asopposed to a-Zr, has been noted in the work performedby Janney et al.[19]. It is possible that impurities such asN are responsible for the observed b-Zr as the impuritiesmost likely acted as a stabilizing element.
Figure 5 shows bright-field (BF) transmission electronmicrograph of the phases formed at the bottom of the
second lift-out and experimental SAD patterns corre-sponding to these phases. Numbers provided in themicrograph indicate location of different phases, whichwere identified as a-U, Fe2U, Fe2Zr, and Fe2Pu.Simulated electron diffraction patterns are provided atthe bottom of Figure 5 for reference. The phase withlightest contrast in Figure 5 corresponds to Fe2Zr, withFe2U phase forming in its immediate vicinity.Phase constituents developed in the second lift-out
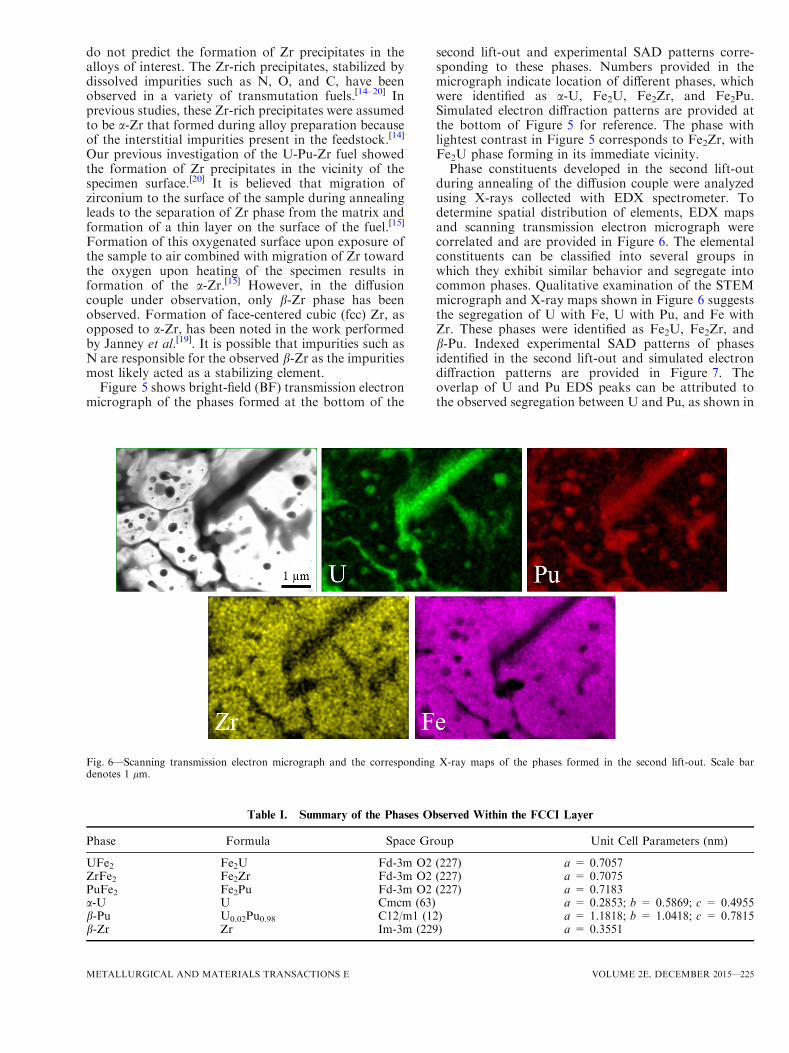
during annealing of the diffusion couple were analyzedusing X-rays collected with EDX spectrometer. Todetermine spatial distribution of elements, EDX mapsand scanning transmission electron micrograph werecorrelated and are provided in Figure 6. The elementalconstituents can be classified into several groups inwhich they exhibit similar behavior and segregate intocommon phases. Qualitative examination of the STEMmicrograph and X-ray maps shown in Figure 6 suggeststhe segregation of U with Fe, U with Pu, and Fe withZr. These phases were identified as Fe2U, Fe2Zr, andb-Pu. Indexed experimental SAD patterns of phasesidentified in the second lift-out and simulated electrondiffraction patterns are provided in Figure 7. Theoverlap of U and Pu EDS peaks can be attributed tothe observed segregation between U and Pu, as shown in
Fig. 6—Scanning transmission electron micrograph and the corresponding X-ray maps of the phases formed in the second lift-out. Scale bardenotes 1 lm.
Table I. Summary of the Phases Observed Within the FCCI Layer
Phase Formula Space Group Unit Cell Parameters (nm)
UFe2 Fe2U Fd-3m O2 (227) a = 0.7057ZrFe2 Fe2Zr Fd-3m O2 (227) a = 0.7075PuFe2 Fe2Pu Fd-3m O2 (227) a = 0.7183a-U U Cmcm (63) a = 0.2853; b = 0.5869; c = 0.4955b-Pu U0.02Pu0.98 C12/m1 (12) a = 1.1818; b = 1.0418; c = 0.7815b-Zr Zr Im-3m (229) a = 0.3551
METALLURGICAL AND MATERIALS TRANSACTIONS E VOLUME 2E, DECEMBER 2015—225
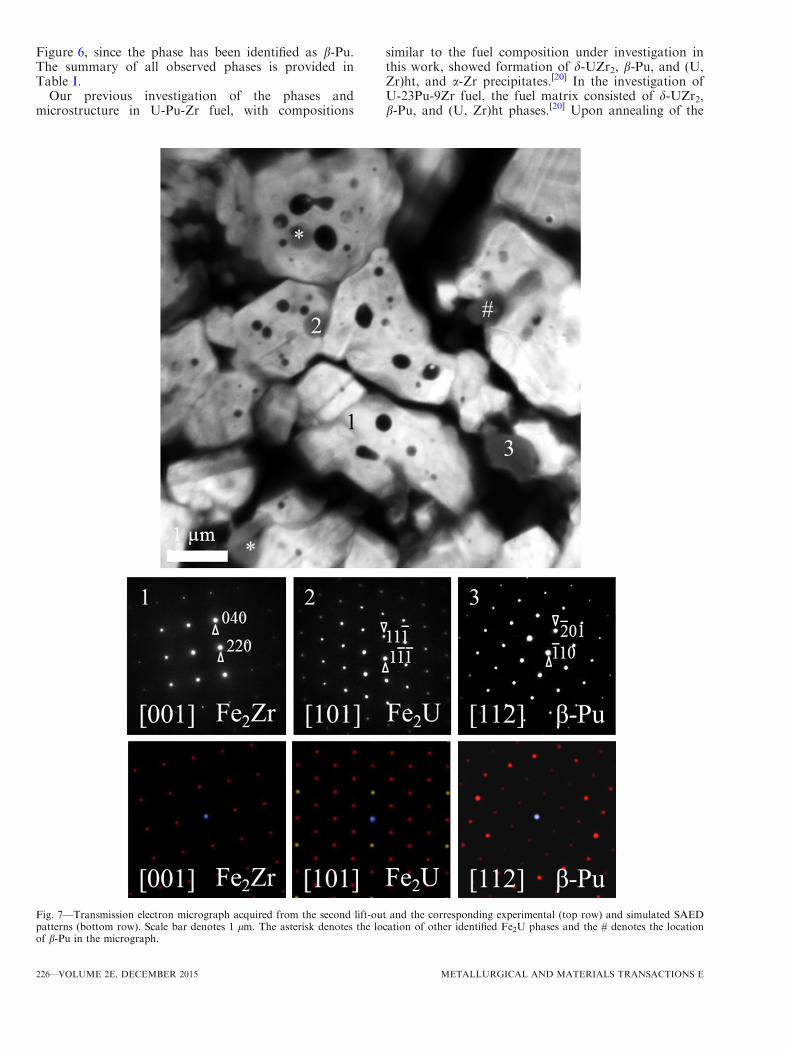
Figure 6, since the phase has been identified as b-Pu.The summary of all observed phases is provided inTable I.
Our previous investigation of the phases andmicrostructure in U-Pu-Zr fuel, with compositions
similar to the fuel composition under investigation inthis work, showed formation of d-UZr2, b-Pu, and (U,Zr)ht, and a-Zr precipitates.[20] In the investigation ofU-23Pu-9Zr fuel, the fuel matrix consisted of d-UZr2,b-Pu, and (U, Zr)ht phases.[20] Upon annealing of the
Fig. 7—Transmission electron micrograph acquired from the second lift-out and the corresponding experimental (top row) and simulated SAEDpatterns (bottom row). Scale bar denotes 1 lm. The asterisk denotes the location of other identified Fe2U phases and the # denotes the locationof b-Pu in the micrograph.
226—VOLUME 2E, DECEMBER 2015 METALLURGICAL AND MATERIALS TRANSACTIONS E

fuel in contact with the cladding, d-UZr2 and (U, Zr)htphases disappear and only b-Pu phase remains. How-ever, b-Pu no longer comprises a majority of the fuelmatrix but is present in the form of more or less globularprecipitates surrounded by the Fe2Zr phase (Figure 7).It is currently impossible to determine the evolution ofthe matrix phases as we were not able to identify theU-Pu-enriched matrix phase resulting from FCCI.Further work is needed to determine the identity ofthe matrix phase in the FCCI layer of the diffusioncouple.
The phases observed in this work are somewhatsimilar to those observed in diffusion couple composedof U-19Pu-10Zr fuel and HT-9 cladding.[21] In the workperformed by Nakamura, the identified phases wereFe2U, Fe2Zr, e, and bcc+ e, where bcc is a solidsolution of cU+ bPu+ bZr.[21] Unlike the work con-ducted by Nakamura, this work used the diffusioncouple method to study the FCCI behavior. At the earlystages of diffusion, Fick’s law governs atom penetration.When the thermal budget is high enough, the concen-tration profile evolves into step height distributions,with each step corresponding to an equilibrium phasepredicted by the phase diagram. A diffusion couple canbe formed at a pre-selected temperature and is quicklyquenched into to ambient temperature. Thus, themicrostructures corresponding to a higher temperaturein the phase diagram are retained to a low temperaturefor characterization (assuming the quench rate is rapidenough), and temperate dependences of phase diagramscan be systematically studied in this way. This method issuperior to traditional alloying by mixing metals atgiven weight percentages, since in diffusion couples, theweight percentages vary from 0 to 100 pct. This methodallows validation of existing phase diagram and achiev-ing understanding of local changes in microstructuraland microchemistry of each phase.
In the work performed on U–Pu-Zr-Fe alloy, theFe2Zr, Fe2U, Fe(Pu, U)6, a solid solution of cU+bPu+ bZr, k phase (Fe0.06U0.69–0.73Zr0.21-0.25) v phase(Fe0.5U0.18Zr0.32), and e phase (Fe0.33U0.17–0.34Zr0.33–0.5)have been identified.[9] However, since this work hasrelied on SEM and X-ray data, the variation betweenreported results is not surprising. In this work, cross-sec-tional TEM specimens were prepared in the FIB andthese specimens show the microstructure of the fuelbeyond the surface layer. Since both a-U and b-Puphases have been found below the surface of thespecimen, these phases may not be detected usingsurface-based analysis techniques. In addition, differ-ences in casting techniques, starting alloy purities, andthermal histories have to be taken into consideration asall of them can affect the formation of phases.
The significance of these results is that mitigation oflife-limiting processes can be greatly enhanced byunderstanding of fundamental mechanisms of degrada-tion over a wide range of parameters, both in generalterms and as a function of specific reactor environment.Detailed and quantitative understanding of atomicscale, in-reactor degradation behavior of nuclear fuelsand materials is of critical importance to the develop-ment of next generation reactor systems as it is the
evolution of the microstructure at the atomic scalewhich has the most profound impact on bulk propertiesand in-reactor performance. The FCCI data provided inthis work provide the data needed to support multi-scalemodeling and simulation efforts of fuels and reactormaterials.
IV. SUMMARY
In this paper, the phases formed betweenU-25Pu-14Zr (wt pct) and Fe have been characterizedand identified using transmission electron microscopy.Examination in the scanning electron microscopeshowed substantial fuel-cladding interaction at 973 K(700 �C), with the thickness of the FCCI layer in therange of 454 ± 32 lm. The phases formed within FCCIlayer were identified as Fe2U, Fe2Zr, a-U, Fe2Pu, b-Pu,and b-Zr. The Pu-U-enriched matrix phase has not beenidentified using SAD analysis due to differential thin-ning of diverse phase constituents in FIB. However, inaccordance with existing phase diagrams, these phasescould correspond to either bU, (ePu, cU), or (e+L).
ACKNOWLEDGMENTS
This work is supported by the U.S. Department ofEnergy, Office of Nuclear Energy under DOE IdahoOperations Office Contract DE-AC07-05ID14517, aspart of Fuel Cycle Research and Development(FCRD) program of US Department of Energy andNuclear Science User Facilities. The U.S. Governmentretains a non-exclusive, royalty-free license to publishor reproduce the published form of this contribution,or allow others to do so, for U.S. Government pur-poses. This information was prepared as an account ofwork sponsored by an agency of the U.S. Govern-ment. Neither the U.S. Government nor any agencythereof, nor any of their employees, makes any war-ranty, express or implied, or assumes any legal liabilityor responsibility for the accuracy, completeness, orusefulness of any information, apparatus, product, orprocess disclosed, or represents that is use would notinfringe privately owned rights. References herein toany specific commercial product, process, or service bytrade name, trademark, manufacturer, or otherwise,does not necessarily constitute or imply its endorse-ment, recommendation, or favoring by the U.S.Government or any agency thereof. The views andopinions of authors expressed herein do not necessar-ily state or reflect those of the U.S. Government orany agency thereof.
REFERENCES1. D.E. Burkes, R.S. Fielding, and D.L. Porter: J. Nucl. Mater.,
2009, vol. 392, pp. 158–63.2. Y.S. Kim, G.L. Hofman, S.L. Hayes, and Y.H. Sohn: J. Nucl.
Mater., 2004, vol. 327, pp. 27–36.
METALLURGICAL AND MATERIALS TRANSACTIONS E VOLUME 2E, DECEMBER 2015—227
3. H.J. Ryu, B.O. Lee, S.J. Oh, J.H. Kim, and C.B. Lee: J. Nucl.Mater., 2009, vol. 392, pp. 206–12.
4. D.D. Keiser, Jr and M.C. Petri: J. Nucl. Mater., 1996, vol. 240,pp. 51–61.
5. D.D. Keiser, Jr and M.A. Dayananda: J. Nucl. Mater., 1993,vol. 200, pp. 229–43.
6. K. Nakamura, T. Ogata, M. Kurata, A. Itoh, and M. Akabori: J.Nucl. Mater., 1999, vol. 275, pp. 246–54.
7. T. Ogata, M. Kurata, K. Nakamura, A. Itoh, and M. Akabori: J.Nucl. Mater., 1997, vol. 250, pp. 171–75.
8. A.B. Cohen, H. Tsai, and L.A. Neimark: J. Nucl. Mater., 1993,vol. 204, pp. 244–51.
9. K. Nakamura, T. Ogata, M. Kurata, T. Yokoo, and M.A.Mignanelli: J. Nucl. Mater., 2002, vol. 304, pp. 63–72.
10. Y. Park, K. Huang, A. Paz y Puente, H.S. Lee, B.H. Sencer, J.R.Kennedy, and Y.H. Sohn: Metal. Mater. Trans. A, 2015, vol. 46A,pp. 72–82.
11. K. Huang, Y. Park, L. Zhou, K.R. Coffey, Y.H. Sohn, B.H.Sencer, and J.R. Kennedy: J. Nucl. Mater., 2014, vol. 451,pp. 372–78.
12. P. Stadelmann: JEMS (EMS Java version), CIME-EPFL,Lausanne, 2004.
13. V. Raghavan: J. Phase Equilibria, 2003, vol. 24, pp. 367–74.14. Y.H. Sohn, M.A. Dayananda, G.L. Hofman, R.V. Strain, and
S.L. Hayes: J. Nucl. Mater., 2000, vol. 279, pp. 317–29.15. R.D. Mariani et al.: Phase Studies and Property Measurements of
Some Ternary Fuel Alloys, AFC2-B General Fuel Characteriza-tion Report, INL/EXT-09-16781, Idaho National Laboratory,2009.
16. D.R. O’Boyle and A.E. Dwight: Proceedings of 4th InternationalConference on Plutonium and Other Actinides, 1970, pp. 720–732.
17. L. Leibowitz et al.: J. Nucl. Mater., 1998, vol. 154, pp. 145–53.18. C.L. Trybus, J.E. Sanecki, and S.P. Henslee: J. Nucl. Mater., 1993,
vol. 204, pp. 50–55.19. D.E. Janney, J.R. Kennedy, J.W. Madden, and T.P. O’Holleran:
J. Nucl. Mater., 2014, vol. 448, pp. 109–12.20. A. Aitkaliyeva, J.W. Madden, C.A. Papesch, and J.I. Cole: J.
Nucl. Mater., 2015, DOI:10.1016/j.jnucmat.2015.10.043.21. K. Nakamura, T. Ogata, and M. Kurata: J. Phys. Chem. Solids,
2005, vol. 66, p. 643.
228—VOLUME 2E, DECEMBER 2015 METALLURGICAL AND MATERIALS TRANSACTIONS E