fuel farm feasibility study - nz transport · pdf filefuel farm feasibility study ... via a...
TRANSCRIPT

BBUULLLLEERR PPOORRTT SSEERRVVIICCEESS
LLIIMMIITTEEDD FFUUEELL FFAARRMM FFEEAASSIIBBIILLIITTYY SSTTUUDDYY
(NZTA Contract number 18/09)
Subcontractor to BPS: Vincent Pooch Key Business Partners Limited
15 May 2009

Page 2 of 42
Figure 1 A typical small fuel tank farm An important note for the reader This report has been prepared for the New Zealand Transport Agency The views, opinions, findings, and conclusions or recommendations expressed in this report are strictly those of the author. The material included is the output of the author's research and should not be considered in any way as policy adopted by the New Zealand Transport Agency, although it may be used in the formulation of future policy. The New Zealand Transport Agency takes no responsibility for any errors or omissions in, or for the correctness of, the information contained in the report. Confidential information This report uses commercially sensitive information provided to the author in confidence. As a consequence Appendices C-F have been excluded from the report.
Report to Buller Port Services 15 May 2009
COMMERCIAL IN CONFIDENCE

Page 3 of 42
Executive Summary This report considers the business case for establishing a fuel tank farm at the port of Westport to meet the needs of Westland, via a small coastal tanker ship. Westland is known to be a fuel intensive province by virtue of long transport distances to major logistics nodes such as Christchurch and Nelson and the nature of local industries such as mining and dairying. This is confirmed by comparison with Poverty Bay which also faces distance barriers but is forestry intensive. It has not proven possible to validate volumes obtained informally from oil company staff of 90,000,000 litres (72,000t) of petrol and diesel consumed per annum. This figure is probably high. Unfortunately the finding is that even with this “best case” volume there is no business case to replace the existing logistics chain via coastal tanker ships (and occasional charters from overseas) into Nelson and Lyttelton thence by road to Westland with a dedicated small tanker ship. The incremental cost would in fact be an extra 2c per litre delivered. In economic value terms the project would lose $4.4 million. The carbon footprint of the existing logistics chain is considered but this cost is small and insufficient to create economic viability in any total cost sense. A number of important additional risks are highlighted, which include:
- the need for oil companies to co-operate to make the project work - the need for specialised ship management and ship scheduling management - existing economies of scale for the port are under threat due to Holcim
proposing a new cement plant in North Otago to replace the Westport plant Consequently the following recommendations are made: One Buller Port Services Limited and its shareholder should not invest further in the Fuel Farm Project at this time, as it is unlikely to produce a positive economic benefit. Two Note that involvement of a ship operator is fundamental to take the project further as in addition to ship management skills, there is a complex ongoing scheduling task. Three/Four This analysis should be discussed with tanker ship operators at opportunity.
Report to Buller Port Services 15 May 2009
COMMERCIAL IN CONFIDENCE

Page 4 of 42
“Buller District, like the West Coast region of which it is a part, faces challenges to sustainable social and economic development. A key challenge for Buller District is to retain its existing population and attract more residents. In the face of relatively high costs of living, the local population, as ratepayers, face the costs of maintaining and upgrading infrastructure to the level expected in the 21st century, funded on a relatively small rating base. In this regard, it should be noted that 87% of the West Coast land is Crown-owned land, administered by the Department of Conservation, which pays no rates to local authorities.” - Mokihinui Hydro Electric Power Proposal: Social Impact assessment March 2008 (p17)
Report to Buller Port Services 15 May 2009
COMMERCIAL IN CONFIDENCE

Page 5 of 42
Table of Contents 1.0 Regional Background.................................................................................................... 6 2.0 Company Background .................................................................................................. 9 3.0 Fuel Farm Opportunity Background........................................................................... 10 4.0 Facilitation by Sea Change ......................................................................................... 13 5.0 Methodology............................................................................................................... 14
5.1 Fact Finding ............................................................................................................ 14 5.2 Analysis................................................................................................................... 14 5.3 Explore Options and Alternatives........................................................................... 14 5.4 Risk Identification................................................................................................... 14
6.0 Existing Fuel volumes................................................................................................. 15 7.0 Existing Logistics chain.............................................................................................. 16 8.0 Existing costs .............................................................................................................. 18
8.1 Port – Primary Distribution from Ship.................................................................... 18 8.2 Road – Secondary Distribution............................................................................... 18 8.3 Road – Tertiary Distribution................................................................................... 19
9.0 Analysis....................................................................................................................... 20 10.0 Carbon footprint........................................................................................................ 26 11.0 Other Findings .......................................................................................................... 27 12.0 Fuel Farm Risks and Mitigation ............................................................................... 28 13.0 Recommendations..................................................................................................... 30 14.0 Summary ................................................................................................................... 31 15.0 Appreciation.............................................................................................................. 31 Appendices........................................................................................................................ 32 References......................................................................................................................... 32
Report to Buller Port Services 15 May 2009
COMMERCIAL IN CONFIDENCE
Page 6 of 42
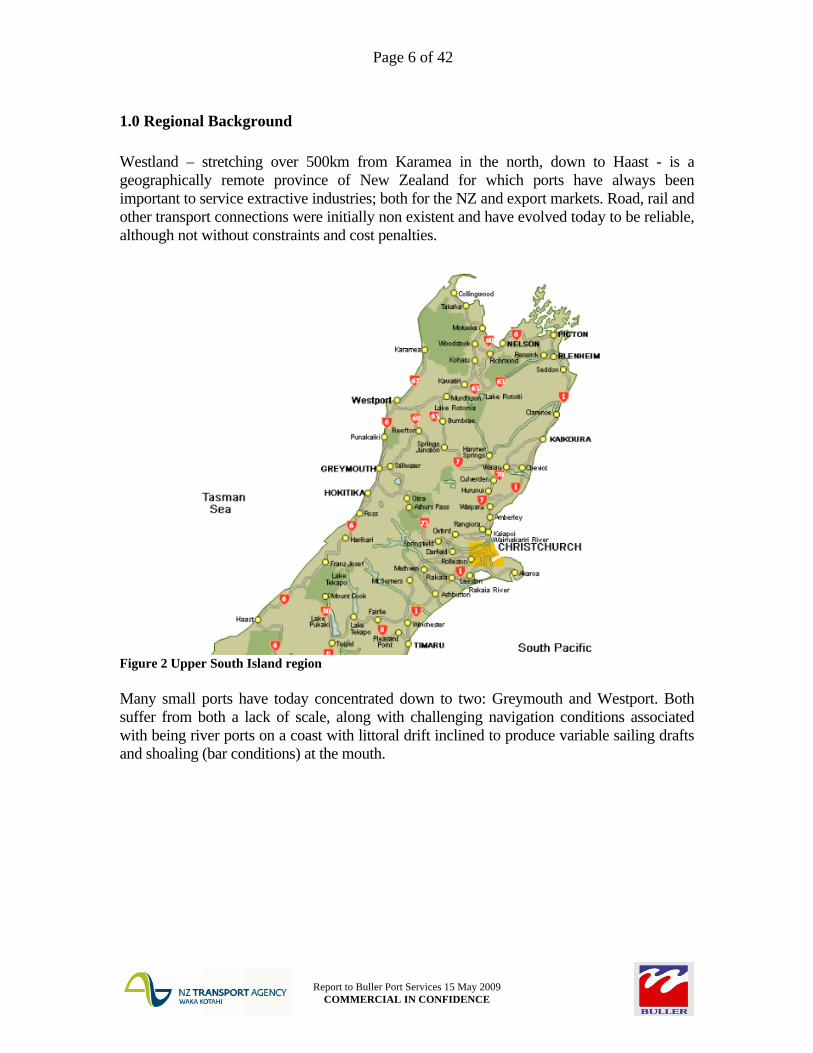
1.0 Regional Background Westland – stretching over 500km from Karamea in the north, down to Haast - is a geographically remote province of New Zealand for which ports have always been important to service extractive industries; both for the NZ and export markets. Road, rail and other transport connections were initially non existent and have evolved today to be reliable, although not without constraints and cost penalties.
Figure 2 Upper South Island region Many small ports have today concentrated down to two: Greymouth and Westport. Both suffer from both a lack of scale, along with challenging navigation conditions associated with being river ports on a coast with littoral drift inclined to produce variable sailing drafts and shoaling (bar conditions) at the mouth.
Report to Buller Port Services 15 May 2009
COMMERCIAL IN CONFIDENCE

Page 7 of 42
On paper, both have potential to mitigate the cost of long road journeys across the South Island’s mountainous backbone: From Nelson1 From Christchurch2
To Westport (pop. ~4000) 222km 339km To Greymouth (pop. ~10,000)
288km 245km
To Hokitika (pop ~3500) 326km 249km Rail distance to Christchurch is even longer (and slower) and of course there is no rail link with Nelson. Recently Port of Greymouth made considerable endeavour to attract the new Pike River coal trade. This ended up being won by a road/rail logistics chain; with the mining company effectively piggybacking on infrastructure controlled by Solid Energy, the major Westland miner. Accordingly prospects seem poor for the Port of Greymouth with trade limited to small fishing vessels, perhaps smaller miners on the Grey coalfields and some casual cargoes such as timber. The Port of Westport is anchored by cement trade from Holcim’s 3 40 year old cement works based on the limestone resource at Cape Foulwind. This volume – around 430,000 tonnes per annum - provides economies of scale to operate appropriate harbour management/risk mitigation via dredging and comprehensive bar management and soundings. Even so, poor bar depths at the mouth have caused regular disruptions to the cement supply chain. Average loads achieved for the two cement carriers “mv Westport” and “Milburn Carrier II” are less than their respective rated full load capacities. In contrast, Holcim’s competitor Golden Bay Cement operates a marine logistics chain out of Portland (Northland) with one ship plus one tug & barge regularly lifting constant, full loads. Logistics factors are clearly in the mix at present for Holcim as they seek planning consent for a new cement works on the east coast at Weston, North Otago. At this point consent has not been granted nor parent capital expenditure approval obtained. Thus, the Weston project4 remains a “wild card” for Westport. Without cement, the port falls into the same position as Greymouth with minimal core trades; but potential associated with coal. High operating costs will be a detraction for new trades while the rail and east coast port infrastructure will continue to chase economies of scale by competing for these same new trades. With cement, there is a platform for the port of Westport to build on and endeavour to leverage the economies of scale.
1 To Port Nelson 2 To Woolston fuel terminal 3 Formerly named Milburn New Zealand Limited, NZ Cement Holdings Limited; Cape Foulwind works was “Guardian” Cement 4 Refer www.holcim.co.nz for details
Report to Buller Port Services 15 May 2009
COMMERCIAL IN CONFIDENCE

Page 8 of 42
“The most pronounced sectoral employment growth for Buller in the past 5 years has been in mining (+89%), property and business services (+45%), transport (+25%) and construction sectors (+22%)”5
5 Mokihinui Hydro Electric Power Proposal Social Impact assessment March 2008 p19 and detailed in Appendix A of that report
Report to Buller Port Services 15 May 2009
COMMERCIAL IN CONFIDENCE

Page 9 of 42
2.0 Company Background Appendix A refers in detail. Buller Port Services Limited “BPS” is 100% owned by Holcim NZ Limited and is contracted by the port owner, Buller District Council, to manage the port safely and efficiently; and to promote trade. Thus Holcim (as the majority provider of throughput volume) is incentivised to attract profitable new trades to create scale economies and help lower the cost of getting cement into the market. This “public – private partnership” is generally considered to have been successful since inception over 20 years ago, in 1988.
Report to Buller Port Services 15 May 2009
COMMERCIAL IN CONFIDENCE

Page 10 of 42
3.0 Fuel Farm Opportunity Background In recent memory, transport fuels (regular and premium octane petrol, diesel) were railed (as secondary distribution) from primary distribution into Lyttelton marine terminal, to small fuel farm depots at Greymouth controlled by Mobil and Caltex.
Figure 3 Fuel6 Distribution 40 years ago (from Ward) Thence, tertiary distribution was by road tanker, as noted in the diagram above for example to Westport. However this was not a complete solution for Westland, for several reasons:
- Shell and BP customers also required servicing - Logistics needs sometimes dictated that fuel came from Port of Nelson; in
particular for customers in Westport and Reefton - Aviation fuel (“avgas”) volumes and quality specifications demanded road
delivery
6 “Motor Spirit” in the Diagram label is a Customs term for dutiable fuels (ie petrol) - the chart is illustrative in this report of flows, rather than comprehensive of volumes
Report to Buller Port Services 15 May 2009
COMMERCIAL IN CONFIDENCE

Page 11 of 42
Thus there has always been secondary distribution of bulk fuels by road tanker to some extent in Westland. Coastal shipping has never featured. As previously noted, Westland is geographically remote province, with a number of longstanding (but growing) fuel intensive industries, such as mining and dairying. As a result, there is a significant land transport cost to truck fuel in from terminals at Nelson and Christchurch7 which are in turn replenished from two sources:
- 75%8 from Marsden Point9 by two large coastal ships (much larger than the local cement ships) operated by Coastal Oil Logistics Limited “COLL” which in turn is owned in equal 25% shares by the four major oil companies
- 25% by imports from other countries in tankers chartered both by COLL and the oil companies directly
Company Ships operated Size (GRT10) South Island
Ports called at “mv Westport” 3,091 Holcim “Milburn Carrier II”
6,200 Westport, Nelson, Picton (on occasion), Lyttelton, Dunedin
“Kakariki” 27,795 “Torea” 25,400
Coastal Oil Logistics Limited Other charters similar
Nelson, Lyttelton, Timaru, Dunedin, Bluff
The Port of Westport, managed by BPS, is the major port of Westland province. In line with local extractive industries the main trades are cement and coal outward. There is a depth of management expertise and supporting infrastructure; with potential (berth availability along with land) to handle greater trade throughput. BPS management identified the opportunity to ship fuel directly from Marsden Point (Northland) into Westport. It would be pumped ashore from a relatively smaller sized coastal tanker ship into a new built fuel tank farm (in an identified location on port owned land) from whence it would be distributed by road, thus saving land transport cost and delivering collateral benefits in line with Central and Local Government policies. This is known as the “Fuel Farm Project”.
7 The Christchurch road terminal (fuel farm) is located at Woolston, in the eastern suburbs. This in turn is replenished by pipeline over the Port Hills from the Lyttelton marine terminal (tank farm). 8 ACIL 1997 9 Owned by public listed NZ Refining Company Limited. At www.nzrc.co.nz a 70% and 84% supply of the NZ petrol and diesel markets is noted 10 Gross Registered Tonnage. It should also be noted that the larger the ship, the deeper the berth and channel drafts required
Report to Buller Port Services 15 May 2009
COMMERCIAL IN CONFIDENCE

Page 12 of 42
Company Ships operated Size (GRT) Ports called at ?? Tanker 4,000 Load: Marsden
Point Discharge: 1/ Westport 2/ ??
This ship size is selected based on being the largest size (to obtain best economies of scale) to match the 4.9m average available sailing drafts into the river berth at Westport. This draft figure is well understood from years of almost daily survey work associated with the cement ships (a just in time logistics operation) and deployment of the Westport dredge “Kawatiri”. Inquiries have revealed that there is ample availability of this size tanker. Especially at present with the shipping market being soft. To a degree this sizing is validated by Seafuels Limited of a 3,900 GRT tanker for a new Marsden Point to Auckland run11. This ship is part of a new logistics chain replacing the “Wynyard Tank Farm” which is being subsumed under zoning changes into non industrial usage.
Figure 4 FS Camille 2749GRT – a smaller sister ship to Seafuels impending tanker 11 Formally announced in the Shipping Gazette 4 April 2009, not yet in service. Seafuels is Joint Venture between Pacific Basin Maritime of Hong Kong (associated with the NZ barging company Sea-Tow) and Ports of Auckland
Report to Buller Port Services 15 May 2009
COMMERCIAL IN CONFIDENCE

Page 13 of 42
4.0 Facilitation by Sea Change In May 2008 the Minister of Transport announced the “Sea Change” fund to promote the development of greater domestic sea freight volume, in line with the broader NZ Transport Strategy. In particular to meet the demands of freight growth; and national economic and environmental goals. BPS duly prepared a proposal seeking support in the first funding round to complete detailed investigation of the Fuel Farm Project; success was advised on 19 December 2008. Contract 18/09 was signed on 3 February 2009 between NZ Transport Agency and Buller Port Services Limited. Analytical work was subcontracted (as a fundamental part of the proposal) to Key Business Partners Limited12 of Christchurch. This firm has a long relationship with the port at Westport via previous work completed for BPS and Holcim. Appendix B refers in greater detail.
12 For further detail see www.keypartners.co.nz
Report to Buller Port Services 15 May 2009
COMMERCIAL IN CONFIDENCE

Page 14 of 42
5.0 Methodology A staged methodology was adopted as per the agreed brief. In overview:
5.1 Fact Finding - Collate, review and discuss existing research papers and background data
from BPS; in particular capital and operating costs of the ship and logistics chain
- Agree key stakeholders - Validate current volume and form a view on likely growth rate in a 20
year horizon - Confirm key drivers of growth - Understand existing logistics configuration and assets deployed (road from
Nelson and Christchurch marine terminals) - Identify practicalities which need to be taken into account - Statutory requirements
5.2 Analysis - calculate existing costs and economic value equivalent (on discounted
cashflow NPV basis) - test costs against road transport costing models
o include if gross weight limit increases from 44t to 50t - develop spreadsheet economic model extending out on a 20 year basis - ascertain appropriate rate of return for owner risk - areas of cost change (escalation/decline) - present draft findings - review and test model together and understand sensitivities and any
apparent weaknesses in logic - final model completed
5.3 Explore Options and Alternatives - possible partners and skill sets - sizing options (big and small tanks and ships) - ship scheduling - establish how logistics chain could work with other ports; validate
Gisborne as a logical choice - alternative ship configurations and options - test against possible rail based model - work through “non financial” benefits such as reduced carbon footprint - research as required; ensure existing knowledge base is leveraged
5.4 Risk Identification - analyse - mitigation opportunities
Report to Buller Port Services 15 May 2009
COMMERCIAL IN CONFIDENCE

Page 15 of 42
6.0 Existing Fuel volumes BPS obtained an estimate from one oil company of a current total regional volume of 90 million litres per annum (~72,000t13) for petrol and diesel. This figure has proved difficult to validate, as the market is split between four competing companies14 and data associated with market size and share is commercially sensitive. No Government source (from duty collection on petrol or otherwise) is known. In turn we have allocated this volume to towns (nodes) based on knowledge and discussion of major bulk users such as Stockton Mine, Oceana Gold mine and Westland Dairy Co-op.
Westport50%
Greymouth22%
Hokitika22%
Reefton6%
Figure 5 Estimated End fuel use location This volume and allocation is therefore imperfect; but does not invalidate conclusions as noted subsequently. The fuel supply “import” trade potential is one sixth the size of the existing cement “export” trade from Westport.
13 Assuming 0.8 average specific gravity; petrol is 0.739 and diesel 0.835 14 Plus potentially others competing for large single site contracts which would justify a logistics chain investment
Report to Buller Port Services 15 May 2009
COMMERCIAL IN CONFIDENCE

Page 16 of 42
7.0 Existing Logistics chain As previously noted, there is not “one” single logistics chain as the fuel is supplied from both Nelson and Woolston terminals.
0km
100km
200km
300km
400kmWestport
Greymouth
Hokitika
Reefton
From Port NelsonFrom Woolston
Figure 6 Distances from Terminals This is despite Westport (for example) being 53% further from Woolston than Port Nelson This may be due to a combination of the following factors:
- different port charges between Nelson and Lyttelton - road logistics rates reflecting travelling speeds on the different terrains (over
Arthurs Pass is considered a relatively tougher run) - competitive positioning between oil companies - stockholding and replenishment issues along with tanker availability and
utilisation Combining Figures 3 and 4 to analyse Megalitres travelled (litres x km) highlights that fuel distribution into Westport is the major task:
Report to Buller Port Services 15 May 2009
COMMERCIAL IN CONFIDENCE

Page 17 of 42
0
5
10
15
20Westport
Greymouth
Hokitika
Reefton
From Port NelsonFrom Woolston
Figure 7 Megalitres travelled by fuel from terminal source
In practical terms Westland task equates to 2600 road tanker loads15 (movements) a year. This seems a “large” figure but it is only 7 per day, which is extremely light use of State Highways. There are no 100% Westland dedicated road tankers, all are understood to do work in adjacent provinces to optimise fleet utilisation.
15 Maximum weight 44 tonne 8 axle units carrying 35,000 litres
Report to Buller Port Services 15 May 2009
COMMERCIAL IN CONFIDENCE

Page 18 of 42
8.0 Existing costs
8.1 Port – Primary Distribution from Ship While both Nelson and Lyttelton ports publish rate schedules, the actual rates charged to COLL and oil companies is understandably a matter for negotiation. Fuel is a minor trade for both these large ports but will clearly benefit from the economies of scale brought by other trades such as logs and containers. It is assumed that Westport charges per litre are the same as these two large (competing) ports for both berthage (“wet” or ship related services) and wharfage (“dry” or cargo related services). This is an optimistic assumption. One important reason why it is optimistic is that there is no tug based at Westport currently. Towage (tug) capability would be required to facilitate safe berthing and unberthing in all weather16 conditions, as it is in other NZ ports for fuel tankers. Landside (just off the wharf), virtually all costs of fuel farm land ownership (ground rent, rates, capital, R&M) are fixed with the exception of pumping which is negligible. Hence the fact that these costs are not available in the public domain for analysis is not a concern, as they are not saved by a new fuel farm at Westport. In fact we assume no diseconomies of scale occur which is optimistic.
8.2 Road – Secondary Distribution Our in-house truck costing model was used in a slightly modified form to analyse tanker costs applicable to maximum weight road tankers operating on the Port Nelson to Westland; and Woolston to Westland runs. The model provides a full costing taking into account capital costs (total $700k), residual values, variable operating costs, fixed operating costs and average road speeds achieved. Full utilisation assumed, but on a single shift basis. Inputs and outputs were obtained and checked in conversations with appropriate industry sources. As at 9 February 200917, a road tanker rate of 304c per running km was derived from the model. This yields the following cost position for fuels into Westland:
16 Added to the safety mix at Westport is river conditions 17 Diesel prices have since fallen. This change would apply similarly to ship fuel (bunkers) so comparisons are unlikely to be invalidated by this timing matter.
Report to Buller Port Services 15 May 2009
COMMERCIAL IN CONFIDENCE

Page 19 of 42
Current Cost (Preferred: adopting least distance in each case) is therefore: $000's c/litre
Nel-Wpt $1,725 47% 3.83c Wool-Gm $870 24% 4.35c Wool-Hok $884 24% 4.42c Nel-Rftn $186 5% 3.73c
$3,666 100% 4.07c
per day $10,044 Interestingly, fuel in Greymouth is generally retailed at the same price as in Christchurch18, indicating a cross subsidy by oil companies. However Westport fuel is retailed at a premium of approximately 3c. A lower level of subsidy is evident. However bulk (wholesale) users such as a South Island transport operator could buy diesel more cheaply near terminals, by “approximately 6c”19. This differential could be attributable to a number of factors including competitive positioning by oil companies and incentivising behaviour to fill close to ports.
8.3 Road – Tertiary Distribution This cost is the one of getting fuels from nodes (as modelled) to actual end users. For example the Stockton coal mine is 24km (uphill) from Westport. It is assumed that this cost is unchanged from the status quo; as the same road tanker logistics will be employed.
18 Own observations 19 Personal comment
Report to Buller Port Services 15 May 2009
COMMERCIAL IN CONFIDENCE

Page 20 of 42
9.0 Analysis This study is therefore concerned with Primary+Secondary fuel distribution costs being shipping into Westport and storage pending tertiary distribution. Appendix C is the fuel farm model in detail. It includes the following sections:
- Current Road Operations - Proposed Road Operations and Cost - Terminal (actual Fuel Farm) Operations of 3 x 2,200,000 litre tanks - Marine (Ship) Operations - Discounted Cashflow Model 20
An 8.2% tax paid Weighted Average Cost of Capital WACC is derived and employed. It is assumed that 100% of Westland fuel is shipped in. This is optimistic given oil companies investment in existing infrastructure outside the province and ongoing competitive jockeying. The (disappointing) Costing Outcome is as follows:
20 A 10 year horizon was ultimately adopted; essentially for simplicity as cashflow benefits beyond 10 years are of low present value and the shipping charter market will change in 10 years to a material extent
Report to Buller Port Services 15 May 2009
COMMERCIAL IN CONFIDENCE

Page 21 of 42
COMPARE LOGISTICS COSTS
0.3c 0.3c
5.1c
3.8c
6.0c
4.0c
1.1c
1.1c
0c
1c
2c
3c
4c
5c
6c
7cce
nts
per l
itre
Road 6.0c 4.0c 1.1c 1.1c
Terminal 0.3c 0.3c
Port 0.0c 0.0c
Ship 0.3c
Existing Westland wholesale
premium charged
Existing calculated
Proposed (206 days used)
Proposed; + 83 days chartered out
0.3c 5.1c 3.8c
Figure 8 Fuel Farm Model cost outcome Note that Port charges are set at 0c, which is the optimistically assumed incremental difference between Westport and Nelson/Lyttelton. A 3.0% compound annual growth rate in fuel volume is assumed; and that Westland fuel consumption increases slightly faster than GDP increase over the last two decades which is 2.6%. Refer Appendix F. The Net Present Value of this Fuel farm Project is negative $4.4M. From BPS perspective this is a large figure; overshadowing the projected $1.8M capital spend on the Westport Fuel farm. In summary, the existing logistics chain stands out as the least cost and best value option. Furthermore it is evident that Westland fuel volumes are insufficient to keep the right size ship fully occupied. Chartering out is essential to obtain economics.
Report to Buller Port Services 15 May 2009
COMMERCIAL IN CONFIDENCE

Page 22 of 42
Gisborne Even chartering out sufficient days to meet 100% of the fuel needs of Poverty Bay21 the achievable per litre rate into Westland is unexciting and involves far more complexity in terms of setup (in particular developing a new fuel farm at Port Gisborne too22) and ongoing scheduling/management. Again it is optimistic to expect that 100% of secondary tankerage would switch to a marine primary+secondary distribution option. On a more positive note it should not be overlooked that Westland region is benefitting from economies of scale on large ships into Nelson and Lyttelton. In particular, benefits from the low (0.3c) cost per litre of primary marine distribution are not lost in secondary distribution by road. Other Chartering Modelling as shown in Figure 8 above indicates that even meeting 100% of the needs of both Westland and Poverty Bay, there is 365-206-83 = 76 days available (a fifth of the year). Options to use this time might include topping up other marine terminals served by COLL or backloading Taranaki oilfields product from New Plymouth. However the ship scheduling/management task becomes exponentially more complex, becoming a key project influencer far and above BPS building a fuel farm. For this reason alone it would be essential to get project leadership from a shipping company. Smaller or cheaper ship? An obvious response is that use of a smaller ship might create an economic proposition. Or alternately that obtaining a better charter rate or purchase price would be a solution; which might even be feasible in the present market. Currently a USD10M cost for the ship is assumed, which is converted into a charter rate to yield a 6% return. This is to a degree arbitrary as charter rates are driven by supply and demand factors in the market. But long term, owners require a return to at least cover interest cost plus some premium for risk.
21 See Appendix D for analysis. This forestry (rather than mining and dairy) intensive region would appear to use about 1/3 the fuel of Westland. This analysis worked through independently in Gisborne leads to the reflection that 90,000,000 litres in Westland is a high estimate. 22 The former fuel farm at Port Gisborne was disestablished several years ago and the area is now used for the forestry trade which is in a growth mode
Report to Buller Port Services 15 May 2009
COMMERCIAL IN CONFIDENCE

Page 23 of 42
Assuming a (bargain) USD5M ship is found and bought or chartered, the position becomes:
COMPARE LOGISTICS COSTS
0.3c 0.3c
4.5c3.4c
6.0c
4.0c
1.1c
1.1c
0c
1c
2c
3c
4c
5c
6c
7c
cent
s pe
r litr
e
Road 6.0c 4.0c 1.1c 1.1c
Terminal 0.3c 0.3c
Port 0.0c 0.0c
Ship 0.3c 0.3c 4.5c 3.4c
Existing Westland wholesale
premium charged
Existing calculated
Proposed (206 days used)
Proposed; + 83 days chartered out
Figure 9 Cost profile if ship cost is halved
Report to Buller Port Services 15 May 2009
COMMERCIAL IN CONFIDENCE

Page 24 of 42
This is still not economically viable, as ship charter/ownership costs are small compared with fixed (crew) cost and bunkers:
PROFILE OF ANNUAL SHIP COSTS
$0.6M, 13%
$1.4M, 31%$2.6M, 56%
bareboat costing USD5M
Variable (incl fuel @ $432/t)
Fixed
Figure 10 Ship cost profile Interestingly, even a ship obtained at $nil cost yields a slight negative NPV.
Report to Buller Port Services 15 May 2009
COMMERCIAL IN CONFIDENCE

Page 25 of 42
The main Fixed Cost is Crew and two crews of 8 positions each are assumed, in line with NZ practise. If hypothetically the crew could be reduced to 2 x 6, position the comparative position is as follows:
COMPARE LOGISTICS COSTS
0.3c 0.3c
4.0c2.9c
6.0c
4.0c
1.1c
1.1c
0c
1c
2c
3c
4c
5c
6c
7c
cent
s pe
r litr
e
Road 6.0c 4.0c 1.1c 1.1c
Terminal 0.3c 0.3c
Port 0.0c 0.0c
Ship 0.3c 0.3c 4.0c 2.9c
Existing Westland wholesale
premium charged
Existing calculated
Proposed (206 days used)
Proposed; + 83 days chartered out
Figure 11 half cost ship (USD5M) + 6 position crews Obtaining such a cheap ship and low cost crewing would be a major challenge, even for a sophisticated ship management company. But even then the economic outcome is unsatisfactory. The Net Present Value of this option is still a $0.6M loss across the logistics chain as compared with Existing.
Report to Buller Port Services 15 May 2009
COMMERCIAL IN CONFIDENCE

Page 26 of 42
10.0 Carbon footprint Four tanker contractors serve Westland at present23. This tanker truck fleet is modern and would be achieving 1.6km per litre of diesel (or better) which means that around 300 litres of diesel are burnt on each round trip. Applying an emission factor of 2.68 kg CO2 equivalent per litre of diesel takes account of all greenhouse gas emissions24. Thus the carbon footprint per trip is 0.8t CO2 e. To purchase credits through a NZ retailer is estimated to cost $40 per tonne and no escalation is assumed. Thus the market price of road transport’s carbon footprint is around $32 per trip. This equates to 0.09c per litre of fuel delivered as compared to total road costs calculated at 4c per litre. For simplicity we have assumed that the carbon footprint of the new coastal tanker is equivalent to that saved from the avoided larger tanker trips into Nelson and Westport. This is probably optimistic. Even factoring in this environmental cost, the existing logistics chain is best.
23 Allied (ExxonMobil); Alexander (Shell), Aratuna Freighters (BP) and Hooker Pacific (Chevon/Caltex). Obviously these parties are stakeholders with varying degrees of vested interest in the Existing (status quo) 24 This figure and other GHG factors here are drawn from work by Catalyst R&D Limited www.catalystnz.co.nz
Report to Buller Port Services 15 May 2009
COMMERCIAL IN CONFIDENCE
Page 27 of 42
11.0 Other Findings For completeness, other findings are noted as follows:
- no major zoning issues for a wharf side tank farm are evident o relevant land is owned by the Port o usual planning process would be required (Model includes $50k cost)
which would require evidence on factors such as truck movements etc - rail does not stand out as a cost competitive alternative
o the logistically optimal fuel farm site for rail service would not be on a BPS site
o thus it would offer no help to the port to enhance it’s economies of scale o switching to rail would lose the competitive tension in the logistics chain
between ports by locking in Lyttelton which may lead to price creep in Westland
o doubts over rail line capacity exist as it is operating at close to maximum capacity (putting aside the current downturn in coal volumes which are hopefully a short term factor)
o detailed analysis has not been completed, but we have reviewed other work and applied similar metrics to conclude that rail does not offer a cheaper alternative
- tug & barge (slower and cheaper to operate) has been evaluated using the Model but not found to be viable
- no scenario is foreseeable in which the cement ships can backload this volume of fuel: o Holcim discharge ports are far from Marsden Point o Cement and fuel are specialised cargoes requiring specialised equipment
and any “combination” ship would have cost and weight penalties for the other trade
o Holcim’s experience backloading resin from New Plymouth into Nelson some years ago indicates that the risk of the fuel “tail” wagging the six times larger cement trade “dog” is high
- should 50t Gross Combination Mass road tanker operations become possible (as has been mooted) then road tanker costs would fall by 7-8% (Appendix E)
- the lack of financial viability means the project is unlikely to be attractive to another fuel industry player such as Gull (who it should be noted could not rationally hope to obtain 100% of the Westland market anyway)
- The Fuel Farm would not meet Development West Coast25 criteria for a loan: o While there are 2 x 8 new on ship positions these seafarers could live
anywhere in NZ as is the current practise; no new jobs are created absolutely locally (in fact some tanker driving jobs would be lost)
o No economic benefit is evident from the project 25 www.dwc.org.nz being the Westland development organisation which has a fund to disburse for good projects benefitting the region
Report to Buller Port Services 15 May 2009
COMMERCIAL IN CONFIDENCE

Page 28 of 42
12.0 Fuel Farm Risks and Mitigation A brief overview of key risks is as follows: Item # Risk/Event Risk
Mitigation Likelihood Consequences Level of
Risk 1 FUNDAMENTAL: Financial
viability poorer than status quo
None – stay with existing logistics
100% certain Project not viable
High
2 Volume shortfall
None – market demand decides volume. Note industry linked risks eg mining (in particular) and dairy
High; as projections err on the optimistic side
Project less financially viable than expected
High
3 Unhelpful competitive reaction from one or more oil companies or their shipping company COLL
Involve oil companies and COLL
High Project less financially viable than expected
High
4 Safe handling of fuels at Westport
In port tug of the appropriate size Good operating procedures, proven
Medium High Medium/High
5 Ship operating costs higher than assumed
Involve experienced ship management company before committing more capital to project
Medium Project less financially viable than expected
Low/Medium
6 Port unavailable eg
Long experience of
Certain Costs higher than expected
Low
Report to Buller Port Services 15 May 2009
COMMERCIAL IN CONFIDENCE

Page 29 of 42
Item # Risk/Event Risk Mitigation
Likelihood Consequences Level of Risk
from shoaling BPS staff in targeted dredging Tank farm sizing to provide sufficient stock between replenishment
as road tankers have to step in
7 Rail come up with a good offer
Lock in to expensive infrastructure, stranded assets
Very low Project less financially viable than expected
Low
8 Ship availability on assumed basis
Involve experienced ship management company
Low Project cannot start; stranded Tank farm assets
Low
9 Consenting Good process and preparation
Low Project not allowed
Low
10 Fuel product unavailable at Marsden Point/lock in
Overall logistics planning by oil companies with imports to other ports as required; road transport
Low Westland runs low on fuels
Low
11 Holcim cement plant closure
? ? High. Fuel volume would not be sufficient to pay for the necessary dredging to maintain operating drafts and keep the port open
High
Thus it can be seen that even if financial viability was proven there are a number of other important incremental risks requiring detailed consideration of mitigation measures.
Report to Buller Port Services 15 May 2009
COMMERCIAL IN CONFIDENCE

Page 30 of 42
13.0 Recommendations One Buller Port Services Limited and its shareholder should not invest further in the Fuel Farm Project at this time, as it is unlikely to produce a positive economic benefit. Two Note that involvement of a ship operator is fundamental to take the project further as in addition to ship management skills, there is a complex ongoing scheduling task, involving at least 3 discharge ports, to access the necessary market volume and therefore ship utilisation. Three This analysis should be discussed with Coastal Oil Logistics Limited (as the major incumbent tanker operator) at opportunity. However there is no urgency, for the following reasons: 1 The business case is not compelling, even with a considerable number of charter
days achieved for the unused time 2 The oil industry owners of COLL are consolidating and disinvesting in NZ26
3 In “consolidation mode” there is limited appetite for new investment in fuel farm facilities
4 More volume by ship from Marsden Point to Westport reduces economies of scale for their existing two ships
5 Safety issues are to the fore in any tanker operation and Gisborne (less navigationally risky than Westport) has previously been exited by COLL with safety concerns cited as a reason (which is debatable, however as ship owner their opinion matters)
Four This analysis should be discussed with Seafuels Limited at opportunity as a “growth” tanker business in the NZ market. Again there is no urgency.
26 Shell have publicly announced disinvestment plans; the exit of Exxon Mobil is rumoured
Report to Buller Port Services 15 May 2009
COMMERCIAL IN CONFIDENCE

Page 31 of 42
14.0 Summary The foregoing analysis shows that the Westland fuel market is simply not large enough to access the economies of scale benefits that a new coastal tanker service might provide. In fact the region is benefitting from economies of scale and competition from the existing logistics chain, which combines coastal shipping and road; with a high degree of central co-ordination by the four major oil companies. The assumptions made are on balance considered optimistic – in other words favourable to the fuel farm project. However the analysis yields an economic value loss of $4.4M. In operating terms this equates to a cost disadvantage of some 2c per litre of fuel delivered. Even by combining with Gisborne the necessary economic viability is not obtained. Again this is on conservative assumptions considering the additional complexity this second port call introduces. Please note that we reserve the right, but not obligation, to review the Model and views expressed as any new information comes forward. Liability We have taken all professional care; however the liability of Key Business Partners Limited and Vincent Pooch is limited to the fee for this work. This work is not to be relied on by parties other than Buller Port Services Limited and NZTA.
15.0 Appreciation We have received all the information and explanations we asked for from BPS staff. We acknowledge their input in the preparation of this Report, in particular the late Dave Skinner. Yours faithfully Key Business Partners Limited Vincent H Pooch Managing Director Qualifications: NZCE (Mech), Chartered Accountant, Member Institute of Directors, Associate Member Australian Institute of Mining and Metallurgy Email: [email protected]
Report to Buller Port Services 15 May 2009
COMMERCIAL IN CONFIDENCE

Page 32 of 42
Appendices A Buller Port Services Company profile B Sea Change funding application C Fuel Farm Model D Gisborne fuel volume analysis E 50t road tanker analysis F Westland GDP growth chart
References www.holcim.co.nz www.westportharbour.co.nz/ www.keypartners.co.nz Other – hard copy publications Buller District Council Westport Harbour Navigation & Safety Bylaws West Coast Integrated Regional Transport Infrastructure Plan (Draft for Comment) (GHD & Option One, May 2005) Buller District Council Zoning Plan NZ Refining Co Annual Reports (public company) Coastal Oil Logistics Limited Annual Reports (Companies Office website) Mokihinui Hydro Electric Power Proposal: Social Impact Assessment (Taylor Baines & Associates March 2008) Coal Berth Options Westport (Stuart Hughes Associates Limited April 2006) Port of Westport Review (prepared for The West Coast Development Trust by Beca Carter Hollings and Ferner March 2007) Wharf Upgrade for 10,000t Coal Shuttle Vessel – rough order of cost estimate
Report to Buller Port Services 15 May 2009
COMMERCIAL IN CONFIDENCE

Page 33 of 42
(prepared by Nick Barber MIPENZ October 07) Distribution of Motor Spirit in New Zealand (Marion W Ward, 1960 in NZ Geographer Volume 19 issue 2. This report preceded the opening of Marsden Point oil refinery) Barriers to Entry to the NZ Downstream Oil Market (ACIL Report to Ministry of Commerce July 2007). This report followed up the deregulation of the NZ petrol market in May 1988) Ship Operating Costs study HSH Nordbank/Ernst Young/Econum/Zweitmarket 2008, published annually
Report to Buller Port Services 15 May 2009
COMMERCIAL IN CONFIDENCE

Page 34 of 42
Appendix A COMPANY PROFILE
In early 1988 the government expressed a desire to remove itself from operating the Westport Harbour and held discussions with local councils, the then Westport Borough, and Buller District Council, offering the port and assets to them.
Following discussions the councils agreed to the offer and the government agreed to gift the assets of the Westport Harbour a sum of money to cover deferred maintenance to the local authorities.
The councils formed a management contract with Milburn New Zealand Ltd, the principal port user, to manage the operations on a day to day basis on behalf of the councils.
Milburn New Zealand Ltd, now Holcim (New Zealand) Ltd, then formed their subsidiary company – Buller Port Services Ltd to carry out this work.
The assets of the harbour included the dredger “Kawatiri”, pilot vessel/tug “James O’Brien”, all wharves, jetties and navigation aids, harbour office and assorted buildings, and an engineering workshop complete with an extensive range of engineering plant and equipment.
On 1 July 1988 Buller Port Services Limited assumed responsibility for the management of the port and harbour on behalf of the Buller District Council.
Buller Port Services Limited was split into two different areas of operation, the harbour and the engineering workshop, but on 1 December 2005 Buller District Council took over the running of the engineering workshop.
Since July 1988 major changes have occurred within the harbour operation. Among these has been the purchase of a hydrographic package enabling extremely accurate soundings to be carried out. The results allow precise loading to maximise cargo tonnage and enables the dredger “Kawatiri” to accurately target areas for clearance. The dredge “Kawatiri” also carries out dredging at Port Nelson and the Port of Greymouth earning extra revenue for the port.
Over a three year period from July 1997 until June 2000 coal shipments were made through the port using the largest barge in the Southern Hemisphere, 16,000 tons deadweight, “Union Bulk 1” (Sea-Tow Ltd). The majority of the shipments were to Australia and the success of the operation, from a harbour viewpoint, can be directly attributed to the innovative approach by harbour staff to the export potential from the Port of Westport.
In 2005, 184,000 tons of coal was barged from the Port of Westport to Australia and Lyttelton.
Report to Buller Port Services 15 May 2009
COMMERCIAL IN CONFIDENCE

Page 35 of 42
On an annual basis, in excess of 430,000 tons of cement is shipped from the Port of Westport to Onehunga, Wellington, Lyttelton, New Plymouth, Napier, Dunedin and Gisborne.
Report to Buller Port Services 15 May 2009
COMMERCIAL IN CONFIDENCE

Page 36 of 42
Report Appendix B Seachange Funding Application Appendix A: Application form Please complete all sections of this application form. If you believe the question is not relevant to your application, please enter N/A. Please complete and return by 5 pm on 31 October 2008.
Section 1 – Company details 1. LEGAL NAME OF APPLICANT: Buller Port Services Ltd 2. TRADING NAME: (if any) Buller Port Services Ltd 3. CONTACT PERSON:
Name Dave Skinner Title/role General Manager Address PO Box 335 Westport Phone: Fax and email: 03 788 8086 (Ph)
03 789 6269 (Fax) [email protected] (email)
4. GST REGISTRATION NUMBER: 31705240 5. PROFILE OF APPLICANT: Buller Port Services Ltd, a subsidiary of Holcim (New Zealand) Ltd, is essentially a management company
offering management services to the Buller District Council under contract. The Buller District Council is the owner of all assets and liabilities associated with the port. The key operational aspects of this management contract include: Commercial Management of the Port of Westport and its assets Harbourmaster Duties Management of various land and buildings owned by the BDC in and
around the port area Annual Turnover: $2.2m Annual Tonnage: 500,000 tonnes Staffing: 13 Major Assets: Merchandise, coal and fishing wharves; “Kawatiri” trailer suction
dredge; “Bob Gower” pilot vessel; wharf crane; various buildings and offices; various land parcels; navigation aides; hydrographic package; river training walls.
Major Customers: Holcim (New Zealand) Ltd (cement and cement related products), Solid Energy (coal), Commercial fishing vessels.
(a) Legal status: Limited liability company (b) Country of residence: New Zealand (c) Details of owners/ controllers: Owners: Holcim (New Zealand) Ltd
Country of residence: New Zealand (d) Financial information: Bankers: ASB
Most recent annual report: 2007/08 (e) Insurance: Types of cover held and $ cover:
Material damage $2.4m Vero Insurance NZ Ltd
Motor Vehicle, $Market Value, Liability $10m
Vero Insurance NZ Ltd Marine Hull $11m, Loss Charter Hire $1.8m Vero Marine Insurance Ltd Vero Insurance NZ Ltd
Report to Buller Port Services 15 May 2009
COMMERCIAL IN CONFIDENCE

Page 37 of 42
Allianz NZ Ltd Associated Marine Insurers Agent PTY Ltd Port Operators Liability $20m American International Group Punitive and Exemplary Damages $1m American International Group Employers Liability $0.5m American International Group Statutory Liability $0.25m American International group (f) Lawyers Name of law firm: Anthony Harper Ltd
Partner/contact person: Chris Weir Level 5, Anthony Harper Building 47 Cathedral Square PO Box 2646 Christchurch 8140 Telephone 03 379 0920 Fascimile 03 366 9277
(g) Number of qualified personnel employed by you:
Total number of personnel: 13 Types of qualifications: MBA, BA, Foreign Going Masters Certificates, Advanced Pilotage Certificates, Pilotage Licence for the Port of Westport, PFSO.
(h) Are you doing this for yourself or as an agent?
For yourself: YES As an agent: NO.
(i) Are you an undischarged bankrupt? NO
(j) Have you/your organisation ever had funding withdrawn from any other government entity? NO
(k) Are you facing any disciplinary actions / under supervisory conditions? NO
6. CAPABILITY/EXPERIENCE/REFERENCES/QUALIFICATIONS
(a) Details of capability in area Annual Report 2007/08 attached. (b) Details of experience in area Provide an overview of your organisation in the delivery of services for the coastal shipping sector to enable us to understand your business.
THE PRODUCTS AND SERVICES Berthing and Wharf Facilities Current vessel movements in and out of the port include, the two Holcim (New Zealand) Ltd cement carriers (MV “Milburn Carrier” II and MV “Westport”), the trailer suction dredge “Kawatiri”, and a number of commercial and recreational fishing boats. Additional vessels such as barges and bulk carriers are used for imported shipments of clinker and gypsum and for the export of coal. Naval and cruise ships use the port on an irregular basis. Occasional yachts and local and international vessels visit Westport to offload and collect cargo. The Holcim (New Zealand) Ltd cement carriers average approximately 2-3 vessel movements per week operating between Westport and the ports of Onehunga, New Plymouth, Wellington, Nelson, Lyttelton and Dunedin. At the height of the coal trade, 2-3 “Sea Tow” barges visited the port per month.
Report to Buller Port Services 15 May 2009
COMMERCIAL IN CONFIDENCE

Page 38 of 42
Coastal and Port Navigational Services BPS provides: • Weather, river and sea condition reports • Hydrographic surveys and bar depth readings to vessels • Pilot vessel services to larger vessels • Maintain the beacons and other navigational equipment • Give directions to vessels navigating the bar • Operate a tug, the “Bob Gower”. Port personnel can also provide assistance with oil spill control and cleanups. The port has a current Tier One Oil Spill Plan approved by the West Coast Regional Council and a qualified Regional Oil Spill Controller. Structure/Equipment Maintenance BPS operates a small engineering workshop which repairs and maintains dredge equipment and other harbour assets. Crew Transfer Large fishing trawlers require crew changes and transfers between the port and offshore vessels are facilitated by the “Bob Gower,” when shifts change during the hoki fishing season. Occasional transfers are made for health issues or ship maintenance work. Dredging BPS undertakes contract dredging with the Port of Nelson, a major customer of those services. Customs and Port Security BPS provides a customs control service, with the Harbour Master who is a qualified Port Security Officer. Property Leasing and Maintenance BPS acts as landlord to a number of Council owned properties in and around the Port. (c) Details of major customers and referees: Holcim (New Zealand) Ltd One of the two cement manufacturers in New Zealand. Business also includes lime, concrete and concrete product manufacturing. Total staff - 650 Annual turnover - $120m Product through the Port of Westport in excess of 500,000 tonnes per annum.
Holcim (New Zealand) Ltd Ross Pickwoth General Manager Cement PO Box 6040 Riccarton Christchurch (03) 339 7500 (business) 021 711 313 (mobile) [email protected] (email)
Solid Energy NZ Ltd The major coal producer in New Zealand. Production in excess of 4m tonnes of coal per annum. Stockton in the Buller region is the major location of operations. Product through the port has been as high as 180,000 tonnes per annum. Solid Energy NZ Ltd Chris Russell General Manager Group Logistics PO Box 1303 Christchurch Mail Centre Christchurch, 8140 (03) 345 6000 (business)
Report to Buller Port Services 15 May 2009
COMMERCIAL IN CONFIDENCE

Page 39 of 42
021 424 745 (mobile) [email protected] (email)
I have read the Domestic sea freight development fund: Guide for applicants and wish to lodge my application. SIGNED BY/FOR INTERESTED PERSON Signature: Name: Dave Skinner Title: General Manager Date: 28 October 2008
Section 2 – Project details Project name: Fuel Farm Feasibility Project. Project description Provide a short explanation of the purpose for which the funding is being sought Funding is being sought to carry out a feasibility study to assess whether it is economic to develop a fuel farm at the Port of Westport. The study will explore and complete an economic analysis of the potential supply of fuel arriving in port via ship from Marsden Point (with a possible fuel drop in the Port of Gisborne) rather than by truck and trailer units from Christchurch or Nelson as is current practice. The feasibility study will include costing an appropriate vessel, recommending an appropriate ship operating structure, costing an appropriate mode of operation, exploring the value of working with another port and costing necessary infrastructure. Provide a history of the project Following the launch of the Seachange Initiative, a rigorous effort was undertaken by Buller Port Services identifying and quantifying potential cargoes. Fuel was one product identified as a potential sea cargo. With the relatively recent extractive industry developments on the West Coast, fuel consumption has increased with a corresponding increase in the number of fuel truck movements. The volumes suggest there is merit investigating the economics of transferring this freight from road to sea. Discussions have taken place with potential partners. A fuel supplier, a facility operator and port management have had several meetings scoping a project. Issue to be addressed The proposal is to establish a fuel tank farm at Westport on Westport Harbour land with the capacity to meet most of the fuel requirements of the West Coast. The fuel will be freighted from Marsden Point via a specialist carrier to the Port of Westport, discharged into the tank farm and dispensed by road tankers to each user site. The rationale for the proposal is based on five premises.
• The consumption of fuel on the West Coast has increased. • Potential to reduce the current carbon footprint. • Support for the government’s “Seachange Initiative” by encouraging coastal shipping. • Potential availability of funds for the development from the Seachange Initiative. • Favourable economics for Buller Port Services, the fuel supplier and customers.
The Port of Westport has land available to establish such a facility, the supplementary services required to facilitate shipping and a supportive District Council. The outlook for extractive industry growth on the West Coast is positive which would suggest a projected increase in the volume of fuel required for operations.
Report to Buller Port Services 15 May 2009
COMMERCIAL IN CONFIDENCE
Page 40 of 42
Research has been undertaken that indicates in excess of 90,000,000 litres of fuel are consumed annually on the West Coast. The issue is that at present this fuel is trucked into the West Coast by road tanker from Christchurch or Nelson, annual truck movements in excess of 5,400. Major Fuel Users include: Solid Energy NZ Westland dairy Company Pike River Coal Hoods Contracting Holcim (New Zealand) Ltd Spring Creek Coal Kaipara Contracting Oceana Gold Domestic Consumption Explain the issue that you have identified that you wish to address, eg: ‘Through research we have undertaken (sample data attached), we have identified that demand exists to provide an additional service between x and y. Our projections (attached) indicate that demand will continue to increase on this route over the period 200x–20xx. How will the issues addressed contribute to the objectives of the New Zealand Transport Strategy 2008 and Sea change? Does the proposal assist in the broad aims of Sea change? That is, how will it help meet the expected growth in freight and how will it help develop domestic sea freight activities? Does the proposal also contribute to any other LTMA objectives? The broad aims of the “Seachange” initiative are summarised below: Congestion “Our dependence on road transport is exacerbating the congestion in our cities, constraining our capacity for growth and compounding the serious problem of our greenhouse gas emissions” “New Zealand’s roads are becoming increasingly congested. Traffic congestion negatively impacts the freight industry and makes our entire economy less competitive.” Environmental Sustainability “Greater sustainability in our resource use and way of life” “Coastal shipping remains the most environmentally friendly option we have for moving freight” “Addressing climate change, while advancing long term environmental sustainability…” “…reducing per capita emissions from the transport sector by half by 2040.” “A significant increase in sea freight’s share of a rapidly expanding domestic freight market is entirely consistent with the government’s goals of economic transformation and environmental sustainability.” “ Greenhouse gas emission reductions can result from mode shifts from higher carbon-emitting modes (such as road transport) to lower carbon-emitting modes such as shipping” “coastal shipping offers environmental benefits, through greater fuel efficiency per tonne-kilometre and lower greenhouse gas emissions, than other modes.” “…the more inter-regional freight that can be carried by coastal shipping, the better for our roading network and the better for our environment.” Encouraging Coastal Shipping “…our goal is for coastal shipping to be carrying at least 30% of all inter-regional domestic freight in NZ by 2040” “…domestic sea freight …..offers much better fuel efficiency per tonne kilometre.” “….involves providing targeted funding to “kick start” proposals which are sustainable and have economic benefits.” “Coastal shipping offers cost benefits to freight users.” “…government will be supporting efforts to give freight users a choice of transport modes, and encouraging them to choose the mode…in their own commercial best interests but also in the best interests of New Zealand as a sustainable nation” The proposal to determine the viability of establishing a shipping operation as an alternative to the current trucking operation meets all of the broad aims of “Seachange” outlined above. Potentially switching from in excess of 5,400 long haul annual truck and trailer movements over a relatively difficult terrain to a combination of coastal shipping and short haul movements by truck and trailer, the study should be able to quantify
• the improved carbon footprint of a change to the mode of operations • the potential economic benefits that may encourage a switch • the increase in the volume of freight carried by coastal shipping • the improvement to traffic congestion
How will you implement and manage this project? Provide details of the process implementation and methods to manage the project, including risk assessment/register. If you have a project management system already in operation, then supply details of that as an attachment.
Report to Buller Port Services 15 May 2009
COMMERCIAL IN CONFIDENCE

Page 41 of 42
The feasibility study will be conducted by a recognised and preferred consultant of Holcim (New Zealand) Ltd: Vincent Pooch NZCE (Mech) CA Director: Key Business Partners Limited...Corporate Advisors Phone: +64 3 365 5605 Mobile: +64 21 338 136 Visit our website: www.keypartners.co.nz Vincent Pooch is a current Director on the Board of the Port of Otago and has an excellent understanding of port operations, having been involved in a numerous port and shipping projects and as an advisor for Holcim (New Zealand) Ltd. He has been chosen as the preferred consultant on the basis of successful completion and high quality work of projects for Holcim (New Zealand) Ltd. Vincent Pooch has advised that the study would be completed within two months of being advised that the funding application has been successful. Vincent Pooch will work with the support of Buller Port Services Ltd management. A scope for the project has been agreed. Milestones for outcomes, reporting and project timeframe will be agreed. Payment for the project will be upon the completion of the feasibility study report. How will you operate and manage this project? Provide details of the operational processes that you will apply once the service/facility is running/installed. If you have a project management system already in operation, then supply details of that as an attachment. Where is the service/facility to be operated between/located? Describe the location or attach a map indicating the route or position of the facility if applicable. What alternatives are there to providing this service/facility? Detail what other considerations have been taken into account in preparing your application. For example, are there other service providers on a route? Are similar facilities available at a neighbouring port? Explain why the alternative is not the preferred option. The project has had input from potential partners, with Buller Port Services being the principal instigator. Because of the numerous variables and uncertainties and a recognised lack of expertise in key components for a study, a consultant was selected as the best option to progress the idea to the point of economically proving or disproving the concept rather than conduct a study in house. Trucking is the current choice of transport. Rail is not a viable option given the volume constraints of the Midland Line and the annual volumes of fuel. It is the view of the writer that a shipping option would be the preferred alternative. There are no existing facilities on the West Coast of the South Island and it would be assumed that the Port of Westport Fuel Farm would be the source of fuel for the whole of the West Coast. The Port of Greymouth as an alternative option as in location has limited infrastructure, a lack of marine expertise and a more difficult harbour entrance to navigate compared to Westport. What options have been considered? Options are variations to a proposal. Detail those that have been considered, eg: ‘A service between x, y and z was considered but, to ensure reliability on the route, a service between x and z only was selected.’ An option discussed was to carry out the feasibility study in house but it was agreed that the level of expertise required and time and financial constraints were such that it was not possible to consider this as a serious option. It has been decided to also include the Port of Gisborne in the study to improve the economics of the shipping given the size constraints of a specialised ship accessing the Port of Westport. Fuel to Gisborne is currently delivered via truck and trailer units from Napier and it is expected that similar potential benefits expected at the Port of Westport will be accrued at the Port of Gisborne should the concept be proven.
Section 3 – Financial details Provide all details in $m.
Report to Buller Port Services 15 May 2009
COMMERCIAL IN CONFIDENCE

Page 42 of 42
Year 1 Total Cost $0.020 NZTA contribution sought $0.020 Funding from other public sector Organisations
$0
Funding from private organisations $0 Reinvestment of own funds $0 Funding from other sources $0 Total funding from all sources $0.020 Please state the year and quarter on which your estimates are based, eg 2007 Q3
2008 Q4
Section 4 – Risk assessment Has a risk assessment been undertaken? (If yes, please attach copy.) Where a risk assessment has not been undertaken, list the possible risks associated with the service/ facility/training being successfully delivered and then operated. What mitigation measures are proposed in relation to either the risk assessment attached or those risks identified above? Risk Level of Risk Mitigation Measure Incomplete analysis due to lack of information
Low Selection of highly qualified consultant with particular expertise in port and marine operations.
Time to complete feasibility study Low Management of agreed milestones, contracted timeframe, reputation of selected consultant, payment for study on completion of report.
Section 5 – Economic evaluation NA
Report to Buller Port Services 15 May 2009
COMMERCIAL IN CONFIDENCE