alaska shellfish farm size feasibility study
TRANSCRIPT

AL
AS
KA
SH
EL
LF
IS
H F
EA
SI
BI
LI
TY
ST
UD
Y
1
1M A R C H 2 0 1 5
Alaska Shellfish Farm Size Feasibility Study

Bill Walker Governor
State of Alaska
Chris Hladick Commissioner
Department of Commerce, Community, and Economic Development
Matt Catterson Economic Development Adviser
Division of Economic Development
May 2015
Table of ContentsExecutive Summary
Introduction
Purpose
Methods
General Assumptions
Farm Size Scenarios
Oyster Farm Scenarios Results
Geoduck Farm Scenarios Results
Combined Oyster and Geoduck Farm Scenarios Results
Multi-Species Production Assessment
Farm Scenario Comparisons
Key Findings
Recommendations
Appendix A. Farm Model Assumptions
Appendix B. Catagories of Expenses
2
4
5
5
7
8
10
17
25
34
36
39
41
43
47
AL
AS
KA
SH
EL
LF
IS
H F
EA
SI
BI
LI
TY
ST
UD
Y
2
MethodsTo determine farm size efficiencies, a shellfish farm finan-cial model was constructed to assess small, medium, and large size scenarios for: 1) farms producing oysters, 2) farms producing geoducks, and 3) farms producing both oysters and geoducks. For each farm size and type, the model makes a variety of detailed assumptions (Appendix A) to estimate the production volume, expenses, and potential revenue. Profitability was assessed over ten and twenty-year opera-tional periods by comparing profit schedules and metrics of cost per unit, net present value (NPV), and internal rate of return (IRR). Price sensitivity analysis was conducted for each scenario to quantify the effect of variable shellfish market price on farm profitability.
Key Findings and RecommendationsFarm SizeRegardless of farm type, larger farm size scenarios demon-strated better short and long-term profitability (measured by annual income, NPV, and IRR) than smaller size scenarios. Small farms in Alaska, particularly those producing only oysters, will likely face significant challenges in overcom-ing operational expenses to produce sustainable positive revenue. These farms may improve their financial competi-tiveness by scaling-up production or entering into a coop-erative business structure that allows for sharing of costs and benefits between multiple farms. New entrants into the Alaska shellfish farming industry should consider long-term investments in medium or large-scale farms. However, farm size cannot overcome the fundamental challenge of delayed production and sales due to slow shellfish growth in cold Alaska waters. Therefore, financing programs may better support the development of the mariculture industry if repay-ment requirements were aligned with the longer-term profit horizons outlined in this study.
OverviewThe shellfish mariculture industry in Alaska is often described as a promising opportunity to cultivate sustain-able economic activity in coastal communities. However, despite an improved regulatory environment, advance-ments in farming methods and technology, and increased public support, the shellfish industry in Alaska has shown inconsistent growth over the past two decades and today remains a niche industry predominantly comprised of small farms under five acres in size. While industry sales grew by an impressive 37% in 2013, the total value of the industry was still only $769,145.1
The prevalence of small shellfish farms in Alaska reflects the trend of slow growth in the current Alaska mariculture industry. Many small farms struggle to overcome the basic challenges of shellfish farming in Alaska, and the viability of larger shellfish farms utilizing efficient culture methods remains largely unknown. This study assesses the growth opportunity for Alaska’s shellfish industry by examining the potential profitability of various sizes of farms producing Pacific oysters (Crassostrea gigas), geoduck clams (Panopea generosa), or a combination of both.
The goal of this study is to provide key information for cur-rent and prospective Alaska shellfish farmers and investors, and those engaged in the development and management of the industry. This information will: • Provide guidance on the size of farm necessary to
achieve operational efficiencies.• Assess the potential importance to product diversity to
Alaska shellfish farms.• Describe key expenses where farms may be able to
save money.• Describe the effect of variable market prices on farm
profitability.• Inform management and development efforts by State
and regional entities.
Executive Summary
1 http://www.adfg.alaska.gov/index.cfm?adfg=fishingaquaticfarming.aquaticfarminfo_value_data
AL
AS
KA
SH
EL
LF
IS
H F
EA
SI
BI
LI
TY
ST
UD
Y
3
ExpensesFor all farm type and size scenarios, operating and personnel expenses were the most significant costs. Fundamentally, revenues generated by increased production combine with efficiency gains in larger farm scenarios to overwhelm any increased production expenses and contribute to significant decreases in per unit costs.
Price SensitivityThe market-price sensitivity analyses demonstrated that incremental changes to the price received by farmers for their product can significantly improve the overall profit-ability of the farm. The profitability of larger farms was more sensitive to changes in market price, regardless of the type of shellfish produced. Across all farm sizes, the oyster farm scenarios showed greater improvement with increased mar-ket price than the geoduck farm scenarios; the combined oyster and geoduck farm scenarios showed intermediate price sensitivity.
Farm Type/Product DiversityProduct diversity may prove to be important to the profit-ability of shellfish farms in Alaska. This study shows that farms producing only one type of shellfish will generate less revenue than farms producing multiple species, and may not be fully utilizing their investments in infrastructure, equipment, and labor. However, there may be significant technical, operational, and regulatory challenges to diversifying shellfish farm produc-tion. Management agencies, industry groups, and researchers should support farm diversification efforts. The regulatory and permitting process needs to accommodate diverse farm oper-ations and research and development efforts should focus on overcoming technical challenges to growing shellfish species in Alaska.
Oyster Farms: Oyster farms achieve the lowest cost per unit because of the high-volume production. The small oyster farm scenario, which describes many of the farms currently operating in Alaska, faces the greatest challenges in achieving profitability in both the long and short terms. The combina-tion of larger farm size and higher market prices may allow a medium size oyster farm to generate significant profits over a ten-year period.
Geoduck Farms: Because of the high value of geoducks, all farm sizes may be capable of generating positive cash flow by year ten. In general, this study suggests that geoduck farms may generate substantial long-term returns on investment if they are able to accommodate short-term negative cash flows. Increases in farm size and market price will significantly improve long-term profitability.
Combined Oyster and Geoduck Farms: The combined farm scenario blends the profitability projections of each individual product line, so that the initial revenue delay from geoduck production is partially buffered by oyster harvest and sales. Across all size scenarios, the potential long-term profitability of the combined farm greatly exceeds that of the oyster-only farm scenario and is slightly better than the geoduck-only farm scenario.
Site SelectionThe distance of a farm from a regional transportation hub or population center is a critical consideration. Co-locating or clustering farms near each other may allow for valuable cost-reducing business collaborations.
Business PlanningWhile long-term planning is difficult for a developing indus-try, new and existing mariculture farmers in Alaska should develop long-term business plans based on a twenty-year operational period. Farmers should consider front-load-ing investments in critical infrastructure and equipment necessary to produce larger volumes of shellfish in order to create more efficient farm operations that will generate the revenues necessary for profitability. The State of Alaska Mariculture Loan Program is an option that provides Alaska farmers with the capital to invest in these important farm components.
Business ModelThe price sensitivity analysis demonstrates that higher market prices earned by high-quality shellfish products can signifi-cantly improve the overall profitability of all farm scenarios. These higher prices can likely only be achieved through the direct marketing and sales to consumers or restaurants. Vertical integration is a critical component of shellfish farms that was not considered in this farm model, however, farms may benefit by establishing the capacity to process, ship, and sell their product directly to specific markets. Farmers should consider the cooperative farm model as an opportunity to collectively achieve economies of scale and disperse some of the additional costs of direct marketing and sales. These investments have the potential to significantly improve the overall financial outlook of the farm over the long-term.
AL
AS
KA
SH
EL
LF
IS
H F
EA
SI
BI
LI
TY
ST
UD
Y
4
Shellfish mariculture, the farming of oysters, clams, and other bi-valves in marine environments, is not new to Alaska. As far back as the early 1900’s, Pacific oyster (Crassostrea gigas) seed was imported from Japan and used to cultivate beaches in Southeast Alaska. This early industry persisted through the 1960’s but was significantly challenged by the difficulties of remote farming locations, undercapitalization, and slow oyster growth. Since those early days, shellfish farming in Alaska has developed slowly and with intermittent success.
The passage of the Aquatic Farm Act in 1988 provided the reg-ulatory framework and capacity for the state to manage and support economic opportunities for shellfish farming in Alaska. Alaska shellfish farmers today benefit from an improved regula-tory environment, technical assistance, and increased industry support from state agencies, the University of Alaska, and industry groups. The industry has progressed and modernized to utilize culture methods that improve shellfish growth and quality, and increase labor efficiency. Despite these advances, persistent challenges of a cold growing environment, remote farm sites, high operational costs, inconsistent seed supply, and limited workforce capacity continue to stifle shellfish industry growth in Alaska.
In 2013, 68 shellfish farms operated across Southeast and Southcentral Alaska, which is slightly above the 24 year aver-age of 62 annually permitted farms.2 Typically, less than half of these farms were selling product, reflecting the inherent challenges for Alaska farmers to bring shellfish to market (Figure 1).
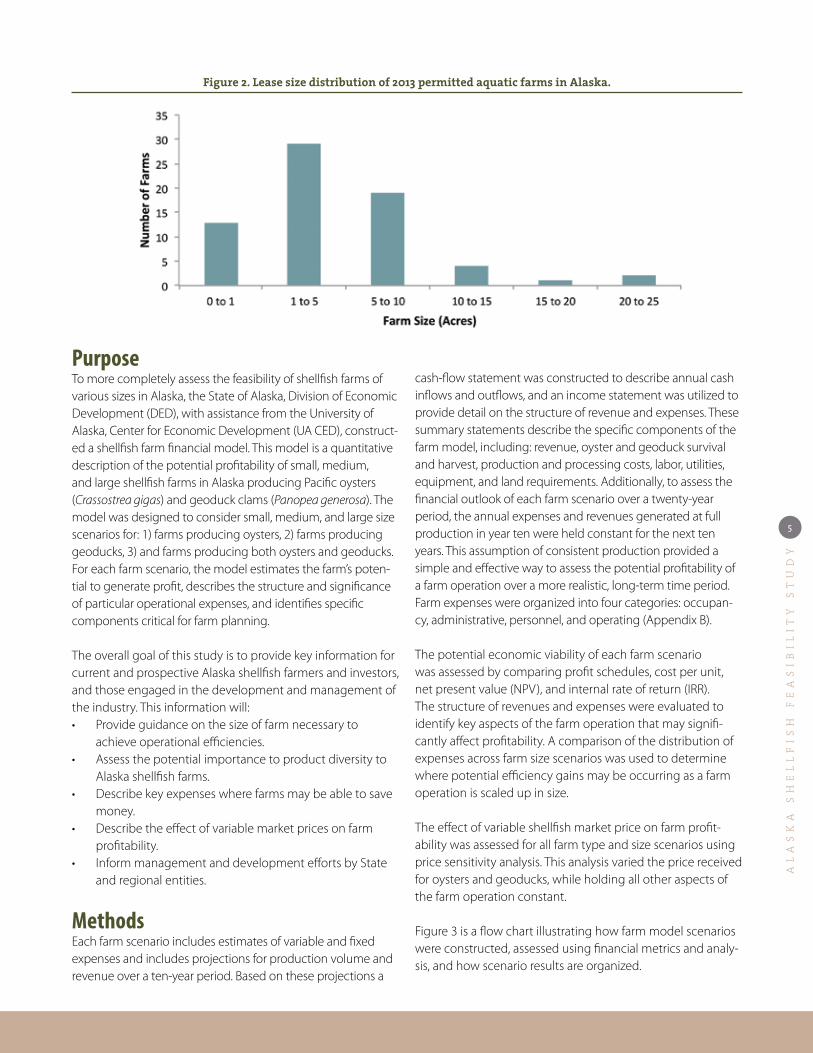
Over 90% of the permitted Alaska farms held leases of ten acres or less in size, and 70% of leases were less than five acres (Figure 2). In 2013 the largest lease size in Alaska was over 23 acres, the average size was five acres, and the most common size was 0.99 acres.2
In an effort to encourage sustainable operations, industry experts and managers advise new entrants into the Alaska shellfish industry to start with small operations and scale up over time. However, the lack of growth in the number of operational farms in Alaska and the prevalence of small farms may reflect the current challenges limiting the industry today. This study was commissioned to investigate the potential profitability and operational efficiency of various shellfish farm sizes and types in Alaska, which may represent an opportunity for industry growth and development.
Introduction
2 http://www.adfg.alaska.gov/index.cfm?adfg=fishingaquaticfarming.programinfo+
Figure 1. Permitted farms with and without sales in Alaska.
AL
AS
KA
SH
EL
LF
IS
H F
EA
SI
BI
LI
TY
ST
UD
Y
5
PurposeTo more completely assess the feasibility of shellfish farms of various sizes in Alaska, the State of Alaska, Division of Economic Development (DED), with assistance from the University of Alaska, Center for Economic Development (UA CED), construct-ed a shellfish farm financial model. This model is a quantitative description of the potential profitability of small, medium, and large shellfish farms in Alaska producing Pacific oysters (Crassostrea gigas) and geoduck clams (Panopea generosa). The model was designed to consider small, medium, and large size scenarios for: 1) farms producing oysters, 2) farms producing geoducks, 3) and farms producing both oysters and geoducks. For each farm scenario, the model estimates the farm’s poten-tial to generate profit, describes the structure and significance of particular operational expenses, and identifies specific components critical for farm planning.
The overall goal of this study is to provide key information for current and prospective Alaska shellfish farmers and investors, and those engaged in the development and management of the industry. This information will: • Provide guidance on the size of farm necessary to
achieve operational efficiencies.• Assess the potential importance to product diversity to
Alaska shellfish farms.• Describe key expenses where farms may be able to save
money.• Describe the effect of variable market prices on farm
profitability.• Inform management and development efforts by State
and regional entities.
MethodsEach farm scenario includes estimates of variable and fixed expenses and includes projections for production volume and revenue over a ten-year period. Based on these projections a
cash-flow statement was constructed to describe annual cash inflows and outflows, and an income statement was utilized to provide detail on the structure of revenue and expenses. These summary statements describe the specific components of the farm model, including: revenue, oyster and geoduck survival and harvest, production and processing costs, labor, utilities, equipment, and land requirements. Additionally, to assess the financial outlook of each farm scenario over a twenty-year period, the annual expenses and revenues generated at full production in year ten were held constant for the next ten years. This assumption of consistent production provided a simple and effective way to assess the potential profitability of a farm operation over a more realistic, long-term time period. Farm expenses were organized into four categories: occupan-cy, administrative, personnel, and operating (Appendix B).
The potential economic viability of each farm scenario was assessed by comparing profit schedules, cost per unit, net present value (NPV), and internal rate of return (IRR). The structure of revenues and expenses were evaluated to identify key aspects of the farm operation that may signifi-cantly affect profitability. A comparison of the distribution of expenses across farm size scenarios was used to determine where potential efficiency gains may be occurring as a farm operation is scaled up in size.
The effect of variable shellfish market price on farm profit-ability was assessed for all farm type and size scenarios using price sensitivity analysis. This analysis varied the price received for oysters and geoducks, while holding all other aspects of the farm operation constant.
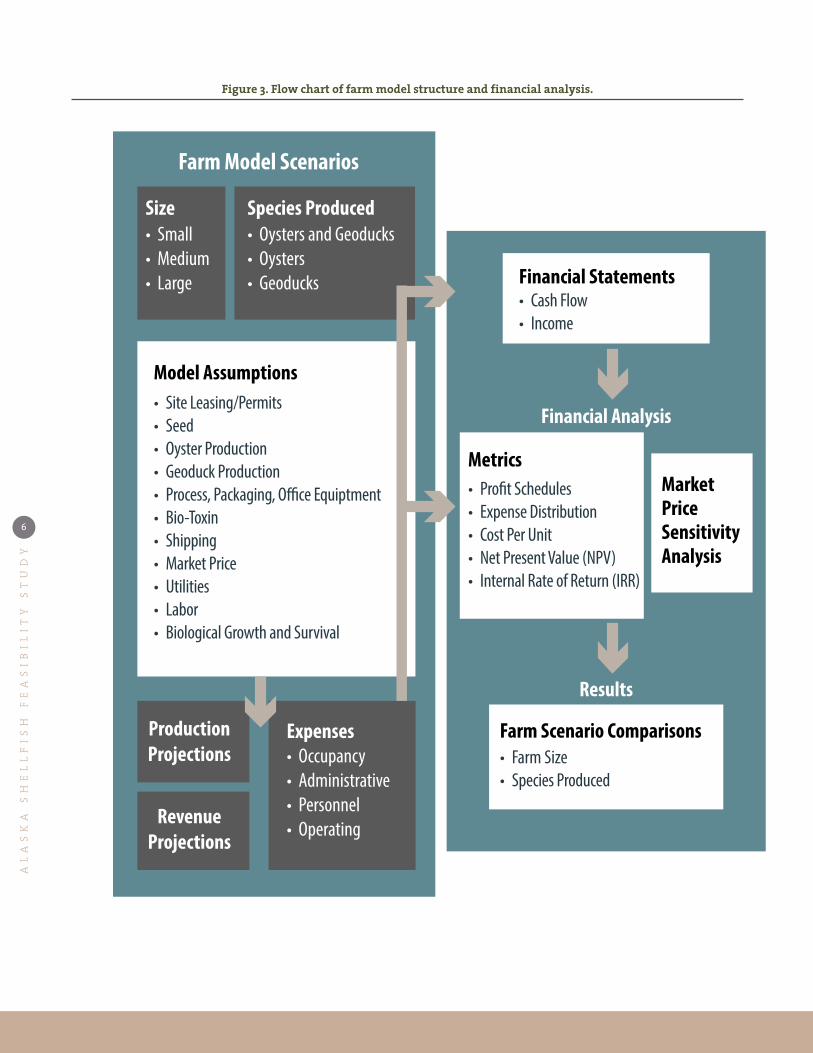
Figure 3 is a flow chart illustrating how farm model scenarios were constructed, assessed using financial metrics and analy-sis, and how scenario results are organized.
Figure 2. Lease size distribution of 2013 permitted aquatic farms in Alaska.
AL
AS
KA
SH
EL
LF
IS
H F
EA
SI
BI
LI
TY
ST
UD
Y
6
Farm Model Scenarios
Financial Analysis
Results
ProductionProjections
RevenueProjections
Expenses• Occupancy• Administrative• Personnel• Operating
• Site Leasing/Permits• Seed• Oyster Production• Geoduck Production• Process, Packaging, Office Equiptment• Bio-Toxin• Shipping• Market Price• Utilities• Labor• Biological Growth and Survival
Model Assumptions
• Small • Medium• Large
Size Species Produced• Oysters and Geoducks• Oysters• Geoducks Financial Statements
• Cash Flow• Income
Farm Scenario Comparisons• Farm Size• Species Produced
Metrics• Profit Schedules• Expense Distribution• Cost Per Unit• Net Present Value (NPV)• Internal Rate of Return (IRR)
MarketPriceSensitivityAnalysis
g
g
g
gg
Figure 3. Flow chart of farm model structure and financial analysis.

AL
AS
KA
SH
EL
LF
IS
H F
EA
SI
BI
LI
TY
ST
UD
Y
7
General AssumptionsOperational• Farm is assumed to operate year-round.• No formal nursery system is incorporated in the farm
model. Oyster seed is assumed to be purchased from a nursery at a size of 20-30 millimeters for $45 per 1000 oysters. Three millimeter geoduck seed is assumed to be purchased for $0.30 per geoduck. There is likely to be variability in seed price and availability that is not accounted for in this model, but these conservative esti-mates were based on input from Alaska shellfish farmers and describe current industry seed supply.
• No scaling up of production within size scenarios is incorporated in the farm model. For each farm size sce-nario, annual seed amounts are assumed to be the same each year to maximize consistent production over the time periods considered. Annual seed amounts for each size scenario and farm type are detailed in Appendix A, Table 3.
• A five year oyster harvest cycle is assumed based on input from Alaska shellfish farmers. After three years 35% of the originally planted seed is lost to mortality and 20% of the surviving seed is harvested. In year four, 60% of the remaining oysters are harvested, and in year five 95% of the remaining oysters are harvested. The slowest growing 5% are discarded.
• A simple eight year harvest cycle is assumed for geo-ducks, where one-third of originally planted seed survive to be harvested in year eight.
• Both oyster and geoduck production assumes an annual crop rotation and planting cycle. Target shellfish seed amounts are planted each year and production costs for seed, gear, etc. are calculated based only on those annual seed amounts. As shellfish are harvested, it is assumed gear and acreage are reused for subsequent plantings.
Financial• For each farm size scenario it is assumed that start-up
capital is available to cover initial expenses and no loan or debt repayment is necessary.
• The base farm model assumed a wholesale price to farmers of $0.75 per oyster and $15 per geoduck; these conservative price assumptions were based on input from Alaska shellfish farmers. Price sensitivity analysis was used to assess the effect of variability in assumed prices on farm profitability. These price assumptions do not incorporate any consideration of price variability related to size or quality grading.
• Harvested shellfish are assumed to be shipped to the nearest town and sold to a processor or similar buyer who processes and packages the shellfish for market sales. Product shipping costs from farm to buyer are assumed to be covered by the buyer in addition to product cost.
• Several components of the farm model, including grow-out time and shipping and the transportation costs, may vary significantly depending on where in Alaska the farm is located. These are important aspects of the farm operation that may significantly impact the production, expenses, and overall profitability of farms. In cases where significant regional variation occurs, conservative statewide estimates were assumed based on input from Alaska shellfish growers and regional cost information.
• Estimates of useful life were used to calculate depre-ciation costs for each piece of farm equipment. An itemized account of useful life estimates can be found in Appendix A, Table 5.
Production Methods• Shellfish grow-out and harvest assumptions utilize the
best available information on raft and tray production techniques for oysters and inter-tidal PVC tube grow-out methods for geoducks in Alaska. The many unique envi-ronmental and operational characteristics of farms across the state have led to a diversity of production techniques being utilized by Alaska shellfish farmers. The grow-out methods assumed in the model have been recognized for their efficiency and capacity to produce a high-qual-ity shellfish product.
• Farm model culture methods produce whole-shell oys-ters and geoducks that are typically sold in quantities of a dozen or greater.
This model generally assumes the farm will utilize best available practices related to farm siting, production, and operation, but it must be acknowledged that there exists significant individual variability in the operation of any farm in Alaska. A variety of environmental, geographic, economic, and operational farm characteristics will influence the details of how a shellfish farm is operated and its potential profit-ability. It is important to appreciate that this is a generalized Alaska shellfish farm model that does not attempt to describe the breadth and diversity of shellfish farming operations currently occurring across the state.
A detailed description of all the assumptions made for each component of the farm model is included in Appendix A.
AL
AS
KA
SH
EL
LF
IS
H F
EA
SI
BI
LI
TY
ST
UD
Y
8
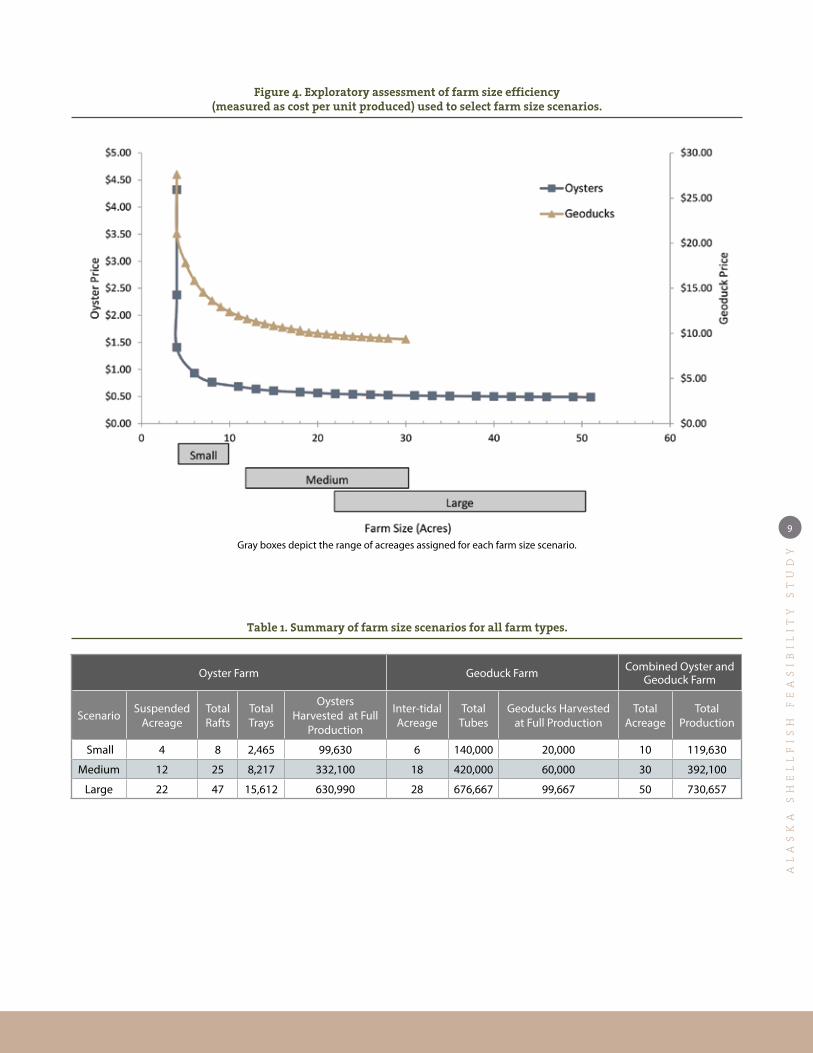
Farm Size ScenariosThe farm size scenarios selected for assessment in this model represent a sample of the acreages and production volumes that may be feasible in Alaska. Small, medium, and large size scenarios for each type of farm were selected to capture the variation in production efficiency that may occur in Alaska farms.
To determine the acreage assumed for each size scenario, the base farm model was run at a range of different sizes, and changes in production efficiency, quantified as cost per unit, were assessed. For each farm type, cost per unit decreased significantly as farm size and production volumes grew and then began to plateau at larger farm sizes (Figure 4). To represent this variation small, medium, and large farm sizes were selected for oyster-only and geoduck-only farms that fell within each phase of the changing slope of the efficiency curves (Figure 4). Acreages for the combined oyster and geoduck farm scenarios were determined by simply adding together the oyster-only and geoduck-only farm acreages in each size scenario.
Annual survival and harvest assumptions allow for back- calculation to the amount of seed required to produce target quantities of market size shellfish. The exact acreages for each size scenario represent the area required to accommodate the grow-out gear necessary to reach target shellfish produc-tion numbers and farm size (Table 1). It is assumed that 0.46 acres of sea surface are needed to support a single oyster grow-out raft, which can accommodate approximately 50,000 to 100,000 oysters depending on size. Acreage required for geoduck farming is dependent on the quantity of tubes planted; 20,000 tubes require around 0.8 acres of land (pro-duction assumptions are detailed in Appendix A).
This method represents an attempt at assessing a range of farm sizes that may be feasible in Alaska, with a focus on potential variation in production efficiency. These size scenarios also generally match existing shellfish farm mod-els for Alaska, British Columbia, and Virginia. The small and medium size scenarios align with the lease sizes of farms currently operational in Alaska according to farm size data from the Alaska Department of Fish and Game (ADF&G) Mariculture Program.
AL
AS
KA
SH
EL
LF
IS
H F
EA
SI
BI
LI
TY
ST
UD
Y
9
Oyster Farm Geoduck Farm Combined Oyster and Geoduck Farm
Scenario Suspended Acreage
Total Rafts
Total Trays
Oysters Harvested at Full
Production
Inter-tidal Acreage
Total Tubes
Geoducks Harvested at Full Production
Total Acreage
Total Production
Small 4 8 2,465 99,630 6 140,000 20,000 10 119,630
Medium 12 25 8,217 332,100 18 420,000 60,000 30 392,100
Large 22 47 15,612 630,990 28 676,667 99,667 50 730,657
Gray boxes depict the range of acreages assigned for each farm size scenario.
Figure 4. Exploratory assessment of farm size efficiency (measured as cost per unit produced) used to select farm size scenarios.
Table 1. Summary of farm size scenarios for all farm types.
AL
AS
KA
SH
EL
LF
IS
H F
EA
SI
BI
LI
TY
ST
UD
Y
10
Oyster Farm Scenarios
ScenarioAcreage Gear Annual Production
Submerged Acreage Total Rafts Total Trays Oysters Harvested at Full Production
Small 4 8 2,465 99,630
Medium 12 25 8,217 332,100
Large 22 47 15,612 630,990
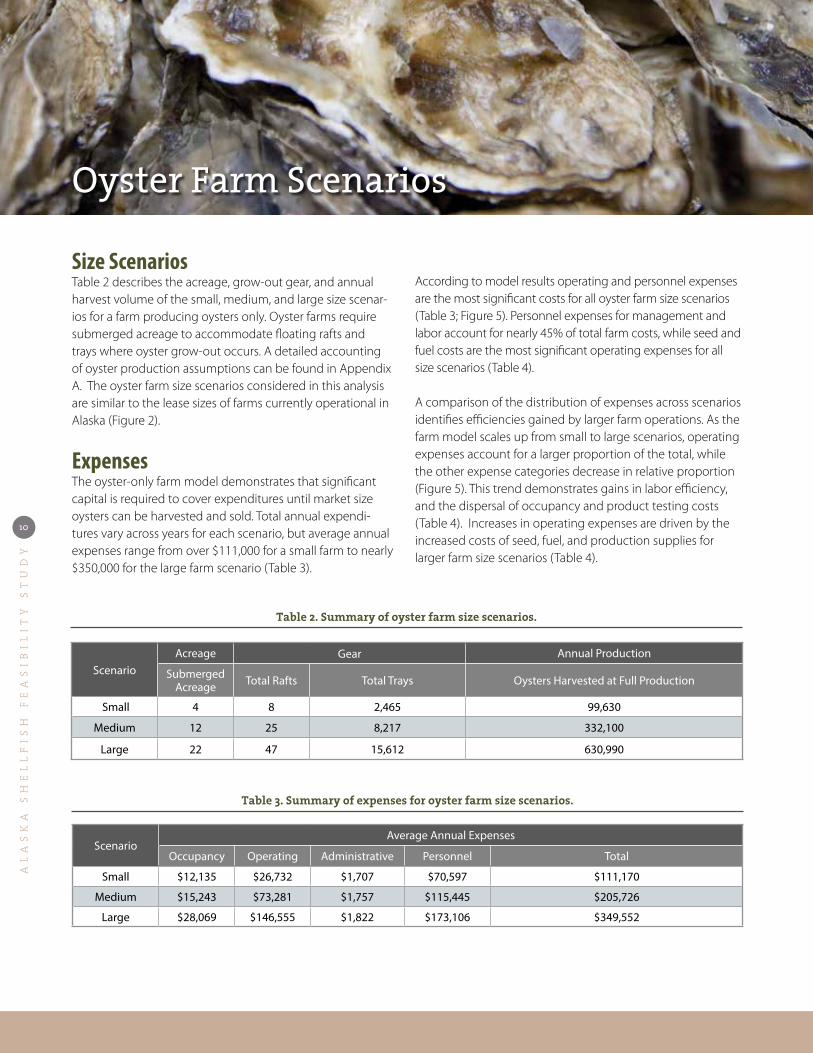
Size Scenarios Table 2 describes the acreage, grow-out gear, and annual harvest volume of the small, medium, and large size scenar-ios for a farm producing oysters only. Oyster farms require submerged acreage to accommodate floating rafts and trays where oyster grow-out occurs. A detailed accounting of oyster production assumptions can be found in Appendix A. The oyster farm size scenarios considered in this analysis are similar to the lease sizes of farms currently operational in Alaska (Figure 2).
ExpensesThe oyster-only farm model demonstrates that significant capital is required to cover expenditures until market size oysters can be harvested and sold. Total annual expendi-tures vary across years for each scenario, but average annual expenses range from over $111,000 for a small farm to nearly $350,000 for the large farm scenario (Table 3).
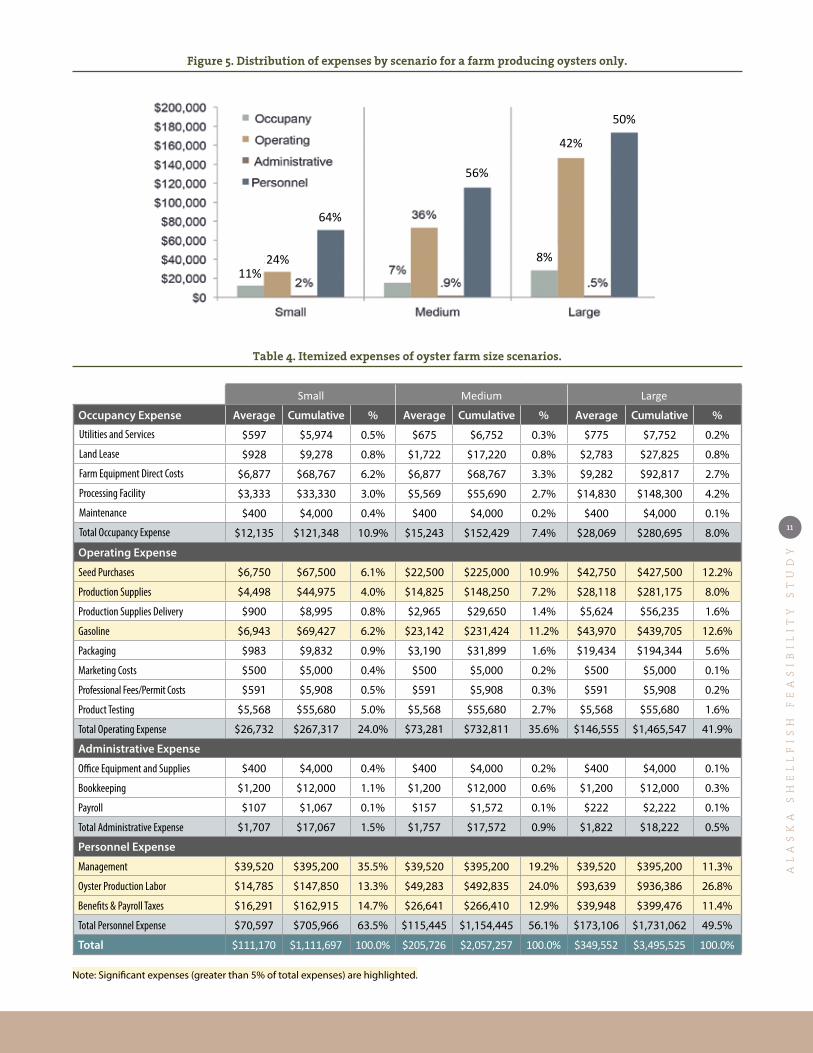
According to model results operating and personnel expenses are the most significant costs for all oyster farm size scenarios (Table 3; Figure 5). Personnel expenses for management and labor account for nearly 45% of total farm costs, while seed and fuel costs are the most significant operating expenses for all size scenarios (Table 4).
A comparison of the distribution of expenses across scenarios identifies efficiencies gained by larger farm operations. As the farm model scales up from small to large scenarios, operating expenses account for a larger proportion of the total, while the other expense categories decrease in relative proportion (Figure 5). This trend demonstrates gains in labor efficiency, and the dispersal of occupancy and product testing costs (Table 4). Increases in operating expenses are driven by the increased costs of seed, fuel, and production supplies for larger farm size scenarios (Table 4).
Table 2. Summary of oyster farm size scenarios.
ScenarioAverage Annual Expenses
Occupancy Operating Administrative Personnel Total
Small $12,135 $26,732 $1,707 $70,597 $111,170
Medium $15,243 $73,281 $1,757 $115,445 $205,726
Large $28,069 $146,555 $1,822 $173,106 $349,552
Table 3. Summary of expenses for oyster farm size scenarios.
AL
AS
KA
SH
EL
LF
IS
H F
EA
SI
BI
LI
TY
ST
UD
Y
11
Small Medium Large
Occupancy Expense Average Cumulative % Average Cumulative % Average Cumulative %
Utilities and Services $597 $5,974 0.5% $675 $6,752 0.3% $775 $7,752 0.2%
Land Lease $928 $9,278 0.8% $1,722 $17,220 0.8% $2,783 $27,825 0.8%
Farm Equipment Direct Costs $6,877 $68,767 6.2% $6,877 $68,767 3.3% $9,282 $92,817 2.7%
Processing Facility $3,333 $33,330 3.0% $5,569 $55,690 2.7% $14,830 $148,300 4.2%
Maintenance $400 $4,000 0.4% $400 $4,000 0.2% $400 $4,000 0.1%
Total Occupancy Expense $12,135 $121,348 10.9% $15,243 $152,429 7.4% $28,069 $280,695 8.0%
Operating Expense
Seed Purchases $6,750 $67,500 6.1% $22,500 $225,000 10.9% $42,750 $427,500 12.2%
Production Supplies $4,498 $44,975 4.0% $14,825 $148,250 7.2% $28,118 $281,175 8.0%
Production Supplies Delivery $900 $8,995 0.8% $2,965 $29,650 1.4% $5,624 $56,235 1.6%
Gasoline $6,943 $69,427 6.2% $23,142 $231,424 11.2% $43,970 $439,705 12.6%
Packaging $983 $9,832 0.9% $3,190 $31,899 1.6% $19,434 $194,344 5.6%
Marketing Costs $500 $5,000 0.4% $500 $5,000 0.2% $500 $5,000 0.1%
Professional Fees/Permit Costs $591 $5,908 0.5% $591 $5,908 0.3% $591 $5,908 0.2%
Product Testing $5,568 $55,680 5.0% $5,568 $55,680 2.7% $5,568 $55,680 1.6%
Total Operating Expense $26,732 $267,317 24.0% $73,281 $732,811 35.6% $146,555 $1,465,547 41.9%
Administrative Expense
Office Equipment and Supplies $400 $4,000 0.4% $400 $4,000 0.2% $400 $4,000 0.1%
Bookkeeping $1,200 $12,000 1.1% $1,200 $12,000 0.6% $1,200 $12,000 0.3%
Payroll $107 $1,067 0.1% $157 $1,572 0.1% $222 $2,222 0.1%
Total Administrative Expense $1,707 $17,067 1.5% $1,757 $17,572 0.9% $1,822 $18,222 0.5%
Personnel Expense
Management $39,520 $395,200 35.5% $39,520 $395,200 19.2% $39,520 $395,200 11.3%
Oyster Production Labor $14,785 $147,850 13.3% $49,283 $492,835 24.0% $93,639 $936,386 26.8%
Benefits & Payroll Taxes $16,291 $162,915 14.7% $26,641 $266,410 12.9% $39,948 $399,476 11.4%
Total Personnel Expense $70,597 $705,966 63.5% $115,445 $1,154,445 56.1% $173,106 $1,731,062 49.5%
Total $111,170 $1,111,697 100.0% $205,726 $2,057,257 100.0% $349,552 $3,495,525 100.0%
Table 4. Itemized expenses of oyster farm size scenarios.
Figure 5. Distribution of expenses by scenario for a farm producing oysters only.
Note: Significant expenses (greater than 5% of total expenses) are highlighted.
50%
42%
8%
56%
64%
11%24%
AL
AS
KA
SH
EL
LF
IS
H F
EA
SI
BI
LI
TY
ST
UD
Y
12
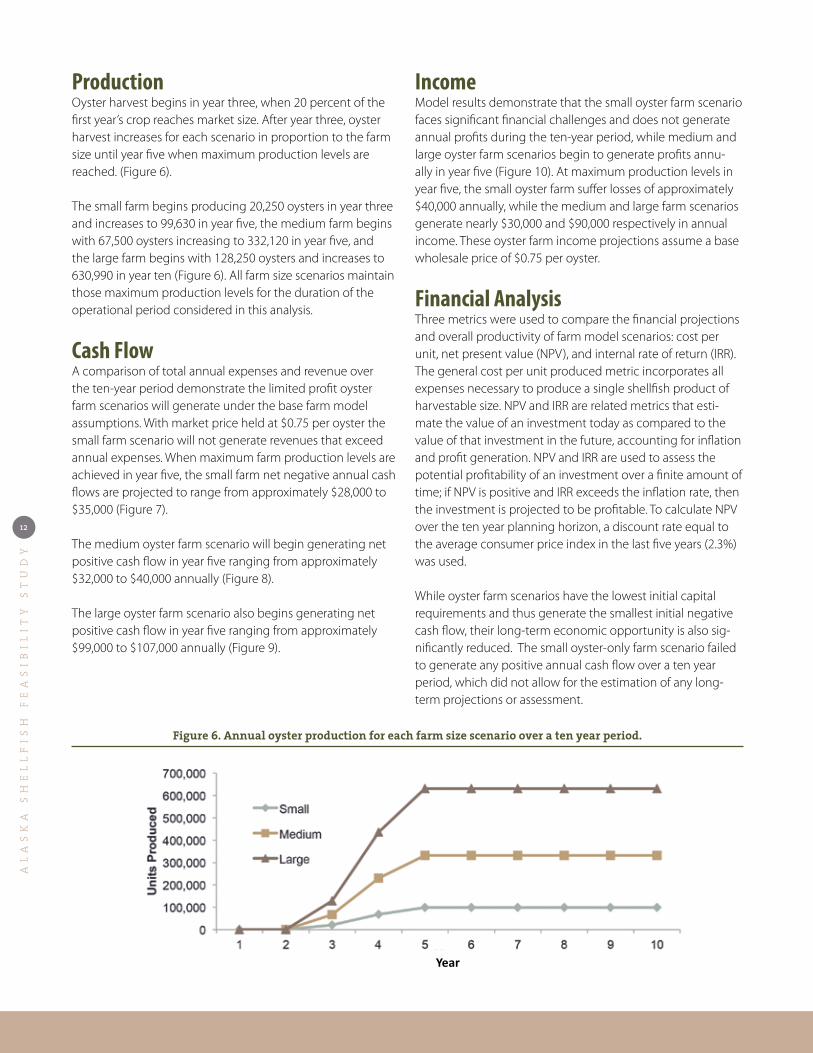
ProductionOyster harvest begins in year three, when 20 percent of the first year’s crop reaches market size. After year three, oyster harvest increases for each scenario in proportion to the farm size until year five when maximum production levels are reached. (Figure 6).
The small farm begins producing 20,250 oysters in year three and increases to 99,630 in year five, the medium farm begins with 67,500 oysters increasing to 332,120 in year five, and the large farm begins with 128,250 oysters and increases to 630,990 in year ten (Figure 6). All farm size scenarios maintain those maximum production levels for the duration of the operational period considered in this analysis.
Cash FlowA comparison of total annual expenses and revenue over the ten-year period demonstrate the limited profit oyster farm scenarios will generate under the base farm model assumptions. With market price held at $0.75 per oyster the small farm scenario will not generate revenues that exceed annual expenses. When maximum farm production levels are achieved in year five, the small farm net negative annual cash flows are projected to range from approximately $28,000 to $35,000 (Figure 7).
The medium oyster farm scenario will begin generating net positive cash flow in year five ranging from approximately $32,000 to $40,000 annually (Figure 8).
The large oyster farm scenario also begins generating net positive cash flow in year five ranging from approximately $99,000 to $107,000 annually (Figure 9).
IncomeModel results demonstrate that the small oyster farm scenario faces significant financial challenges and does not generate annual profits during the ten-year period, while medium and large oyster farm scenarios begin to generate profits annu-ally in year five (Figure 10). At maximum production levels in year five, the small oyster farm suffer losses of approximately $40,000 annually, while the medium and large farm scenarios generate nearly $30,000 and $90,000 respectively in annual income. These oyster farm income projections assume a base wholesale price of $0.75 per oyster.
Financial AnalysisThree metrics were used to compare the financial projections and overall productivity of farm model scenarios: cost per unit, net present value (NPV), and internal rate of return (IRR). The general cost per unit produced metric incorporates all expenses necessary to produce a single shellfish product of harvestable size. NPV and IRR are related metrics that esti-mate the value of an investment today as compared to the value of that investment in the future, accounting for inflation and profit generation. NPV and IRR are used to assess the potential profitability of an investment over a finite amount of time; if NPV is positive and IRR exceeds the inflation rate, then the investment is projected to be profitable. To calculate NPV over the ten year planning horizon, a discount rate equal to the average consumer price index in the last five years (2.3%) was used.
While oyster farm scenarios have the lowest initial capital requirements and thus generate the smallest initial negative cash flow, their long-term economic opportunity is also sig-nificantly reduced. The small oyster-only farm scenario failed to generate any positive annual cash flow over a ten year period, which did not allow for the estimation of any long-term projections or assessment.
Figure 6. Annual oyster production for each farm size scenario over a ten year period.
Year

AL
AS
KA
SH
EL
LF
IS
H F
EA
SI
BI
LI
TY
ST
UD
Y
13
Figure 7. Annual expenses and revenue for the small oyster farm.
Figure 8. Annual expenses and revenue for the medium oyster farm.
Figure 9. Annual expenses and revenue for the large oyster farm.

AL
AS
KA
SH
EL
LF
IS
H F
EA
SI
BI
LI
TY
ST
UD
Y
14
ScenarioAnnual Income
Cost per Unit
10 Year Period 20 Year PeriodYear of (+) NPV and
IRRYear 5 Year 10 NPV IRR NPV IRR
Small -$37,692 -$40,753 $1.70 -$608,723 N/A N/A N/A N/A
Medium $25,625 $28,662 $0.99 -$465,878 -21% -$263,966 -3% 20+
Large $87,206 $89,777 $0.89 -$539,637 -11% $92,805 3% 19
None of the oyster-only farm size scenarios achieved positive NPV or IRR values over a ten-year period, and only the large farm scenario was able to do so in fewer than twenty years (Table 5). Medium and large size scenarios were able to achieve production efficiencies that significantly reduced the cost per unit compared to the small size scenario, but high volume production is necessary to translate these efficiency gains into profitability over the long term.
Price SensitivityA variety of factors, both local and global, may influence the price farmers receive for their shellfish product. This analy-sis assumes farmers are selling to wholesale buyers and not undertaking direct selling or marketing to consumers. However, market prices for seafood products may vary across season and region even under the wholesale buyer assumption, so the price a farmer receives for their product may significantly impact the overall profitability of their operation.
An analysis of the sensitivity of farm profitability to changes in market price was completed to describe how price variability might affect the financial viability of each shellfish farm size. Market prices considered in this analysis ranged both above and below the model assumed prices of $0.75 per oyster and correspond to prices that may be realistically achieved by Alaska growers. A high amount of variability has been seen in the market price of Alaska farmed oysters, prices have ranged from as low around $0.40 per oyster to as high as over $1.60; market price also vary with the size of oysters sold. Twenty-year projections were estimated by assuming consistent annual revenues and expenditures equal to those occurring in year ten.
Figure 10. Total annual income generated from oyster sales for each farm size.
Table 5. Financial analysis of oyster farm size.
AL
AS
KA
SH
EL
LF
IS
H F
EA
SI
BI
LI
TY
ST
UD
Y
15
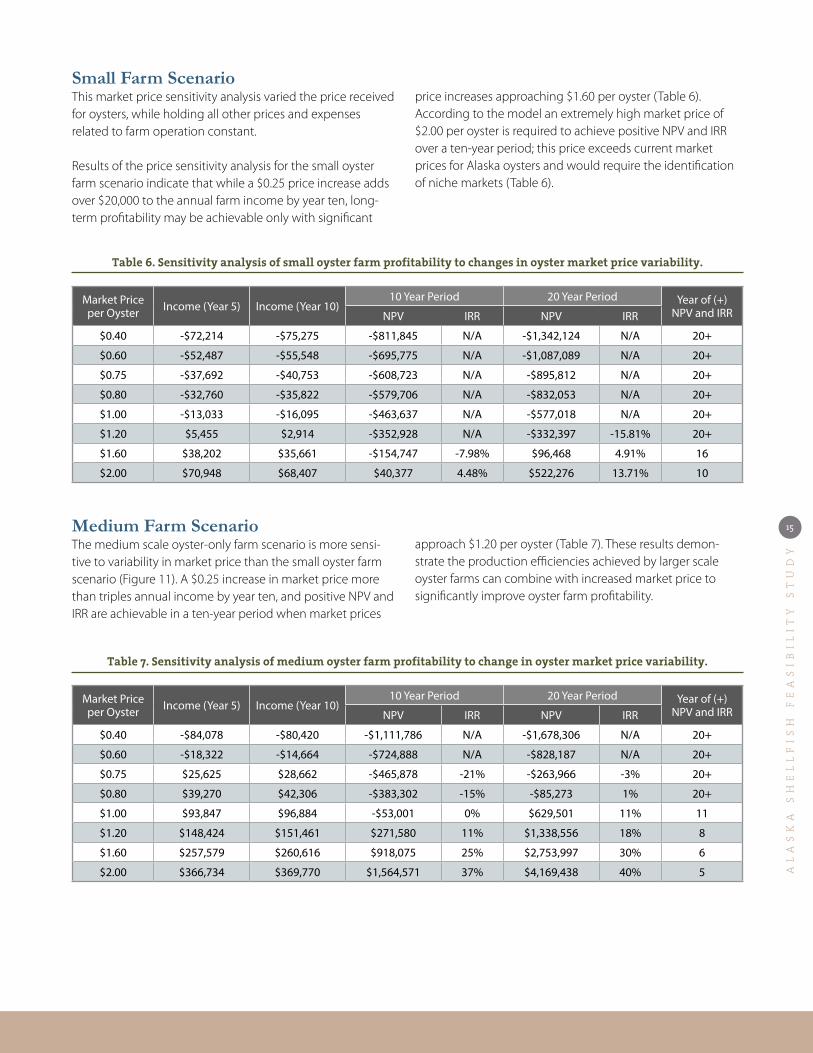
Small Farm ScenarioThis market price sensitivity analysis varied the price received for oysters, while holding all other prices and expenses related to farm operation constant.
Results of the price sensitivity analysis for the small oyster farm scenario indicate that while a $0.25 price increase adds over $20,000 to the annual farm income by year ten, long-term profitability may be achievable only with significant
Market Price per Oyster Income (Year 5) Income (Year 10)
10 Year Period 20 Year Period Year of (+) NPV and IRRNPV IRR NPV IRR
$0.40 -$72,214 -$75,275 -$811,845 N/A -$1,342,124 N/A 20+
$0.60 -$52,487 -$55,548 -$695,775 N/A -$1,087,089 N/A 20+
$0.75 -$37,692 -$40,753 -$608,723 N/A -$895,812 N/A 20+
$0.80 -$32,760 -$35,822 -$579,706 N/A -$832,053 N/A 20+
$1.00 -$13,033 -$16,095 -$463,637 N/A -$577,018 N/A 20+
$1.20 $5,455 $2,914 -$352,928 N/A -$332,397 -15.81% 20+
$1.60 $38,202 $35,661 -$154,747 -7.98% $96,468 4.91% 16
$2.00 $70,948 $68,407 $40,377 4.48% $522,276 13.71% 10
Medium Farm ScenarioThe medium scale oyster-only farm scenario is more sensi-tive to variability in market price than the small oyster farm scenario (Figure 11). A $0.25 increase in market price more than triples annual income by year ten, and positive NPV and IRR are achievable in a ten-year period when market prices
Market Price per Oyster Income (Year 5) Income (Year 10)
10 Year Period 20 Year Period Year of (+) NPV and IRRNPV IRR NPV IRR
$0.40 -$84,078 -$80,420 -$1,111,786 N/A -$1,678,306 N/A 20+
$0.60 -$18,322 -$14,664 -$724,888 N/A -$828,187 N/A 20+
$0.75 $25,625 $28,662 -$465,878 -21% -$263,966 -3% 20+
$0.80 $39,270 $42,306 -$383,302 -15% -$85,273 1% 20+
$1.00 $93,847 $96,884 -$53,001 0% $629,501 11% 11
$1.20 $148,424 $151,461 $271,580 11% $1,338,556 18% 8
$1.60 $257,579 $260,616 $918,075 25% $2,753,997 30% 6
$2.00 $366,734 $369,770 $1,564,571 37% $4,169,438 40% 5
Table 6. Sensitivity analysis of small oyster farm profitability to changes in oyster market price variability.
Table 7. Sensitivity analysis of medium oyster farm profitability to change in oyster market price variability.
price increases approaching $1.60 per oyster (Table 6). According to the model an extremely high market price of $2.00 per oyster is required to achieve positive NPV and IRR over a ten-year period; this price exceeds current market prices for Alaska oysters and would require the identification of niche markets (Table 6).
approach $1.20 per oyster (Table 7). These results demon-strate the production efficiencies achieved by larger scale oyster farms can combine with increased market price to significantly improve oyster farm profitability.

AL
AS
KA
SH
EL
LF
IS
H F
EA
SI
BI
LI
TY
ST
UD
Y
16
market prices approach $1.00 per oyster (Table 8). As with the medium oyster farm scenario, the combination of production efficiencies achieved by larger farm sizes and increased mar-ket price may significantly improve farm profitability.
Market Price per Oyster Income (Year 5) Income (Year 10)
10 Year Period 20 Year Period Year of (+) NPV and IRRNPV IRR NPV IRR
$0.40 -$113,451 -$110,352 -$1,731,205 N/A -$2,508,586 N/A 20+
$0.60 $9,433 $12,005 -$1,010,316 N/A -$925,748 -14% 20+
$0.75 $87,206 $89,777 -$539,637 -11% $92,805 3% 19
$0.80 $113,130 $115,702 -$382,744 -7% $432,323 6% 15
$1.00 $216,827 $219,399 $241,872 7% $1,787,437 16% 9
$1.20 $320,524 $323,095 $856,043 16% $3,132,106 23% 7
$1.60 $527,917 $530,489 $2,084,384 31% $5,821,445 35% 6
$2.00 $735,311 $737,883 $3,312,725 43% $8,510,783 45% 5
Large Farm ScenarioPrice sensitivity analysis of the large oyster farm scenario again demonstrates that with increased farm size, price sensitivity increases significantly (Figure 11). A $0.25 increase in mar-ket price more than triples annual income by year ten, and positive NPV and IRR are achievable in a ten-year period when
Table 8. Sensitivity analysis of large oyster farm profitability to change in oyster market price variability.
Figure 11. Sensitivity of 10-year income to changing oyster price for each farm size.
AL
AS
KA
SH
EL
LF
IS
H F
EA
SI
BI
LI
TY
ST
UD
Y
17
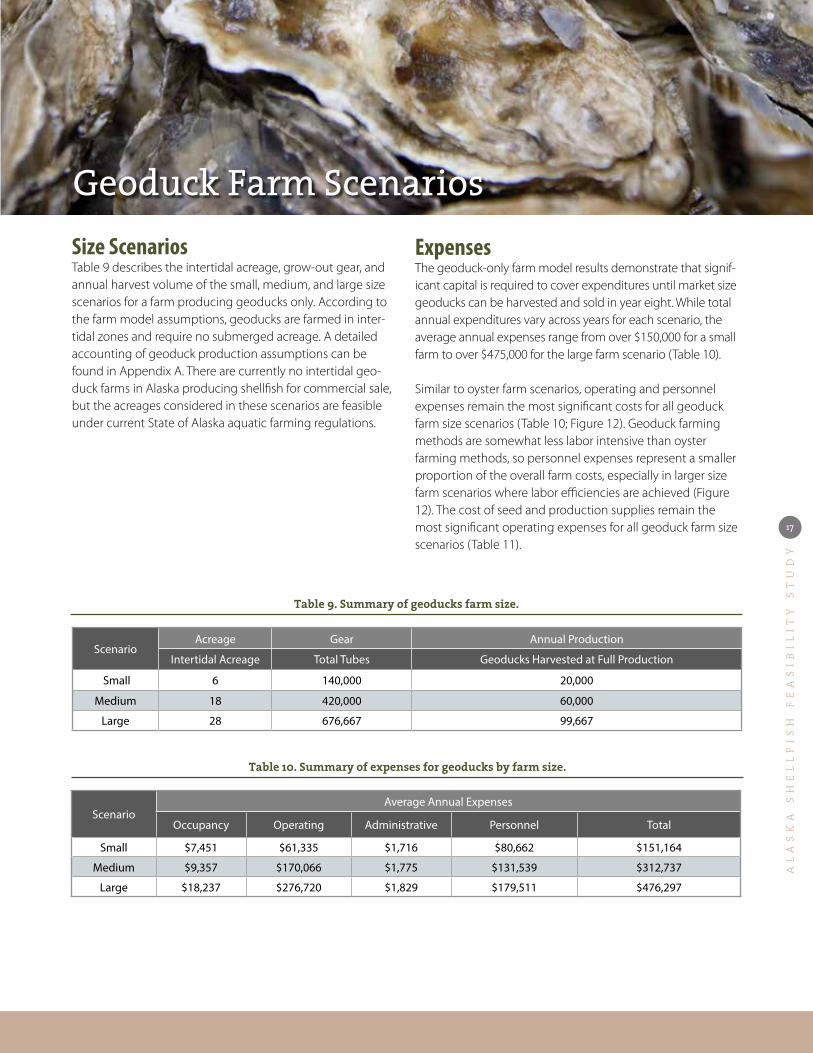
Geoduck Farm ScenariosSize ScenariosTable 9 describes the intertidal acreage, grow-out gear, and annual harvest volume of the small, medium, and large size scenarios for a farm producing geoducks only. According to the farm model assumptions, geoducks are farmed in inter-tidal zones and require no submerged acreage. A detailed accounting of geoduck production assumptions can be found in Appendix A. There are currently no intertidal geo-duck farms in Alaska producing shellfish for commercial sale, but the acreages considered in these scenarios are feasible under current State of Alaska aquatic farming regulations.
ExpensesThe geoduck-only farm model results demonstrate that signif-icant capital is required to cover expenditures until market size geoducks can be harvested and sold in year eight. While total annual expenditures vary across years for each scenario, the average annual expenses range from over $150,000 for a small farm to over $475,000 for the large farm scenario (Table 10).
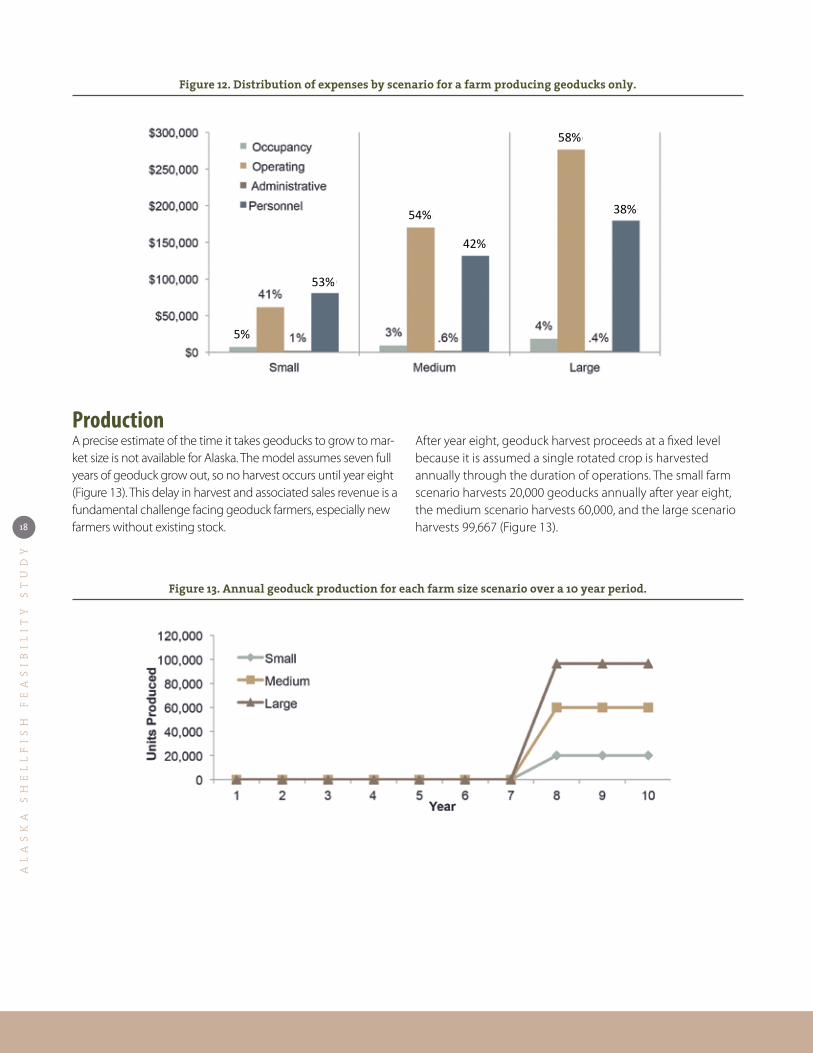
Similar to oyster farm scenarios, operating and personnel expenses remain the most significant costs for all geoduck farm size scenarios (Table 10; Figure 12). Geoduck farming methods are somewhat less labor intensive than oyster farming methods, so personnel expenses represent a smaller proportion of the overall farm costs, especially in larger size farm scenarios where labor efficiencies are achieved (Figure 12). The cost of seed and production supplies remain the most significant operating expenses for all geoduck farm size scenarios (Table 11).
ScenarioAcreage Gear Annual Production
Intertidal Acreage Total Tubes Geoducks Harvested at Full Production
Small 6 140,000 20,000
Medium 18 420,000 60,000
Large 28 676,667 99,667
ScenarioAverage Annual Expenses
Occupancy Operating Administrative Personnel Total
Small $7,451 $61,335 $1,716 $80,662 $151,164
Medium $9,357 $170,066 $1,775 $131,539 $312,737
Large $18,237 $276,720 $1,829 $179,511 $476,297
Table 9. Summary of geoducks farm size.
Table 10. Summary of expenses for geoducks by farm size.
AL
AS
KA
SH
EL
LF
IS
H F
EA
SI
BI
LI
TY
ST
UD
Y
18
ProductionA precise estimate of the time it takes geoducks to grow to mar-ket size is not available for Alaska. The model assumes seven full years of geoduck grow out, so no harvest occurs until year eight (Figure 13). This delay in harvest and associated sales revenue is a fundamental challenge facing geoduck farmers, especially new farmers without existing stock.
After year eight, geoduck harvest proceeds at a fixed level because it is assumed a single rotated crop is harvested annually through the duration of operations. The small farm scenario harvests 20,000 geoducks annually after year eight, the medium scenario harvests 60,000, and the large scenario harvests 99,667 (Figure 13).
Figure 12. Distribution of expenses by scenario for a farm producing geoducks only.
Figure 13. Annual geoduck production for each farm size scenario over a 10 year period.
58%
38%54%
42%
53%
5%

AL
AS
KA
SH
EL
LF
IS
H F
EA
SI
BI
LI
TY
ST
UD
Y
19
Small Medium Large
Occupancy Expense Average Cumulative % Average Cumulative % Average Cumulative %
Utilities and Services $612 $6,123 0.4% $703 $7,031 0.2% $786 $7,863 0.2%
Land Lease $1,041 $10,413 0.7% $1,985 $19,853 0.6% $2,884 $28,843 0.6%
Farm Equipment Direct Costs $2,792 $27,920 1.8% $2,884 $28,840 0.9% $2,976 $29,760 0.6%
Processing Facility $2,605 $26,050 1.7% $3,385 $33,850 1.1% $11,190 $111,900 2.3%
Maintenance $400 $4,000 0.3% $400 $4,000 0.1% $400 $4,000 0.1%
Total Occupancy Expense $7,451 $74,506 4.9% $9,357 $93,574 3.0% $18,237 $182,367 3.8%
Operating Expense
Seed Purchases $18,000 $180,000 11.9% $54,000 $540,000 17.3% $87,000 $870,000 18.3%
Production Supplies $27,246 $272,462 18.0% $81,785 $817,846 26.2% $131,690 $1,316,897 27.6%
Production Supplies Delivery $2,725 $27,246 1.8% $8,178 $81,785 2.6% $13,169 $131,690 2.8%
Gasoline $6,050 $60,505 4.0% $17,479 $174,794 5.6% $27,956 $279,559 5.9%
Packaging $655 $6,548 0.4% $1,964 $19,643 0.6% $10,247 $102,465 2.2%
Marketing Costs $500 $5,000 0.3% $500 $5,000 0.2% $500 $5,000 0.1%
Professional Fees/Permit Costs $591 $5,908 0.4% $591 $5,908 0.2% $591 $5,908 0.1%
Product Testing $5,568 $55,680 3.7% $5,568 $55,680 1.8% $5,568 $55,680 1.2%
Total Operating Expense $61,335 $613,348 40.6% $170,066 $1,700,656 54.4% $276,720 $2,767,200 58.1%
Administrative Expense
Office Equipment and Supplies $400 $4,000 0.3% $400 $4,000 0.1% $400 $4,000 0.1%
Bookkeeping $1,200 $12,000 0.8% $1,200 $12,000 0.4% $1,200 $12,000 0.3%
Payroll $116 $1,164 0.1% $175 $1,753 0.1% $229 $2,294 0.0%
Total Administrative Expense $1,716 $17,164 1.1% $1,775 $17,753 0.6% $1,829 $18,294 0.4%
Personnel Expense
Management $39,520 $395,200 26.1% $39,520 $395,200 12.6% $39,520 $395,200 8.3%
Geoduck Production Labor $21,408 $214,080 14.2% $61,664 $616,640 19.7% $98,565 $985,653 20.7%
Benefits and Payroll Taxes $19,734 $197,344 13.1% $30,355 $303,552 9.7% $41,426 $414,256 8.7%
Total Personnel Expense $80,662 $806,624 53.4% $131,539 $1,315,392 42.1% $179,511 $1,795,109 37.7%
Total $151,164 $1,511,642 100.0% $312,737 $3,127,375 100.0% $476,297 $4,762,969 100.0%
Note: Significant expenses (greater than 5% of total expenses) are highlighted.
Table 11. Itemized expenses of geoduck farm size.
AL
AS
KA
SH
EL
LF
IS
H F
EA
SI
BI
LI
TY
ST
UD
Y
20
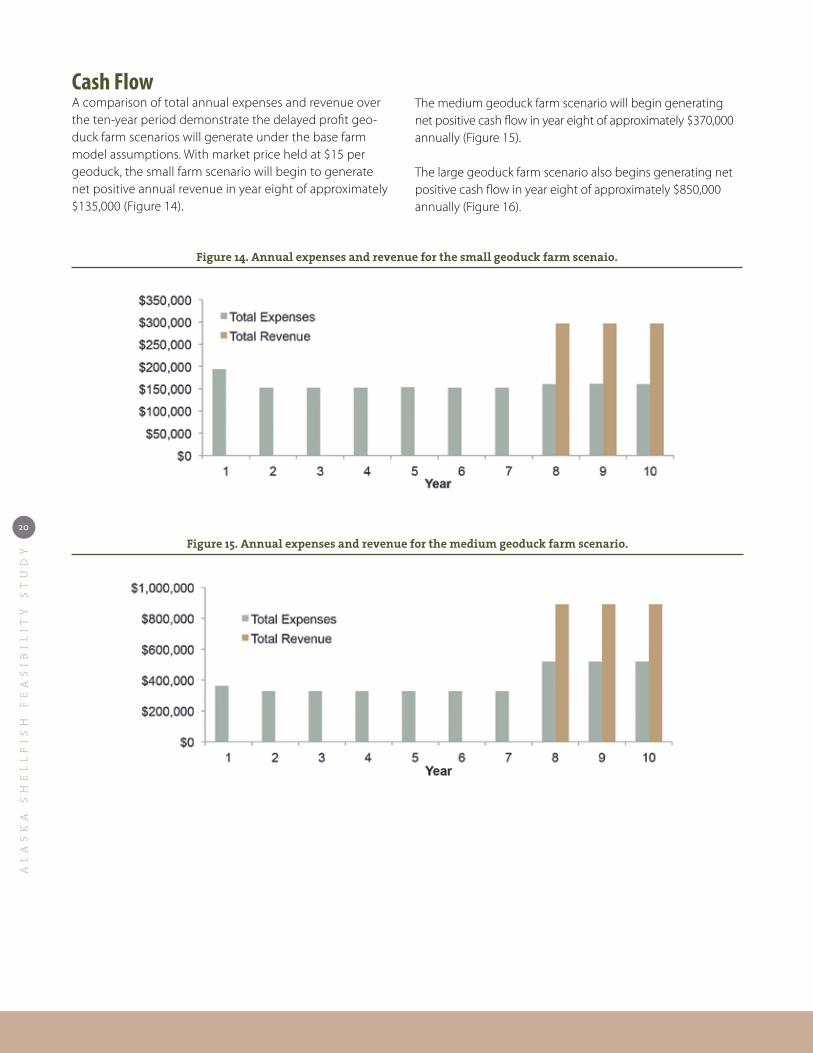
Cash FlowA comparison of total annual expenses and revenue over the ten-year period demonstrate the delayed profit geo-duck farm scenarios will generate under the base farm model assumptions. With market price held at $15 per geoduck, the small farm scenario will begin to generate net positive annual revenue in year eight of approximately $135,000 (Figure 14).
The medium geoduck farm scenario will begin generating net positive cash flow in year eight of approximately $370,000 annually (Figure 15).
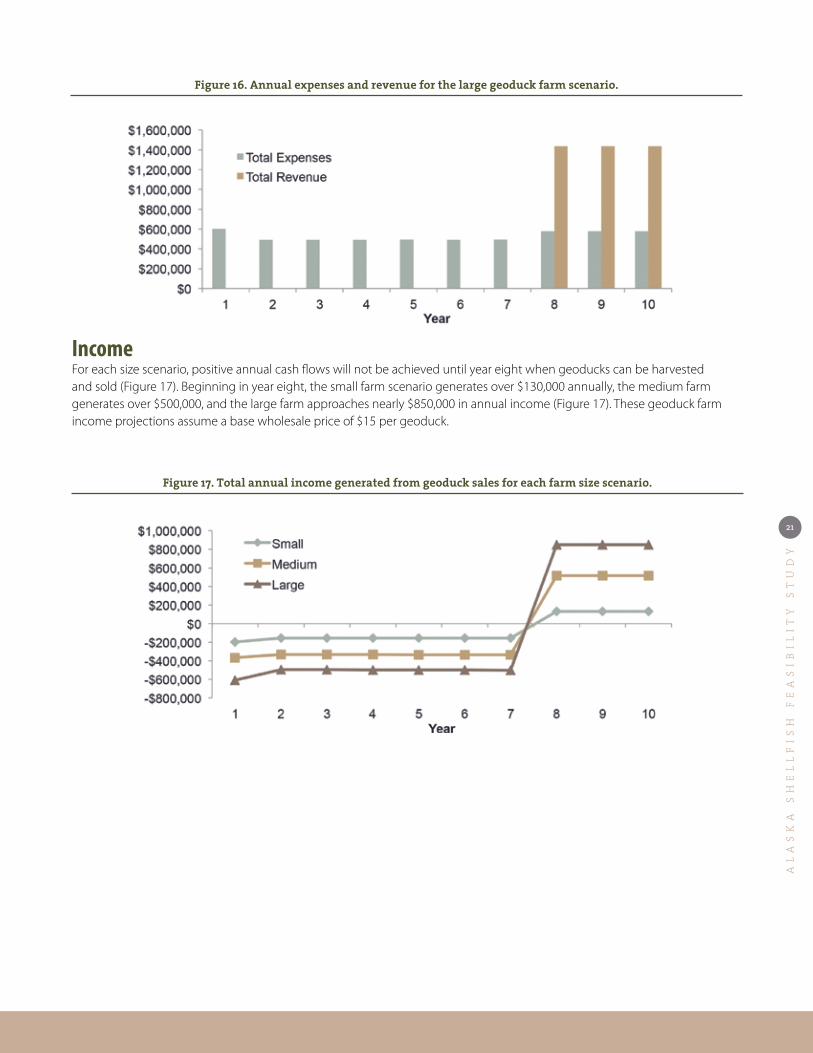
The large geoduck farm scenario also begins generating net positive cash flow in year eight of approximately $850,000 annually (Figure 16).
Figure 14. Annual expenses and revenue for the small geoduck farm scenaio.
Figure 15. Annual expenses and revenue for the medium geoduck farm scenario.
AL
AS
KA
SH
EL
LF
IS
H F
EA
SI
BI
LI
TY
ST
UD
Y
21
IncomeFor each size scenario, positive annual cash flows will not be achieved until year eight when geoducks can be harvested and sold (Figure 17). Beginning in year eight, the small farm scenario generates over $130,000 annually, the medium farm generates over $500,000, and the large farm approaches nearly $850,000 in annual income (Figure 17). These geoduck farm income projections assume a base wholesale price of $15 per geoduck.
Figure 16. Annual expenses and revenue for the large geoduck farm scenario.
Figure 17. Total annual income generated from geoduck sales for each farm size scenario.

AL
AS
KA
SH
EL
LF
IS
H F
EA
SI
BI
LI
TY
ST
UD
Y
22
Financial AnalysisAll size scenarios for geoduck farms face short-term negative cash flow challenges driven by the eight-year delay in reve-nue generation. But by year ten all size scenarios are generat-ing positive annual incomes, and over a twenty-year period all size scenarios are demonstrating significant profitability with positive NPV and IRR values (Table 12).
ScenarioAnnual Income Cost per
Unit
10 Year Period 20 Year Period Year of (+) NPV and IRRYear 5 Year 10 NPV IRR NPV IRR
Small -$156,520 $133,047 $8.05 -$697,221 -20% $240,038 5% 18
Medium -$334,007 $517,893 $6.15 -$898,161 -8% $2,750,264 12% 13
Large -$499,360 $848,714 $5.98 -$1,218,981 -7% $4,759,833 12% 13
Medium and large farm size scenarios are able to achieve pro-duction and labor efficiencies that significantly reduce cost per unit estimates and allow them to reach positive NPV and IRR values much more quickly than the small farm scenario (Table 12).
Price SensitivitySmall Farm Scenario This market price sensitivity analysis varied the price received for geoducks, while holding all other prices and expenses related to farm operation constant. Sensitivity analysis results for the small geoduck-only farm scenario indicate that higher prices incrementally improve income generation and overall farm profitability, but do not change the overall trend of short-term debt and long-term profit (Table 13). Available price information for farmed geoducks varies considerably depending on market and region of origin, but the base model assumption of $15 per geoduck price is conservative, shellfish farms in British Columbia and Washington State garner prices as high as $35 per geoduck. Under the model assumptions geoducks are not harvested and sold until year-eight, so changes in market price do not affect the five year annual income.
Only extremely high market prices approaching $30 per geo-duck begin to improve ten year NPV and IRR to near positive values (Table 13). This is expected because geoducks are only contributing revenue for three of the first ten years of farm operation. A $2.00 increase in price will add over $30,000 to the farm’s annual income by year ten, improve the twenty-year NPV by over $300,000, and reduce the time to positive NPV and IRR by two years.
Market Price per Geoduck Income (Year 5) Income (Year 10)
10 Year Period 20 Year Period Year of (+) NPV and IRRNPV IRR NPV IRR
$10.00 -$156,520 $50,877 -$912,376 N/A -$553,968 -5% 20+
$12.00 -$156,520 $83,745 -$832,007 -28% -$242,059 0% 20+
$15.00 -$156,520 $133,047 -$711,454 -20% $225,806 4% 18
$17.00 -$156,520 $165,915 -$631,085 -16% $537,715 7% 16
$19.00 -$156,520 $198,783 -$550,716 -12% $849,625 9% 14
$20.00 -$156,520 $215,217 -$510,531 -11% $1,005,579 10% 13
$25.00 -$156,520 $297,387 -$309,609 -5% $1,785,353 14% 12
$30.00 -$156,520 $379,557 -$108,686 0% $2,565,127 17% 11
Table 12. Financial analysis of geoduck farm size scenarios.
Table 13. Sensitivity analysis of small geoduck farm profitability to changes in geoduck market price.

AL
AS
KA
SH
EL
LF
IS
H F
EA
SI
BI
LI
TY
ST
UD
Y
23
Medium Farm ScenarioSimilar to the small geoduck farm scenario, market prices over $20 per geoduck allow the medium size scenario to achieve positive NPV and IRR values in a ten year period (Table 14).
A $2.00 price increase will add nearly $100,000 to the farm’s annual income by year ten, improve the twenty-year NPV by over $900,000, and reduce the time to positive NPV and IRR by one year (Table 14). The combination of production efficiencies achieved by the medium sized geoduck farm sce-nario and increased market prices for geoduck, significantly improve the overall farm profitability and the time it takes a farm to generate positive returns on investment.
Large Farm ScenarioThe profitability of the large geoduck farm scenario is more sensitive to price variability than the small and medium scenarios (Figure 18). Market prices approaching $20 per geoduck would allow the large farm scenario to achieve positive NPV and IRR in ten years (Table 15).
The higher market prices considered in this analysis signifi-cantly improve the large farm scenario profitability. A $2.00 price increase will add over $150,000 to the farm’s annual income by year ten, improve the twenty-year NPV by over $1.5 M, and reduce the time to positive NPV and IRR by one year (Table 15). Again, overall farm profitability is signifi-cantly improved by the combination of increased market price and production efficiencies achieved by larger farm operations (Figure 18).
Market Price per Geoduck Income (Year 5) Income (Year 10)
10 Year Period 20 Year Period Year of (+) NPV and IRRNPV IRR NPV IRR
$10.00 -$334,007 $271,383 -$1,500,928 -20% $410,843 4% 18
$12.00 -$334,007 $369,987 -$1,259,821 -15% $1,346,571 8% 15
$15.00 -$334,007 $517,893 -$898,161 -8% $2,750,164 12% 13
$17.00 -$334,007 $616,497 -$657,054 -5% $3,685,892 14% 12
$19.00 -$334,007 $715,101 -$415,947 -2% $4,621,621 16% 11
$20.00 -$334,007 $764,403 -$295,393 -1% $5,089,485 17% 11
$25.00 -$334,007 $1,010,913 $307,375 5% $7,428,806 21% 10
$30.00 -$334,007 $1,257,423 $910,142 9% $9,768,127 24% 10
Market Price per Oyster Income (Year 5) Income (Year 10)
10 Year Period 20 Year Period Year of (+) NPV and IRRNPV IRR NPV IRR
$10.00 -$499,360 $451,559 -$2,190,107 -19% $990,927 5% 17
$12.00 -$499,360 $610,421 -$1,801,657 -13% $2,498,490 9% 14
$15.00 -$499,360 $848,714 -$1,218,981 -7% $4,759,833 12% 12
$17.00 -$499,360 $1,007,576 -$830,531 -3% $6,267,396 15% 12
$19.00 -$499,360 $1,166,438 -$442,081 -1% $7,774,958 17% 11
$20.00 -$499,360 $1,245,869 -$247,856 1% $8,528,740 18% 11
$25.00 -$499,360 $1,643,024 $723,270 6% $12,297,646 21% 10
$30.00 -$499,360 $2,040,179 $1,694,396 11% $16,066,552 25% 9
Table 14. Sensitivity analysis of medium geoduck farm profitability to changes in geoduck market price.
Table 15. Sensitivity analysis of large geoduck farm profitability to changes in geoduck market price.
AL
AS
KA
SH
EL
LF
IS
H F
EA
SI
BI
LI
TY
ST
UD
Y
24
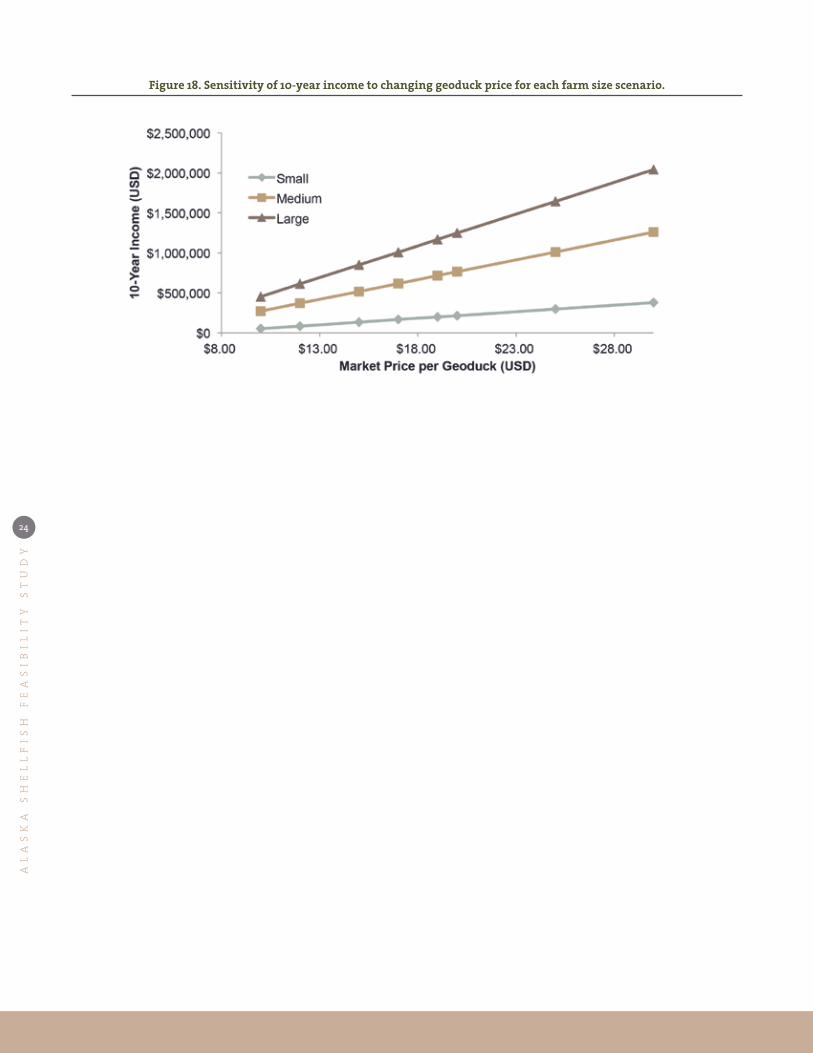
Figure 18. Sensitivity of 10-year income to changing geoduck price for each farm size scenario.
AL
AS
KA
SH
EL
LF
IS
H F
EA
SI
BI
LI
TY
ST
UD
Y
25
Combined Oyster and Geoduck Farm Scenarios
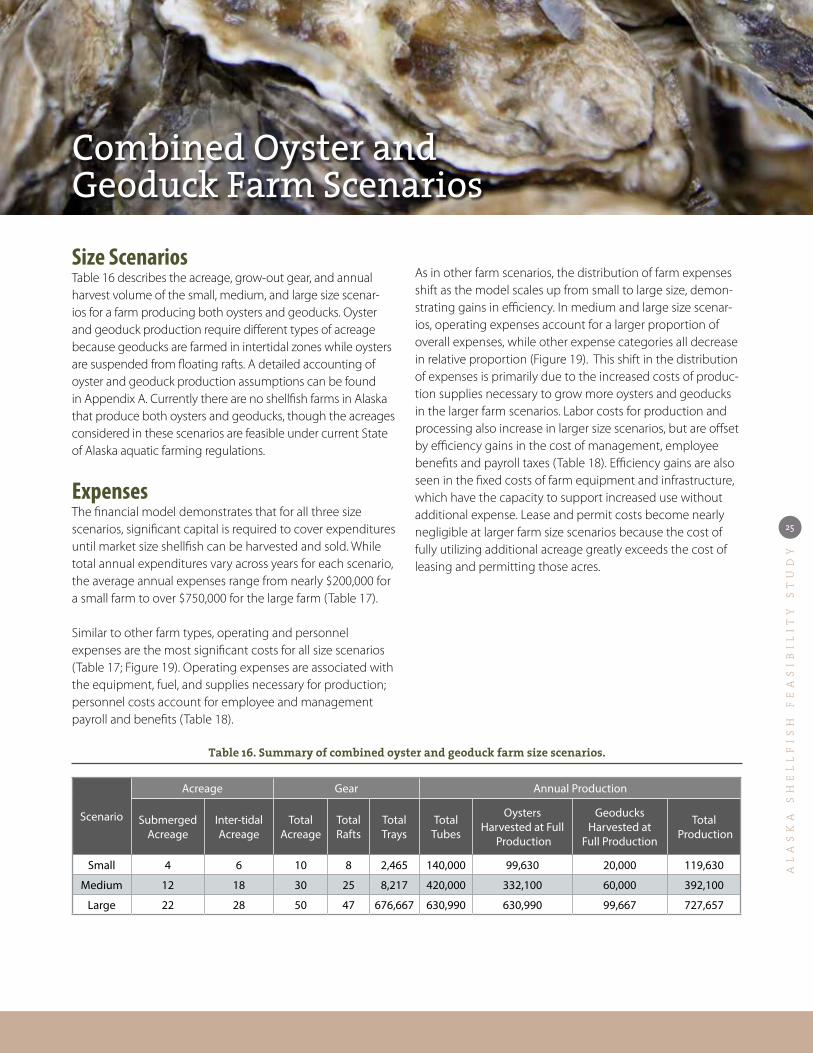
Size ScenariosTable 16 describes the acreage, grow-out gear, and annual harvest volume of the small, medium, and large size scenar-ios for a farm producing both oysters and geoducks. Oyster and geoduck production require different types of acreage because geoducks are farmed in intertidal zones while oysters are suspended from floating rafts. A detailed accounting of oyster and geoduck production assumptions can be found in Appendix A. Currently there are no shellfish farms in Alaska that produce both oysters and geoducks, though the acreages considered in these scenarios are feasible under current State of Alaska aquatic farming regulations.
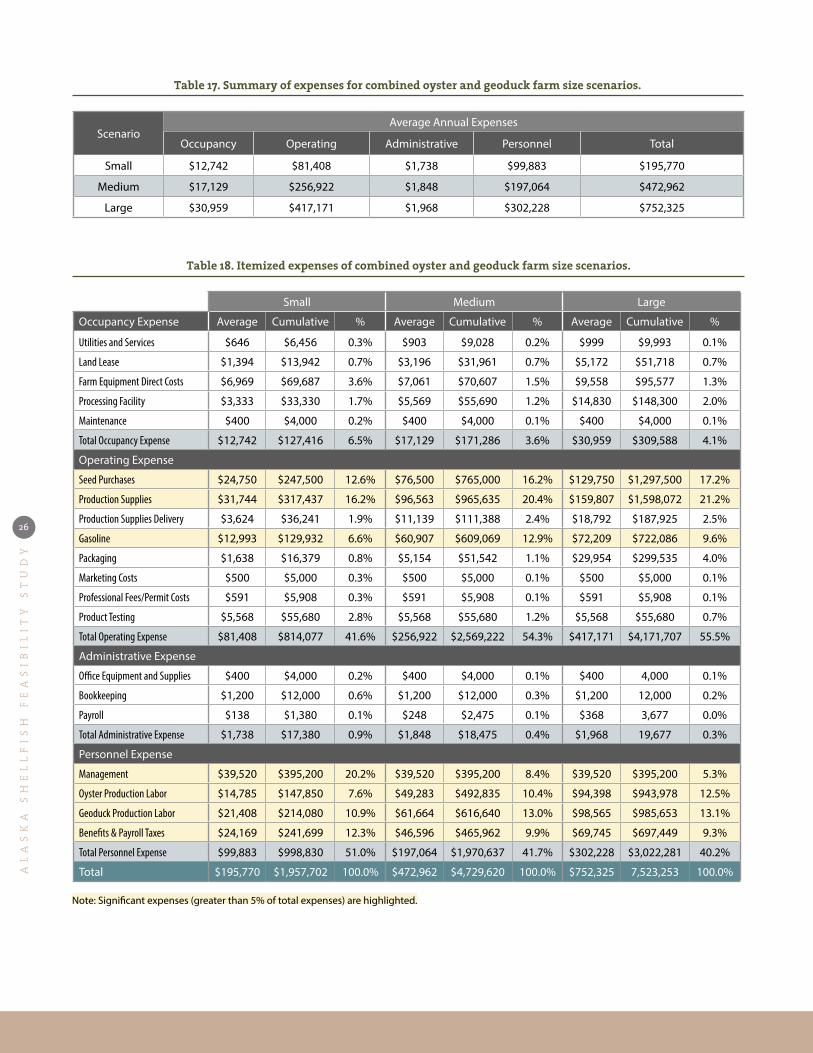
ExpensesThe financial model demonstrates that for all three size scenarios, significant capital is required to cover expenditures until market size shellfish can be harvested and sold. While total annual expenditures vary across years for each scenario, the average annual expenses range from nearly $200,000 for a small farm to over $750,000 for the large farm (Table 17).
Similar to other farm types, operating and personnel expenses are the most significant costs for all size scenarios (Table 17; Figure 19). Operating expenses are associated with the equipment, fuel, and supplies necessary for production; personnel costs account for employee and management payroll and benefits (Table 18).
As in other farm scenarios, the distribution of farm expenses shift as the model scales up from small to large size, demon-strating gains in efficiency. In medium and large size scenar-ios, operating expenses account for a larger proportion of overall expenses, while other expense categories all decrease in relative proportion (Figure 19). This shift in the distribution of expenses is primarily due to the increased costs of produc-tion supplies necessary to grow more oysters and geoducks in the larger farm scenarios. Labor costs for production and processing also increase in larger size scenarios, but are offset by efficiency gains in the cost of management, employee benefits and payroll taxes (Table 18). Efficiency gains are also seen in the fixed costs of farm equipment and infrastructure, which have the capacity to support increased use without additional expense. Lease and permit costs become nearly negligible at larger farm size scenarios because the cost of fully utilizing additional acreage greatly exceeds the cost of leasing and permitting those acres.
Scenario
Acreage Gear Annual Production
Submerged Acreage
Inter-tidal Acreage
Total Acreage
Total Rafts
Total Trays
Total Tubes
Oysters Harvested at Full
Production
Geoducks Harvested at
Full Production
Total Production
Small 4 6 10 8 2,465 140,000 99,630 20,000 119,630
Medium 12 18 30 25 8,217 420,000 332,100 60,000 392,100
Large 22 28 50 47 676,667 630,990 630,990 99,667 727,657
Table 16. Summary of combined oyster and geoduck farm size scenarios.
AL
AS
KA
SH
EL
LF
IS
H F
EA
SI
BI
LI
TY
ST
UD
Y
26
ScenarioAverage Annual Expenses
Occupancy Operating Administrative Personnel Total
Small $12,742 $81,408 $1,738 $99,883 $195,770
Medium $17,129 $256,922 $1,848 $197,064 $472,962
Large $30,959 $417,171 $1,968 $302,228 $752,325
Small Medium Large
Occupancy Expense Average Cumulative % Average Cumulative % Average Cumulative %
Utilities and Services $646 $6,456 0.3% $903 $9,028 0.2% $999 $9,993 0.1%
Land Lease $1,394 $13,942 0.7% $3,196 $31,961 0.7% $5,172 $51,718 0.7%
Farm Equipment Direct Costs $6,969 $69,687 3.6% $7,061 $70,607 1.5% $9,558 $95,577 1.3%
Processing Facility $3,333 $33,330 1.7% $5,569 $55,690 1.2% $14,830 $148,300 2.0%
Maintenance $400 $4,000 0.2% $400 $4,000 0.1% $400 $4,000 0.1%
Total Occupancy Expense $12,742 $127,416 6.5% $17,129 $171,286 3.6% $30,959 $309,588 4.1%
Operating Expense
Seed Purchases $24,750 $247,500 12.6% $76,500 $765,000 16.2% $129,750 $1,297,500 17.2%
Production Supplies $31,744 $317,437 16.2% $96,563 $965,635 20.4% $159,807 $1,598,072 21.2%
Production Supplies Delivery $3,624 $36,241 1.9% $11,139 $111,388 2.4% $18,792 $187,925 2.5%
Gasoline $12,993 $129,932 6.6% $60,907 $609,069 12.9% $72,209 $722,086 9.6%
Packaging $1,638 $16,379 0.8% $5,154 $51,542 1.1% $29,954 $299,535 4.0%
Marketing Costs $500 $5,000 0.3% $500 $5,000 0.1% $500 $5,000 0.1%
Professional Fees/Permit Costs $591 $5,908 0.3% $591 $5,908 0.1% $591 $5,908 0.1%
Product Testing $5,568 $55,680 2.8% $5,568 $55,680 1.2% $5,568 $55,680 0.7%
Total Operating Expense $81,408 $814,077 41.6% $256,922 $2,569,222 54.3% $417,171 $4,171,707 55.5%
Administrative Expense
Office Equipment and Supplies $400 $4,000 0.2% $400 $4,000 0.1% $400 4,000 0.1%
Bookkeeping $1,200 $12,000 0.6% $1,200 $12,000 0.3% $1,200 12,000 0.2%
Payroll $138 $1,380 0.1% $248 $2,475 0.1% $368 3,677 0.0%
Total Administrative Expense $1,738 $17,380 0.9% $1,848 $18,475 0.4% $1,968 19,677 0.3%
Personnel Expense
Management $39,520 $395,200 20.2% $39,520 $395,200 8.4% $39,520 $395,200 5.3%
Oyster Production Labor $14,785 $147,850 7.6% $49,283 $492,835 10.4% $94,398 $943,978 12.5%
Geoduck Production Labor $21,408 $214,080 10.9% $61,664 $616,640 13.0% $98,565 $985,653 13.1%
Benefits & Payroll Taxes $24,169 $241,699 12.3% $46,596 $465,962 9.9% $69,745 $697,449 9.3%
Total Personnel Expense $99,883 $998,830 51.0% $197,064 $1,970,637 41.7% $302,228 $3,022,281 40.2%
Total $195,770 $1,957,702 100.0% $472,962 $4,729,620 100.0% $752,325 7,523,253 100.0%
Table 17. Summary of expenses for combined oyster and geoduck farm size scenarios.
Table 18. Itemized expenses of combined oyster and geoduck farm size scenarios.
Note: Significant expenses (greater than 5% of total expenses) are highlighted.
AL
AS
KA
SH
EL
LF
IS
H F
EA
SI
BI
LI
TY
ST
UD
Y
27
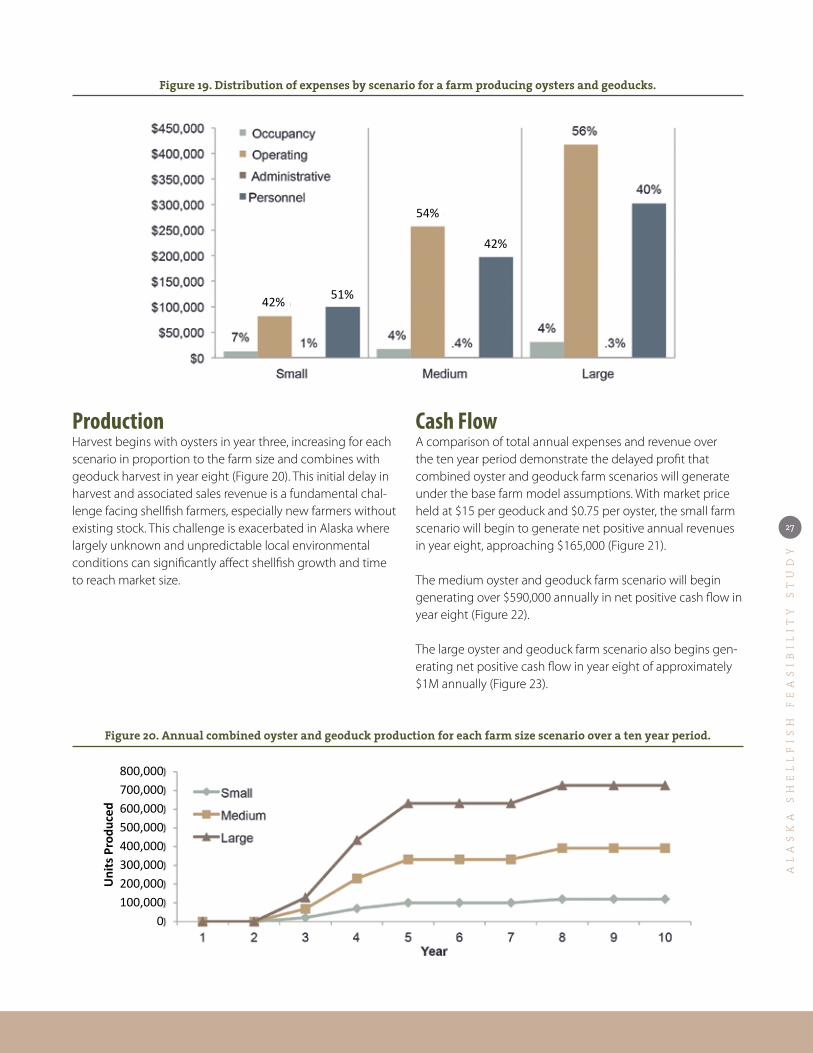
ProductionHarvest begins with oysters in year three, increasing for each scenario in proportion to the farm size and combines with geoduck harvest in year eight (Figure 20). This initial delay in harvest and associated sales revenue is a fundamental chal-lenge facing shellfish farmers, especially new farmers without existing stock. This challenge is exacerbated in Alaska where largely unknown and unpredictable local environmental conditions can significantly affect shellfish growth and time to reach market size.
Figure 19. Distribution of expenses by scenario for a farm producing oysters and geoducks.
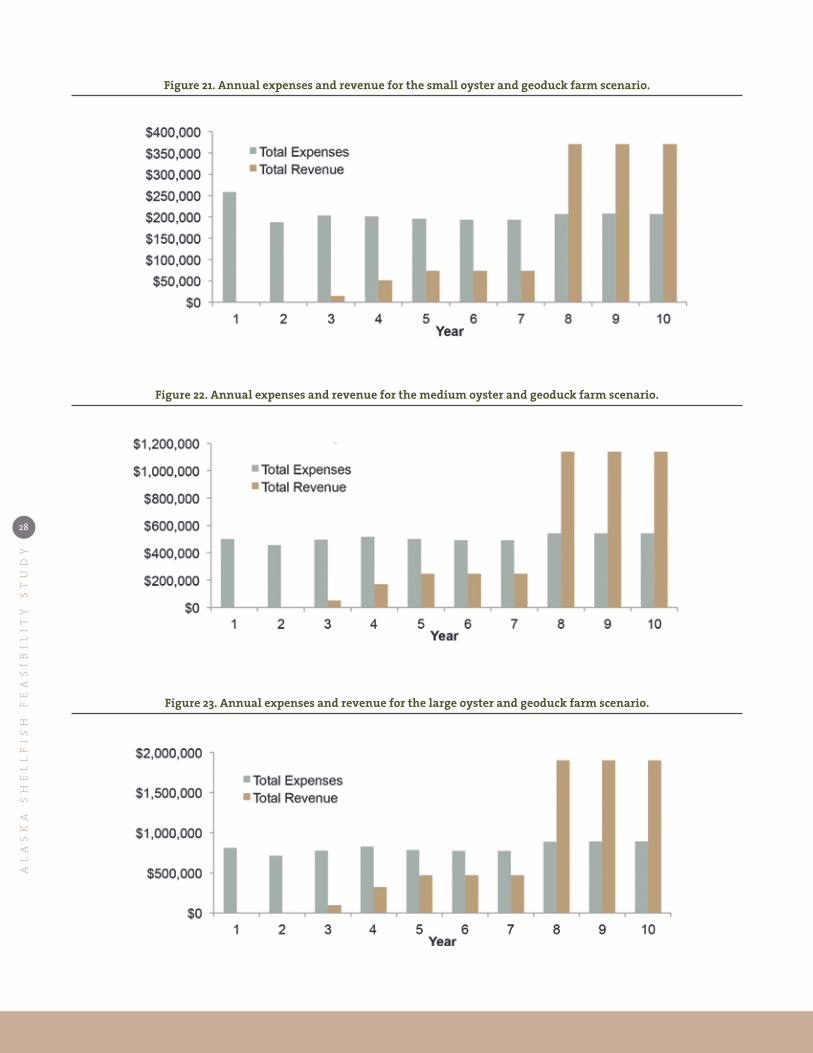
Cash FlowA comparison of total annual expenses and revenue over the ten year period demonstrate the delayed profit that combined oyster and geoduck farm scenarios will generate under the base farm model assumptions. With market price held at $15 per geoduck and $0.75 per oyster, the small farm scenario will begin to generate net positive annual revenues in year eight, approaching $165,000 (Figure 21).
The medium oyster and geoduck farm scenario will begin generating over $590,000 annually in net positive cash flow in year eight (Figure 22).
The large oyster and geoduck farm scenario also begins gen-erating net positive cash flow in year eight of approximately $1M annually (Figure 23).
Figure 20. Annual combined oyster and geoduck production for each farm size scenario over a ten year period.
800,000700,000 600,000 500,000 400,000 300,000 200,000 100,000
0
Uni
ts P
rodu
ced
54%
42%
51%42%
AL
AS
KA
SH
EL
LF
IS
H F
EA
SI
BI
LI
TY
ST
UD
Y
28
Figure 21. Annual expenses and revenue for the small oyster and geoduck farm scenario.
Figure 22. Annual expenses and revenue for the medium oyster and geoduck farm scenario.
Figure 23. Annual expenses and revenue for the large oyster and geoduck farm scenario.
AL
AS
KA
SH
EL
LF
IS
H F
EA
SI
BI
LI
TY
ST
UD
Y
29
Small Medium Large
Oysters 42% 43% 46%
Geoducks 58% 57% 54%
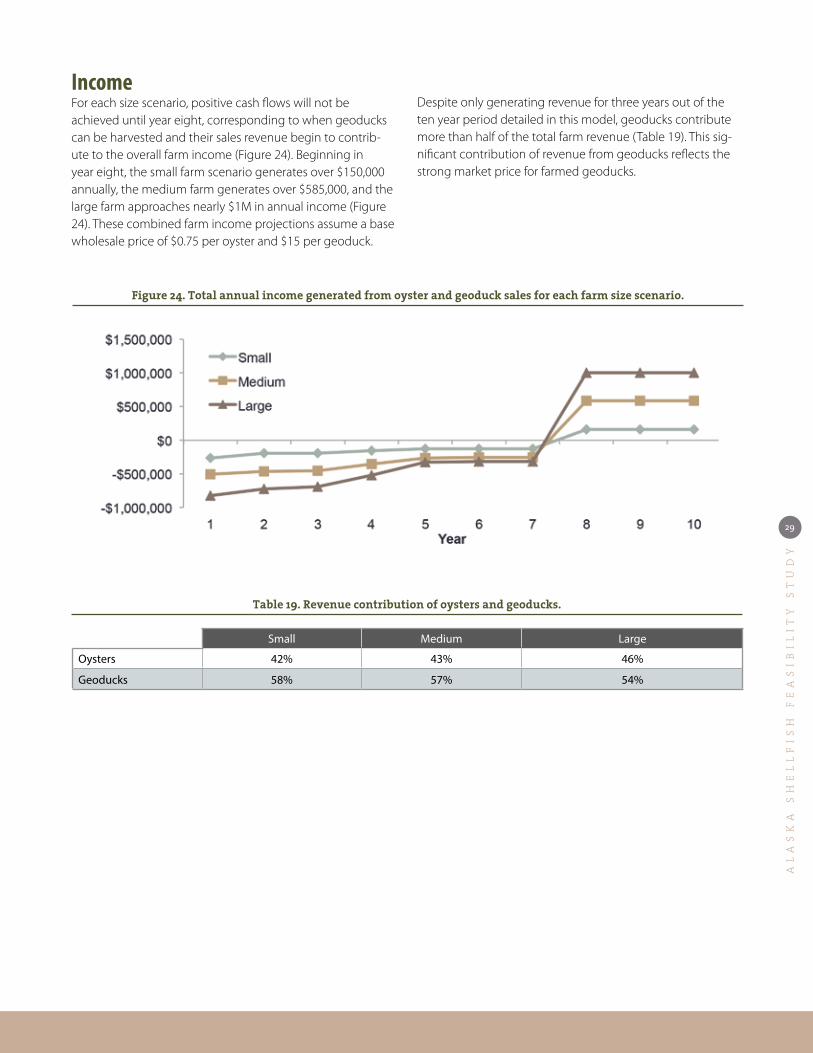
Figure 24. Total annual income generated from oyster and geoduck sales for each farm size scenario.
Table 19. Revenue contribution of oysters and geoducks.
IncomeFor each size scenario, positive cash flows will not be achieved until year eight, corresponding to when geoducks can be harvested and their sales revenue begin to contrib-ute to the overall farm income (Figure 24). Beginning in year eight, the small farm scenario generates over $150,000 annually, the medium farm generates over $585,000, and the large farm approaches nearly $1M in annual income (Figure 24). These combined farm income projections assume a base wholesale price of $0.75 per oyster and $15 per geoduck.
Despite only generating revenue for three years out of the ten year period detailed in this model, geoducks contribute more than half of the total farm revenue (Table 19). This sig-nificant contribution of revenue from geoducks reflects the strong market price for farmed geoducks.
AL
AS
KA
SH
EL
LF
IS
H F
EA
SI
BI
LI
TY
ST
UD
Y
30
ScenarioAnnual Income Cost per Unit 10 Year Period 20 Year Period Year of (+)
NPV and IRRYear 5 Year 10 Oysters Geoducks NPV IRR NPV IRR
Small -$128,142 $157,313 $1.19 $6.49 -$717,134 -16% $391,068 5% 17
Medium -$261,602 $585,918 $0.87 $5.98 -$926,895 -7% $3,200,640 12% 13
Large -$323,903 $1,001,098 $0.79 $5.77 -$1,005,992 -4% $6,046,302 13% 12
Price SensitivitySmall Farm Scenario This analysis varied the price received for oysters, while hold-ing all other aspects of the small farm operation constant, including the geoduck price of $15.
Results demonstrate that the overall farm profitability would be impacted by changes to market price; by year ten a $0.25 increase in oyster price would add over $20,000 to annual farm income (Table 21). Over a twenty year projected time
Market Price per Oyster Income (Year 5) Income (Year 10)
10 Year Period 20 Year Period Year of (+) NPV and IRRNPV IRR NPV IRR
$0.40 -$162,664 $128,660 -$905,905 -22% $449 2% 20
$0.60 -$142,937 $145,033 -$798,036 -19% $223,660 4% 18
$0.75 -$128,142 $157,313 -$717,134 -16% $391,068 5% 17
$0.80 -$123,211 $161,407 -$690,167 -15% $446,871 6% 16
$1.00 -$103,484 $177,780 -$582,297 -12% $670,082 7% 15
$1.20 -$83,757 $194,153 -$474,428 -9% $893,294 9% 14
$1.60 -$44,304 $226,899 -$258,689 -4% $1,339,716 12% 12
$2.00 -$4,850 $259,646 -$42,951 1% $1,786,138 15% 11
period, this incremental increase in market price would add almost $300,000 to the small farm NPV, and reduce the time it takes the farm to reach positive NPV and IRR by two years (Table 21). Additional increases in the market price of oysters will continue to improve farm profitability. The model demon-strates that a market price approaching $2.00 per oyster will allow a small oyster and geoduck farm to achieve positive NPV and IRR in an eleven year period
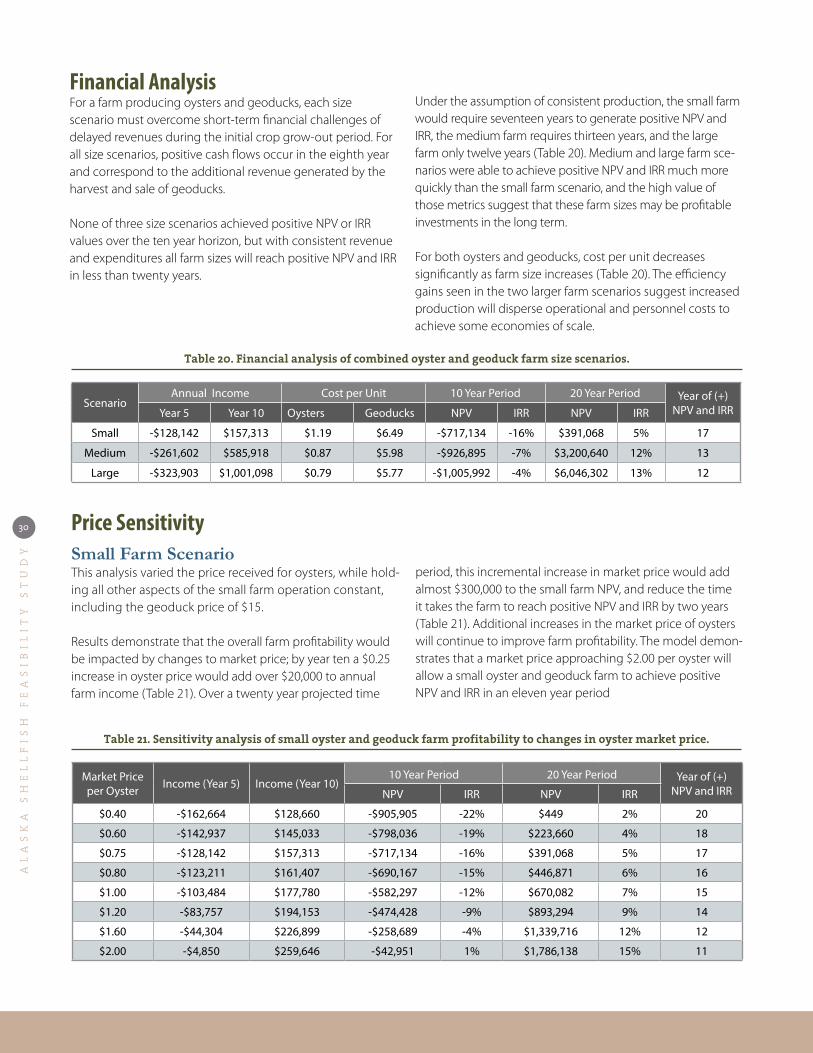
Table 20. Financial analysis of combined oyster and geoduck farm size scenarios.
Table 21. Sensitivity analysis of small oyster and geoduck farm profitability to changes in oyster market price.
Financial AnalysisFor a farm producing oysters and geoducks, each size scenario must overcome short-term financial challenges of delayed revenues during the initial crop grow-out period. For all size scenarios, positive cash flows occur in the eighth year and correspond to the additional revenue generated by the harvest and sale of geoducks.
None of three size scenarios achieved positive NPV or IRR values over the ten year horizon, but with consistent revenue and expenditures all farm sizes will reach positive NPV and IRR in less than twenty years.
Under the assumption of consistent production, the small farm would require seventeen years to generate positive NPV and IRR, the medium farm requires thirteen years, and the large farm only twelve years (Table 20). Medium and large farm sce-narios were able to achieve positive NPV and IRR much more quickly than the small farm scenario, and the high value of those metrics suggest that these farm sizes may be profitable investments in the long term.
For both oysters and geoducks, cost per unit decreases significantly as farm size increases (Table 20). The efficiency gains seen in the two larger farm scenarios suggest increased production will disperse operational and personnel costs to achieve some economies of scale.

AL
AS
KA
SH
EL
LF
IS
H F
EA
SI
BI
LI
TY
ST
UD
Y
31
Market Price per Geoduck Income (Year 5) Income (Year 10)
10 Year Period 20 Year Period Year of (+) NPV and IRRNPV IRR NPV IRR
$10.00 -$128,142 $75,143 -$918,056 -29% -$388,705 -2% 20+
$12.00 -$128,142 $108,011 -$837,687 -23% -$76,796 2% 20+
$15.00 -$128,142 $157,313 -$717,134 -16% $391,068 5% 17
$17.00 -$128,142 $190,181 -$636,765 -13% $702,978 7% 15
$19.00 -$128,142 $223,049 -$556,396 -10% $1,014,887 9% 14
$20.00 -$128,142 $239,483 -$516,211 -9% $1,170,842 10% 13
$25.00 -$128,142 $321,653 -$315,289 -4% $1,950,616 14% 12
$30.00 -$128,142 $403,823 -$114,366 0% $2,730,389 16% 11
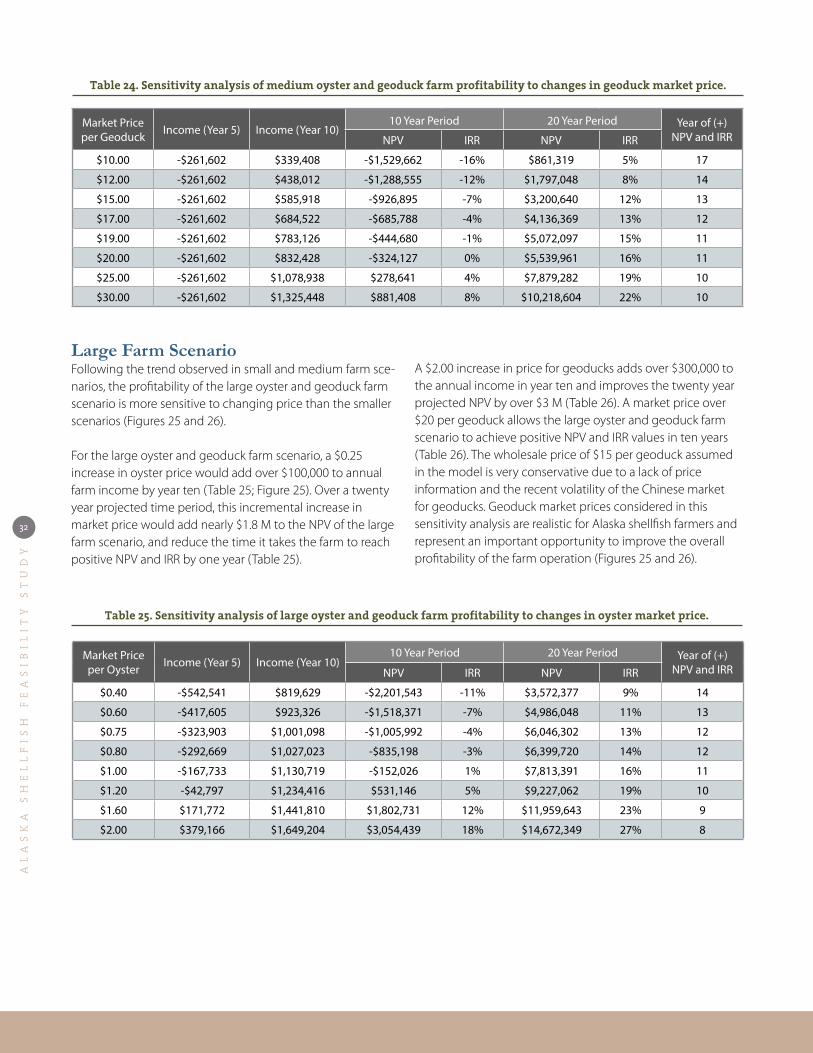
Price sensitivity analysis was completed for geoduck market price as well, with oyster price held constant at $0.75. Under the model assumptions geoducks are not harvested and sold until year eight, so changes in market price do not affect the five year annual income. However, by year ten a $2.00 increase in geoduck price adds over $30,000 to the annual farm income, and improves the twenty year NPV by over $300,000 (Table 22). This price increase would also allow a small farm to reach pos-itive NPV and IRR in fifteen years instead of seventeen (Table 22). Additional increases in geoduck market price continue to improve farm profitability; however a market price of over $30.00 per geoduck is necessary for a small farm to achieve positive NPV and IRR in an eleven year period.
Medium Farm ScenarioMarket price sensitivity analysis completed for the medi-um-sized oyster and geoduck farm demonstrated greater profitability improvements with increased price, than those achieved by the small farm scenario (Table 23).
Market Price per Oyster Income (Year 5) Income (Year 10)
10 Year Period 20 Year Period Year of (+) NPV and IRRNPV IRR NPV IRR
$0.40 -$376,675 $490,408 -$1,556,132 -13% $1,898,575 8% 15
$0.60 -$310,919 $544,985 -$1,196,568 -9% $2,642,612 10% 13
$0.75 -$261,602 $585,918 -$926,895 -7% $3,200,640 12% 13
$0.80 -$245,163 $599,563 -$837,003 -6% $3,386,650 12% 12
$1.00 -$179,407 $654,140 -$477,439 -2% $4,130,687 14% 11
$1.20 -$113,651 $708,717 -$117,875 1% $4,874,724 16% 11
$1.60 $14,724 $817,872 $590,619 8% $6,352,164 20% 10
$2.00 $123,879 $927,027 $1,251,221 13% $7,781,712 24% 9
For the medium-sized oyster and geoduck farm scenario, a $0.25 increase in oyster price would add nearly $60,000 to annual farm income by year ten (Table 23; Figure 25). Over a twenty year projected time period, this incremental increase in market price would add nearly $1M to the NPV of the medium sized farm scenario, and reduce the time it takes the farm to reach positive NPV and IRR by two years (Table 23).
Again, changes to geoduck price do not affect annual income in year five because geoducks aren’t harvested and sold until year eight. However, by year ten a $2.00 increase in price for geoducks adds nearly $100,000 to the annual income and improves the twenty year projected NPV by over $900,000 (Table 24, Figure 26). A market price approaching $25 per geoduck allows the medium-sized farm scenario to achieve positive NPV and IRR values in ten years (Table 24).
Table 22. Sensitivity analysis of small oyster and geoduck farm profitability to changes in geoduck market price.
Table 23. Sensitivity analysis of medium oyster and geoduck farm profitability to changes in oyster market price.
AL
AS
KA
SH
EL
LF
IS
H F
EA
SI
BI
LI
TY
ST
UD
Y
32
Large Farm ScenarioFollowing the trend observed in small and medium farm sce-narios, the profitability of the large oyster and geoduck farm scenario is more sensitive to changing price than the smaller scenarios (Figures 25 and 26).
For the large oyster and geoduck farm scenario, a $0.25 increase in oyster price would add over $100,000 to annual farm income by year ten (Table 25; Figure 25). Over a twenty year projected time period, this incremental increase in market price would add nearly $1.8 M to the NPV of the large farm scenario, and reduce the time it takes the farm to reach positive NPV and IRR by one year (Table 25).
Market Price per Oyster Income (Year 5) Income (Year 10)
10 Year Period 20 Year Period Year of (+) NPV and IRRNPV IRR NPV IRR
$0.40 -$542,541 $819,629 -$2,201,543 -11% $3,572,377 9% 14
$0.60 -$417,605 $923,326 -$1,518,371 -7% $4,986,048 11% 13
$0.75 -$323,903 $1,001,098 -$1,005,992 -4% $6,046,302 13% 12
$0.80 -$292,669 $1,027,023 -$835,198 -3% $6,399,720 14% 12
$1.00 -$167,733 $1,130,719 -$152,026 1% $7,813,391 16% 11
$1.20 -$42,797 $1,234,416 $531,146 5% $9,227,062 19% 10
$1.60 $171,772 $1,441,810 $1,802,731 12% $11,959,643 23% 9
$2.00 $379,166 $1,649,204 $3,054,439 18% $14,672,349 27% 8
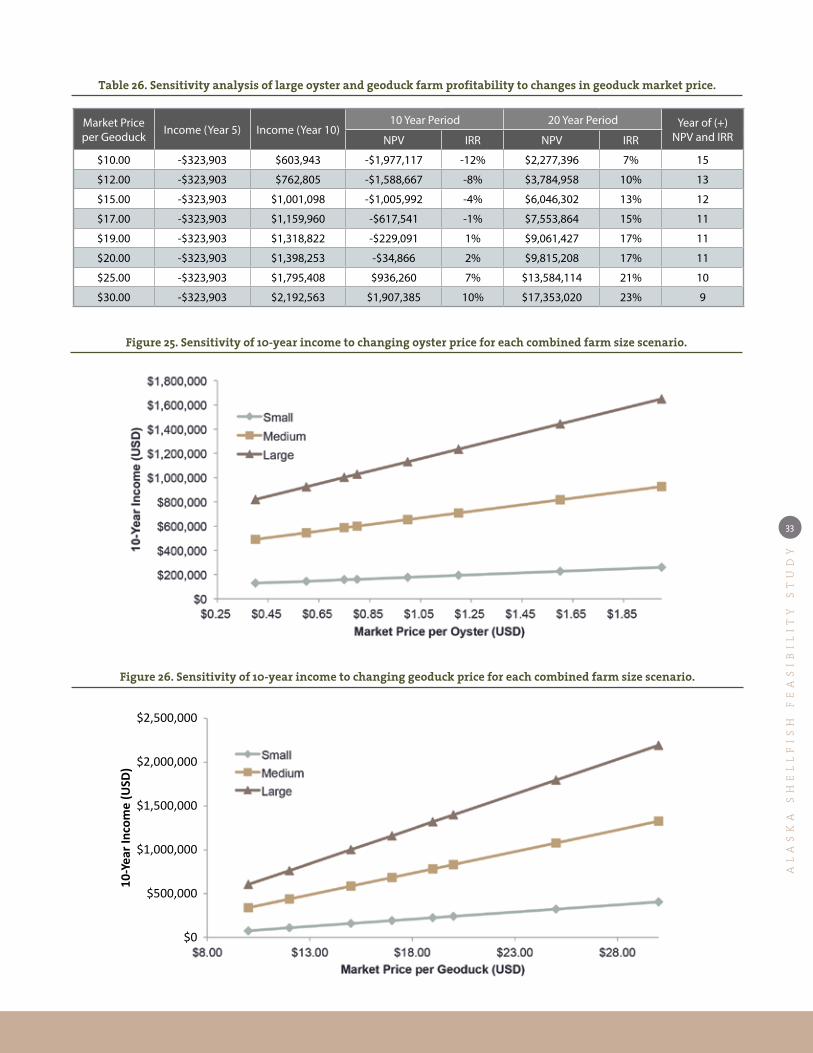
A $2.00 increase in price for geoducks adds over $300,000 to the annual income in year ten and improves the twenty year projected NPV by over $3 M (Table 26). A market price over $20 per geoduck allows the large oyster and geoduck farm scenario to achieve positive NPV and IRR values in ten years (Table 26). The wholesale price of $15 per geoduck assumed in the model is very conservative due to a lack of price information and the recent volatility of the Chinese market for geoducks. Geoduck market prices considered in this sensitivity analysis are realistic for Alaska shellfish farmers and represent an important opportunity to improve the overall profitability of the farm operation (Figures 25 and 26).
Table 25. Sensitivity analysis of large oyster and geoduck farm profitability to changes in oyster market price.
Market Price per Geoduck Income (Year 5) Income (Year 10)
10 Year Period 20 Year Period Year of (+) NPV and IRRNPV IRR NPV IRR
$10.00 -$261,602 $339,408 -$1,529,662 -16% $861,319 5% 17
$12.00 -$261,602 $438,012 -$1,288,555 -12% $1,797,048 8% 14
$15.00 -$261,602 $585,918 -$926,895 -7% $3,200,640 12% 13
$17.00 -$261,602 $684,522 -$685,788 -4% $4,136,369 13% 12
$19.00 -$261,602 $783,126 -$444,680 -1% $5,072,097 15% 11
$20.00 -$261,602 $832,428 -$324,127 0% $5,539,961 16% 11
$25.00 -$261,602 $1,078,938 $278,641 4% $7,879,282 19% 10
$30.00 -$261,602 $1,325,448 $881,408 8% $10,218,604 22% 10
Table 24. Sensitivity analysis of medium oyster and geoduck farm profitability to changes in geoduck market price.
AL
AS
KA
SH
EL
LF
IS
H F
EA
SI
BI
LI
TY
ST
UD
Y
33
Market Price per Geoduck Income (Year 5) Income (Year 10)
10 Year Period 20 Year Period Year of (+) NPV and IRRNPV IRR NPV IRR
$10.00 -$323,903 $603,943 -$1,977,117 -12% $2,277,396 7% 15
$12.00 -$323,903 $762,805 -$1,588,667 -8% $3,784,958 10% 13
$15.00 -$323,903 $1,001,098 -$1,005,992 -4% $6,046,302 13% 12
$17.00 -$323,903 $1,159,960 -$617,541 -1% $7,553,864 15% 11
$19.00 -$323,903 $1,318,822 -$229,091 1% $9,061,427 17% 11
$20.00 -$323,903 $1,398,253 -$34,866 2% $9,815,208 17% 11
$25.00 -$323,903 $1,795,408 $936,260 7% $13,584,114 21% 10
$30.00 -$323,903 $2,192,563 $1,907,385 10% $17,353,020 23% 9
Table 26. Sensitivity analysis of large oyster and geoduck farm profitability to changes in geoduck market price.
Figure 25. Sensitivity of 10-year income to changing oyster price for each combined farm size scenario.
Figure 26. Sensitivity of 10-year income to changing geoduck price for each combined farm size scenario.
$2,500,000
$2,000,000
$1,500,000
$1,000,000
$500,000
$0
10-Y
ear I
ncom
e (U
SD)
AL
AS
KA
SH
EL
LF
IS
H F
EA
SI
BI
LI
TY
ST
UD
Y
34
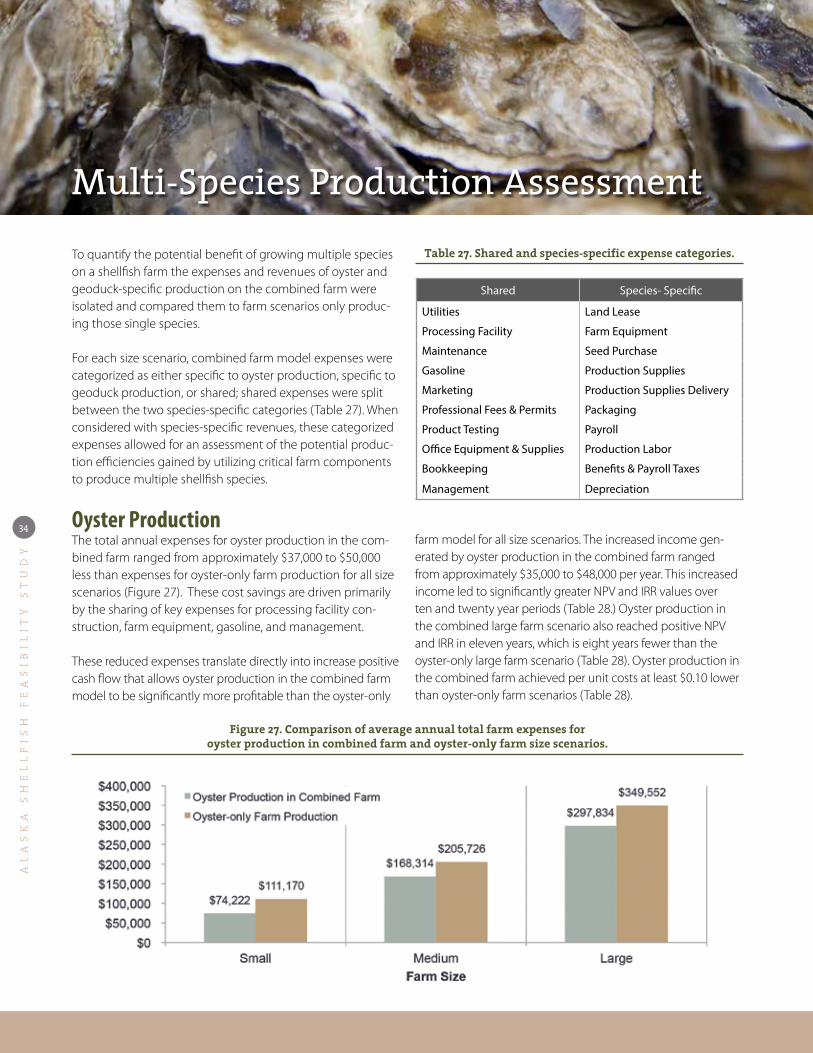
Multi-Species Production Assessment
Shared Species- Specific
Utilities Land Lease
Processing Facility Farm Equipment
Maintenance Seed Purchase
Gasoline Production Supplies
Marketing Production Supplies Delivery
Professional Fees & Permits Packaging
Product Testing Payroll
Office Equipment & Supplies Production Labor
Bookkeeping Benefits & Payroll Taxes
Management Depreciation
To quantify the potential benefit of growing multiple species on a shellfish farm the expenses and revenues of oyster and geoduck-specific production on the combined farm were isolated and compared them to farm scenarios only produc-ing those single species.
For each size scenario, combined farm model expenses were categorized as either specific to oyster production, specific to geoduck production, or shared; shared expenses were split between the two species-specific categories (Table 27). When considered with species-specific revenues, these categorized expenses allowed for an assessment of the potential produc-tion efficiencies gained by utilizing critical farm components to produce multiple shellfish species.
Oyster Production The total annual expenses for oyster production in the com-bined farm ranged from approximately $37,000 to $50,000 less than expenses for oyster-only farm production for all size scenarios (Figure 27). These cost savings are driven primarily by the sharing of key expenses for processing facility con-struction, farm equipment, gasoline, and management.
These reduced expenses translate directly into increase positive cash flow that allows oyster production in the combined farm model to be significantly more profitable than the oyster-only
farm model for all size scenarios. The increased income gen-erated by oyster production in the combined farm ranged from approximately $35,000 to $48,000 per year. This increased income led to significantly greater NPV and IRR values over ten and twenty year periods (Table 28.) Oyster production in the combined large farm scenario also reached positive NPV and IRR in eleven years, which is eight years fewer than the oyster-only large farm scenario (Table 28). Oyster production in the combined farm achieved per unit costs at least $0.10 lower than oyster-only farm scenarios (Table 28).
Table 27. Shared and species-specific expense categories.
Figure 27. Comparison of average annual total farm expenses for oyster production in combined farm and oyster-only farm size scenarios.

AL
AS
KA
SH
EL
LF
IS
H F
EA
SI
BI
LI
TY
ST
UD
Y
35
ScenarioAnnual Income Cost per
Unit10 Year Period 20 Year Period Year of (+)
NPV and IRRYear 5 Year 10 NPV IRR NPV IRR
Small -$1,296 $492 $1.19 -$269,891 N/A -$266,422 N/A 20+
Medium $60,968 $58,947 $0.87 -$167,800 -5% $247,457 7% 14
Large $135,455 $131,655 $0.79 -$64,308 1% $863,143 11% 11
Geoduck ProductionTotal expenses of geoduck production in the combined farm ranged from approximately$18,000 to $37,000 less than expenses for geoduck-only farm production for all size scenarios (Figure 28). Similar to oyster production, these cost savings are driven primarily by the sharing of key expenses for the processing facility construction, farm equipment, and management.
Again, results show that reduced expenses translate into increased cash flow that allows geoduck production in the
ScenarioAnnual Income Cost per
Unit10 Year Period 20 Year Period Year of (+)
NPV and IRRYear 5 Year 10 NPV IRR NPV IRR
Small -$123,273 $167,213 $6.49 -$387,954 -11% $789,985 10% 14
Medium -$323,842 $532,557 $5.98 -$740,847 -7% $3,010,781 13% 12
Large -$458,813 $877,761 $5.77 -$836,171 -4% $5,347,268 14% 12
combined farm model to be significantly more profitable than geoduck-only farm scenarios. The increased income ranged from approximately $10,000 to $40,000 per year and contributed to larger annual NPV and IRR values than the geoduck-only scenarios. Geoduck production in the com-bined large farm scenario generated positive NPV and IRR in twelve years, which is one year less than the geoduck-only large farm scenario (Table 29). Geoduck production in the combined farm also achieved per unit costs at least $0.17 less than geoduck-only farm scenarios (Table 29).
Table 28. Financial analysis of oyster production in combined farm scenarios.
Figure 28. Comparison of average annual total farm expenses for geoduck production in combined farm and geoduck-only farm size scenarios.
Table 29. Financial analysis of geoduck production in combined farm scenarios.
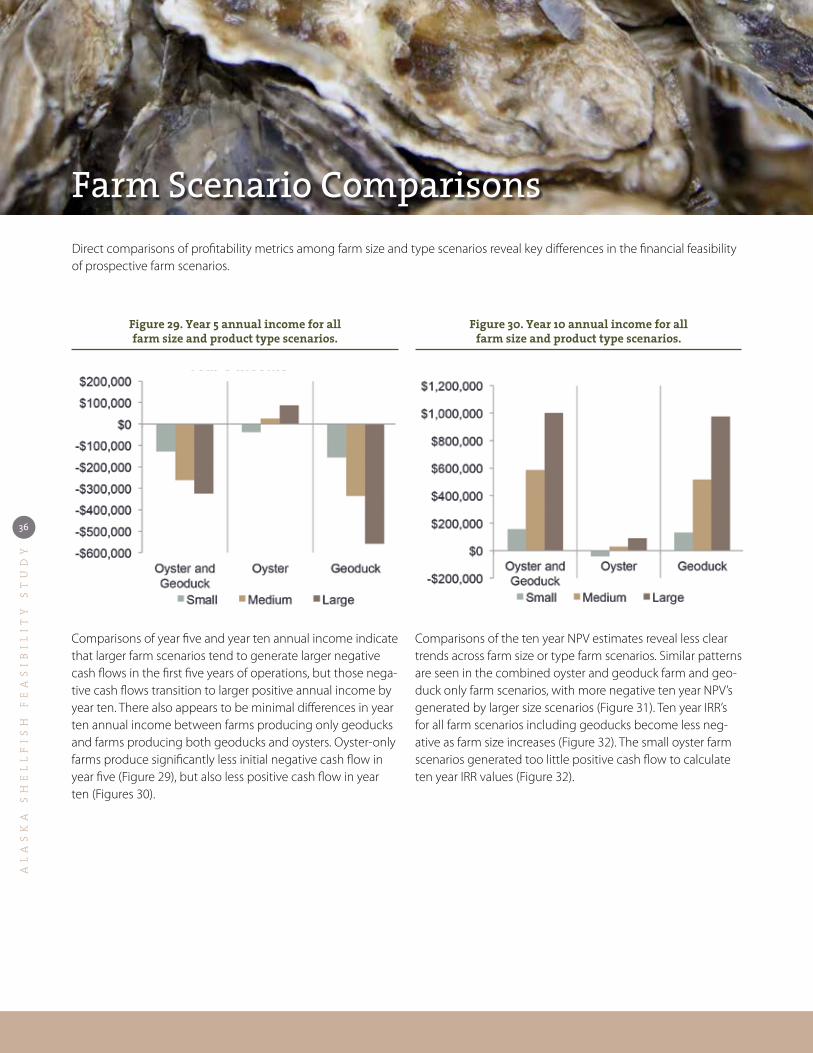
AL
AS
KA
SH
EL
LF
IS
H F
EA
SI
BI
LI
TY
ST
UD
Y
36
Farm Scenario ComparisonsDirect comparisons of profitability metrics among farm size and type scenarios reveal key differences in the financial feasibility of prospective farm scenarios.
Comparisons of year five and year ten annual income indicate that larger farm scenarios tend to generate larger negative cash flows in the first five years of operations, but those nega-tive cash flows transition to larger positive annual income by year ten. There also appears to be minimal differences in year ten annual income between farms producing only geoducks and farms producing both geoducks and oysters. Oyster-only farms produce significantly less initial negative cash flow in year five (Figure 29), but also less positive cash flow in year ten (Figures 30).
Comparisons of the ten year NPV estimates reveal less clear trends across farm size or type farm scenarios. Similar patterns are seen in the combined oyster and geoduck farm and geo-duck only farm scenarios, with more negative ten year NPV’s generated by larger size scenarios (Figure 31). Ten year IRR’s for all farm scenarios including geoducks become less neg-ative as farm size increases (Figure 32). The small oyster farm scenarios generated too little positive cash flow to calculate ten year IRR values (Figure 32).
Figure 29. Year 5 annual income for all farm size and product type scenarios.
Figure 30. Year 10 annual income for all farm size and product type scenarios.
AL
AS
KA
SH
EL
LF
IS
H F
EA
SI
BI
LI
TY
ST
UD
Y
37
Figure 31. 10 year NPV for all farm size and product type scenarios.
Figure 32. 10 year IRR for all farm size and product type scenarios.*
Figure 33. 20 year NPV for all farm size and product type scenarios.
Figure 34. 20 year IRR for all farm size and product type scenarios.
*10 year IRR could not be calculated for small oyster farm size scenarios.
*20 year IRR could not be calculated for the small oyster only farm scenario. *20 year NPV could not be calculated for the small oyster only farm scenario.
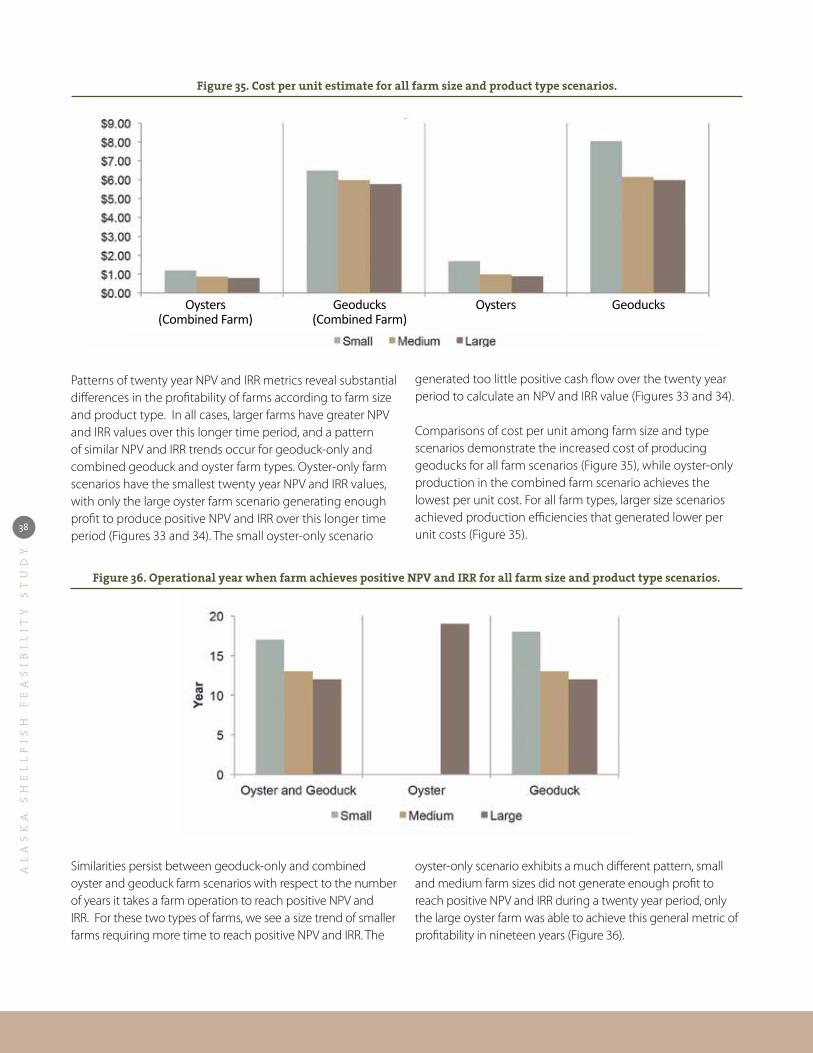
AL
AS
KA
SH
EL
LF
IS
H F
EA
SI
BI
LI
TY
ST
UD
Y
38
Similarities persist between geoduck-only and combined oyster and geoduck farm scenarios with respect to the number of years it takes a farm operation to reach positive NPV and IRR. For these two types of farms, we see a size trend of smaller farms requiring more time to reach positive NPV and IRR. The
Patterns of twenty year NPV and IRR metrics reveal substantial differences in the profitability of farms according to farm size and product type. In all cases, larger farms have greater NPV and IRR values over this longer time period, and a pattern of similar NPV and IRR trends occur for geoduck-only and combined geoduck and oyster farm types. Oyster-only farm scenarios have the smallest twenty year NPV and IRR values, with only the large oyster farm scenario generating enough profit to produce positive NPV and IRR over this longer time period (Figures 33 and 34). The small oyster-only scenario
generated too little positive cash flow over the twenty year period to calculate an NPV and IRR value (Figures 33 and 34).
Comparisons of cost per unit among farm size and type scenarios demonstrate the increased cost of producing geoducks for all farm scenarios (Figure 35), while oyster-only production in the combined farm scenario achieves the lowest per unit cost. For all farm types, larger size scenarios achieved production efficiencies that generated lower per unit costs (Figure 35).
Figure 35. Cost per unit estimate for all farm size and product type scenarios.
Figure 36. Operational year when farm achieves positive NPV and IRR for all farm size and product type scenarios.
oyster-only scenario exhibits a much different pattern, small and medium farm sizes did not generate enough profit to reach positive NPV and IRR during a twenty year period, only the large oyster farm was able to achieve this general metric of profitability in nineteen years (Figure 36).
Geoducks(Combined Farm)
Oysters(Combined Farm)
GeoducksOysters
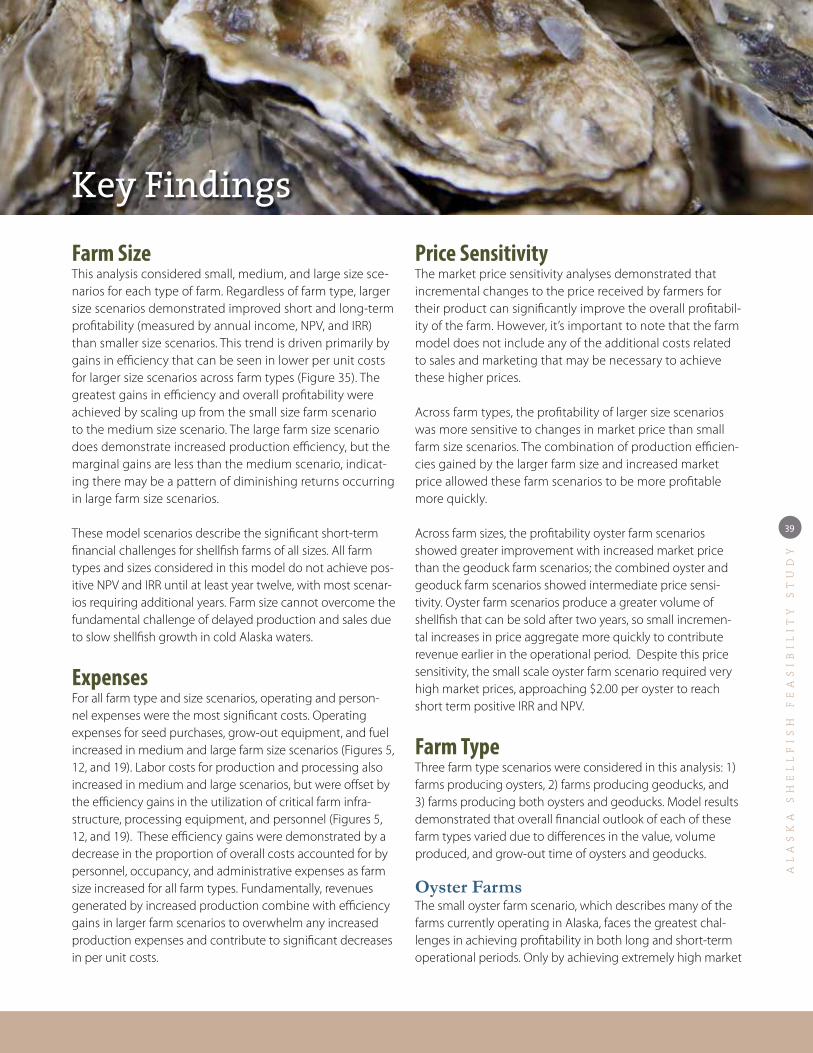
AL
AS
KA
SH
EL
LF
IS
H F
EA
SI
BI
LI
TY
ST
UD
Y
39
Key Findings
Farm SizeThis analysis considered small, medium, and large size sce-narios for each type of farm. Regardless of farm type, larger size scenarios demonstrated improved short and long-term profitability (measured by annual income, NPV, and IRR) than smaller size scenarios. This trend is driven primarily by gains in efficiency that can be seen in lower per unit costs for larger size scenarios across farm types (Figure 35). The greatest gains in efficiency and overall profitability were achieved by scaling up from the small size farm scenario to the medium size scenario. The large farm size scenario does demonstrate increased production efficiency, but the marginal gains are less than the medium scenario, indicat-ing there may be a pattern of diminishing returns occurring in large farm size scenarios.
These model scenarios describe the significant short-term financial challenges for shellfish farms of all sizes. All farm types and sizes considered in this model do not achieve pos-itive NPV and IRR until at least year twelve, with most scenar-ios requiring additional years. Farm size cannot overcome the fundamental challenge of delayed production and sales due to slow shellfish growth in cold Alaska waters.
ExpensesFor all farm type and size scenarios, operating and person-nel expenses were the most significant costs. Operating expenses for seed purchases, grow-out equipment, and fuel increased in medium and large farm size scenarios (Figures 5, 12, and 19). Labor costs for production and processing also increased in medium and large scenarios, but were offset by the efficiency gains in the utilization of critical farm infra-structure, processing equipment, and personnel (Figures 5, 12, and 19). These efficiency gains were demonstrated by a decrease in the proportion of overall costs accounted for by personnel, occupancy, and administrative expenses as farm size increased for all farm types. Fundamentally, revenues generated by increased production combine with efficiency gains in larger farm scenarios to overwhelm any increased production expenses and contribute to significant decreases in per unit costs.
Price SensitivityThe market price sensitivity analyses demonstrated that incremental changes to the price received by farmers for their product can significantly improve the overall profitabil-ity of the farm. However, it’s important to note that the farm model does not include any of the additional costs related to sales and marketing that may be necessary to achieve these higher prices.
Across farm types, the profitability of larger size scenarios was more sensitive to changes in market price than small farm size scenarios. The combination of production efficien-cies gained by the larger farm size and increased market price allowed these farm scenarios to be more profitable more quickly.
Across farm sizes, the profitability oyster farm scenarios showed greater improvement with increased market price than the geoduck farm scenarios; the combined oyster and geoduck farm scenarios showed intermediate price sensi-tivity. Oyster farm scenarios produce a greater volume of shellfish that can be sold after two years, so small incremen-tal increases in price aggregate more quickly to contribute revenue earlier in the operational period. Despite this price sensitivity, the small scale oyster farm scenario required very high market prices, approaching $2.00 per oyster to reach short term positive IRR and NPV.
Farm TypeThree farm type scenarios were considered in this analysis: 1) farms producing oysters, 2) farms producing geoducks, and 3) farms producing both oysters and geoducks. Model results demonstrated that overall financial outlook of each of these farm types varied due to differences in the value, volume produced, and grow-out time of oysters and geoducks.
Oyster FarmsThe small oyster farm scenario, which describes many of the farms currently operating in Alaska, faces the greatest chal-lenges in achieving profitability in both long and short-term operational periods. Only by achieving extremely high market

AL
AS
KA
SH
EL
LF
IS
H F
EA
SI
BI
LI
TY
ST
UD
Y
40
prices approaching $2.00 per oyster will the small oyster farm scenario achieve positive NPV and IRR over a twenty year period. However, oyster farms also incur the least short-term debt in the first five years of operation and as farm size increases in medium and large scenarios, the potential prof-itability of oyster farms improves significantly. Also, because of the high volume production, oyster farm scenarios of all sizes achieve the lowest cost per unit. The model results demonstrate that the combination of larger farm size and higher market prices may allow a medium size oyster farm to generate significant profits over a ten year period.
Geoduck FarmsThere are currently no farms in Alaska commercially pro-ducing geoducks using the intertidal grow-out methods assumed in this analysis. Model results show that the initial eight year grow-out period for geoducks prevents scenarios of any size from generating positive NPV and IRR in less than ten years. However, because of the high value of geoducks, all size scenarios are generating positive cash flow by year ten, and by garnering increased market prices even the small farm scenario may generate significant twenty year NPV’s approaching $1M. Due to the relatively “high value, low volume” nature of geoduck production, the geoduck-only scenarios produce the highest costs per unit. In general, these results suggest that geoduck farms may generate substantial long term returns on investment if they are able to accom-modate short term negative cash flows. Increases in farm size and market price will significantly improve profitability in the long-term.
Oyster and Geoduck FarmsCurrently, no shellfish farms in Alaska are producing both oysters and geoducks for commercial sale. The combined farm scenario blends the profitability projections of each individual product line, so that the initial revenue delay from geoduck production is partially buffered by oyster harvest and sales. Relatively high volume oyster production also contributes to a lower cost per unit than geoduck only farms across all size scenarios. However, only by garnering high market prices for oysters are the medium and large farm size scenarios able to achieve positive NPV and IRR by year ten. Conversely, across all size scenarios, the poten-tial long-term profitability of the combined farm greatly exceeds that of the oyster-only farm and is slightly better than the geoduck-only farm.
Much of the same equipment, labor, and infrastructure are required to operate an oyster or geoduck farm, and the complementary growing requirements may allow both to be farmed efficiently. Oysters tend to be a labor inten-sive, high volume, and relatively low value product, while geoducks may be less labor intensive and high value, but produced in lower volumes. These results suggest that the overall profitability of farms producing one type of shellfish is improved by diversification into an additional comple-mentary species.
AL
AS
KA
SH
EL
LF
IS
H F
EA
SI
BI
LI
TY
ST
UD
Y
41
Recommendations
Farm SizeNew entrants into the Alaska shellfish farming industry should consider long-term investments in medium or large-scale farms. According to the model scenarios these are farms that utilize 12 to 22 submerged acres for oysters, and 18 to 28 intertidal acres for geoducks. According to the model, farms of these sizes produce over 300,000 oysters and 60,000 geoducks annually at full capacity. Larger farm sizes continue to generate increased revenues, but may demonstrate diminishing returns in terms of production efficiency.
Under the base model assumptions, medium and large farms that include geoduck production may expect positive returns on investment in twelve to thirteen years while oyster-only farms may require nineteen years according to model results. However, the profitability of all farm scenarios is highly sensitive to changes in market price; medium and large oyster farms in particular may be able to generate significant positive returns in fewer than ten years if they can garner market prices above $1.00 per oyster. Financing programs aimed at supporting mari-culture industry development in Alaska may consider aligning their repayment requirements with these more conservative profit horizons to better serve the needs of Alaska farmers.
Small farms in Alaska, particularly those producing only oysters, will likely face significant challenges in overcoming operational expenses to produce sustainable positive revenue. These farms may improve their financial competitiveness by scaling-up production or entering into a cooperative business structure that allows for sharing of costs and benefits between multiple farms. Price sensitivity analyses also suggests that to achieve long-term financial viability small oyster farms will need to garner very high prices for their shellfish product, approaching $2.00 per oyster. This may only be possible by directly market-ing and selling to consumers and restaurants, which will incur additional sales costs.
Product DiversityProduct diversity may prove to be important to the profit-ability of shellfish farms in Alaska. This analysis shows that farms producing only one type of shellfish will generate less revenue than farms producing multiple species, and may not
be fully utilizing their investments in infrastructure, equip-ment, and labor. Furthermore, by dispersing key expenses farms that produce both oysters and geoducks may save approximately $10,000 to $48,000 annually in total expenses compared to farms producing one shellfish species.
Geoducks have been recognized by shellfish farmers in Alaska and the Pacific Northwest for their established market demand and high value, but it may be challenging to locate the available intertidal acreage necessary for large-scale geoduck cultivation in areas with submerged acreage suitable for suspended oyster production. Mussels, clams, abalone, and other species have all been identified as potentially profitable and feasible species to cultivate in Alaska. These other shellfish species may also complement oyster production for Alaska farmers, depending on the specific regional and operational characteristics of the farm. Some of these shellfish species may grow to reach market size more quickly than geoducks, which would help mitigate challenges related to the initial delay in revenue generation demonstrated in this model, and improve the overall financial outlook for the farm operation.
There may be significant technical, operational, and regulatory challenges to diversifying shellfish farm production in Alaska. Management agencies, industry groups, and researchers should pursue activities that support farm diversification. Specifically, the joint ADF&G/ADNR Aquatic Farm Program should ensure that the regulatory and permitting process accommodates these types of diverse farm operations. Research and development efforts should be focused on over-coming the technical challenges to successfully growing these alternate shellfish species in Alaska.
Site SelectionProspective entrants into the Alaska shellfish farming industry should carefully consider where they locate their farms. The distance of a farm from a regional transportation hub or pop-ulation center is a critical consideration in Alaska that has cost implications for many different components of a farm oper-ation. Personnel and shipping expenses are key areas related to farm location where larger farms may be able achieve to

AL
AS
KA
SH
EL
LF
IS
H F
EA
SI
BI
LI
TY
ST
UD
Y
42
efficiencies. By hiring part-time employees and locating the farm as close as possible to buyers or transportation hubs, farmers may be able to significantly reduce these expenses.
Co-locating or clustering farms near each other may allow for valuable cost-reducing business collaborations; if possible new farmers should locate their farms close to other farmers and utilize existing infrastructure. By siting near existing farms, new farmers may be able to fulfill regulatory requirements more quickly and affordably through the sharing of permitting and water-quality testing duties. Farm clusters may also offer general technical and operational assistance to new farmers, and provide opportunities to share important logistic expenses related to shipping and storage. Farm clusters in Alaska are cur-rently located around Kachemak Bay, near Homer and Naukati Bay on Prince of Wales Island. Maps of currently operational shellfish farms in Alaska are available at the ADF&G Aquatic Farm Program website: http://www.adfg.alaska.gov/index.cfm?adfg=fishingaquaticfarming.maps.
Business PlanningShellfish farms in Alaska should be recognized as potentially profitable over a long-term planning horizon, at least twelve to thirteen years according to the model, though it is possible for farmers to improve this profitability horizon to less than ten years by achieving high market prices for their products through direct marketing and sales. While long-term planning is difficult for a developing industry like shellfish mariculture in Alaska, new and existing famers should develop long-term business plans based on a twenty-year operational period.
Farmers should utilize this long-term planning perspective to track key operating and personnel expenses that will help identify opportunities to improve efficiency. Incremental gains in efficiency in shellfish production and processing, facilitated by critical farm infrastructure and equipment, will accrue over time to significantly reduce expenses and improve overall farm profitability. Critical infrastructure and equipment that will support efficiency gains may include mechanical lift and boom systems, fuel-efficient generators and vessels with the appropriate capacity for farm tasks, mechanized sorting and tumbling systems, and a secure facility to accommodate pro-cessing, packaging, and storage operations. By front-loading investments in critical infrastructure and equipment necessary to produce larger volumes of shellfish, more efficient farm operations may generate revenues necessary to cover costs and produce valuable returns on investment.
The State of Alaska, Division of Economic Development, Mariculture Loan Program is a financing option available to provide Alaska farmers with the capital to invest in these important farm components.
Business ModelVertical integration is a critical component of shellfish farms that was not considered in this farm model. Medium and large sized farms may invest in nursery operations that will improve the quality, consistency, and growth of juvenile shellfish. Intermediate culture methods, such as intertidal flip flop bags or suspended floating bags, have also been shown to decrease production and labor costs for oyster farms in Alaska. These investments will be relatively small compared to the entire farm operation and will reduce overall labor expenses and ensure high quality seed supply. Nursery oper-ations may also allow a farm to diversify its business model to sell seed to other farmers.
To ensure farmers are getting the best possible price for their product, farms will benefit by establishing the capacity to fully process, ship, and sell their product directly to specific mar-kets. Market price sensitivity analysis demonstrates that higher market prices earned by high-quality shellfish products can significantly improve the overall profitability of all farm scenarios. These results suggest that farmers should pursue opportunities to achieve increased market prices and ensure that increasing production volume does not compromise product quality.
Higher prices can likely only be achieved through direct marketing and sales of high-quality Alaska farmed shellfish directly to consumers or restaurants. It is important to note that the model did not incorporate any of the additional costs of direct marketing and sales. Farmers should consider the cooperative farm model as an opportunity to collec-tively achieve economies of scale and disperse some of the additional costs of direct marketing and sales. There are currently cooperative shellfish farm operations occurring in Kachemak Bay, near Homer and on Prince of Wales Island. Shellfish farmers may also seek to engage with community supported agriculture (CSA) programs, sustainable food programs, and other cooperative arrangements to directly connect their high quality product to consumers. There is good precedent for successful direct marketing and sales in the Alaska seafood industry, but these ventures incur significant additional capital and time costs that should be fully considered by farmers.
The development of these front-end and back-end com-ponents of the farm will increase the revenue generated by farms and decrease labor and other operational costs. These investments have the potential to significantly improve the overall financial outlook of the farm over the long-term.
AL
AS
KA
SH
EL
LF
IS
H F
EA
SI
BI
LI
TY
ST
UD
Y
43
Appendix A. Farm Model Assumptions
1. Site Leasing and PermitsBased on information from the Alaska Department of Natural Resources (DNR), most shellfish farm operations require a tideland or submerged site of one to six acres in size, but three acres is currently considered the minimum size for an economically viable operation. The aquatic farm operation requires additional facilities for processing and storage on adjacent uplands or submerged lands. DNR administers lease fees on a per acre basis, with the initial farm acre requiring a higher fee than subsequent acres (Table A1).
Annual Lease Fees
Tide and/or submerged land
$450 per acre for the first acre
$125 per acre for each additional acre
Tide or submerged land for farm facilities
$875 for the first acre
$125 per acre for each additional acre
Based on information from the Alaska Oyster Growers Manual, it is assumed that 0.46 acres of sea surface are needed to support a single oyster grow-out raft, so eight rafts require 3.66 acres. Total sea surface lease area required and the associated fees for oyster farming in each scenario depend on the number of rafts required.
Geoducks are farmed on the land adjacent to the sea surface; the analysis assumes that planting 20,000 tubes requires around 0.8 acres of land. Acreage required for geoduck farming is dependent on the quantity of tubes planted. In addition, the farm operation support facility requires 0.2 acres.
Other assumed fees associated with the lease application and operational permit include an application and public notice fee, security bond, and water classification fee.
2. SeedThe reliable and timely supply of good quality seed is critical consideration for any shellfish farm. Alaska shellfish farm-ers have been persistently challenged by seed supply, and currently there is no in-state source of oyster seed. This may change in the near future with the recent redirection of the OceansAlaska shellfish hatchery in Ketchikan toward com-mercial production of oyster seed for the Alaska industry.Currently, Alaska farmers will purchase oyster seed from any available and approved source, this includes out of state hatcheries or small-scale nursery operations in Alaska. The farm model assumes seed purchased from a nursery at a size preferred by Alaska farmers. Geoduck seed is available from the Allutiq Pride hatchery in Seward.
Oysters Geoducks Combined
Small 150,000 60,000 210,000
Medium 500,000 180,000 680,000
Large 950,000 290,000 1,240,000
Seed Size Cost
Oyster Seed 20-30mm $45/1000 oysters
Geoduck Seed 3mm $0.3/ geoduck
No scaling up of production within size scenarios is incorporated in the farm models. Annual oyster and geoduck production begins at maximum levels in year one and the same number of seed is cultured each year. Production equipment requirements and expenses are based on annual seed amounts and increase incrementally as production increases in medium and large scenarios.
Table A1. Lease fees.
Table A2. Seed size and cost.
Table A3. Annual seed quantity.
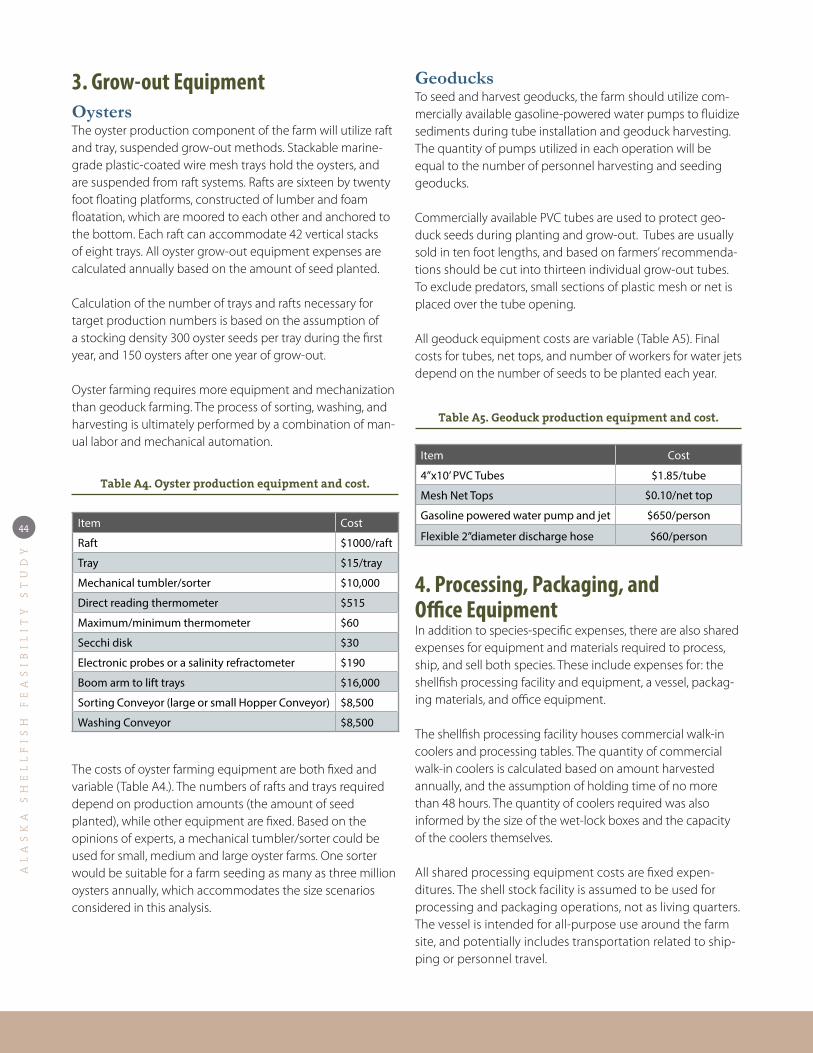
AL
AS
KA
SH
EL
LF
IS
H F
EA
SI
BI
LI
TY
ST
UD
Y
44
3. Grow-out EquipmentOysters The oyster production component of the farm will utilize raft and tray, suspended grow-out methods. Stackable marine-grade plastic-coated wire mesh trays hold the oysters, and are suspended from raft systems. Rafts are sixteen by twenty foot floating platforms, constructed of lumber and foam floatation, which are moored to each other and anchored to the bottom. Each raft can accommodate 42 vertical stacks of eight trays. All oyster grow-out equipment expenses are calculated annually based on the amount of seed planted.
Calculation of the number of trays and rafts necessary for target production numbers is based on the assumption of a stocking density 300 oyster seeds per tray during the first year, and 150 oysters after one year of grow-out.
Oyster farming requires more equipment and mechanization than geoduck farming. The process of sorting, washing, and harvesting is ultimately performed by a combination of man-ual labor and mechanical automation.
Item Cost
Raft $1000/raft
Tray $15/tray
Mechanical tumbler/sorter $10,000
Direct reading thermometer $515
Maximum/minimum thermometer $60
Secchi disk $30
Electronic probes or a salinity refractometer $190
Boom arm to lift trays $16,000
Sorting Conveyor (large or small Hopper Conveyor) $8,500
Washing Conveyor $8,500
The costs of oyster farming equipment are both fixed and variable (Table A4.). The numbers of rafts and trays required depend on production amounts (the amount of seed planted), while other equipment are fixed. Based on the opinions of experts, a mechanical tumbler/sorter could be used for small, medium and large oyster farms. One sorter would be suitable for a farm seeding as many as three million oysters annually, which accommodates the size scenarios considered in this analysis.
GeoducksTo seed and harvest geoducks, the farm should utilize com-mercially available gasoline-powered water pumps to fluidize sediments during tube installation and geoduck harvesting. The quantity of pumps utilized in each operation will be equal to the number of personnel harvesting and seeding geoducks.
Commercially available PVC tubes are used to protect geo-duck seeds during planting and grow-out. Tubes are usually sold in ten foot lengths, and based on farmers’ recommenda-tions should be cut into thirteen individual grow-out tubes. To exclude predators, small sections of plastic mesh or net is placed over the tube opening.
All geoduck equipment costs are variable (Table A5). Final costs for tubes, net tops, and number of workers for water jets depend on the number of seeds to be planted each year.
Item Cost
4”x10’ PVC Tubes $1.85/tube
Mesh Net Tops $0.10/net top
Gasoline powered water pump and jet $650/person
Flexible 2”diameter discharge hose $60/person
4. Processing, Packaging, and Office EquipmentIn addition to species-specific expenses, there are also shared expenses for equipment and materials required to process, ship, and sell both species. These include expenses for: the shellfish processing facility and equipment, a vessel, packag-ing materials, and office equipment.
The shellfish processing facility houses commercial walk-in coolers and processing tables. The quantity of commercial walk-in coolers is calculated based on amount harvested annually, and the assumption of holding time of no more than 48 hours. The quantity of coolers required was also informed by the size of the wet-lock boxes and the capacity of the coolers themselves.
All shared processing equipment costs are fixed expen-ditures. The shell stock facility is assumed to be used for processing and packaging operations, not as living quarters. The vessel is intended for all-purpose use around the farm site, and potentially includes transportation related to ship-ping or personnel travel.
Table A4. Oyster production equipment and cost.
Table A5. Geoduck production equipment and cost.
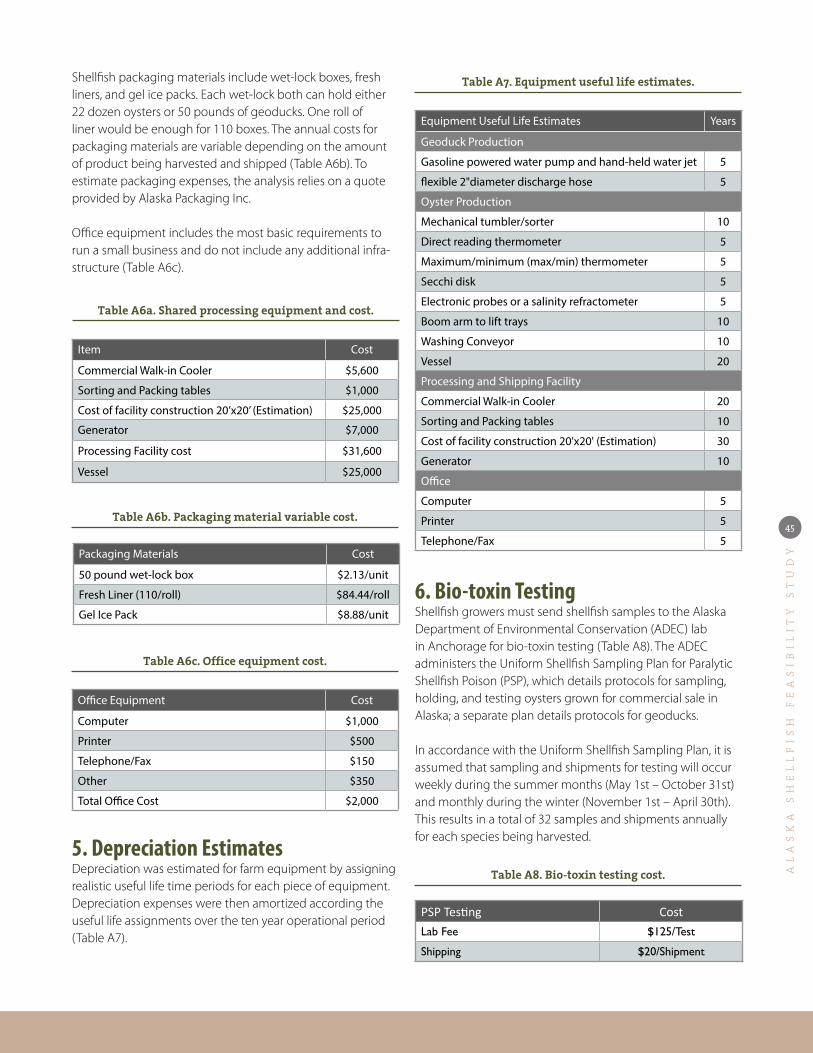
AL
AS
KA
SH
EL
LF
IS
H F
EA
SI
BI
LI
TY
ST
UD
Y
45
Item Cost
Commercial Walk-in Cooler $5,600
Sorting and Packing tables $1,000
Cost of facility construction 20’x20’ (Estimation) $25,000
Generator $7,000
Processing Facility cost $31,600
Vessel $25,000
Shellfish packaging materials include wet-lock boxes, fresh liners, and gel ice packs. Each wet-lock both can hold either 22 dozen oysters or 50 pounds of geoducks. One roll of liner would be enough for 110 boxes. The annual costs for packaging materials are variable depending on the amount of product being harvested and shipped (Table A6b). To estimate packaging expenses, the analysis relies on a quote provided by Alaska Packaging Inc.
Office equipment includes the most basic requirements to run a small business and do not include any additional infra-structure (Table A6c).
Packaging Materials Cost
50 pound wet-lock box $2.13/unit
Fresh Liner (110/roll) $84.44/roll
Gel Ice Pack $8.88/unit
Office Equipment Cost
Computer $1,000
Printer $500
Telephone/Fax $150
Other $350
Total Office Cost $2,000
5. Depreciation EstimatesDepreciation was estimated for farm equipment by assigning realistic useful life time periods for each piece of equipment. Depreciation expenses were then amortized according the useful life assignments over the ten year operational period (Table A7).
Equipment Useful Life Estimates Years
Geoduck Production
Gasoline powered water pump and hand-held water jet 5
flexible 2"diameter discharge hose 5
Oyster Production
Mechanical tumbler/sorter 10
Direct reading thermometer 5
Maximum/minimum (max/min) thermometer 5
Secchi disk 5
Electronic probes or a salinity refractometer 5
Boom arm to lift trays 10
Washing Conveyor 10
Vessel 20
Processing and Shipping Facility
Commercial Walk-in Cooler 20
Sorting and Packing tables 10
Cost of facility construction 20'x20' (Estimation) 30
Generator 10
Office
Computer 5
Printer 5
Telephone/Fax 5
6. Bio-toxin TestingShellfish growers must send shellfish samples to the Alaska Department of Environmental Conservation (ADEC) lab in Anchorage for bio-toxin testing (Table A8). The ADEC administers the Uniform Shellfish Sampling Plan for Paralytic Shellfish Poison (PSP), which details protocols for sampling, holding, and testing oysters grown for commercial sale in Alaska; a separate plan details protocols for geoducks.
In accordance with the Uniform Shellfish Sampling Plan, it is assumed that sampling and shipments for testing will occur weekly during the summer months (May 1st – October 31st) and monthly during the winter (November 1st – April 30th). This results in a total of 32 samples and shipments annually for each species being harvested.
PSP Testing CostLab Fee $125/Test
Shipping $20/Shipment
Table A6a. Shared processing equipment and cost.
Table A6b. Packaging material variable cost.
Table A7. Equipment useful life estimates.
Table A8. Bio-toxin testing cost.
Table A6c. Office equipment cost.

AL
AS
KA
SH
EL
LF
IS
H F
EA
SI
BI
LI
TY
ST
UD
Y
46
7. ShippingThe shipping costs assumed in this model account for the distance of the farm to the nearest community with air and water transportation linkages. The remoteness of a farm is often cited as a fundamental challenge to profitability because of the costs and limited availability of shipping and transportation services.
For all the listed equipment, both species-specific and shared, it is assumed that the delivery to the site will fall in a range up to 30% of the equipment costs. Delivery for trays and rafts are estimated to be 20% of cost, for tubes and net tops the estimate is 10%.
This analysis stops at the “farm gate” when product is sold to the wholesale distributor, it does not include any of the time or cost dedicated to establishing and retaining a market for the shellfish farm product. Cost of delivery of shellfish product to nearest town where the product is to be sold to a processor or wholesaler is included in the price of the product. It is assumed that the wholesaler is responsible all marketing costs, as well as expenditures related to additional refrigeration, shipping, and packaging.
8. Market PriceTo calculate farm gate revenue the analysis used the average market price of $0.75 per oyster and $15 for each geoduck. This analysis did not consider size grading of oysters, such that small, medium, and large oysters would be sold for dif-ferent prices. Price sensitivity analysis was conducted for each scenario to quantify the effect of variable shellfish market price on farm profitability.
These market prices are based on feedback from Alaska shellfish farmers. It is worth noting that the current market price for geoduck is quite volatile due to a ban instituted by the government of China, which is a key geoduck customer. While China lifted the ban in May 2014, its full effects on price are largely unknown at the current time, making accurate forecasts difficult.
9. UtilitiesUtility costs account for services such as water and trash disposal, as well as gasoline, and are based on information from Prince of Wales Island (Table A9). These cost estimates may vary significantly across the State, but were found to be similar to utility costs in Southcentral Alaska where many farms are located.
Water and trash costs are monthly, while per gallon gasoline costs depend on vessel, pumps, and generator usage.
Item Cost
Water $27/Month
Trash Disposal $20/Month
Gasoline $4.20/Gallon
9. LaborLabor expenses include salary and benefits for employees assuming a 40 hour work week and year around operation. The number of employees needed for farm operation and the associated labor costs are variable and depend on the amount of hours required for each component of the farm operation. The farm model assumes that a manager is paid $20 per hour, and regular employees are paid $16 per hour.
10. Biological AssumptionsSeed-Survival for OystersThe financial model assumes that the mortality rate of oyster seeds is 25% during the first year, and 10% during the second year. In the third year 20% of the surviving oysters are harvested, these are the fastest growing animals that have already reached market size. In year four, 60% of the remain-ing seed is harvested, and in year five 95% of the remaining oysters are harvested with the slowest growing 5% are discarded. This mortality and harvest schedule was provided by Alaska shellfish farmers as a conservative estimate of state-wide production.
Seed-Survival for GeoduckGeoduck seed survival is less complex than oysters because geoducks are all harvested after seven years of grow-out. During that seven year period it is assumed that one-third of the originally planted seeds will survive to reach an average market size of 1.5 pounds. Geoduck mariculture is still very new in Alaska and the exact growth parameters and survival are poorly understood.
Table A9. Utilities costs.
AL
AS
KA
SH
EL
LF
IS
H F
EA
SI
BI
LI
TY
ST
UD
Y
47
Appendix B. Categories of Expenses
Occupancy ExpenseUtilities and Trash Disposal
Land Lease
Farm Equipment Direct Costs
Processing Facility
Maintenance
Administrative ExpenseOffice Equipment and Supplies
Bookkeeping
Payroll
Total Administrative Expense
Personnel ExpenseManagement
Oyster Production and Processing labor
Geoduck Production and Processing labor
Benefits and Payroll Taxes
Total Personnel Expense
Operating Expense
Seed Purchases
Production Supplies
Production Supplies Delivery
Crop Insurance
Gasoline for pump and Vessel
Packaging
Shipping/Freight
Marketing Costs
Professional Fees/Permit Costs
Product Testing
Other
Contact Info:Britteny Cioni-Haywood
Division DirectorDepartment of Commerce, Community
and Economic Development
Division of Economic DevelopmentPO Box 34159
Juneau, Alaska 99803907-465-2510
http://commerce.state.ak.us/dnn/ded/Home.aspx
May 2015