feasibility of tidal and ocean current energy in false ...“feasibility of tidal and ocean current...
TRANSCRIPT

Feasibility of Tidal and Ocean Current Energy
in False Pass, Aleutian Islands, Alaska
FINAL REPORT
Aleutian Pribilof Islands Association, Inc.
U.S. Department of Energy,
Renewable Energy Development and Deployment in Indian Country: DE-EE0005624.000
Bruce Wright, Principal Investigator

2
CONTENTS
Executive Summary ........................................................................................................................ 3
Project Description.......................................................................................................................... 4
Project Objectives ........................................................................................................................... 6
Project Activities ............................................................................................................................. 6
Task 1: Perform circulation modeling of False Pass ................................................................... 6
Task 2: Initial site visit to perform reconnaissance bathymetry for ADCP deployment and
deploy an ADCP for a full lunar cycle ........................................................................................ 8
Task 3: Electrical infrastructure and load analysis.................................................................... 10
Task 4: Conceptual project design ............................................................................................ 11
Task 5: Initiate permitting consultation and environmental assessment ................................... 12
Task 7: Complete final report on this feasibility study and Project closeout ............................ 15
Conclusion .................................................................................................................................... 15
Appendices .................................................................................................................................... 16

3
Feasibility of Tidal and Ocean Current Energy
in False Pass, Aleutian Islands, Alaska
Executive Summary
The Aleutian Pribilof Islands Association was awarded a U.S. Department of Energy
Tribal Energy Program grant (DE-EE0005624) for the Feasibility of Tidal and Ocean Current
Energy in False Pass, Aleutian Islands, Alaska (Project). The goal of the Project was to perform
a feasibility study to determine if a tidal energy project would be a viable means to generate
electricity and heat to meet long-term fossil fuel use reduction goals, specifically to produce at
least 30% of the electrical and heating needs of the tribally-owned buildings in False Pass. The
Project Team included the Aleut Region organizations comprised of the Aleutian Pribilof Island
Association (APIA), and Aleutian Pribilof Island Community Development Association
(APICDA); the University of Alaska Anchorage, ORPC Alaska a wholly-owned subsidiary of
Ocean Renewable Power Company (ORPC), City of False Pass, Benthic GeoScience, and the
National Renewable Energy Laboratory (NREL).
The following Project objectives were completed: collected existing bathymetric, tidal,
and ocean current data to develop a basic model of current circulation at False Pass, measured
current velocities at two sites for a full lunar cycle to establish the viability of the current
resource, collected data on transmission infrastructure, electrical loads, and electrical generation
at False Pass, performed economic analysis based on current costs of energy and amount of
energy anticipated from and costs associated with the tidal energy project conceptual design and
scoped environmental issues.
Utilizing circulation modeling, the Project Team identified two target sites with strong
potential for robust tidal energy resources in Isanotski Strait and another nearer the City of False
Pass. In addition, the Project Team completed a survey of the electrical infrastructure, which
identified likely sites of interconnection and clarified required transmission distances from the
tidal energy resources. Based on resource and electrical data, the Project Team developed a
conceptual tidal energy project design utilizing ORPC’s TidGen® Power System. While the
Project Team has not committed to ORPC technology for future development of a False Pass
project, this conceptual design was critical to informing the Project’s economic analysis.
The results showed that power from a tidal energy project could be provided to the City
of False at a rate at or below the cost of diesel generated electricity and sold to commercial
customers at rates competitive with current market rates, providing a stable, flat priced,
environmentally sound alternative to the diesel generation currently utilized for energy in the
community. The Project Team concluded that with additional grants and private investment a
tidal energy project at False Pass is well-positioned to be the first tidal energy project to be
developed in Alaska, and the first tidal energy project to be interconnected to an isolated micro
grid in the world. A viable project will be a model for similar projects in coastal Alaska.

4
Project Description
The purpose of the U.S. Department of Energy Tribal Energy Program project
“Feasibility of Tidal and Ocean Current Energy in False Pass, Aleutian Islands, Alaska” (Project)
was to perform a feasibility study at False Pass, Aleutian Islands, Alaska to determine if a tidal
energy project would be a viable means to generate electricity and heat to meet long-term fossil
fuel use reduction goals, specifically to produce at least 30% of the electrical and heating needs
of the tribally-owned buildings in False Pass.
The City of False Pass, Alaska, is located on the Isanotski Pass, between the Bering Sea
and the North Pacific Ocean, and is renowned for its extreme currents (Figure 1 and Figure 2).
Local residents have long known the power of the water that rushes daily through Isanotski Pass,
and a 2009 study funded by the Alaska Energy Authority (AEA) confirmed the need to formally
study the area’s potential for tidal power.
Figure 1. Aerial view of False Pass, Alaska and Isanotski Pass

5
Figure 2. Location of False Pass within the Aleutian Islands
To this end a Project Team was formed to determine if a tidal energy project could
provide much needed sustainable energy to the community of False Pass. The Project Team
included the Aleut Region organizations comprised of the Aleutian Pribilof Island Association
(APIA), and Aleutian Pribilof Island Community Development Association; the University of
Alaska Anchorage, ORPC Alaska a wholly-owned subsidiary of Ocean Renewable Power
Company (ORPC), City of False Pass, Benthic GeoScience, and the National Renewable Energy
Laboratory (NREL).
The Project Team was led by APIA, a federally recognized tribal organization of the Aleut
people in Alaska, under the direction of Senior Scientist Bruce Wright, who served as the Project
Principal Investigator. APIA’s mission is to promote the overall economic, social, and cultural
development of its beneficiaries and to provide for the Aleut Tribes from communities in the
region (Atka, Akutan, False Pass, King Cove, Nelson Lagoon, Nikolski, Sand Point, Saint
George, Saint Paul and Unalaska1) designated by the Alaska Native Claims Settlement Act as the
Aleut Region, which is also known as the Aleutian/Pribilof Islands region.
While no data had been collected on the ocean or tidal current resource at False Pass
before this project, anecdotal evidence from vessel captains who transited the area suggested
1 The total population served by APIA is 7,702 (2,135 American Indians and Alaska Natives, 5,706 other races). The
population of the entire region, including ADAK, Cold Bay and military bases, is 8,162).

6
False Pass had some of the strongest currents in the Aleutian Islands, from 6 to 9 knots. In recent
years, tidal energy technology has been commercializing globally, including that of ORPC, who
installed the first grid connected tidal energy project in the U.S. in 2012 in Cobscook Bay,
Maine. This Project, therefore, was designed to measure the resource at False Pass and determine
if tidal energy could play a role in the future energy portfolio of the community.
The goals of the Project were: (1) determine the viability of the current resource in the
vicinity of False Pass for energy production, (2) provide an economic analysis of a tidal energy
project at False Pass, and (3) provide environmental and permitting analyses, identifying and
documenting critical issues. These goals were in compliance with the centuries-old tradition of
community self-sustainability and stewardship of the land, attempting to utilize a renewable
resource to subsist. They also reflect the efforts of many of the Aleut Region organizations,
included in the Project Team which have been working together to reduce their dependence on
fossil fuels and have established a long-term regional goal of reducing fossil fuels use by 80%.
The Project’s original hypothesis was that if a tidal energy project proved viable through
the work of the feasibility study, the Project Team would pursue follow-on action— a complete
feasibility study that would lead to the eventual design, installation, and operation of tidal energy
generation equipment at False Pass.
Project Objectives
The following objectives were established to accomplish the Project goals:
1. Collect existing bathymetric, tidal, and ocean current data at the site to develop a basic
model of current circulation at False Pass.
2. Measure current velocities at a site of interest for a full lunar cycle to establish the
viability of the current resource.
3. Collect data on transmission infrastructure, electrical loads, and electrical generation at
False Pass.
4. Perform economic analysis based on current costs of energy and amount of energy
anticipated from and costs associated with the tidal energy project conceptual design.
5. Consult with agencies and perform literature review to scope permitting process and
identify key environmental issues.
Project Activities
The following project activities were undertaken in this project in order to establish the
viability of tidal energy for the community of False Pass.
Task 1: Perform circulation modeling of False Pass
The Project utilized numerical circulation modeling techniques to inform optimal site
locations for further resource assessment and field verification of model predictions. The

7
University of Alaska Anchorage (UAA) developed a numerical circulation model (Delft3D) to
determine the spatial and temporal distribution of velocity within False Pass based on existing
bathymetric, tidal and ocean current data and numerical modeling. The model had a resolution of
50 m, with its domain extending north to the Bering Sea and south to the Pacific Ocean. This
model was “forced” at its boundaries by water level data collected with “HOBO” water level
sensors deployed at the northern and southern boundaries. Bathymetry data was obtained from
NOAA. The Delft3D model generated hourly velocity and water level data throughout the False
Pass area for selected time periods. After performing initial modeling, UAA provided maps
showing average velocity and energy density on flood, ebb, and combined tidal cycles to allow
the project partners to determining the most likely sites that exhibited strong currents on both
flood and ebb tides (Figure 3).
This model functioned as a base to incorporate more detailed data as the Project
developed and included updated water level data collected at the boundaries of the domain
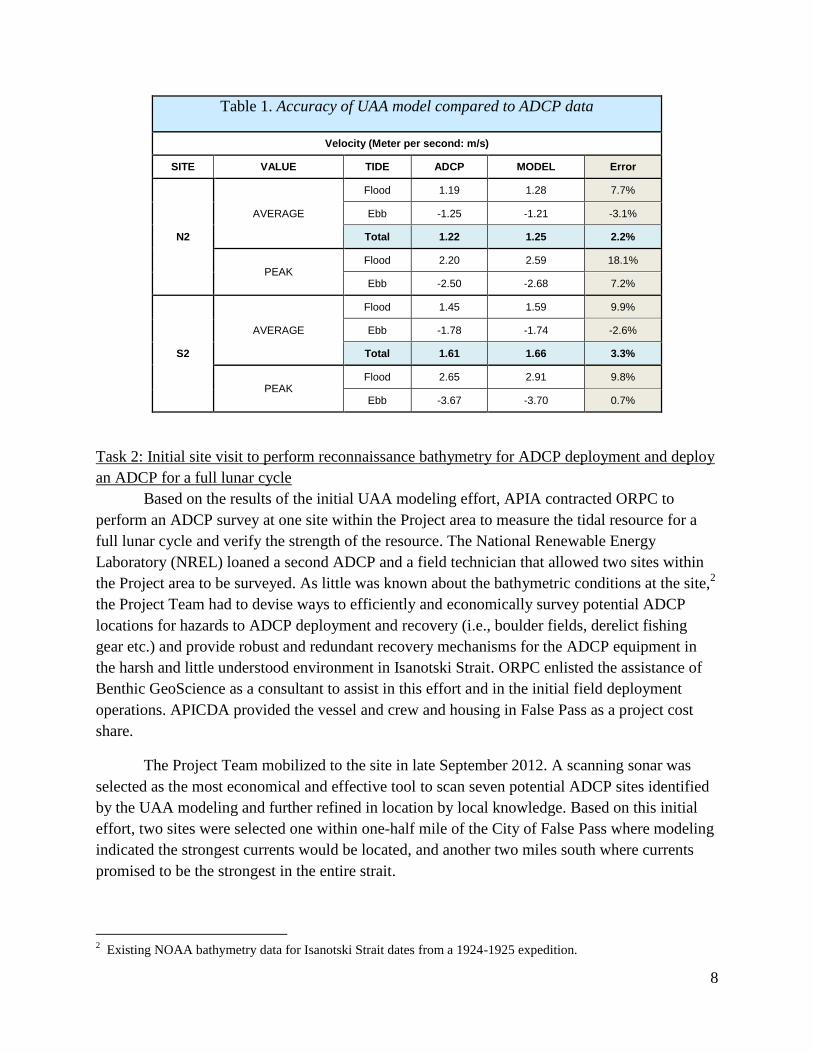
during the 2012 field expedition. After the water level data and current velocity data from the
Acoustic Doppler Current Profiler (ADCP) deployments were collected in fall 2012, the model
was verified to determine its accuracy (Table 1). The UAA model will continue to be developed
by incorporating up-to-date bathymetric data collected outside of the scope of this Project in
2013. For a detailed report on the results of the UAA modeling effort see Appendix A.
Figure 3. Contour plots showing predicted average current velocity from UAA model on flood,
ebb, and combined tides
8
Table 1. Accuracy of UAA model compared to ADCP data
Velocity (Meter per second: m/s)
SITE VALUE TIDE ADCP MODEL Error
N2
AVERAGE
Flood 1.19 1.28 7.7%
Ebb -1.25 -1.21 -3.1%
Total 1.22 1.25 2.2%
PEAK Flood 2.20 2.59 18.1%
Ebb -2.50 -2.68 7.2%
S2
AVERAGE
Flood 1.45 1.59 9.9%
Ebb -1.78 -1.74 -2.6%
Total 1.61 1.66 3.3%
PEAK Flood 2.65 2.91 9.8%
Ebb -3.67 -3.70 0.7%
Task 2: Initial site visit to perform reconnaissance bathymetry for ADCP deployment and deploy
an ADCP for a full lunar cycle
Based on the results of the initial UAA modeling effort, APIA contracted ORPC to
perform an ADCP survey at one site within the Project area to measure the tidal resource for a
full lunar cycle and verify the strength of the resource. The National Renewable Energy
Laboratory (NREL) loaned a second ADCP and a field technician that allowed two sites within
the Project area to be surveyed. As little was known about the bathymetric conditions at the site,2
the Project Team had to devise ways to efficiently and economically survey potential ADCP
locations for hazards to ADCP deployment and recovery (i.e., boulder fields, derelict fishing
gear etc.) and provide robust and redundant recovery mechanisms for the ADCP equipment in
the harsh and little understood environment in Isanotski Strait. ORPC enlisted the assistance of
Benthic GeoScience as a consultant to assist in this effort and in the initial field deployment
operations. APICDA provided the vessel and crew and housing in False Pass as a project cost
share.
The Project Team mobilized to the site in late September 2012. A scanning sonar was
selected as the most economical and effective tool to scan seven potential ADCP sites identified
by the UAA modeling and further refined in location by local knowledge. Based on this initial
effort, two sites were selected one within one-half mile of the City of False Pass where modeling
indicated the strongest currents would be located, and another two miles south where currents
promised to be the strongest in the entire strait.
2 Existing NOAA bathymetry data for Isanotski Strait dates from a 1924-1925 expedition.
9
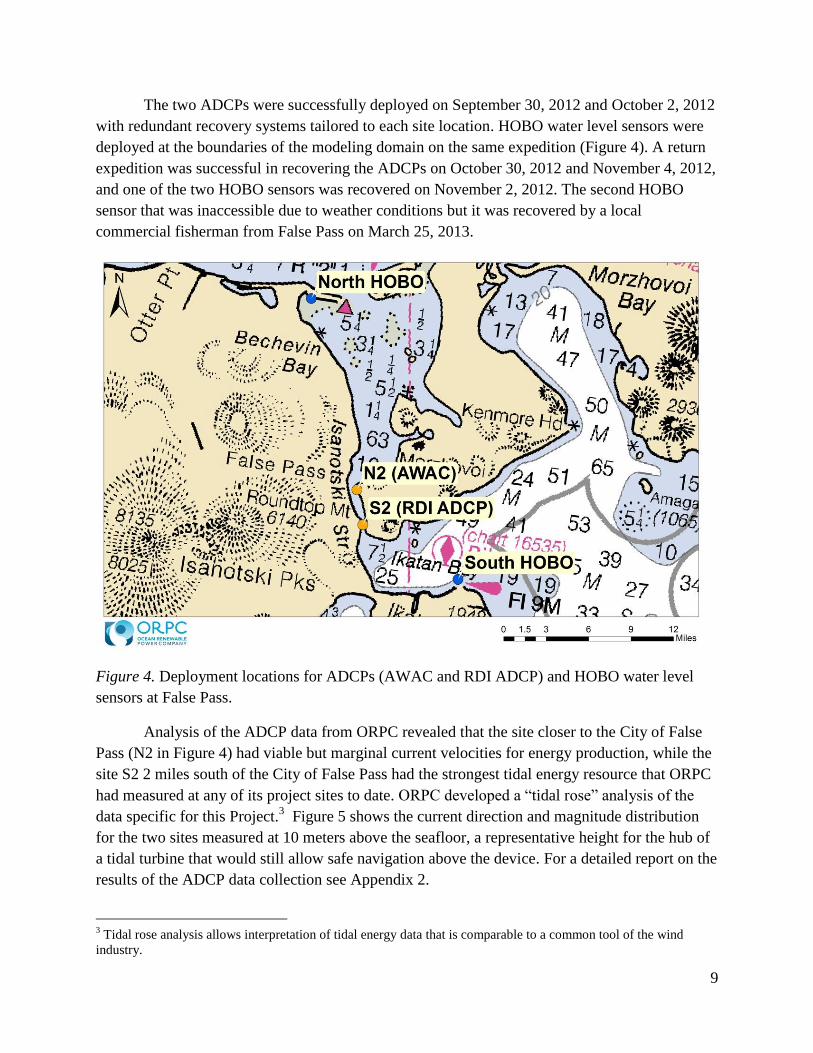
The two ADCPs were successfully deployed on September 30, 2012 and October 2, 2012
with redundant recovery systems tailored to each site location. HOBO water level sensors were
deployed at the boundaries of the modeling domain on the same expedition (Figure 4). A return
expedition was successful in recovering the ADCPs on October 30, 2012 and November 4, 2012,
and one of the two HOBO sensors was recovered on November 2, 2012. The second HOBO
sensor that was inaccessible due to weather conditions but it was recovered by a local
commercial fisherman from False Pass on March 25, 2013.
Figure 4. Deployment locations for ADCPs (AWAC and RDI ADCP) and HOBO water level
sensors at False Pass.
Analysis of the ADCP data from ORPC revealed that the site closer to the City of False
Pass (N2 in Figure 4) had viable but marginal current velocities for energy production, while the
site S2 2 miles south of the City of False Pass had the strongest tidal energy resource that ORPC
had measured at any of its project sites to date. ORPC developed a “tidal rose” analysis of the
data specific for this Project.3 Figure 5 shows the current direction and magnitude distribution
for the two sites measured at 10 meters above the seafloor, a representative height for the hub of
a tidal turbine that would still allow safe navigation above the device. For a detailed report on the
results of the ADCP data collection see Appendix 2.
3 Tidal rose analysis allows interpretation of tidal energy data that is comparable to a common tool of the wind
industry.

10
Figure 5. Tidal rose for two sites measured by ADCP for a full lunar cycle at False Pass. Note
that the scale is different with peak (red) at site S2 on right at 3.5-4 m/s while peak (red) at site
N2 on left at 2.5-3 meters per second (m/s).
Task 3: Electrical infrastructure and load analysis
Once the ADCP data had confirmed that there was a viable tidal resource in the vicinity
of False Pass, data was collected on the electrical infrastructure for the City of False Pass by
Marsh Creek, LLC. Marsh Creek conducted a field visit to inspect and document existing
electrical generation and transmission infrastructure for the City and the adjacent Bering Pacific
Seafood Processing plant (BPS) (See Appendix C for a report on the electrical infrastructure by
Marsh Creek).
The current configuration of the electrical generation in the City of False Pass included a
diesel electrical power plant owned and maintained by the City of False Pass that serves the
community power needs. The City’s grid is interconnected to BPS and the City sells power to
BPS for their processing facility and associated bunkhouse when electrical loads at the facilities
are within the capacity that the City can provide. When the plant is in full operation, however, its
loads are in excess of the City’s power generation of the City, and diesel generators owned and
operated by BPS are utilized to provide power to run the processing plant.
The Project Team, including APICDA who owns the BPS processing plant, also collected
data on the existing and projected electrical loads of both the City of False Pass and BPS to
better understand the scale of the load that could be served by a tidal energy project at False
Pass. The City of False Pass operates the community’s power utility and serves a mixture of
residential and commercial customers: 21 residential; 11 commercial, including the BPS seafood
processing plant; 1 federal/state facility; and 9 community facilities. The Community’s average
monthly electric demand is 48,256 kWh, and residents pay between 28 and 53 cents per kWh for
electricity. (The national average is 9.92 cents per kWh (U.S. Energy Information
Administration, May 2013). Currently, nearly all electricity and home and facility heat generated
at False Pass comes from imported diesel fuel. In 2012 the City of False Pass utilized 56,315

11
gallons of diesel fuel for electrical generation, while BPS utilized 37,966 gallons. Using the
current price of $3.53 and the average annual amount of fuel, electricity cost $198,791 in 2012
for the City of False Pass and $134,019 for BPS.
While the current electrical loads were used for the analysis in this Project, it is important to note
that the load for the City of False Pass has continued to grow over the last several years and is
projected to continue to grow as the local population increases and BPS continues to expand.
BPS has been undergoing significant expansion of its facilities and served market. Loads nearly
doubled there between 2011-2012 and 2012-2013, and are expected to triple in 2014. BPS
projects to increase their operations from five months to ten months a year when Pacific cod
processing begins in January 2015. In coming years the combined load of the City and the
processing plant could expand significantly, creating an even greater need for diversification into
clean, stably priced energy resources.
Task 4: Conceptual project design
Based on the resource and electrical data, the Project Team developed a conceptual tidal
energy project design utilizing ORPC’s TidGen® Power System. While the Project Team has not
committed to ORPC technology for future development of a False Pass project, this conceptual
design was critical to informing the Project’s economic analysis. For this analysis, a 200 kW
TidGen® Power System was utilized as an example of a tidal energy system. Based on this
technology choice, the Project economics were evaluated at site S2 where the tidal current
resource was most robust. As Table 2 shows, the monthly generation from a TidGen® Power
System would provide more power than the City of False Pass currently uses. However, due to
the cyclical timing of tidal currents and power, production would only offset 64% of the City’s
monthly load as there would be no power produced during slack tides and without a storage
system, diesel generation would be required at these times (Table 2). The estimated cost for this
200 kW tidal energy project was estimated at $5 million and included the following:
Project development
Installation of a 200 kW TidGen® Power System and its associated 2 mile submarine
cable
Shore based power electronics and monitoring equipment
As a tidal project would at times produce power in excess of the City of False Pass’s
load, it is important to consider ways to maximize integration and utilization of the energy
produced by a tidal energy project. The unique nature of the False Pass grid includes the ability
of BPS to absorb excess energy generated by the City of False Pass when peak tidal currents
would produce more power than the community can utilize. This would allow the City of False
Pass to realize economic benefit from energy that would otherwise go unutilized. To facilitate
this, BPS plant operations could be optimized to make best use of peak tidal power by timing ice
making when tidally produced energy peaks. Ice making is an intermittent activity that can be
scheduled as needed and would serve as a primary ‘storage capacity’ for tidal energy. As the

12
project evolves other more direct storage options may be considered that allow the tidally
produced energy to be utilized during times of slack tide as well.
Table 2. ORPC 200 kW TidGen® Power System
Monthly generation of in-stream device 60,833 kWh
City False Pass utility average monthly electric demand 48,256 kWh
Monthly generation utilizable by City of False Pass 30,833 kWh
Percentage of False Pass Utility electric demand produced by TidGen®
device
126%
Percentage of False Pass Utility demand actually offset by TidGen® device 64%
Task 5: Initiate permitting consultation and environmental assessment
The Project partners held community and stakeholder engagement as essential to the
development of a tidal energy project at False Pass and made efforts to ensure that all
stakeholders (tribal and community members, local commercial and sport fishermen, local
industries, and any other relevant interest groups) were aware of the Project, even at the
feasibility stage. To this end, ORPC held two meetings in the community of False Pass during
field expeditions there, one providing an educational experience for the children in the school,
and the other to update the community at large on the Project. The community meeting was well
attended and people showed strong interest and general support for the Project. ORPC, Benthic,
and APIA also gave presentations at several public events, including the annual APICDA
community meeting in 2013 and the annual SouthWest Alaska Municipal Conference (SWAMC)
meeting in 2014. Both of these meetings were well attended by community and tribal members
from Alaska Peninsula and Aleutian Island communities including False Pass. ORPC and APIA
presented the final report at the Tribal Energy Conference in Denver in April 2014 - see at
http://apps1.eere.energy.gov/tribalenergy/pdfs/2013_program_review/38_apia_bruce_wright.pdf.
Permitting for the Project began in fall 2012 when ORPC applied for and received submerged
land use permit (LAS 28655) from the Alaska Department of Natural Resources (ADNR) to
allow deployment of scientific equipment related to the project. This was the only required
permit for the work completed under the Feasibility Study. As this Project develops, additional
permits will be necessary as will commencement of the Federal Energy Regulatory Commission
(FERC) licensing process. Table 3 outlines the permits necessary for early project development
efforts. The Project Team will identify federal and state licensing and permitting requirements
for a future tidal turbine installation at the site, and the permitting required will be dependent
upon the turbine design selected.

13
Table 3. Permits and Licensing for early stages of project development
APPLICABLE PERMITS ANTICIPATED PERMITTING
TIMELINE
ADNR Submerged Land Use Permit Apply January 2014. ORPC: Secured
September 2012 & ongoing
FERC Preliminary Permit After the project site has been established a
FERC preliminary permit will be applied for
initiating agency consultation and project
permitting
Tidal energy projects are under the jurisdiction of FERC. To facilitate getting devices in the
water, FERC has implemented an expedited hydrokinetic permitting system through its pilot
project license program as an alternative to the traditional hydropower licensing process. This
pilot project process is intended to give projects that are small scale an expedited licensing
process, provided they are intensively monitored for environmental effects and able to be shut
down on short notice if unacceptable environmental impacts that cannot be mitigated are
encountered. The Project Team will determine whether to license the Project through the pilot or
the traditional hydropower process. The Project Team will also continue relationships with
appropriate agency personnel as the permitting pathway for the larger tidal energy project is
defined. These agencies include National Marine Fisheries Service (NMFS), U.S. Fish and
Wildlife Services (USFWS) and the Alaska Department of Fish and Game (ADF&G). Work will
include scoping of proper studies, identifying areas of environmental concern and completing a
comprehensive literature review of existing environmental data. Additional assessments are
anticipated in conjunction with the Marine Mammal Protection Act, Magnuson Stevens Act
(Essential Fish Habitat) and USFWS National Wildlife Refuge Management Plan.
Task 6: Economic assessment
To adequately assess the economic viability of the Project, the Project Team developed a
preliminary budget for the installation and operation of a tidal energy project, and compared that
to a “no-action” scenario where the energy for False Pass continues to be provided by diesel
power. A preliminary budget estimate for the Project (from permitting and design through
construction and operation) was developed with the input of the partners and budget estimates
for their portions of the Project. Based on these budget estimates and operating and maintenance
costs (O&M) derived from ORPC operations in Maine (adjusted for the cost of operation in the
remote False Pass setting), a projected cost of power was developed.

14
The Project economics were evaluated based on the assumption that an installation,
including project development and environmental costs, would total $5 million and that ongoing
inspection maintenance and repair would amount to $125 per MWh per year and environmental
monitoring would cost $45,000 per year through the assumed 20 year life of the project. There is
in fact likelihood that these environmental monitoring costs will reduce over time as
environmental concerns become well understood, improving project economics, but a
conservative approach was applied here, including these costs throughout the project lifetime.
Several cases were investigated to assess how tidal energy would compare to the False
Pass energy market over the 20 year project lifetime. The average cost of power from a tidal
energy project was calculated over the project lifetime in order to understand how this compared
to the current no action case where electricity is generated by diesel. The cost of diesel fuel that
is offset alone was included in the avoided cost, while the all in cost of diesel generated
electricity that included fuel costs and non fuel expenses of $.07/kWh 4 was included to reflect
the all in cost of power as currently produced in False Pass. Each of these average costs was
derived by escalating costs for tidal and diesel by 2% annually. Table 3 summarizes the results of
this analysis assuming no grant funding for project construction, a $1 million grant, and a $2
million grant. Based on these assumptions it is clear that with no grant funding power from a
tidal project would be slightly higher than the current no-action scenario. With $1 million in
grant funding the cost of power from a tidal project would be significantly lower than the all in
cost for power from diesel generation and just slightly higher than the avoided cost of power.
With $2 million in grant funding to support project construction, the cost of power from a tidal
project would be significantly lower than both the all in cost for diesel generated power as well
as the avoided cost of diesel. This analysis shows that with $ 1 million grant funding a tidal
energy project at False Pass could produce power below all in costs of power from diesel
generation and with $2 million in funding it would also come in well below the avoided cost of
power from diesel generation. This would allow the City to not only stabilize electricity rates for
the community but also provide power to commercial customers at a rate that is attractive when
compared with diesel-generated power.
Table 3. Results of cost of power
Grant Funding Average Cost of
Power from Tidal
Project over 20
years
Average
avoided cost of
diesel fuel over
20 years
All in cost of power
including average
avoided cost + non
fuel expenses
$0 $0.433/kWh $0.340/kWh $0.425/kWh
$1,000,000 $0.345/kWh
$2,000,000 $0.258/kWh
4 Alaska Energy Authority Power Cost Equalization report 2013

15
Task 7: Complete final report on this feasibility study and Project closeout
The report herein is the final feasibility study report. This report recommends that the Project
continue preconstruction project development activities. Project closeout with final report and
financials were delivered concurrently to DOE.
Outreach and media: https://www.alaskadispatch.com/article/20140325/harnessing-alaskas-wave-tidal-river-energy-great-
potential-daunting-challenges
http://www.thedutchharborfisherman.com/article/1111false_pass_makes_real_progress_with_energy
http://www.alaskapublic.org/2012/09/25/false-pass-experimenting-with-hydro-power/
http://kucb.org/news/article/false-pass-becomes-a-laboratory-for-coastal-energy/
http://www.alaskadispatch.com/article/could-oceans-whopping-tides-help-power-alaska
http://www.uaf.edu/files/acep/2013_REC_False%20Pass%20Assessment_Monty%20Worthington.pdf
http://issuu.com/alaska_business_monthly/docs/abm_april_2013_4_web/38
http://2knowabout.blogspot.com/2013/05/false-pass-alaska-tidal-power-study.html
http://www.alaskapublic.org/2013/07/29/false-pass-inches-closer-to-ocean-energy/
Conclusions
Utilizing modeling techniques the Project Team identified two target sites with strong
potential for robust tidal energy resources in Isanotski Strait near the City of False Pass.
Measurement of these sites revealed that the one nearest one to the City of False Pass was a
modest resource, while a site just two miles from the City was extremely robust offering a strong
tidal energy resource with capacity factors for ORPC’s TidGen®
device reaching 44%.
Calibration of the model used to select these sites with field data confirmed the two sites
measured were within the most likely zones for high tidal current velocities and that the model
was reasonably accurate considering the limited bathymetric data on which it was based.
A survey of the electrical infrastructure identified likely sites of interconnection and clarified
required transmission distances from the tidal energy resources. This survey also highlighted the
unusual arrangement between the diesel generation capacity of the City of False Pass as well as
the generation facilities maintained by BPS. The BPS plant buys power whenever possible from
the City of False Pass; however the plant utilizes power from in-house generation when in full
operation because the City’s electrical generation capacity is unable to provide the full electrical
requirements to the BPS plant at these times. This arrangement may allow for innovative ways to
utilize power from a tidal energy project as peak generation from a tidal project that would
otherwise be in excess of the needs of the community of False Pass can be utilized by the BPS
plant for normal base load power as well as for peak load shaving by timing loads such as ice
making to coincide with these times. This would provide additional economic benefit to the
community through power sales and enhancement of the local business’ economics.
Economic analysis of a tidal energy project utilizing ORPC’s 200 kW TidGen® Power
System as an example technology showed that with grant funding totaling $2 million for a tidal
energy project would provide power at or below current costs of power. This power could be
provided to community members at a rate at or below the cost of diesel generated electricity and

16
sold to commercial customers at rates competitive with current market rates, providing a stable,
flat priced, environmentally sound alternative to the diesel generation currently utilized for
energy in the community.
The Project’s analysis established and validated by the Project Team, has garnered
interest from funding agencies, including the Alaska Energy Authority who has provided
$175,000 in programmatic funding. This funding supported a detailed bathymetric survey of the
Project area and will fund enhancement of UAA’s DELFT 3D circulation model created for this
Project utilizing the improved bathymetric data. Based on this circulation model, finer scale
analysis of the Project area will be possible and will aid in identification of sites for a finer scale
resource assessment, ultimately resulting in final candidate sites for project construction.
Permitting and licensing of this Project has not commenced beyond permits for the initial
resource assessment work. As state and federal permitting and FERC licensing of the Project
progresses, an in depth desk top study of existing literature and environmental data of the Project
area will be necessary, followed by consultation with regulatory agencies and drafting and
implementation of environmental study plans.
The Project Team believes that these next steps are warranted based on the results of this
Feasibility Study. A viable tidal energy resource has been identified and validated with field
measurements within a reasonable transmission distance of the City of False Pass. Initial
economic assessment shows that even with the high cost of early stage tidal energy technology a
False Pass Tidal Energy Project would be viable with public funding to match private
investment. With the high likelihood of private investment being available to the Project through
local commercial interests, this Project is well-positioned to be the first tidal energy project to be
developed in Alaska, and the first tidal energy project to be interconnected to an isolated micro
grid in the world.
Appendices
1. University of Alaska Modeling (attached)
2. ADCP Reconnaissance Report, ORPC Solutions (attached)
3. False Pass Kinetic Hydro Power, Marsh Creek (attached)

1
Appendix 1.
University of Alaska Hydrokinetic Resource Assessment in False Pass, Alaska
1 INTRODUCTION
A hydrokinetic resource assessment in False Pass, Alaska was made based on a 2-dimensional tidal circulation
model developed with Delft3D software. This report documents the data processing, model development and
validation, and model-generated results.
2 METHODS
To generate an accurate Delft3D tidal circulation model for False Pass, a domain was constructed with elevation
data, boundary conditions were defined, and multiple physical and numerical parameters were specified. This
section outlines the model development process, which utilized several components of Delft3D, ArcGIS, and
Excel.
2.1 Domain
A rectangular grid extending from -163.55 W to -163.15 W and from 54.72 N to 55.02 N (Figure 1) was
generated in Delft 3D. The grid resolution was refined to achieve 50 m x 50 m cells, totaling 670 x 500 cells.
Model bathymetry was built from multiple sources of elevation data. Depth soundings dating from 1924 to 1957
were retrieved from the NOAA National Geophysical Data Center, and the individual surveys are listed below in
Table 1.
Survey ID Year Locality
H08375 1957 Approaches to Bechevin Bay
H08373 1957 Bechevin Bay
H04500 1925 Traders Cove
H04394 1924 Isanotski Strait
H04391 1924 Isanotski Strait
H04499 1925 Ikatan Bay
H04498 1925 Morzhovoi Bay
H04301 1925 Cape Pankofk
Table 1. Bathymetry survey information.
To obtain near-shore bathymetry, a 30-m resolution digital elevation model was downloaded from the Alaska
Statewide Data Mapping Initiative database and processed in ArcGIS. Lastly, inland topography was captured by
generating a 1.6 km resolution XYZ grid using a tool provided by NGDC. All elevation data was compiled and
processed in Delft 3D, using triangular interpolation of point data to produce a continuous bathymetry file. Finally
several smoothing operations were used to eliminate irregularities in bathymetry, achieved by specifying a
smoothing factor (Fac) and generating new cell elevation values as a function of neighboring cells. This function
is shown below (Equation 1).
New = (1 – Fac)*Old + Fac*Neighbors (1)
An image of the domain bathymetry is provided in Figure 1 on the next page.
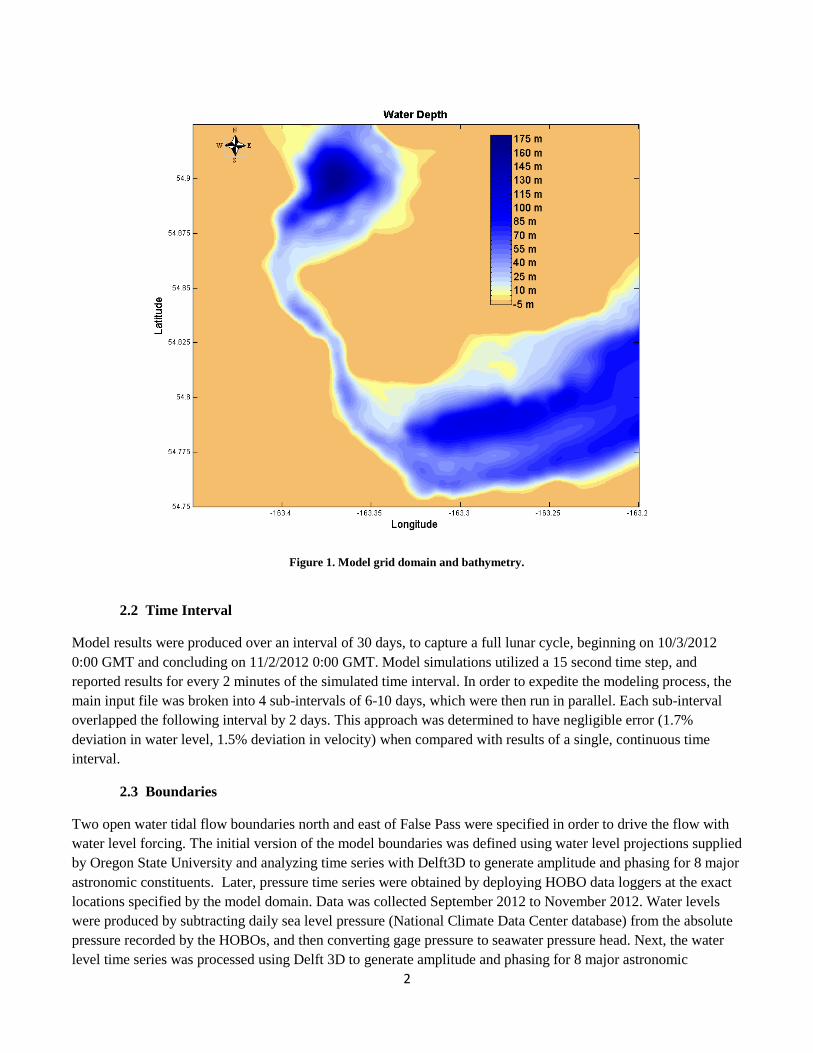
2
Figure 1. Model grid domain and bathymetry.
2.2 Time Interval
Model results were produced over an interval of 30 days, to capture a full lunar cycle, beginning on 10/3/2012
0:00 GMT and concluding on 11/2/2012 0:00 GMT. Model simulations utilized a 15 second time step, and
reported results for every 2 minutes of the simulated time interval. In order to expedite the modeling process, the
main input file was broken into 4 sub-intervals of 6-10 days, which were then run in parallel. Each sub-interval
overlapped the following interval by 2 days. This approach was determined to have negligible error (1.7%
deviation in water level, 1.5% deviation in velocity) when compared with results of a single, continuous time
interval.
2.3 Boundaries
Two open water tidal flow boundaries north and east of False Pass were specified in order to drive the flow with
water level forcing. The initial version of the model boundaries was defined using water level projections supplied
by Oregon State University and analyzing time series with Delft3D to generate amplitude and phasing for 8 major
astronomic constituents. Later, pressure time series were obtained by deploying HOBO data loggers at the exact
locations specified by the model domain. Data was collected September 2012 to November 2012. Water levels
were produced by subtracting daily sea level pressure (National Climate Data Center database) from the absolute
pressure recorded by the HOBOs, and then converting gage pressure to seawater pressure head. Next, the water
level time series was processed using Delft 3D to generate amplitude and phasing for 8 major astronomic
3
constituents. These boundary parameters were then imported into the model in preparation for the flow
simulation.
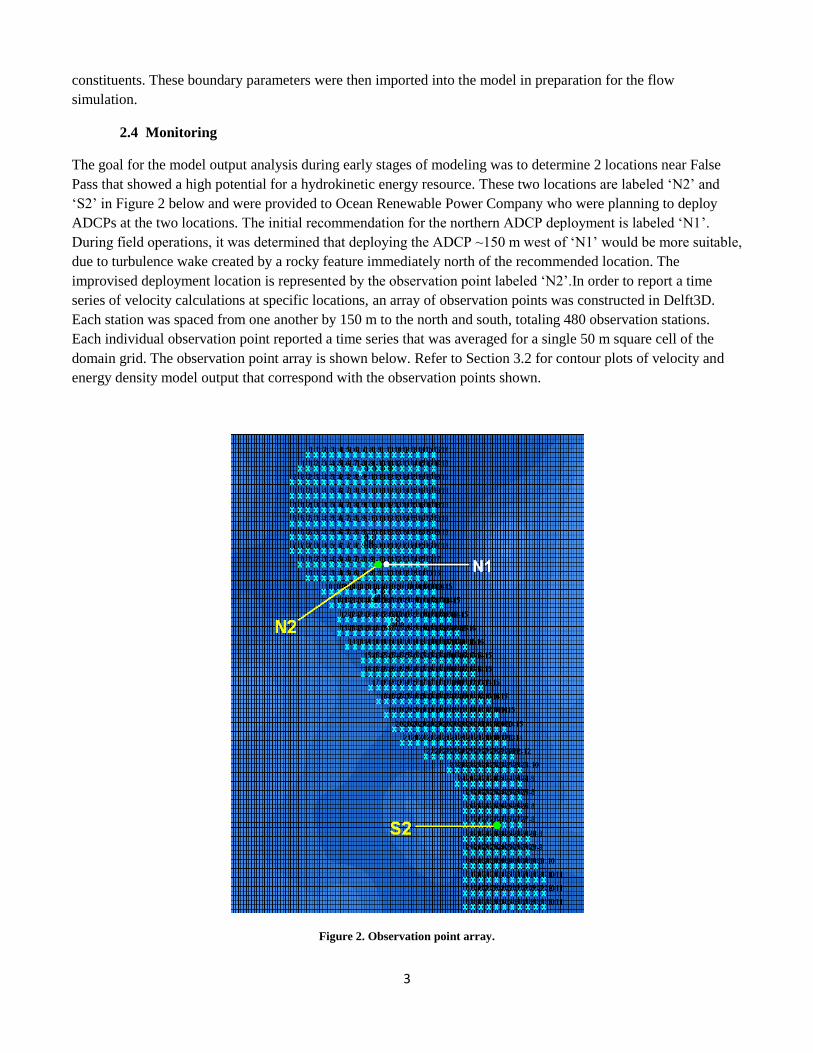
2.4 Monitoring
The goal for the model output analysis during early stages of modeling was to determine 2 locations near False
Pass that showed a high potential for a hydrokinetic energy resource. These two locations are labeled ‘N2’ and
‘S2’ in Figure 2 below and were provided to Ocean Renewable Power Company who were planning to deploy
ADCPs at the two locations. The initial recommendation for the northern ADCP deployment is labeled ‘N1’.
During field operations, it was determined that deploying the ADCP ~150 m west of ‘N1’ would be more suitable,
due to turbulence wake created by a rocky feature immediately north of the recommended location. The
improvised deployment location is represented by the observation point labeled ‘N2’.In order to report a time
series of velocity calculations at specific locations, an array of observation points was constructed in Delft3D.
Each station was spaced from one another by 150 m to the north and south, totaling 480 observation stations.
Each individual observation point reported a time series that was averaged for a single 50 m square cell of the
domain grid. The observation point array is shown below. Refer to Section 3.2 for contour plots of velocity and
energy density model output that correspond with the observation points shown.
Figure 2. Observation point array.

4
2.5 Numerical & Physical Factors
In the model definition process, several supplementary parameters are specified. These parameters are
summarized in the table below.
Parameter Value
Gravity 9.81 m/s2
Water Density 1025 kg/m3
Bottom Roughness Uniform; White-Colbrook = 0.05
Wall Roughness Free Slip Condition
Horizontal Eddy Viscosity Uniform; 1.5 m2/s
Depth at Grid Cell center Mean
Depth at Grid Cell faces Mean
Threshold Depth 0.1 m
Marginal Depth -999 m
Smoothing Time 240 min
Advection Scheme for momentum Cyclic
Table 2. Summary of numerical and physical parameters in Delft3D.
5
3 RESULTS
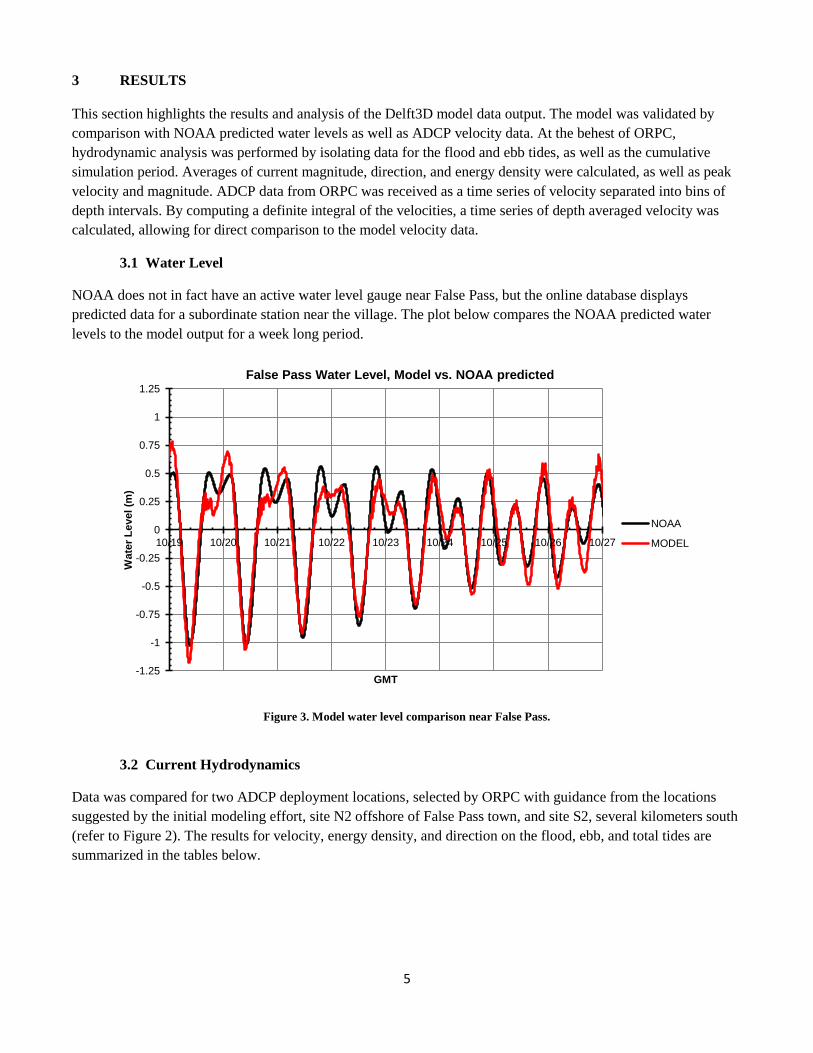
This section highlights the results and analysis of the Delft3D model data output. The model was validated by
comparison with NOAA predicted water levels as well as ADCP velocity data. At the behest of ORPC,
hydrodynamic analysis was performed by isolating data for the flood and ebb tides, as well as the cumulative
simulation period. Averages of current magnitude, direction, and energy density were calculated, as well as peak
velocity and magnitude. ADCP data from ORPC was received as a time series of velocity separated into bins of
depth intervals. By computing a definite integral of the velocities, a time series of depth averaged velocity was
calculated, allowing for direct comparison to the model velocity data.
3.1 Water Level
NOAA does not in fact have an active water level gauge near False Pass, but the online database displays
predicted data for a subordinate station near the village. The plot below compares the NOAA predicted water
levels to the model output for a week long period.
Figure 3. Model water level comparison near False Pass.
3.2 Current Hydrodynamics
Data was compared for two ADCP deployment locations, selected by ORPC with guidance from the locations
suggested by the initial modeling effort, site N2 offshore of False Pass town, and site S2, several kilometers south
(refer to Figure 2). The results for velocity, energy density, and direction on the flood, ebb, and total tides are
summarized in the tables below.
-1.25
-1
-0.75
-0.5
-0.25
0
0.25
0.5
0.75
1
1.25
10/19 10/20 10/21 10/22 10/23 10/24 10/25 10/26 10/27
Wate
r L
evel (m
)
GMT
False Pass Water Level, Model vs. NOAA predicted
NOAA
MODEL

6
Velocity (m/s)
SITE VALUE TIDE ADCP MODEL Error
N2
AVERAGE
Flood 1.19 1.28 7.7%
Ebb -1.25 -1.21 -3.1%
Total 1.22 1.25 2.2%
PEAK Flood 2.20 2.59 18.1%
Ebb -2.50 -2.68 7.2%
S2
AVERAGE
Flood 1.45 1.59 9.9%
Ebb -1.78 -1.74 -2.6%
Total 1.61 1.66 3.3%
PEAK Flood 2.65 2.91 9.8%
Ebb -3.67 -3.70 0.7%
Table 3. Velocity results for both sites; flood, ebb, and total tides.
Energy Density (kW/m2)
SITE VALUE TIDE ADCP MODEL Error
N2
AVERAGE
Flood 1.34 1.66 24.5%
Ebb 1.63 1.65 1.2%
Total 1.48 1.66 12.2%
PEAK Flood 5.41 8.90 64.6%
Ebb 8.01 9.86 23.2%
S2
AVERAGE
Flood 2.40 3.38 40.9%
Ebb 4.97 4.83 -2.8%
Total 3.65 4.12 12.7%
PEAK Flood 9.48 12.57 32.5%
Ebb 25.23 25.77 2.15%
Table 4. Energy density results for both sites; flood, ebb, and total tides.
Current Direction (degrees)
SITE TIDE Value ADCP MODEL Error
N2
Flood AVERAGE 328.9 339.1 3.1%
ST. DEV 11.5 17.4 51.6%
Ebb AVERAGE 153.7 172.9 12.5%
ST. DEV 7.8 20.3 159.7%
S2
Flood AVERAGE 344.0 350.1 1.8%
ST. DEV 12.9 6.8 -47.1%
Ebb AVERAGE 154.1 172.6 12.0%
ST. DEV 5.4 8.2 51.2%
Table 3. Current direction results for both sites; flood, ebb, and total tides.

7
To supplement the tabulated results above, the following graphs provide a visual comparison of the velocity time
series for the ADCP and Delft3D data. Note that this comparison is for the two individual locations where ADCPs
were deployed.
Figure 4. Comparison plot of velocity at site N2
Figure 5. Comparison plot of velocity at site S2
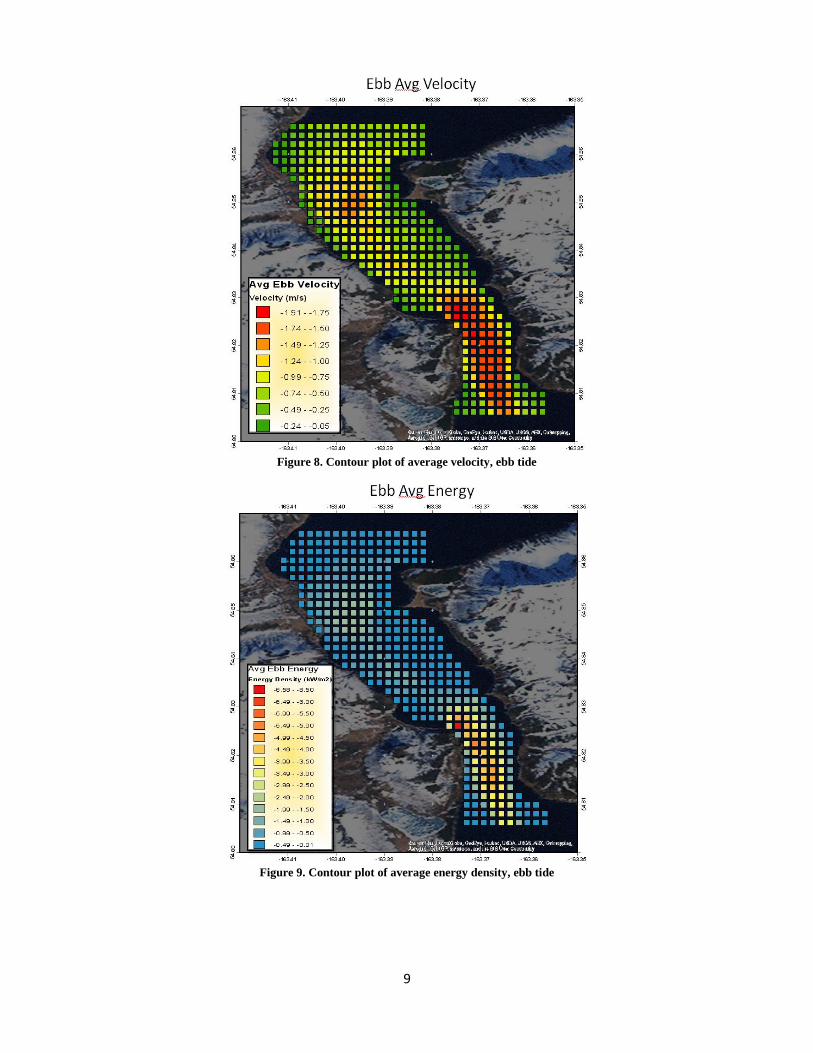
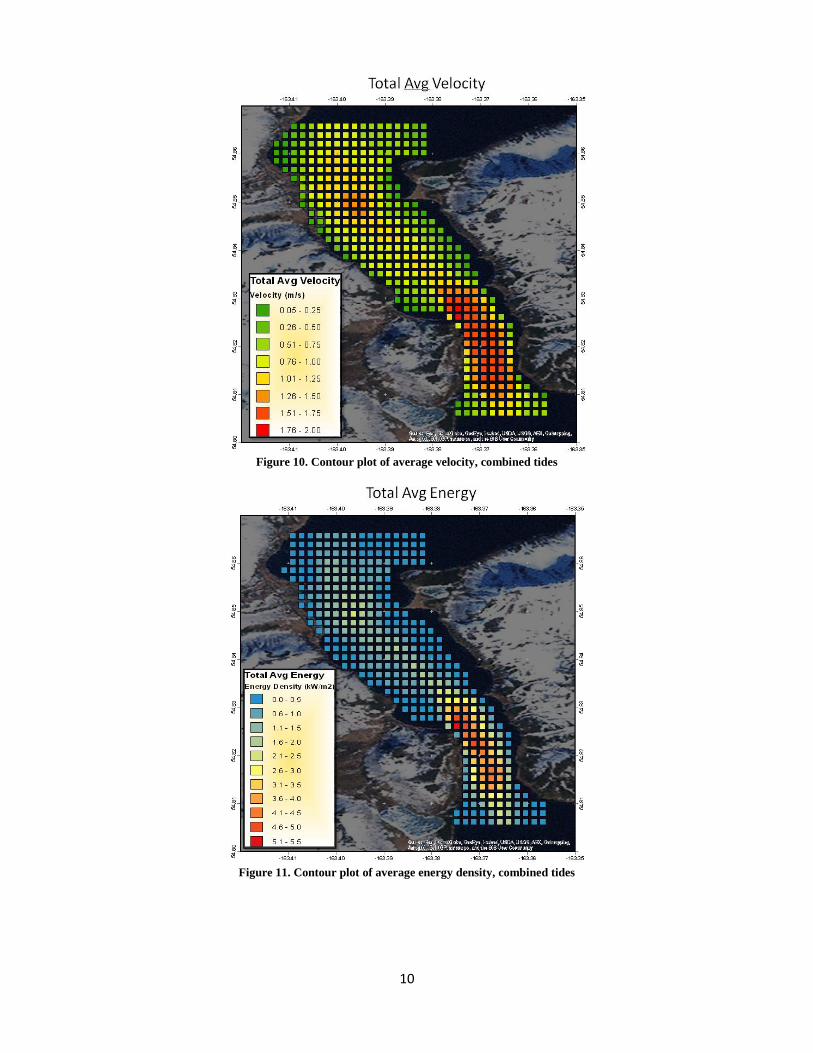
Contour plots of velocity and energy density for flood, ebb, and combined tides are provided below, which are
summarized by Tables 3 and 4. The plots were generated by analyzing the model output for each observation
point.

8
Figure 6. Contour plot of average velocity, flood tide
Figure 7. Contour plot of average energy density, flood tide
9
Figure 8. Contour plot of average velocity, ebb tide
Figure 9. Contour plot of average energy density, ebb tide
10
Figure 10. Contour plot of average velocity, combined tides
Figure 11. Contour plot of average energy density, combined tides

11
4 DISCUSSION
This section evaluates the performance of the model compared with the ADCP data and identifies trends and/or
confounding results.
4.1 Velocity
Based on 2.2% error at site N2 and 3.3% error at site S2 for the total simulation interval, it is apparent that the
model produces superb agreement with the ADCP data. A noteworthy observation, however, is that the model
shows greater precision on the ebb tide for average and peak velocities at both locations. Average and peak ebb
velocities have an enhanced error performance of 9-11% compared to flood velocities.
4.2 Energy Density
Since the energy density was calculated as a function of velocity, the model continues to show very good
agreement, with total error of 12.2% at site N2 and 12.7% at S2. The trend of enhanced model performance on the
ebb tide continues. Ebb tide results show an error improvement of 20-40% over the flood tide results for average
and peak energy density.
4.3 Direction
Comparison of the average current direction shows that for both sites, model error on the flood tide ranges from
2-3%, while average ebb current direction deviates by approximately 12%. This is a somewhat curious result,
considering that flood tide velocity magnitudes and energy densities performed significantly worse than the ebb
tide in the preceding analyses.

12
5 CONCLUSION
Overall, the Delft3D model for False Pass displays excellent agreement with reality. Considering that many
modeling factors such as wind/storms, salinity, and bottom roughness, were either set constant or disregarded,
having error in velocity time series under 5% is a terrific result. However, future work with Delft3D in False Pass
should consider refining some elements of the process:
Bathymetry improvements could have a far-reaching impact on the model. All of the depth surveys date
back more than 50 years, and sampling techniques have been greatly improved over that time. With
consideration to available funding, organizing a field bathymetry survey of False Pass to supplement
existing bathymetry data would have great value.
Model grid reconstruction could also have a significant impact on the calibration of bathymetry. The
preceding analyses were based on a model that implemented a grid resolution of 50m; refining the grid to
a cell size of 25m or smaller could provide a more accurate representation of the seafloor and nearshore
topography.
Since this study implemented a 2D flow simulation, exploring the 3D circulation feature available in the
Delft 3D modeling suite could provide a better characterization of tidal currents. Displaying flow
behavior as a series of vertical layers would have greater value than a simple depth averaged
representation. This would be especially prudent for work with companies like ORPC who need to
analyze flow characteristics at specific depths.
The use of the monitoring component in Delft3D would benefit post-processing products. Tiled contour
plots following this section were presented to ORPC, who requested greater resolution. To accomplish
this, future models should define an observation array with a greater density of stations. Alternatively,
post-processing methods exist in MATLAB that allow for producing continuous plots, using the map-file
output from Delft3D.

<
Appendix 2. FALSE PASS ADCP REPORT
12/4/12
Ocean Renewable Power Company, LLC 120 Exchange Street, Suite 508
Portland, ME 04101 Phone (207) 772-7707
www.orpc.co
Ocean Renewable Power Company False Pass ADCP survey draft report 12/4/12
Confidential Page 2 of 6
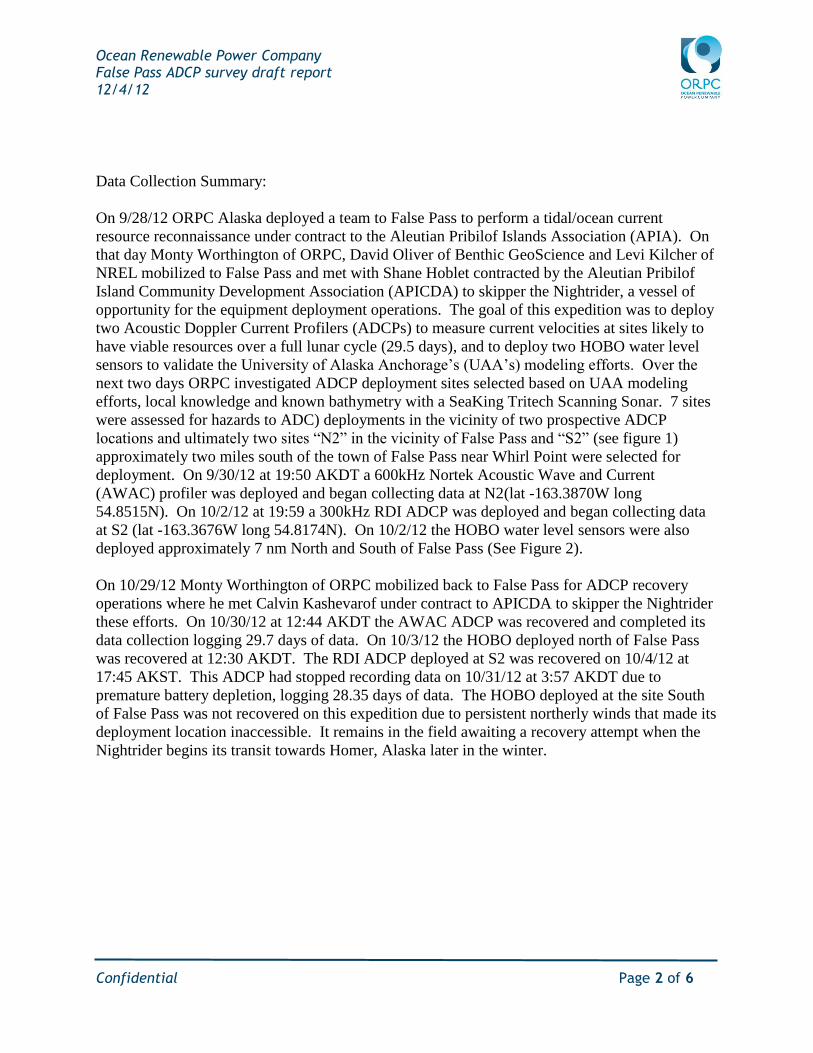
Data Collection Summary:
On 9/28/12 ORPC Alaska deployed a team to False Pass to perform a tidal/ocean current
resource reconnaissance under contract to the Aleutian Pribilof Islands Association (APIA). On
that day Monty Worthington of ORPC, David Oliver of Benthic GeoScience and Levi Kilcher of
NREL mobilized to False Pass and met with Shane Hoblet contracted by the Aleutian Pribilof
Island Community Development Association (APICDA) to skipper the Nightrider, a vessel of
opportunity for the equipment deployment operations. The goal of this expedition was to deploy
two Acoustic Doppler Current Profilers (ADCPs) to measure current velocities at sites likely to
have viable resources over a full lunar cycle (29.5 days), and to deploy two HOBO water level
sensors to validate the University of Alaska Anchorage’s (UAA’s) modeling efforts. Over the
next two days ORPC investigated ADCP deployment sites selected based on UAA modeling
efforts, local knowledge and known bathymetry with a SeaKing Tritech Scanning Sonar. 7 sites
were assessed for hazards to ADC) deployments in the vicinity of two prospective ADCP
locations and ultimately two sites “N2” in the vicinity of False Pass and “S2” (see figure 1)
approximately two miles south of the town of False Pass near Whirl Point were selected for
deployment. On 9/30/12 at 19:50 AKDT a 600kHz Nortek Acoustic Wave and Current
(AWAC) profiler was deployed and began collecting data at N2(lat -163.3870W long
54.8515N). On 10/2/12 at 19:59 a 300kHz RDI ADCP was deployed and began collecting data
at S2 (lat -163.3676W long 54.8174N). On 10/2/12 the HOBO water level sensors were also
deployed approximately 7 nm North and South of False Pass (See Figure 2).
On 10/29/12 Monty Worthington of ORPC mobilized back to False Pass for ADCP recovery
operations where he met Calvin Kashevarof under contract to APICDA to skipper the Nightrider
these efforts. On 10/30/12 at 12:44 AKDT the AWAC ADCP was recovered and completed its
data collection logging 29.7 days of data. On 10/3/12 the HOBO deployed north of False Pass
was recovered at 12:30 AKDT. The RDI ADCP deployed at S2 was recovered on 10/4/12 at
17:45 AKST. This ADCP had stopped recording data on 10/31/12 at 3:57 AKDT due to
premature battery depletion, logging 28.35 days of data. The HOBO deployed at the site South
of False Pass was not recovered on this expedition due to persistent northerly winds that made its
deployment location inaccessible. It remains in the field awaiting a recovery attempt when the
Nightrider begins its transit towards Homer, Alaska later in the winter.

Ocean Renewable Power Company False Pass ADCP survey draft report 12/4/12
Confidential Page 3 of 6
Figure 1 Location of AWAC and RDI ADCP deployments

Ocean Renewable Power Company False Pass ADCP survey draft report 12/4/12
Confidential Page 4 of 6
Figure 2 Location of ADCP and HOBO deployments in the vicinity of False Pass
Data Analysis
The data from the AWAC and RDI ADCP’s were downloaded from the devices and QC’d by
NREL and ORPC. Differences in the two devices necessitated programming each device to
sample and store data at different intervals while optimizing for the maximum rate of data
collection and storage to allow the data to be utilized to the maximum extent for analysis of the
strength of the resource, direction of the currents and to some extent analysis of turbulence (see
Table 1).

Ocean Renewable Power Company False Pass ADCP survey draft report 12/4/12
Confidential Page 5 of 6
Table 1 data logging parameters of AWAC and RDI ADCP
Device Data collection
duration
Sample rare Data storage
RDI 28.35 days ping every 1.8 sec Average of 5 pings
stored every 9 sec
AWAC 29.7 days ping every sec Average of every 60
pings stored once a
minute
In order to normalize the data for analysis NREL provided the data from each device with
current velocity and direction averaged every 6 minutes, this is the same interval ORPC uses for
each of its projects and allows comparison of the False Pass resource to those at other sites.
Initial data analysis was performed at both sites at approximately 10.5 meters above the bottom,
the height of the ORPC TidGen™ device and a likely hub height for medium sized tidal turbines.
In order to normalize the data sets for direct comparison of the data only the time period of
concurrent deployment was analyzed. Using the 27.5 days of direct overlap in deployment of the
two devices at 10.5 meters above the seafloor the N2 site had a maximum velocity of 2.51 m/s
and average velocity of 1.25 m/s and an average energy density of 1.70 kW/m^2. By
comparison the S2 site had a maximum current of 3.72 m/s an average velocity of 1.61 m/s and
an average energy density of 3.89 kW/m^2.
Comparing this to the data for a full lunar cycle at site N2 the average energy density was 1.69
kW/m^2. The correlation of this with the 1.70 kW/m^2 using the 27.5 day lunar cycle verified
the rigor of shortening the data set duration to 27.5 days for comparison and ultimate annual
energy generation between the two sites.
For a tidal energy device such as ORPC’s TidGen™ turbine, deployed with a hub height 10.5
meters above the bottom, the annual energy production at site N3 would be 284,490 KWh for a
capacity factor of 21.6%. By comparison the same device deployed 10.5 meters above the
bottom at S2 would have an annual generation of 577,655 kWh and a 43.9% capacity factor. For
later versions of ORPC technology with increased efficeincy this would increase to 318,972 kWh
and 24% capacity factor at N2 and 624,941 kWh and 47.5 % capacity factor at S2.
At site N2 energy density peaks at 26.5 meters above the seafloor (4 meters below the surface)
with an average energy density of 3.16 kW/m^2, an average velocity of 1.47 m/s and a peak
velocity of 3.51 m/s occurring at 24.5 meters above the seafloor. At site S2 the highest energy
density occurred 33.5 meters above the seafloor (near the surface) with 5.79 kW/m^2. The peak
velocity occurred 32.5 meters above the seafloor at 4.5 m/s while the highest average current
velocity was 32.5 meters above the seafloor at 1.90 m/s. (See Table 2)

Ocean Renewable Power Company False Pass ADCP survey draft report 12/4/12
Confidential Page 6 of 6
Table 2 Energy density and current velocity comparison at N2 and S2
Figure 3 Screenshot of RDI ADCP data showing velocity magnitude in mm/s
Site Height above
seafloor
Energy density
kW/m^2
Average velocity
m/s
Peak velocity
m/s
N2 10.5 1.70 1.24 2.51
S2 10.7 3.89 1.61 3.72
N2 26.5 3.16 1.47 3.51 @ 245
meters above
seafloor
S2 33.5 5.79 1.90 4.5

Appendix3:False Pass Kinetic Hydro Power October 2013
Rev: 0
Marsh Creek, LLC 2000 E. 88th Ave.
Anchorage, Alaska 99507

2 | P a g e Marsh Creek, LLC - False Pass Kinetic Hydro Report
Revision Log
Revision Change Summary Author Date
Draft Draft Release Marsh Creek LLC 9/5/2013
0 Final Report Marsh Creek, LLC 11/7/2013
3 | P a g e Marsh Creek, LLC - False Pass Kinetic Hydro Report
Contents: Executive Summary ..................................................................................................................................... 4
Introduction .................................................................................................................................................. 5
Background .................................................................................................................................................. 5
Existing Power Plant Infrastructure .......................................................................................................... 6
Power Plant .............................................................................................................................................. 6
Diesel Generator Sets .............................................................................................................................. 8
Day Tank .................................................................................................................................................. 8
Cooling System ........................................................................................................................................ 9
Controls and Switch Gear ..................................................................................................................... 10
Heat Recovery ........................................................................................................................................ 11
Tank Farm ............................................................................................................................................... 12
Electrical Distribution System ................................................................................................................. 13
Kinetic Hydro – Diesel Integration .............................................................................................................. 13
Heat Recovery & Kinetic hydro Power Integration ..................................................................................... 14
Power Plant Operations .......................................................................................................................... 14
Storage Considerations ........................................................................................................................... 15
Controller Considerations ....................................................................................................................... 15
Power Plant & Kinetic hydro Power Integration ......................................................................................... 15
Challenges to Operating Lightly Loaded Diesel Engines ............................................................................. 16
Recommended Next Steps .......................................................................................................................... 18
Sensitivity Analysis .................................................................................................................................. 18

4 | P a g e Marsh Creek, LLC - False Pass Kinetic Hydro Report
Executive Summary
This report examines the of addition kinetic hydro power into the existing energy infrastructure in False Pass. The focus is limited to currently available information and evaluates the most likely scenarios for distribution system connection points that are economically and technically feasible. . The following items will be addressed:
• Evaluation of current data available for each proposed kinetic hydro power grid connection site. • Evaluation of the transmission line from the City Dock adjacent to the APIDCA fish plant • High-level evaluation of kinetic hydro power grid connection sites. (Geotechnical data,
permitting, and access are not included) • Evaluation of Diesel Power Plant’s control system for integrating kinetic hydro power. • Evaluation of existing heat recovery system for integrating excess kinetic hydro power.

5 | P a g e Marsh Creek, LLC - False Pass Kinetic Hydro Report
Introduction Aleutian Pribilof Island Community Development Association (APICDA) retained Marsh Creek, LLC to collect data on the electrical infrastructure and loads for the False Pass community. This will includes researching existing reports and collecting data on False Pass and the Bering Pacific Seafood plant energy usage; researching and verifying current electrical transmission and generation infrastructure to determine where possible interconnect locations are and what capacity of electricity could be safely, reliably, and efficiently integrated into the False Pass grid; assessing the viability of using electrical power for heating either through resistive loads or a seawater heat-pump system and compiling a report on the data collected. The proposed kinetic hydro electric sites are being evaluated for the overall hydro resource, but the integration for these sites and integration into the system and costs of site access and development and interconnection had not been specifically evaluated. The integration system cost for the power plant and distribution system are estimated for the project assuming 500kw of kinetic hydro power to be $800,000 to $1,000,000 in project development costs (False Pass City Dock connection point), however, the interconnection costs for a kinetic hydro power site farther to the south west (not fully identified and not visited by this team) would could require an additional 5-10 mile upgrade of the transmission line and access roads to the turbine site. It is unclear if the False Pass load will be met until the turbine size is identified and a kinetic hydro power site is selected. This report will update any previous data to reflect current assessments, today’s loads and projected load growth in the area, existing generation, excluding project construction cost and cost/benefit analysis.
Background A site visit was made to become familiar with the proposed kinetic hydro power sites, the power plant, heat recovery distribution system, the transmission line, access conditions and to meet with ORPC staff. This information was used to further develop the project options and identify any further information requirements. The following personnel completed the site visit on October 27th, 2012:
• John Lyons – Overall Project Manager • Marsh Creek diesel generator technician
Marsh Creek personnel met with the following onsite personnel:
• Monty Worthington - ORPC
6 | P a g e Marsh Creek, LLC - False Pass Kinetic Hydro Report
It is also assumed that the updated hydro work currently in progress will also provide additional updated information from point of electric grid connection (not yet identified) to the hydro sites and capacity for the proposed hydro. Marsh Creek reviewed power plant equipment and operations, existing heat recovery equipment both at the power plant and point of use locations.
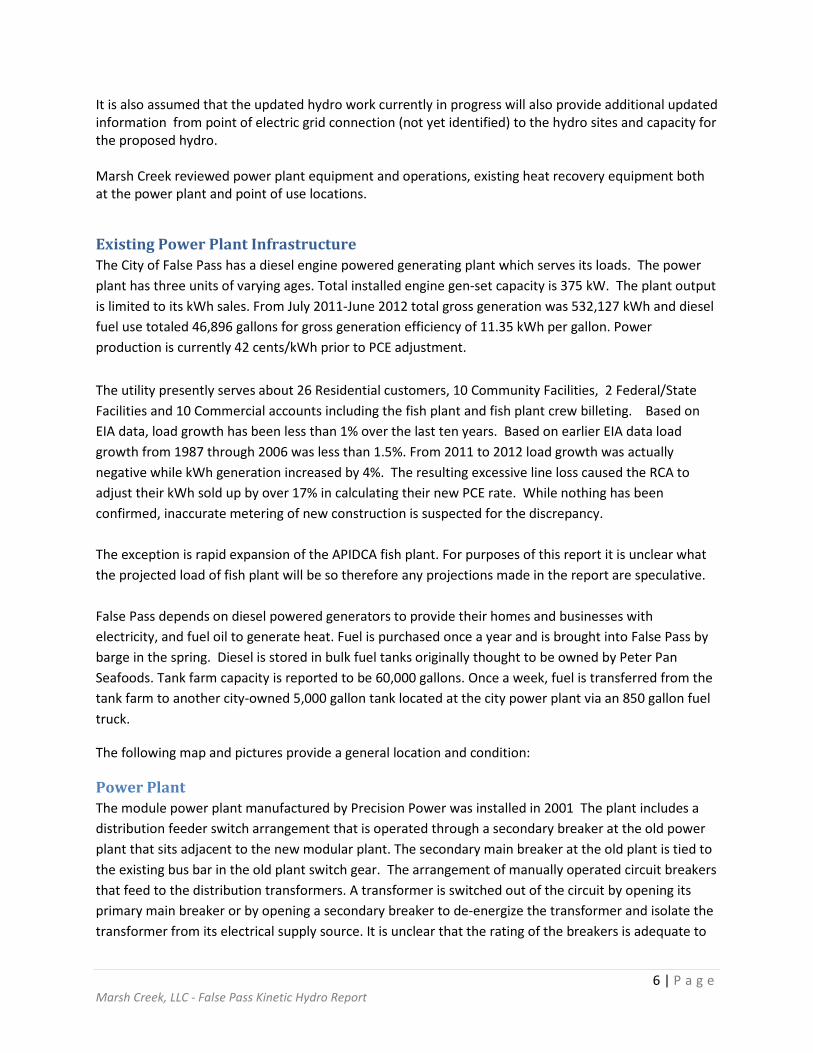
Existing Power Plant Infrastructure The City of False Pass has a diesel engine powered generating plant which serves its loads. The power plant has three units of varying ages. Total installed engine gen-set capacity is 375 kW. The plant output is limited to its kWh sales. From July 2011-June 2012 total gross generation was 532,127 kWh and diesel fuel use totaled 46,896 gallons for gross generation efficiency of 11.35 kWh per gallon. Power production is currently 42 cents/kWh prior to PCE adjustment. The utility presently serves about 26 Residential customers, 10 Community Facilities, 2 Federal/State Facilities and 10 Commercial accounts including the fish plant and fish plant crew billeting. Based on EIA data, load growth has been less than 1% over the last ten years. Based on earlier EIA data load growth from 1987 through 2006 was less than 1.5%. From 2011 to 2012 load growth was actually negative while kWh generation increased by 4%. The resulting excessive line loss caused the RCA to adjust their kWh sold up by over 17% in calculating their new PCE rate. While nothing has been confirmed, inaccurate metering of new construction is suspected for the discrepancy. The exception is rapid expansion of the APIDCA fish plant. For purposes of this report it is unclear what the projected load of fish plant will be so therefore any projections made in the report are speculative. False Pass depends on diesel powered generators to provide their homes and businesses with electricity, and fuel oil to generate heat. Fuel is purchased once a year and is brought into False Pass by barge in the spring. Diesel is stored in bulk fuel tanks originally thought to be owned by Peter Pan Seafoods. Tank farm capacity is reported to be 60,000 gallons. Once a week, fuel is transferred from the tank farm to another city-owned 5,000 gallon tank located at the city power plant via an 850 gallon fuel truck.
The following map and pictures provide a general location and condition:
Power Plant The module power plant manufactured by Precision Power was installed in 2001 The plant includes a distribution feeder switch arrangement that is operated through a secondary breaker at the old power plant that sits adjacent to the new modular plant. The secondary main breaker at the old plant is tied to the existing bus bar in the old plant switch gear. The arrangement of manually operated circuit breakers that feed to the distribution transformers. A transformer is switched out of the circuit by opening its primary main breaker or by opening a secondary breaker to de-energize the transformer and isolate the transformer from its electrical supply source. It is unclear that the rating of the breakers is adequate to

7 | P a g e Marsh Creek, LLC - False Pass Kinetic Hydro Report
protect feeder conductors and transformers. Further it is unclear if the breakers will properly operate on a faulted condition. An interim electrical or key interlock scheme should be added to enforce the proper operating modes of this type of system, especially in light of the fact that the switching is carried out over several pieces of equipment that are in different locations from one another. This is of particular importance because of the potential safety concerns to plant operators and other personnel as it pertains to arc fault current. Unless circuit breakers and other protective devices have been selected and installed to handle the arc fault condition, they will not trip and the full force of an arc flash will occur. An application review with corrective recommendations should be conducted to remedy the switching arrangement of the distraction feeder circuit.
Old Power Plant – distribution service from Old Power Plant – Village Feeder Switch new power plant
Old Power Plant – Village feeder and metering Distribution Transformers – Three phase from Old Power Plant feeders

8 | P a g e Marsh Creek, LLC - False Pass Kinetic Hydro Report
False Pass Power Plant with 5,000 gal. fuel tank.
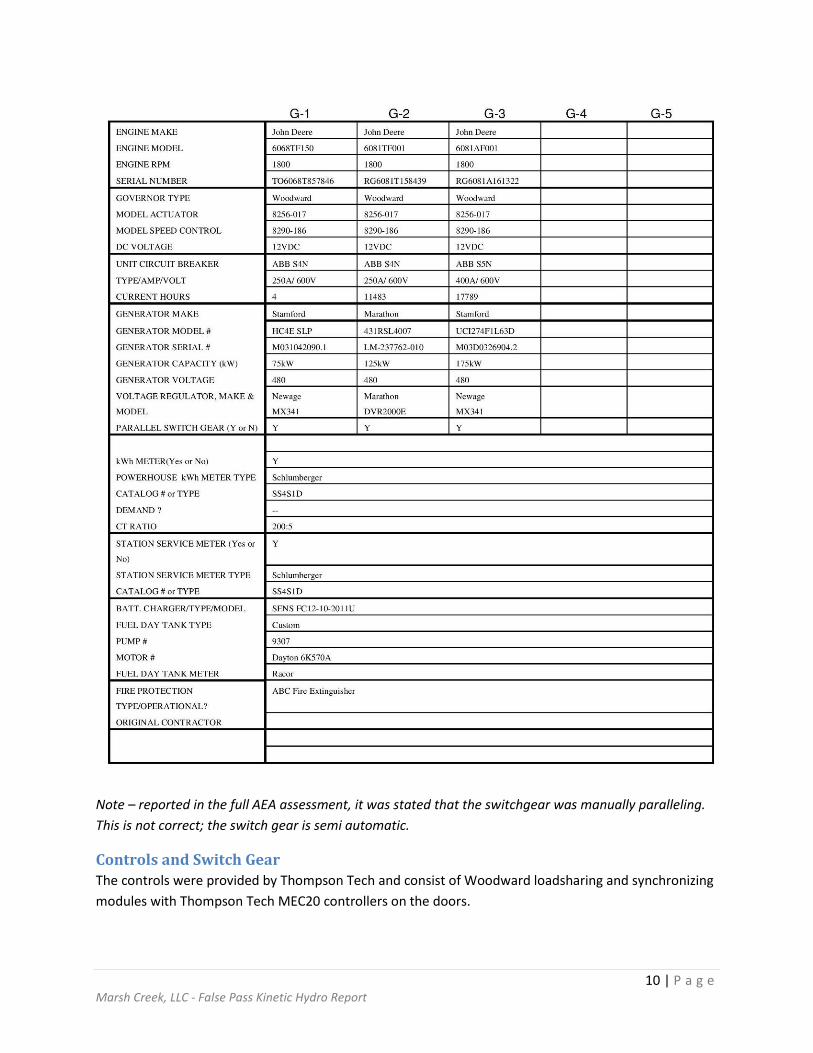
Diesel Generator Sets The power plant is operated and maintained by Monty Chitty. The power plant is very clean and well maintained. The power plant has three diesel Gen-Sets consisting of one John Deere 6068TF generator set rated at 75kW, a 6081TF generator set rated at 125kW and a 6081AF generator set rated at 175kW.
Power Plant – Layout overview
Day Tank The day tank controls along with the automatic fill system will need to be repaired. The motor operated valve for the bulk tank was not working properly and caused intermittent fill issues. The fuel fill safeties are believed to be bypassed. The tank is a standard 100 gallon day tank.

9 | P a g e Marsh Creek, LLC - False Pass Kinetic Hydro Report
Power Plant Day Tank and Controls
Cooling System The cooling system is comprised of 3” copper piping and 2 remote radiators. The cooling system ethylene glycol is piped into the lower coolant manifold on the engines and the hot coolant is routed out through the upper coolant manifold through the heat exchanger, transferring heat to the city shop heat recovery loop. The glycol loop continues on through a thermostatically controlled mixing valve that automatically mixes cool and warm coolant to keep the loop temperature stable. At this juncture, the glycol is either piped back to the engines or continues on to the radiators. The electric motor driven radiators and fans exhaust away excess heat outside the building and the loop continues back to the generator sets. Prior to the generator sets, the loop intersects the return from the thermostatic mixing valve.
10 | P a g e Marsh Creek, LLC - False Pass Kinetic Hydro Report
Note – reported in the full AEA assessment, it was stated that the switchgear was manually paralleling. This is not correct; the switch gear is semi automatic.
Controls and Switch Gear The controls were provided by Thompson Tech and consist of Woodward loadsharing and synchronizing modules with Thompson Tech MEC20 controllers on the doors.

11 | P a g e Marsh Creek, LLC - False Pass Kinetic Hydro Report
Gen-Set Controls with Load Share
Power Plant Gen-Set Switch Gear – Close up
Power Plant Switch Gear - Overview
Heat Recovery There is a heat recovery system already in place that feeds one location in False Pass: the City Shop. The system currently uses jacket water heat recovery only, and loses 38 degrees into the system. A tube and shell heat exchanger located in the generator building transfers heat from the generators via a buried glycol piping loop to two Modine unit heaters in the City Shop. Any heat that cannot be utilized by the City Shop is dumped from the generator building by two radiators. The radiators are not run by a
12 | P a g e Marsh Creek, LLC - False Pass Kinetic Hydro Report
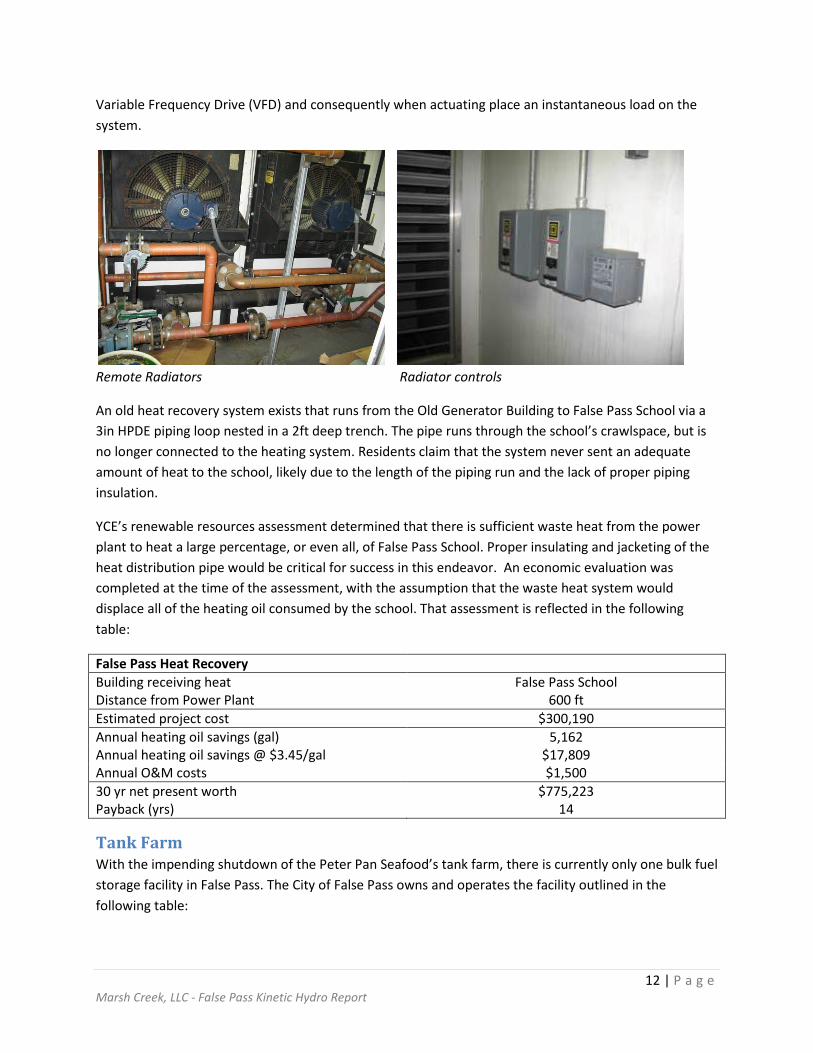
Variable Frequency Drive (VFD) and consequently when actuating place an instantaneous load on the system.
Remote Radiators Radiator controls
An old heat recovery system exists that runs from the Old Generator Building to False Pass School via a 3in HPDE piping loop nested in a 2ft deep trench. The pipe runs through the school’s crawlspace, but is no longer connected to the heating system. Residents claim that the system never sent an adequate amount of heat to the school, likely due to the length of the piping run and the lack of proper piping insulation.
YCE’s renewable resources assessment determined that there is sufficient waste heat from the power plant to heat a large percentage, or even all, of False Pass School. Proper insulating and jacketing of the heat distribution pipe would be critical for success in this endeavor. An economic evaluation was completed at the time of the assessment, with the assumption that the waste heat system would displace all of the heating oil consumed by the school. That assessment is reflected in the following table:
False Pass Heat Recovery Building receiving heat False Pass School Distance from Power Plant 600 ft Estimated project cost $300,190 Annual heating oil savings (gal) 5,162 Annual heating oil savings @ $3.45/gal $17,809 Annual O&M costs $1,500 30 yr net present worth $775,223 Payback (yrs) 14
Tank Farm With the impending shutdown of the Peter Pan Seafood’s tank farm, there is currently only one bulk fuel storage facility in False Pass. The City of False Pass owns and operates the facility outlined in the following table:

13 | P a g e Marsh Creek, LLC - False Pass Kinetic Hydro Report
From AEA Bulk Fuel Facility Monitoring Plan - 2008
Electrical Distribution System The utility’s power distribution system is typical of rural distributions systems for rural Alaska. The underground distribution (URD) consisting of single phase and three-phase direct buried #2 jacketed, concentric neutral cable. There are two 480 volt feeders feed through molded case breakers that exit the module plant to the old power plant building. The configuration is further described in the section noted as “Power Plant”. The transformers are rated at 50kw the primary distribution voltage is 12,470 volts grounded Y phase to phase. Single phase primary voltage is 7200 voltage phase to ground.
Adding new hydro electric generation routing the transmission line to the adjacent city dock would require adding a new step-up transformer (size to be determined) and a primary junction cabinet with switch and disconnecting means. The transmission from the hydro plant could be tied into the existing three phase for a maximum installed capacity of 500kw.
The City is planning to upgrade Genset #1 with a bigger unit. The Process Plant is planning a new addition which will increase the electrical load on the distribution system. The biggest electricity users are currently: GCI, the school, the fish plant, and the bunkhouse. Seasonal load increases come from the fish plant.
Currently the distribution system phases are balanced as such: 1) 130 AMPS 2) 120 AMPS 3) 150 AMPS
Kinetic Hydro – Diesel Integration A kinetic hydro-diesel hybrid system combines kinetic hydro electric turbines with diesel generators to obtain maximum contribution from the tidal resource while providing continuous electric power. These
14 | P a g e Marsh Creek, LLC - False Pass Kinetic Hydro Report
systems reduce fossil fuel consumption compared to relying exclusively on diesel generation. The amount of reduction depends on the power plant generator arrangement and the size and output of the associated kinetic hydro power system. Additionally, a kinetic hydro - diesel system reduces the annual operating hours of the diesel generators, which extends the life of the generators. Systems of this type typically using wind are becoming popular in rural Alaska since rural areas generally have existing diesel fuel power plants, operating experience, service infrastructure in place, and alternative energy resources year-round. Kinetic hydro -diesel hybrid system costs depend on the penetration level of the resources compared to the amount of diesel generation. Lower penetration classes depend more heavily on the diesel infrastructure in place. High penetration classes have the highest resource capital costs but larger fuel savings of up to 70 percent. However, higher penetration systems require costly controls and integration equipment. The tidal resource in False Pass will not meet the utility load and integration with other resources is required. In other areas of the country, integration costs are paid for energy storage. In Alaska island micro grids, the utility must provide its own integrating resources. Kinetic hydro integration costs for False Pass are not yet clearly defined but are predicted to be $2 to $3 million (one time capital cost includes power controllers and energy storage system i.e. flywheel or batteries). Costs would include upgrading and automating current diesel control systems and training operators to incorporate the kinetic hydro resource. Variable operation and maintenance costs are estimated to be approximately 6-8 cents per kilowatt hour based on operating costs at other Alaska installations. Fixed operation and maintenance costs are estimated to be $35/MW in 2009 dollars. These costs are the result of escalating costs used in integrated resource plans and other studies for Pacific Northwest utilities by 25 percent. The escalation accounts for the remote location aspect of the tidal energy in Alaska. Hydro connection costs for remote Alaskan locations are significantly higher than other areas of the United States. Since there is transmission and distribution in the area that the hydro project will be located, the costs to interconnect could be appreciable (location and turbine size dependent)
Heat Recovery & Kinetic hydro Power Integration Due to the high quantity of available heat recovery and the low usage of this recovered heat, incorporating hydro will not impact heat recovery use. Currently the city is not selling the recovered heat but using the resource for heating city owned out buildings. Adding kinetic hydro power will require diesel generator spinning reserve resulting in the generators that are not heavily loaded to still produce a recovered heat byproduct. This assumes that the hybrid hydro/diesel system remains as a diesels on operation. There would be some reduction in use of the cooling system, but no other impacts. It is unclear if additional controls or modifications would be required to the existing heat recovery system by adding hydro power until the generating capacity of the hydro plant is known.
Power Plant Operations The integration of kinetic hydro power will have an impact on the operations of the existing power plant. Until the capacity of the hydroelectric generation capacity is known it will be difficult to predict the change to the power plant heat recovery operations. There is a complete and functional after-cooler system on the west side of the power plant that rejects diesel engine heat. The buildings connected to the heat recovery system use minimal heat during the summer. The peak of recovered heat production is highest during the winter months. The heat rejection system is capable of handling any unused heat,

15 | P a g e Marsh Creek, LLC - False Pass Kinetic Hydro Report
winter or summer. The additional increased use of the after-cooler fans and pumps would decrease the after-cooler system life expectancy. The decrease in life expectancy is predicted to be minimal. If the kinetic hydro power is stable and a predictable power source, the kinetic hydro power can be used to offset the base load. It will be important for power plant operators to be able to monitor the current status of the kinetic hydro plant and be able to remotely adjust the kinetic hydro system's power output.
Storage Considerations The ability to remotely monitor and adjust the power output becomes critical if the kinetic hydro resource’s generating capacity is expected to exceed the village load. In this scenario, storage should be considered. A detailed analysis will be required to properly size a storage system.
Controller Considerations During 2012, False Pass had an average of 125kw of generation spinning to meet the required demand of 86kw. If the hydro system were sized at 50 kW or less, it should have minimal impact on operations. With the current larger system proposed, the ability to automatically start, connect, and disconnect each power source will be required. A central controller it will be required to connect the appropriate power sources and maintain an appropriate spinning reserve capacity. It will also be important to monitor the kinetic hydro turbine power output quality and be able to connect and disconnect turbines remotely or automatically if power quality falls out of the specified parameters.
Power Plant & Kinetic hydro Power Integration The control system upgrades at the power plant are applicable to the proposed False Pass hydro project. The significant improvements to be made to the existing control system at the power plant to allow reliable simultaneous operation of the two generating resources (hydro-diesel) are listed below:
1. Automate by supervisory control start/stop of selected diesel engine gen-sets to allow load changes from the hydro to be incorporated automatically and minimize system disturbances.
2. Provide communications between the hydro and other locations to allow monitoring and control of hydro generation.
3. Provide HMI and SCADA system for control and monitoring of system and kinetic hydro generation, including ability to curtail kinetic hydro generation off-line for emergency control of system during faulted conditions.
4. Improve system protection via load shedding for selected feeders would be based on voltage or frequency criteria. New equipment will be required to better coordinate this capability.
The controls on each of the existing diesel generators will need to be upgraded to allow for remote control and monitoring. A flywheel or battery based energy storage system could also be added to balance a variable power source with the variable load. A centralized control system will need to be added to control the flow of power between all available sources to customer loads and the energy storage system while maximizing renewable energy production, maintaining grid stability, and maintaining proper amounts of spinning reserve capacity. It is our belief that it will be critical to increase

16 | P a g e Marsh Creek, LLC - False Pass Kinetic Hydro Report
the training and knowledge of the power plant operations staffing until so the key staff are fully aware and understand the system dynamics.
Estimated power plant integration cost for the kinetic hydro is estimated at $ 850,000 based on an installed capacity of 100kw of kinetic hydro. These costs are consistent with recent experience in performing modifications to the Kotzebue diesel generating station to integrate their new wind turbines and with Kokhanok to integrate high penetration wind averaging roughly twice the generated wind compared to the average village load.
Challenges to Operating Lightly Loaded Diesel Engines The argument could be made that the actual fuel savings incurred by the operation of a kinetic hydro - diesel system is only the actual fuel savings incurred by the diesel engines. Unfortunately the actual fuel savings incurred by the diesel engines is not the full proportionate amount consumed by the diesel at the load at which the turbine begins to supplement the system load. This is due to the efficiency of the diesel engine powered generator set.
A diesel driven generator combination typically operates most efficiently at very close to its maximum capability. At that point the efficiency of the synchronous generator is at its maximum with fixed loses being the smallest percentage of output. The slight dip, if any, in the efficiency of the diesel engine at maximum loading can be offset by increasing the efficiency of the rotating generator so that together the overall efficiency of the combination either remains constant or increase slightly at maximum output.
As the load is reduced, the efficiency of both the diesel engine and the generator taken separately both decline and thus the overall efficiency of the two units also declines.
Any external power source which reduces the load on the diesel engine driven generator has the effect of reducing the efficiency of the diesel unit. Therefore any savings associated with an external source which only reduces the load on the diesel engine driven generator set but does not allow the diesel engine to be shut completely off is only the marginal savings associated with difference in fuel consumption at the higher diesel engine load and efficiency, and the fuel consumption at the lower diesel engine load and efficiency.
In the case of kilowatt-hours generated per gallon of fuel consumed, the lower limit of fuel efficiency for the diesel would be when the load on the diesel engine driven generator set is reduced to zero, but yet the diesel engine would be required to operate at synchronous speed in order to provide a reference frequency signal for the hydroelectric turbine during certain conditions such as tide change or a low flow slack tide condition. Assume the most efficient diesel engine would be available and operated under those conditions at synchronous speed.
Spreading fuel cost across the historical kilowatt-hour generated results in an average cost per kilowatt-hour sold and an average cost per kilowatt-hour generated to operate the diesel generator set as a synchronous reference for an external induction type wind turbine source. This cost would then have to

17 | P a g e Marsh Creek, LLC - False Pass Kinetic Hydro Report
be deducted from the fuel cost per kilowatt-hour sold or the fuel cost per kilowatt-hour generated to operate the diesel generator as the sole power source (base cost of energy). The difference would be the potential value of fuel saving per kilowatt-hour sold for non-firm wind energy.
Station energy consumption and the parasitic losses of turbines would still be incurred to operate pumps, fans, controls, chargers, parasitic losses of inverters etc. Therefore, in reality the calculated gross value of the non-firm kinetic hydro energy should be reduced by the percentage of energy consumed by the station and reduced by the percentage of energy losses in the distribution system in order to arrive at a new value of non-firm kinetic hydro energy transmitted to the system.
For a typical diesel-generator power-plant-supplied distribution system, the energy of diesel fuel is converted to electric energy. Some of the electric energy generated is consumed by the power plant. Some of the electric energy generated is consumed by the distribution system in the form of system losses, and finally the end user consumes the balance of the available electric energy. The kinetic hydro power system may or may not be transferring electric energy to the system.
In a typical example all of the electric energy is produced by the diesel gensets. For the purpose of this example, $100 of diesel fuel is converted to 1000kWh of electric energy. The power plant consumes 30 kWh. Losses in the distribution system consume 50 kWh. The result is 920 kWh available to the end user.
The fuel cost of electric energy based upon kWh generated is $100 divided by 1000 kWh, or $0.10 per kWh generated. The fuel cost of electric energy based upon kWh sold is $100 divided by 920 kWh or $0.1087 per kWh sold. The end user would be expected to pay for the full cost of fuel which is $100. This corresponds to $0.10 per kWh generated, $0.1087 per kWh sold.
In another example all electric energy is produced by the kinetic hydro power energy system. In our model, the kinetic hydro system utilizes a permemate-type generator which requires an inverter for voltage and synchronous frequency reference and excitation voltage source. We have assumed the diesel engine shall always be operated at 60 Hertz with near no load and zero output. The diesels are operated to avoid interruptions in service. To do this, the diesel engine consumed $10 worth of fuel. The other factors remains the same, i.e. the end user still consumes 920kWh of energy and only wishes to pay $100. The power plant still consumes 30 kWh. Losses in the distribution system still consume 50 kWh. Therefore the wind system must transfer 1000 kWh to the system. Since all fuel costs must be covered by the $100 paid by the end user, the wind system value of energy is $0.09 per kWh of energy transferred to the system.
To determine if the derivation matches the realities of the example, the following formulas are applied. The fuel cost of energy is derived based on kWh sold and kWh generated and is $0.1087 per kWh sold and $0.10 per kWh generated respectively. The fuel expense to operate at 60 Hz no load with zero output is derived based on kWh sold and kWh generated and is $0.01087 per kWh sold and $0.01 per kWh generated respectively. The non-firm wind energy value can be calculated at this point using the data available based on kWh generated i.e. fuel costs of energy minus fuel expense to operate at 60 Hz

18 | P a g e Marsh Creek, LLC - False Pass Kinetic Hydro Report
no load with zero output both based on kWh generated equals the non-firm kinetic hydro energy rate, $0.10-$0.01=$0.09. This agrees with the example.
The base assumption then is a lower generating efficiency and/or high system loses directly result in a higher fuel cost of energy sold and correspondingly results in a higher cost value of non-firm kinetic hydroelectric energy.
Recommended Next Steps A second phase of the project (not included in this study) would consist of updating the entire power system model as additional hydro data is provided. This exact scope of a second phase would be determined at the conclusion of Phase 1 or at such a time that additional data is available. This information may include transmission line evaluation data, and updated electric system and resource data. A second phase of the evaluation could evaluate the identified power generation sites where additional information may become available in the future (i.e. updated hydrology data and specific site locations, updated data to transmission line, etc).
• Economic and financial analysis focused on the most likely integration of kinetic hydro power into the existing electric system is not part of this evaluation.
• High-level evaluation of kinetic hydro power connection sites. (Geotechnical data, permitting, and access are not included)
Sensitivity Analysis Assumptions regarding load growth and diesel prices are uncertain. A sensitivity analysis should be performed to indicate a range of possible resource costs under varying assumptions. Capital costs for rural kinetic hydro projects are high, the low load forecast scenario increases costs on a per unit basis and higher load forecasts will decrease costs on a per unit basis. The scenarios with more diesel generation are at greater risk for higher costs from load growth since more of the load must be met with diesel generation. Further study on integrating the fish processing plant should be considered.