full year 2016 results - schneider electric · pdf filefull year 2016 performance highlights4...
TRANSCRIPT

February 16, 2017
Full Year 2016 Results

All forward-looking statements are Schneider Electric management’s present expectations of future events and are subject to a number of factors and
uncertainties that could cause actual results to differ materially from those described in the forward-looking statements. For a detailed description of
these factors and uncertainties, please refer to the section “Risk Factors” in our Annual Registration Document (which is ava ilable on www.schneider-
electric.com). Schneider Electric undertakes no obligation to publicly update or revise any of these forward-looking statements.
This presentation includes information pertaining to our markets and our competitive positions therein. Such information is based on market data and
our actual revenues in those markets for the relevant periods. We obtained this market information from various third party sources (industry
publications, surveys and forecasts) and our own internal estimates. We have not independently verified these third party sources and cannot
guarantee their accuracy or completeness and our internal surveys and estimates have not been verified by independent experts or other independent
sources.
Page 2 Schneider Electric – Investor Relations
Disclaimer

30 Full year 2017 targets
32 Appendices
Page 3 Schneider Electric – Investor Relations
Full year 2016 performance highlights 4
Full year 2016 finance presentation 22

Full year 2016 performance highlights
Page 4 Schneider Electric – Investor Relations

Page 5 Schneider Electric – Investor Relations
•We successfully delivered on our roadmap in 2016
• Adj. EBITA c.+90 bps before FX, exceeding initial target and top-end of revised target
• All time high FCF of €2.2bn
•We focus on creating shareholder value:
•TSR c.48% in last 12 months.
•€2.04 dividend proposed, up +2%
•Company well positioned for profitable growth:
• Major geographies set to improve though geo-political uncertainty remains
• Strategy to focus on products, services and better systems fully delivering
•Ramping up EcoStruxure, our Digital architecture, across major markets
•Consistent & solid execution of “Schneider is On.” Margin improvement underway with focus on
organizational simplification, consistent execution and potential portfolio pruning
Solid execution of Schneider is On: Strong improvement in Adjusted EBITA
margin, all time high Free Cash Flow and Net Income up +24%

Page 6
28% North
America
18% Rest of
the World
27% Western
Europe
27% Asia-
Pacific
Four integrated and synergetic businesses – FY 2016 revenues
43% 15% 22% 20%
Building Industry IT Infrastructure
Balanced geographies – FY 2016 revenues
€24.7 billion FY 2016 revenues
44% of FY revenues as
Solutions
5% of FY revenues
devoted to R&D
41% of FY revenues in
new economies
Schneider Electric 2016 highlights
Schneider Electric – Investor Relations

Page 7 Schneider Electric – Investor Relations
● 100% of new large customer projects with
CO2 impact quantification
● All our entities pass our internal Ethics &
Responsibility assessment 93.4%
16%
● 10% energy savings
● 100% of products in R&D designed with
Schneider ecoDesign WayTM
7.1%
81.6%
● One day training for every employee
every year
● 85% of employees work in countries with
Schneider gender pay equity plan
92%
75%
In 2016, Schneider Electric was awarded by:
See detailed results in appendix
79%
-
5.9%
46%
83%
57%
Q4 2016 Q3 2016 Indicators & objectives 2017 - selection
This quarter, our Planet & Society barometer reaches 8.48/10
Fortune Magazine: #24 / 50 Companies that are changing the world
DJSI Industry Leader
for the 4th consecutive year
CDP Climate Leader
part of the “Climate A list” for the 6th consecutive year
Ethisphere, world's most ethical companies
listed for the 6th consecutive year
FTSE4Good: listed for the 1st time since inception in 2001
4th company globally for clean-energy in Carbon Clean 200 List
12th most sustainable company in the world in Global 100 most
sustainable corporations
10th greenest company in the world in Newsweek Global Green
Ranking
Vigeo Eiris Industry Leader
Oekom Industry Leader
Page 7 Schneider Electric – Investor Relations

• Growth in Products, Software
& Services
• Better project and equipment
selection and execution
• c.+1% organic growth ex-systems1 & transformers
• Services up +5% organic
• Systems1 gross margin up ~+40bps (~+70bps before FX)
• Global strategic accounts orders up mid-teens
PROGRESS UPDATE IN 2016
• Growth by innovation
• EcoStruxure: building, power, grid, industry, machines, datacenters
• Software & Analytics: StruxureOn, Wonderware online
• Connected products: Masterpact MTZ, Altivar Process & Others
DO MORE
INNOVATE
• Target cost reduction of c.
€1.7-1.8bn by 2017
• c. €620m cost reduction2 in 2016, c.€1.3bn in past 2 years SIMPLIFY
1: Systems is comprised of Projects & Equipment
2: Gross support function cost reduction plus industrial productivity
• Develop connected offer
• Digitize customer experience
• Number of connected assets +15%
• Connected Customers +40% DIGITIZE
SCHNEIDER IS ON INITIATIVES
Page 8 Schneider Electric – Investor Relations
Focus on strategic priorities yielded strong results in 2016; Well positioned for
further organic sales growth and margin improvement

Page 9 Schneider Electric – Investor Relations
FINANCIAL OBJECTIVES
About flat organic growth ex-impact of
selectivity in 2016 •Slightly positive organic growth excl. selectivity1
2016 RESULTS
Expand Adj. EBITA margin +60bps to
+90bps before FX (initial target +20-60bps)
c.100% FCF conversion of Net income
through an economic cycle
Portfolio pruning
c. €1.5bn share buyback by 2016
•Adj. EBITA margin of 14.1%, up c.+90bps before FX
•All time high FCF of €2.2bn, 118% FCF conversion
•Completed disposal of Telvent Transportation, launched
strategic review of DTN
•€1.5bn share buyback executed in 2015/2016 at ~€57
per share
1: Excluding the impact of selectivity for c.€280-300m
All financial targets achieved in 2016

FY 2016 ORGANIC GROWTH, %
Group: -0.9% org,
Slightly positive underlying1
Page 10 Schneider Electric – Investor Relations
IT
-0.8
Infrastructure
-3.4
~0.3
Industry
-1.2
Building
0.3
Excl.
selectivity
ORGANIC GROWTH, %
~-0.5 -0.1
Q4 2016
~+1.6
~+0.9
H2 2016
-1.7 -1.7
H1 2016
Group underlying Organic Growth (%)
Group Organic Growth (%)
1: Estimated FY underlying organic growth excluding the impact of selectivity for c.€280-300m (neutral working day impact)
2: Estimated Q4 underlying organic growth excluding impact of c.-€150-€160m from selectivity and -1.1pt working day
Slightly positive underlying1 organic growth in 2016 with c.+1.6% underlying2
growth in Q4

Page 11 Schneider Electric – Investor Relations
Group
-0.9
Services
5.0
Services Growth across all the
businesses
MORE SERVICES
& SOFTWARE
Organic growth (%)
MORE PRODUCTS
THROUGH PARTNERS
BETTER SYSTEMS
Low-single digit organic
growth in products sold
through partners
Mid-single digit organic
growth in Wiring Devices &
Final Distribution
Revenues
outperforming Group
by c.+1.5pts organic
OEM Solution
Datacenters
Building
Automation
Grid
Automation
Software down low-single digit driven
by process industries & transition of
some offers to SaaS
Grow specialized business
Systems gross
margin improved
(~+0.7pt before FX)
Improve margins
Our strategic priorities achieved good results in a mixed market

Page 12 Schneider Electric – Investor Relations
Organic growth
+0.3% Adj. EBITA margin
19.6%/ +1.6pt
Performance in 2016
€10.7bn 43% of Group 2016 revenues
Low Voltage & Building Automation
#1
worldwide
Performance highlights
• 2 largest countries (U.S., China) both delivered growth,
Western Europe about flat
• New economies grew with India and CIS up strongly, Middle-
East declined
• Final Distribution & Wiring Devices grew mid-single digit
• Project business still impacted by soft activity in some markets
• Margin expansion of c.+1.5pts organic, mainly driven by
industrial productivity & cost control
Execution priorities
• Maximize all businesses sales through partners
• Continue to drive Wiring Devices/ Final Distribution
• Grow new connected offers EcoStruxure for Building & Power
• Keep growing analytics and digital services
• Attention to cost and pricing
Building delivers growth and a c.+1.5pt organic margin improvement

Page 13 Schneider Electric – Investor Relations
Organic growth
-0.8%
Adj. EBITA margin
16.8%/ -0.8pt
Performance in 2016
€3.6bn 15% of Group 2016 revenues
Critical Power, Cooling & Services
#1
worldwide
Performance highlights
• 2 largest markets (U.S. and India) grew
• Weakness in Western Europe, Middle-East & Africa
• Services performed strongly
• Margin declined by c. -0.5pt organic impacted by mix and
investments in digital and services capabilities
Execution priorities
• Leverage the Group’s complete portfolio for datacenters
• Grow EcoStruxure for Datacenter offer with 2016 launch of
cloud based Software
• Drive product business through channel expansion and new
offers
• Keep services growth momentum
• Continued focus on cost discipline
IT grew in large markets but suffered from weakness in EMEA. Margin
decreased but remains resilient at high level

Page 14 Schneider Electric – Investor Relations
Organic growth
-3.4%/ c.+0.3%1
Adj. EBITA margin
9.7%/ +0.6pt
Performance in 2016
€4.9bn 20% of Group 2016 revenues
Medium voltage & grid automation
#1
worldwide
Performance highlights
• Margin improved c.+1.3pt organic thanks to higher system
margin and strong cost control but was below 2016 target
of 10% due to strong negative FX (c. -0.9pt)
• Org. growth up slightly (+0.3%) excl. the impact of project
selectivity
• Services grew mid-single digit
• EcoStruxure Grid grew double-digit organically
Execution priorities
• Grow products, services and EcoStruxure Grid
• Continue project selectivity and better execution
• Further adjust cost-base and optimize industrial footprint
• Reach 10% to mid-teen adj. EBITA margin level
1: excluding c. €190m of selectivity in 2016
Infrastructure improves margin by c.+1.3pt organic in difficult markets

Page 15 Schneider Electric – Investor Relations
Organic growth
-1.2% Adj. EBITA margin
16.7%/ -0.4pt
Performance in 2016
€5.5bn 22% of Group 2016 revenues
#2
Worldwide
Discrete #4
Worldwide
Process
Performance highlights
FY org. growth impacted by weak O&G, China and U.S.
Growth in Western Europe and New economies ex-China
Positive performance in Q4 with improvement in OEM notably
China (up mid-single digit) and for Process Automation orders
Margin c.-0.2pt organic mainly driven by lower volumes
OEM business up thanks to innovation & channel initiatives
Execution priorities
Grow business through partners & integrators
Continue to develop OEM solutions
Develop EcoStruxure for Plant & Machines
Continue developing Software packages by segments
Continuous control of SFC
Industry delivers a resilient performance in a mixed environment, with positive
momentum in Q4

Page 16 Schneider Electric – Investor Relations
GROUP ACHIEVEMENTS IN 2016
IMPROVE EXECUTION
• Deeper screening of projects through experienced
solution committees and tighter processes and hurdles
• Focus on repetitive segments.
• Impact: ~20% projects above 5m€ refused at tendering
phase in 2016
• Rationalization of project and equipment footprint and up-
skilling of teams
• Systematic proactive risk assessment, mitigation plan
definition
Hit rate improved significantly
(>10pts)
Systems gross margin improved
(+0.4pt, ~0.7pt before FX)
INCREASE SELECTIVITY
GROUP: ACTIONS LAUNCHED
Increased cash generation
Good progress in improving project management and margin

Page 17 Schneider Electric – Investor Relations
Target ’15-’17
(Investor Day)
1.7-1.8
1.0
0.7-0.8
2015-2016
Achieved
1.3
0.7
0.5
2016
0.6
0.4
0.2
SFC Gross savings
Industrial productivity
KEY ACTIONS IN 2016
Industrial productivity (c. €380m)
• Ranked #18 Top Global Supply Chain
• Purchasing efficiency
• Quality value engineering
• Transport: improved container loading factor
SFC Savings (c.€240m Gross savings)
• Non-manufacturing headcount down -4% organically in 2016
• Marketing & Finance simplification
• Regional setup simplification
Reinvestments (c.€60m)
• R&D for EcoStruxure development
• Digital and mobile tools
• Services & marketing capabilities
TOTAL SAVINGS (€bn)
We continue to simplify our operations for greater efficiency

Page 18 Schneider Electric – Investor Relations
Deployment of EcoStruxure.io
Connected Products
Edge Control
Apps, Analytics & Services
En
d to
En
d
Cyb
ers
ecu
rity
Clo
ud
an
d/o
r O
n
Pre
mis
e
Grid Building Data Center Industry
GRID DATA CENTER PLANT
MACHINE BUILDING POWER
EcoStruxure Platform

Asset Performance
Management as a Service
Page 19
Apps &
Analytics,
Services
Edge
Control
Connected
Products
Buildings Industrial & machines Utilities & infrastructure Data Centers & Networks
StruxureWare Building Operations
allows data collection, analysis,
and management
Smart Building Service Plans
State of the art service plans
Altivar 340
Variable speed drive with
superior performance
and productivity
PACis 5.4
Digital Control System
Modicon M580 is the first PAC*
with built-in Cybersecure
Ethernet capabilities
Wonderware Online,
leading cloud based offering turning data into action
StruxureOn™ increases data
center resiliency
Data Center Operation 8.0
Allow monitoring & Operation
of DC’s incl. Multi-tenant
*Programmable Automation Controller
Galaxy VX™
3-phase power protection
Numerous key launches in 2016 supporting EcoStruxure deployment
Building Industry Data Center Grid
Easergy T300
Remote Terminal Unit
Schneider Electric – Investor Relations
Masterpact MTZ performance and reliability with
new digital capabilities

Page 20
Wiser Air Solution
• Complete home energy
management solution
PowerTag meter
• Smallest power and
energy meter in the
world
FUGA
• One of the most
successful launches of
wiring device ranges
Resi 9
distribution board
• Transforms homes into
vibrant, stylish living spaces
Smartlink ELEC solution
• Simple intuitive monitoring
of the status of devices and alerts
Mureva Styl
• Complete
waterproof system
Bond
switch range
• Designed to be stylish,
practical and set the mark
in terms of functionality and modularity
AvatarOn wiring
devices range
• Allows switch customization
Clipsal / PDL Iconic
• The new standard in residential
electrical accessories
… with continued focus on home and small buildings
Schneider Electric – Investor Relations
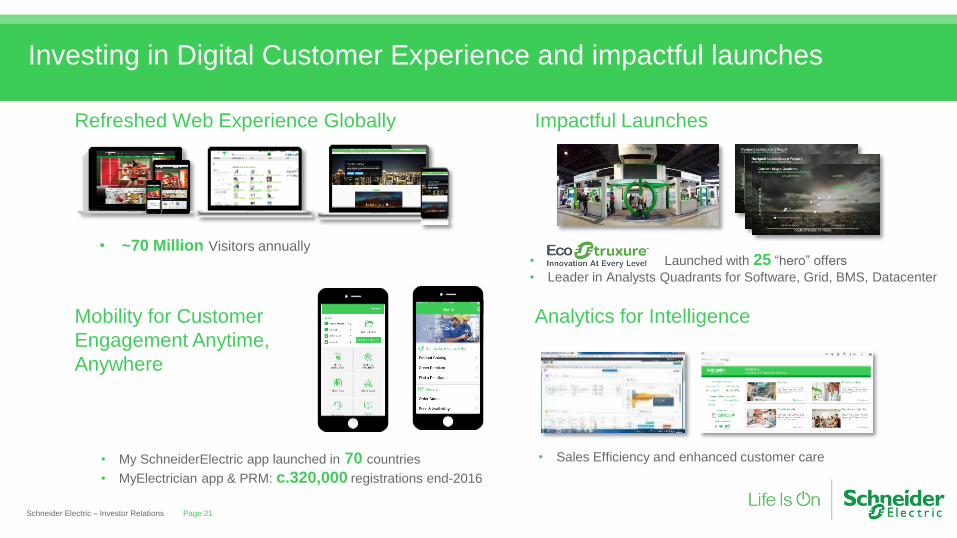
Page 21 Schneider Electric – Investor Relations
Refreshed Web Experience Globally Impactful Launches
Mobility for Customer
Engagement Anytime,
Anywhere
Analytics for Intelligence
• ~70 Million Visitors annually • Launched with 25 “hero” offers
• Leader in Analysts Quadrants for Software, Grid, BMS, Datacenter
• My SchneiderElectric app launched in 70 countries
• MyElectrician app & PRM: c.320,000 registrations end-2016
Investing in Digital Customer Experience and impactful launches
• Sales Efficiency and enhanced customer care

Full year 2016 finance presentation
Page 22 Confidential Property of Schneider Electric |

ANALYSIS OF CHANGE IN GROUP REVENUES (in €m)
• Based on current rates, the FX impact on FY 2017 revenues is estimated to be around +€400m. The FX impact at
current rates is expected to be about neutral on margin
2016
24,693 -7.3%
Fx
-2.5%
Scope
-3.9%
Rest of World
-3%
North America
-1%
Asia-Pacific
-1%
Western Europe
+0%
2015
26,640
Group: -0.9% org,
slightly positive underlying growth1
Page 23 Schneider Electric – Investor Relations
1: Excluding the impact of selectivity for c.€280-300m
Mainly Delixi
deconsolidation, Juno
& Telvent transport.
disposals
Primarily due to weaker
CNY, GBP and other
new economies
currencies vs €
Slightly positive underlying organic growth. Scope and FX main driver for
revenue decline

GROSS MARGIN: ANALYSIS OF CHANGE (%)
38.0
Scope &
Others
Productivity
-0.2
Mix
-0.4
R&D & Prod.
Labor infl.
-0.5
FX
0.1
1.5
Net price
0.5
Volume
0.0
2015 GM
37.0
2016 GM
• Improving trends
vs. 2015 thanks to
selectivity initiatives
on systems R&D increase
impacted c. -0.1pt
• Price positive outside China. In China,
despite price investments, strong
industrial productivity and cost efficiency
protected the margin
• Given the resurgence of raw material
inflation, the Group expects a negative
raw material impact in 2017 of c. - €200
million at current prices
Page 24 Schneider Electric – Investor Relations
Divestments & Delixi
deconsolidation
c.+0.4pt
Strong productivity, net price and improving mix trend drove a strong gross
margin improvement

In €m FY 2015 FY 2016 Organic change
Revenues 26,640 24,693
Gross Profit 9,845 9,390 +1%
Gross margin (%) 37.0% 38.0% +1pt
Support function costs (6,204) (5,910)
SFC1 ratio (% Revenues) 23.3% 23.9%
Adjusted EBITA 3,641 3,480 +4%
Margin % 13.7% 14.1% +70 bps
• Gross profit improved organically
through strong productivity & system margin improvement
Page 25 Schneider Electric – Investor Relations
1: Support function cost
• SFC organic reduction of -0.5%
thanks to c.€240m gross SFC savings
• Main driver for higher SFC ratio is
linked to divestments & Delixi deconsolidation (c.+40 bps impact)
Adj. EBITA margin improves c.+90 bps before FX, +70 bps organic thanks to
strong gross margin improvement

In €m FY2015 FY2016 % change
Adjusted EBITA 3,641 3,480 -4%
Other income and expenses (522) (63)
Restructuring (318) (313)
Amortization & depr. of purchase accounting intangibles (572) (153)
EBIT 2,229 2,951 +32%
Financial costs (446) (462)
Income tax (389) (712)
Equity investment & Minorities 13 (27)
Net income (Group share) 1,407 1,750 +24%
Adjusted Net income1 2,119 2,117
Adjusted Earning per share1 3.73 3.77 +1%
Page 26 Schneider Electric – Investor Relations
• Restructuring costs expected to be c. €900m in 2015-2017 to drive
efficiency initiatives.
• Includes exceptional3 -€119m. Without exceptional, ETR of 23.8%. • Effective tax rate expected in 2017: 26%-28%, not factoring potential US
tax changes at this stage
• €23m decrease in Net cost of financing but increased exchange losses due to currency volatility
1. Adjusted Net Income and EPS calculation in appendix
2. Growth of c.+2% at 31 December spot share count
• Growth of c.+2% at 31 December spot share count
EBIT and Net income increased by +32% and +24% on reported basis and
adjusted EPS1 up c.+2%2
3. Linked to the negative adjustment of net deferred tax assets

• Strong control over inventories
Analysis of debt change in €m FY2015 FY2016
Net debt at opening Dec 31 (5,022) (4,631)
Operating cash flow 2,715 2,942
Capital expenditure – net (787) (764)
Change in trade working capital 91 82
Change in non-trade working capital 26 (54)
Free cash flow 2,045 2,206
Dividends (1,219) (1,227)
Acquisitions – net 1 322 47
Net capital increase (448) (689)
FX & other (309) (531)
(Increase) / Decrease in net debt 391 (194)
Net debt Dec 31 (4,631) (4,824)
Page 27 Schneider Electric – Investor Relations
• Includes €853m share
buyback
1: including dividend from CST holding in 2015
> 90% FCF
RETURNED TO
SHAREHOLDERS
OVER PAST 2
YEARS
Record Free cash flow, up +8% thanks to improving operating cash flow and
good working capital management
• Mainly due to FX impact

Page 28 Schneider Electric – Investor Relations
109
2016
1183
2015
1132
2014
961
2016
1.1
2015
1.0
2014
1.2
CASH CONVERSION, % NET DEBT/ ADJ. EBITDA
1: Based on Net income adjusted for discontinued ops
2: Based on Net income adjusted for business disposals impact and Pelco impairment (see p25)
3: Based on Net income adjusted for non-cash c.€120m income tax increase due to deferred tax assets adjustment
Strong cash conversion and solid balance sheet

1: Based on share price prior to dividend payment, or Feb.15th 2017 for 2016 dividend
2: Subject to shareholder approval in AGM
DIVIDEND HISTORY
0
1
2
3
4
52.5
2.0
1.5
1.0
0.5
1.70
2010
1.60
2009
1.03
20162
2.04
2015
2.00
2014
1.92
2013
1.87
2012
1.87
2011
Dividend (€ per share)
Dividend Yield (%) 1
Page 29 Schneider Electric – Investor Relations
Proposed dividend of €2.04 per share, increased by +2%

Full Year 2017 Targets
Page 30 Schneider Electric – Investor Relations

Page 31 Schneider Electric – Investor Relations
In 2017 the Group expects more positive momentum in its major end-markets. In North America, modest growth is
anticipated with improvement in industrial activity and continued growth in residential markets. Western Europe is
expected to grow moderately, benefiting from an environment with a lower Euro and still relatively low oil price, while
some Brexit-related risks remain. China is expected to improve in Industry and Infrastructure markets while the
construction market should grow at a slower pace due to policy tightening. The Group will still face headwinds from O&G
and continued weakness in some resource driven economies, although these may ease towards the end of the year.
Additionally, in 2017 the Group will face a strong increase in raw material costs estimated at c.-€200m at current prices.
In this environment, the Group’s priorities are to grow its partner network through the launch of many new integrated
offers, accelerate services and software, working on margin improvement through continued selectivity on projects and
keep a strong attention on cost control. In addition, the Group should benefit from the recent deployment of its
EcoStruxure architectures in several domains to create further opportunities for growth.
Therefore, in line with the objectives announced at the 2016 Investor day, the Group targets for 2017:
> Organic revenue growth between +1% and +3% for the Group outside Infrastructure. For Infrastructure the priority
remains margin improvement and the organic growth target for the division is to be about flat underlying, before an
expected -4% to -5% impact from project selectivity for the division in 2017.
> +20bps to +50bps organic improvement on adjusted EBITA margin. The FX impact at current rates is expected to be
about neutral on margin
DRAFT 2017 Targets

Appendixes
Page 32 Schneider Electric – Investor Relations

Definitions
Page 33 Schneider Electric – Investor Relations
● EBITA: EBIT before amortization and impairment of purchase accounting
intangibles and impairment of goodwill
● Adjusted EBITA: EBITA before restructuring and other operating income and expenses
● EBITDA: EBIT before depreciation, amortization, provisions and before share-
based compensation cost
● Adjusted EBITDA: Adjusted EBITA before depreciation, provisions and before share-based
compensation cost
● Cash conversion: Free cash flow / Net income (Group share)
● Free cash flow: Operating cash flow less change in working capital less net capital
expenditures
● ROCE: Return On Capital Employed

Page 34 Schneider Electric – Investor Relations
2016 key messages: •The Planet & Society barometer reaches 8.48/10, outpacing year-end target 2016 (7.5/10).
•More than 20 million people benefited from our Access to Energy offers. Launch of Homaya, a solar home system for off-grid
households: complete solution comprises solar panels, in-built battery and 3-4 lamps;
•Commitment highly recognized by worldwide sustainability raters: DJSI (Industry Leader), CDP (in Climate A list), Global 100
(27th), Ethisphere, Vigeo Eiris (Industry Leader), Oekom (Industry Leader) and more
•Schneider Electric at COP22 Marrakech, mobilization for access to energy in Africa with Homaya, Schneider Electric
Foundation’s partnership with Art of Change 21, conferences & side events at Riad Yima.
•Company signed the Science-based targets initiative to support carbon neutrality commitment in own value chain &
ecosystem. Program launched to quantify CO2 impact and savings of large customer projects.
•Successful first “integrated report” released in 2016.
Main trends 2017: • Company engaged to accomplish the 17 SDGs (UN Sustainable Development Goals)
• Towards first carbon neutral marathon (Marathon de Paris 70% carbon neutral in 2017 – 100% in 2018)
• Human rights policy and program in accordance with the UN Guiding Principles on Business & Human Rights
Sustainability key messages 2016 and trends 2017

The arrow shows if the indicator has risen, stayed the same or fallen compared to the previous quarter. The colour shows if the indicator is above or below the objective of 8/10. 1 2 Change in scope of consolidation in Q4 2016
10% energy savings
10% CO2 savings from transportation
Towards zero waste to landfill for 100 industrial sites
100% of products in R&D designed with Schneider ecoDesign WayTM
30% reduction in the Medical Incident Rate (MIR)
One day training for every employee every year
64% scored in our Employee Engagement Index
85% of employees work in countries with Schneider gender pay equity plan
150,000 underprivileged people trained in energy management
1,300 missions within Schneider Electric Teachers NGO
75% of product revenue with Green PremiumTM eco-label
100% of new large customer projects with CO2 impact quantification
120,000 tons of CO2 avoided through maintenance, retrofit and end-of-life services
x5 turnover of Access to Energy program to promote development
100% of our recommended suppliers embrace ISO 26000 guidelines
All our entities pass our internal Ethics & Responsibility assessment
-
-
34
-
10%
10%
100
100%
60.5%
-
-
-
48%
-
75%
100%
120,000
x5
100%
100%
30%
85%
64%
85%
150,000
1,300
-
79%
61%
-
73,339
460
5.9%
8.5%
91
46%
66.3%
-
83,485
x3.3
72%
79%
37%
83%
63%
57%
119,140
1,203
7.1%
11.2%
99
81.6%
74.8%
16%
101,508
x2.11
82.3%
93.4%
33%
92%
64%
75%
123,839
1,0652
Planet & Society barometer
Overall score (out of 10)
Start
01/2015
3.00
Target
12/2017
8/10
Results
Q4 2016
8.48
Results
Q3 2016
7.65 Our megatrends 2015-2020 and our targets 2015-2017
The Planet & Society barometer 2015-2017 - Results as of Q4 2016

Adj. EBITA up +4% organic thanks to positive net price and
strong productivity
Page 36 Schneider Electric – Investor Relations
Analysis of change of adjusted EBITA (in €m)
377
102 3,480
Currency
effects
-199
Net
acquisition
impact
-117
Other
-82
SFC COGS
(Inflation
& R&D)
28 -107
Productivity Net price1 Mix
-50
Volume
-113
FY 2015
3,641
FY 2016
1: Of which RMI: c.€130m

ROCE calculation
2016
P&L items Reported
EBITA (1) 3,104
Restructuring costs (2) -313
Other operating income & expenses (3) -63
= Adjusted EBITA (4) = (1)-(2)-(3) 3,480
x Effective tax rate of the period1 (5) 23.8%
= After-tax Adjusted EBITA (A) = (4) x (1-(5)) 2,650
2015 2016 2016
Balance sheet items reported reported Avg of 4
quarters
Shareholders' equity 21,289 20,653 (B) 20,256
Net financial debt 4,631 4,825 (C) 5,253
Adjustment for Associates and Financial assets (fair value) -492 -762 (D) -756- Sunten Electric Equipment (25% stake) 98 52 80
- Fuji Electric FA Components & Systems (36.8% stake) 108 115 120
- NVC Lighting (8.9% stake) 33 35 30
- Delixi (50% stake) 279 273
- CST Holding (30% stake) 93 77 87
- Other non-current financial investments 159 204 166
= Capital Employed 25,428 24,716 (E) = (B)+(C)+(D) 24,753
= ROCE (A) / (E) 10.7%
1. Effective Tax rate corrected for the adjustment of the net deferred tax assets in France
ROCE calculation
Page 37 Schneider Electric – Investor Relations
1: Effective Tax rate corrected for the adjustment of the net deferred tax assets in France
• ROCE would be c.+90bps higher
excluding FX impacts since
2014

Adjusted net income calculation
In €m FY2015 FY2016
Net income (group share) 1,407 1,750
Invensys integration cost post-tax1 57
Impact of business disposals (in OOIE, share of profit
on associates & discontinued ops) 226 10
Impairment on Pelco net of tax 180
Restructuring charges post-tax1 249 238
Tax rate: deferred tax net assets depreciation2 119
Adjusted Net income 2,119 2,117
Adjusted EPS (€) 3.73 3.77
Page 38 Schneider Electric – Investor Relations
1: Calculated post-tax at the year effective tax rate (ETR).
2: see Press release from 9 January 2017

Q4 Performance
Page 39 Schneider Electric – Investor Relations

Q4 revenues underlying organic growth up c.+1.6% with
Industry turning positive in Q4
Page 40 Schneider Electric – Investor Relations
Analysis of change in Group revenues (€m)
Q4 2016
6,783 -5.8%
Fx
-1.0%
Scope
-3.1%
IT
+0.3%
Infrastructure
-6.7%
Industry
+1.4%
Building
-1.2%
Q4 2015
7,198
Organic Growth: -1.7%
c.+1.6% underlying growth1
1: Estimated underlying growth excluding Q4 impact of c.-€150-€160m from selectivity and -1.1pt working day

Building grew in Asia-Pacific but declined in North America and
Rest of the World
Page 41 Schneider Electric – Investor Relations
3,112
Q4 2016
2,848 -8.5%
Fx
-1.2%
Scope
-6.1%
Organic
-1.2%
Q4 2015
Analysis of change in Q4 Revenues (€m) North America declined, as the U.S. suffered from lower
project activity in commercial & industrial buildings mainly
due to selectivity and a high base of comparison in solar
markets. Residential activity continued to show good
growth in a favorable market. Mexico grew while Canada
was about flat.
Western Europe was stable. France posted solid growth
thanks to good project execution and an improving
residential market. Italy, Spain and the U.K. grew benefiting
from commercial initiatives while Germany declined.
Asia-Pacific was up slightly thanks to growth in India and
residential activity in Australia. India continued to grow,
avoiding substantial impacts from government
demonetization policies through actions with partners.
China was slightly negative due to some delays in projects
in favorable construction markets in Tier 1 & Tier 2 cities.
Rest of the World posted mixed results, with growth in CIS,
Africa and South America and a strong decline in the
Middle-East.
44% of Q4 revenues

Industry turned positive in Q4 thanks to OEM and improvement
in China
Page 42 Schneider Electric – Investor Relations
Q4 2016
1,477 +0.9%
Fx
-0.9%
Scope
+0.4% Organic
+1.4%
Q4 2015
1,464
Analysis of change in Q4 Revenues (€m) Globally, the Group benefited from its focus on OEM in a
favorable market. Process automation declined
organically, though showing early signs of improvement in
order intake.
China was up high-single digit in an improved OEM
market, driving the growth of Asia-Pacific. Elsewhere in
Asia, the Group continued to see growth in India and
weakness in Australia.
Western Europe declined slightly, with an impact from
working days. Positive OEM demand in Italy and Spain
could not fully offset a decline in France, and lower project
execution in U.K. and Germany.
The U.S. was down slightly as it continued to be impacted
by low O&G investment but posted growth in the OEM
market. The priority remains to enhance cross-selling
through channel initiatives.
Rest of the World was positive, led by strong growth in
Russia and Africa while South America and the Middle-
East declined.
22% of Q4 revenues

Infrastructure was slightly up before the impact of the project
selectivity which accelerated as expected in Q4
Page 43 Schneider Electric – Investor Relations
Q4 2016
1,466 -10.6%
Fx
-1.3%
Scope
-2.6%
Organic
-6.7%
Q4 2015
1,639
Analysis of change in Q4 Revenues (€m) Negative impact from selectivity initiatives accelerated to ~-
€100m in Q4, in line with expectations.
North America was down due to selectivity and continued
weakness in resource and industrial markets in the U.S. and
Canada.
Western Europe was down. Germany declined mainly due
to project selectivity despite continued growth in
transactional and services business. In France, the business
remained stable with strong growth in services thanks to
targeted initiatives which compensated for a planned
decrease in projects due to selectivity.
In Asia-Pacific, China was down slightly on selectivity and
weakness in traditional segments. Indonesia benefited from
project execution while Australia continued to suffer from
lower investment in resources.
Rest of the World was down with a mixed picture, notably
with weakness in the Middle-East but growth in Russia.
22% of Q4 revenues
~flat organic
growth before
selectivity

IT grew slightly in Q4, thanks to North America and Asia Pacific
Page 44 Schneider Electric – Investor Relations
Q4 2016
992 +0.9%
Fx
+0.6% Scope
+0.0%
Organic
0.3%
Q4 2015
983
Analysis of change in Q4 Revenues (€m) North America was up led by the U.S. with strong
growth in IT channel sales, continued success in
services initiatives and project execution in data
centers. Mexico declined.
Western Europe was down mainly due to declines in
Germany and the U.K. Italy, France, and Nordic
countries grew.
Asia-Pacific was up as India continued to grow
strongly with little impact seen from government
demonetization initiatives. Elsewhere in Asia, the
Group saw growth in South East Asia and Japan and
declines in China and Australia.
Rest of the World declined, mainly driven by Russia
and the Middle-East.
Services continued to grow strongly.
15% of Q4 revenues

Asia-Pacific grew slightly with China & India while rest of
regions declined
Page 45 Schneider Electric – Investor Relations
Analysis of change in Group revenues (€m)
Q4 2016
6,783 -5.8%
Fx
-1.0%
Scope
-3.1%
Rest of
World
-2%
North
America
-4%
Asia-
Pacific
0%
Western
Europe
-1%
Q4 2015
7,198
Organic: -1.7 %
Western
Europe
Asia
Pacific
North
America
Rest of
the World
27%
27%
27%
19%
Q4 revenues

Contacts & agenda
Page 46 Schneider Electric – Investor Relations
Alexis Denaud – Senior Investor Relations Manager Tel: +33-1-41-29-51-24
Apr 20, 2017
Apr 25, 2017
Q1 2017 Revenues
Annual General Meeting
Conference call
Meeting
Amit Bhalla– Head of Investor Relations
Tel: +44-20-7592-8216
