full year results 2004 -...
TRANSCRIPT
Full Year Results 2004
25 November 2004
GrainCorp Full Year Presentation
Corporate Results
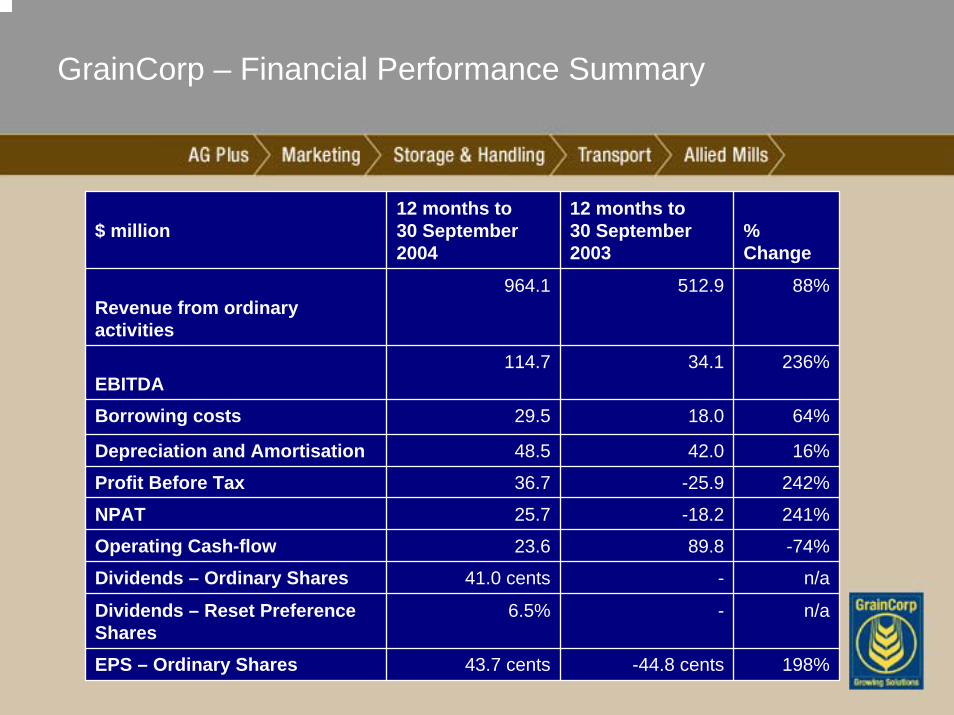
GrainCorp – Financial Performance Summary
$ million12 months to 30 September 2004
12 months to 30 September 2003
% Change
Revenue from ordinary activities
964.1 512.9 88%
EBITDA114.7 34.1 236%
Borrowing costs 29.5 18.0 64%
Depreciation and Amortisation 48.5 42.0 16%
Profit Before Tax 36.7 -25.9 242%
NPAT 25.7 -18.2 241%
Operating Cash-flow 23.6 89.8 -74%
Dividends – Ordinary Shares 41.0 cents - n/a
Dividends – Reset Preference Shares
6.5% - n/a
EPS – Ordinary Shares 43.7 cents -44.8 cents 198%
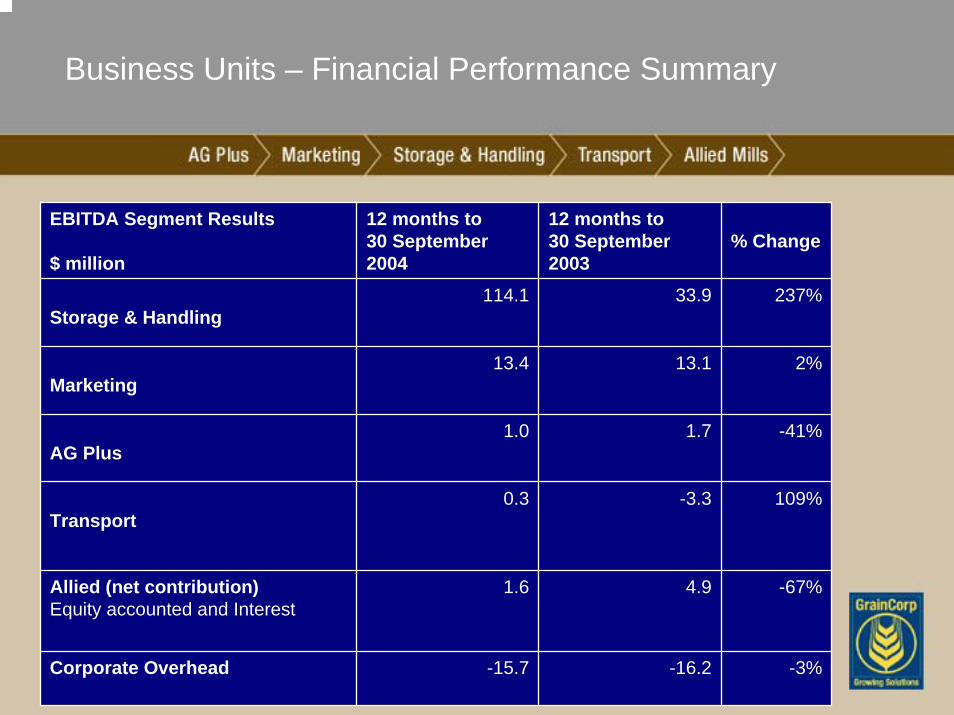
Business Units – Financial Performance Summary
EBITDA Segment Results
$ million
12 months to 30 September 2004
12 months to 30 September 2003
% Change
Storage & Handling114.1 33.9 237%
Marketing13.4 13.1 2%
AG Plus1.0 1.7 -41%
Transport0.3 -3.3 109%
Allied (net contribution) Equity accounted and Interest
1.6 4.9 -67%
Corporate Overhead -15.7 -16.2 -3%
Business Units – Financial Performance Summary
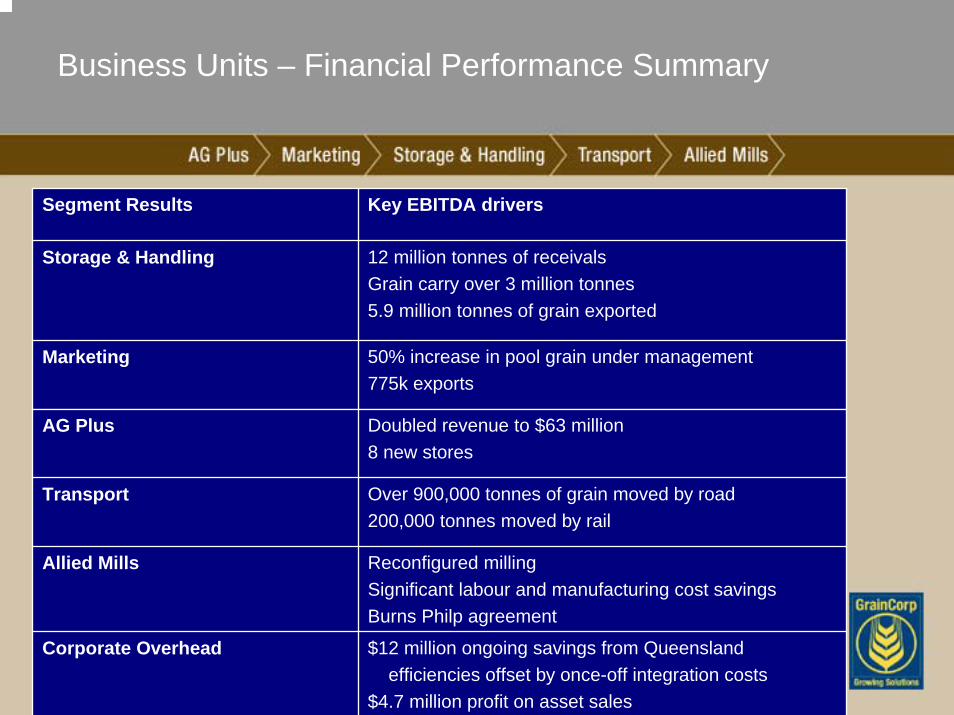
Segment Results Key EBITDA drivers
Storage & Handling 12 million tonnes of receivalsGrain carry over 3 million tonnes 5.9 million tonnes of grain exported
Marketing 50% increase in pool grain under management775k exports
AG Plus Doubled revenue to $63 million8 new stores
Transport Over 900,000 tonnes of grain moved by road200,000 tonnes moved by rail
Allied Mills Reconfigured millingSignificant labour and manufacturing cost savings Burns Philp agreement
Corporate Overhead $12 million ongoing savings from Queenslandefficiencies offset by once-off integration costs
$4.7 million profit on asset sales
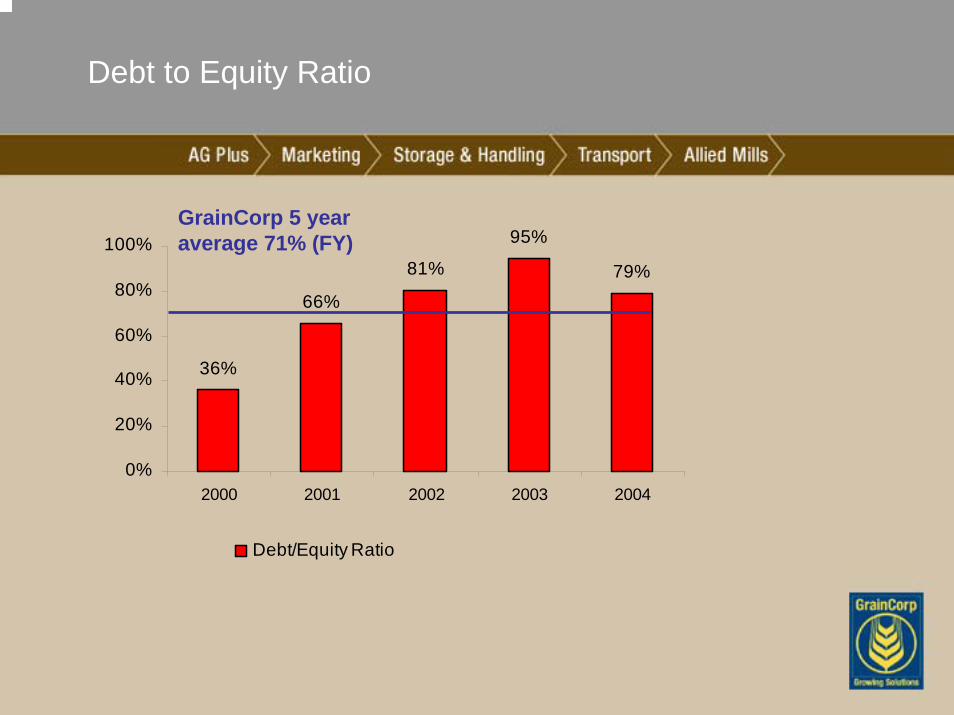
Debt to Equity Ratio
36%
66%
81%
95%
79%
0%
20%
40%
60%
80%
100%
2000 2001 2002 2003 2004
Debt/Equity Ratio
GrainCorp 5 year average 71% (FY)
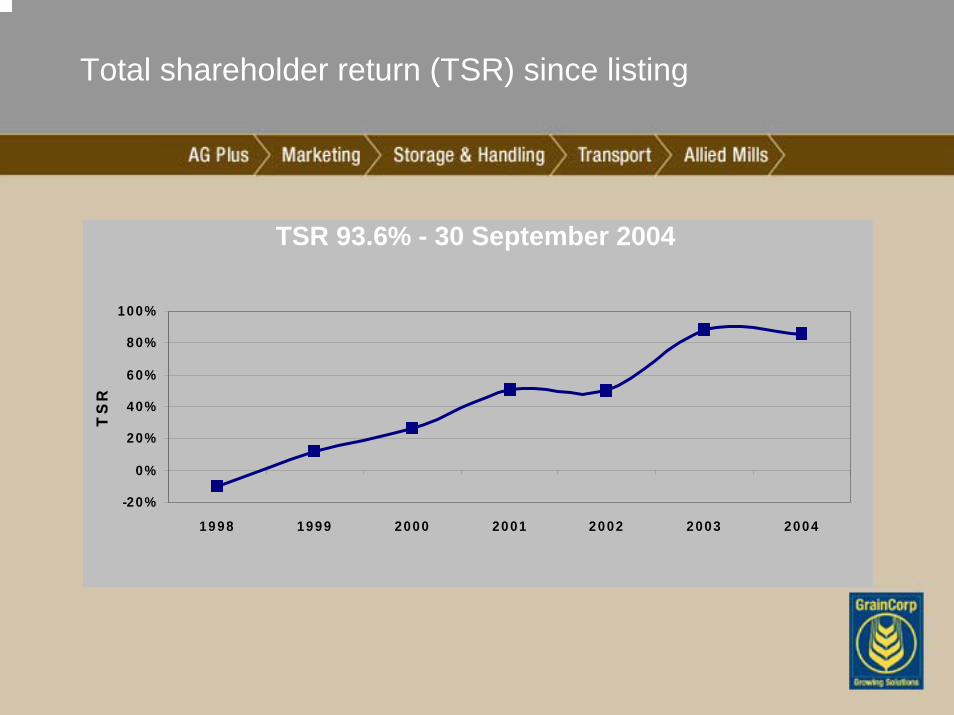
Total shareholder return (TSR) since listing
-20%
0%
20%
40%
60%
80%
100%
1998 1999 2000 2001 2002 2003 2004
TS
R
TSR 93.6% - 30 September 2004
Capital Management
Dividend Policy a minimum of 70% profit after tax – up from 65%
Dividend Re-investment Plan (DRP) – currently approved by shareholders and may be re-activated at the discretion of the Board
Ordinary Share buyback – on market currently operative
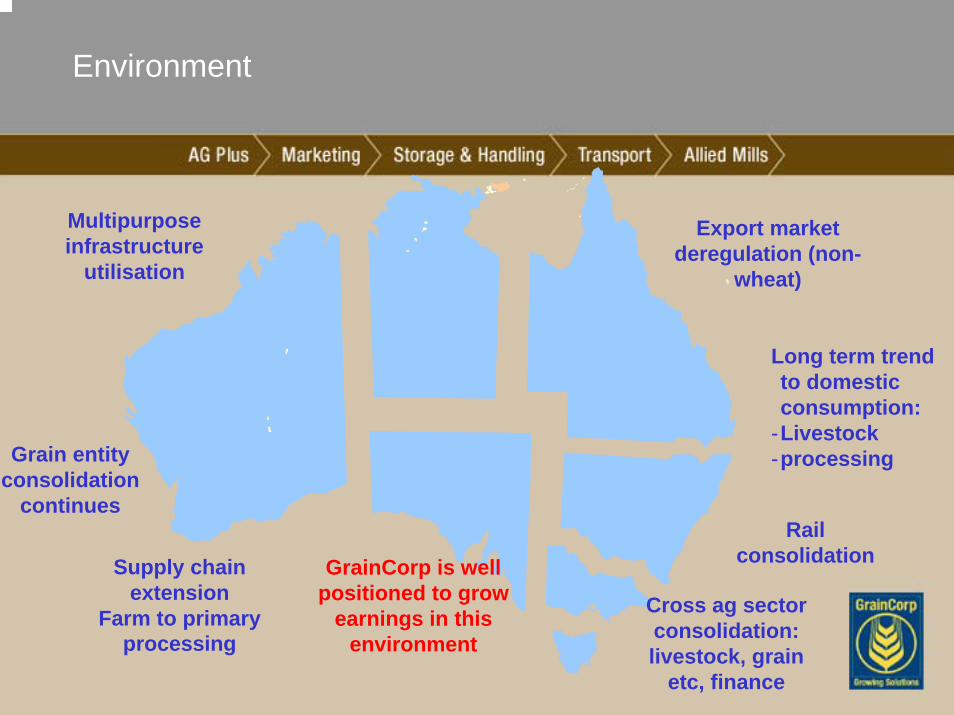
Multipurpose infrastructure
utilisation
Environment
Supply chain extension
Farm to primary processing
Cross ag sector consolidation: livestock, grain
etc, finance
Long term trend to domestic consumption:
-Livestock-processing
GrainCorp is well positioned to grow
earnings in this environment
Export market deregulation (non-
wheat)
Grain entity consolidation
continuesRail
consolidation
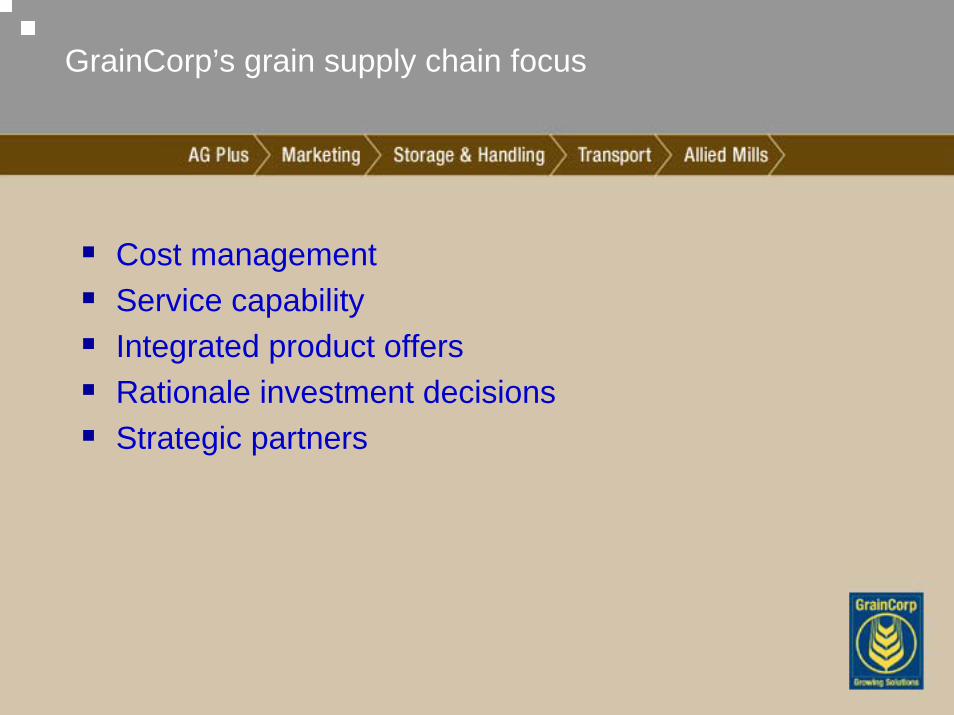
GrainCorp’s grain supply chain focus
Cost management Service capabilityIntegrated product offersRationale investment decisionsStrategic partners
AG Plus Marketing
Storage & Handling
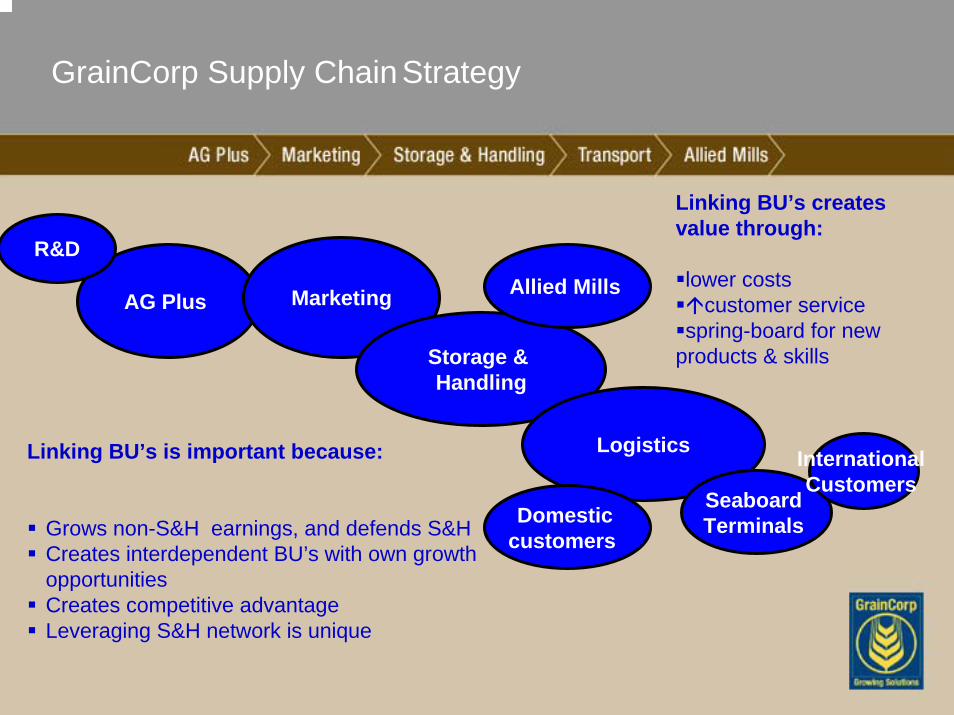
GrainCorp Supply Chain Strategy
R&D
Allied Mills
Logistics
Seaboard Terminals
International Customers
Linking BU’s is important because:
Grows non-S&H earnings, and defends S&HCreates interdependent BU’s with own growth opportunitiesCreates competitive advantageLeveraging S&H network is unique
Linking BU’s creates value through:
lower costscustomer service
spring-board for new products & skills
Domestic customers

GrainCorp Full Year Presentation
Business OperationsStorage & Handling

Storage & Handling – reinforcing capabilities
Cost management - Maintenance - Out-loading- Total costs $113 million
Capital investment - Capacity growth- Operational improvements- Spend of $30-$35 million
p.a.
Service capability:Outload:- Thallon increased from
400t/hr to 1100t/hr
Inload:- Moree 26,580 t in one
day (Australian record)
Network superiority in:- Quality management - Segregation capability- Skilled workforce- Export terminals
Integrated products:Leverage for
- Marketing- Transport- AG Plus- Allied Mills
Strategic partners:- long-term storage
agreements with major volume buyers
- Focus on growth in stockfeed sector supply
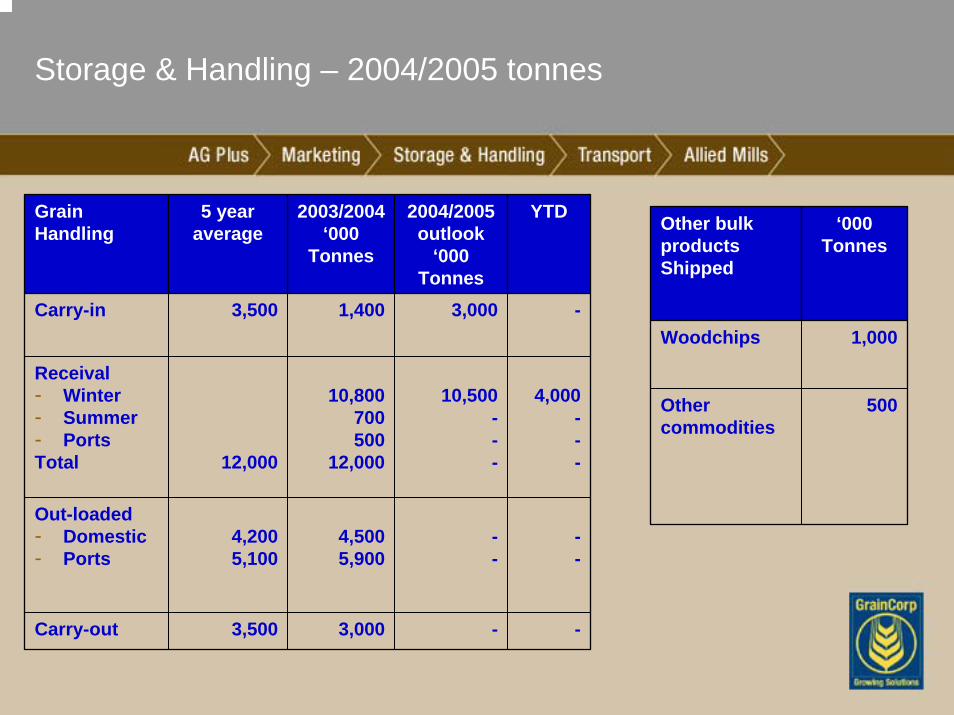
Storage & Handling – 2004/2005 tonnes
Other bulk products Shipped
‘000 Tonnes
Woodchips 1,000
Other commodities
500
Grain Handling
5 year average
2003/2004‘000
Tonnes
2004/2005outlook
‘000 Tonnes
1,400 3,000
10,500---
--
-
10,800700500
12,000
4,500 5,900
3,000
3,500
12,000
4,2005,100
3,500
YTD
Carry-in -
4,000---
--
Receival- Winter- Summer - PortsTotal
Out-loaded- Domestic- Ports
Carry-out -
GrainCorp Full Year Presentation
Business OperationsGrain Marketing
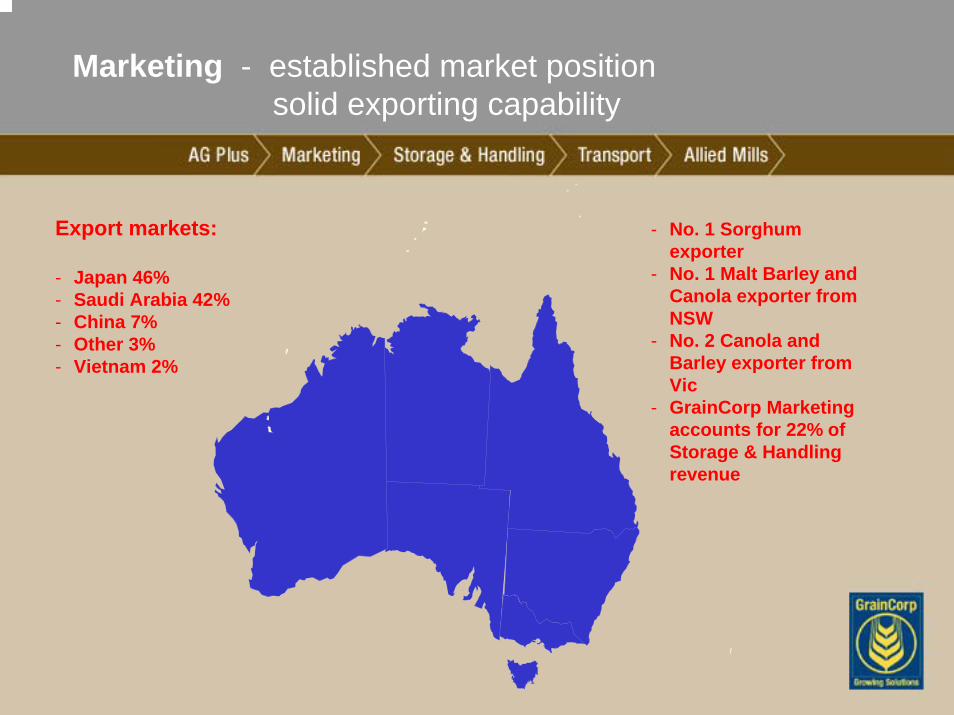
Export markets:
- Japan 46%- Saudi Arabia 42%- China 7%- Other 3%- Vietnam 2%
Marketing - established market positionsolid exporting capability
- No. 1 Sorghum exporter
- No. 1 Malt Barley and Canola exporter from NSW
- No. 2 Canola and Barley exporter from Vic
- GrainCorp Marketing accounts for 22% of Storage & Handling revenue
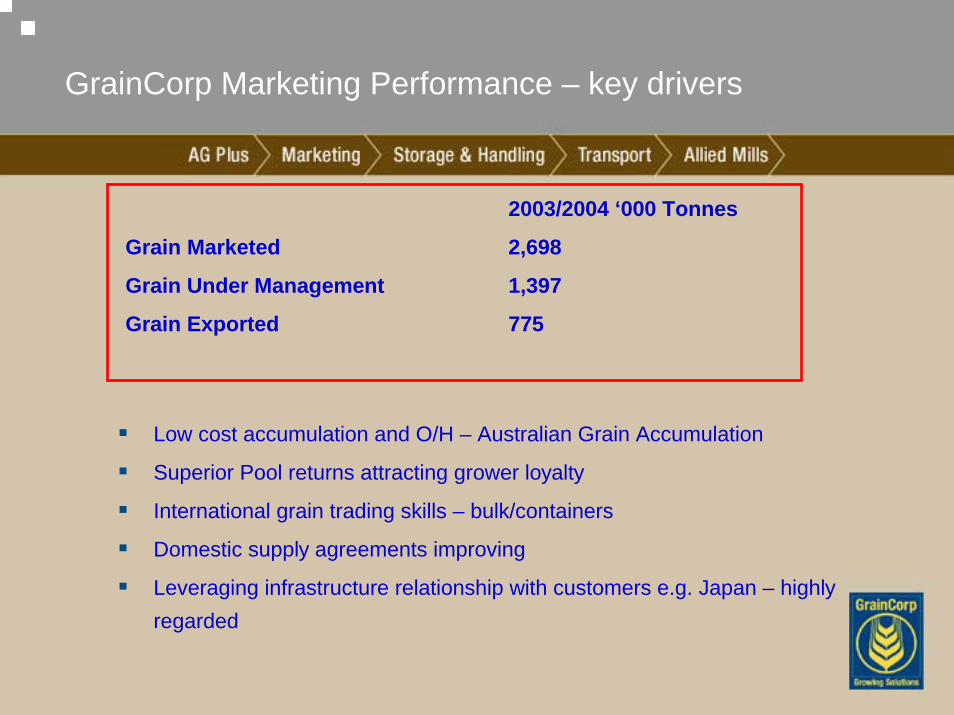
GrainCorp Marketing Performance – key drivers
Low cost accumulation and O/H – Australian Grain Accumulation
Superior Pool returns attracting grower loyalty
International grain trading skills – bulk/containers
Domestic supply agreements improving
Leveraging infrastructure relationship with customers e.g. Japan – highly regarded
2003/2004 ‘000 Tonnes
Grain Marketed 2,698
Grain Under Management 1,397
Grain Exported 775
GrainCorp Full Year Presentation
Business OperationsAG Plus
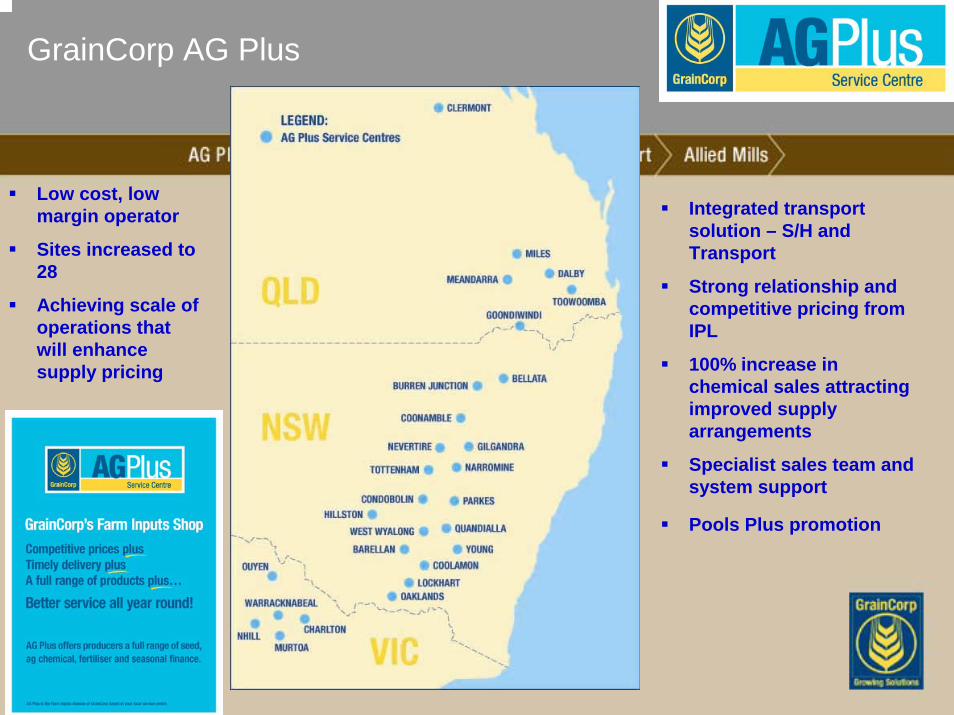
GrainCorp AG Plus
Low cost, low margin operator
Sites increased to 28
Achieving scale of operations that will enhance supply pricing
Integrated transport solution – S/H and Transport
Strong relationship and competitive pricing from IPL
100% increase in chemical sales attracting improved supply arrangements
Specialist sales team and system support
Pools Plus promotion
GrainCorp Full Year Presentation
Business OperationsTransport
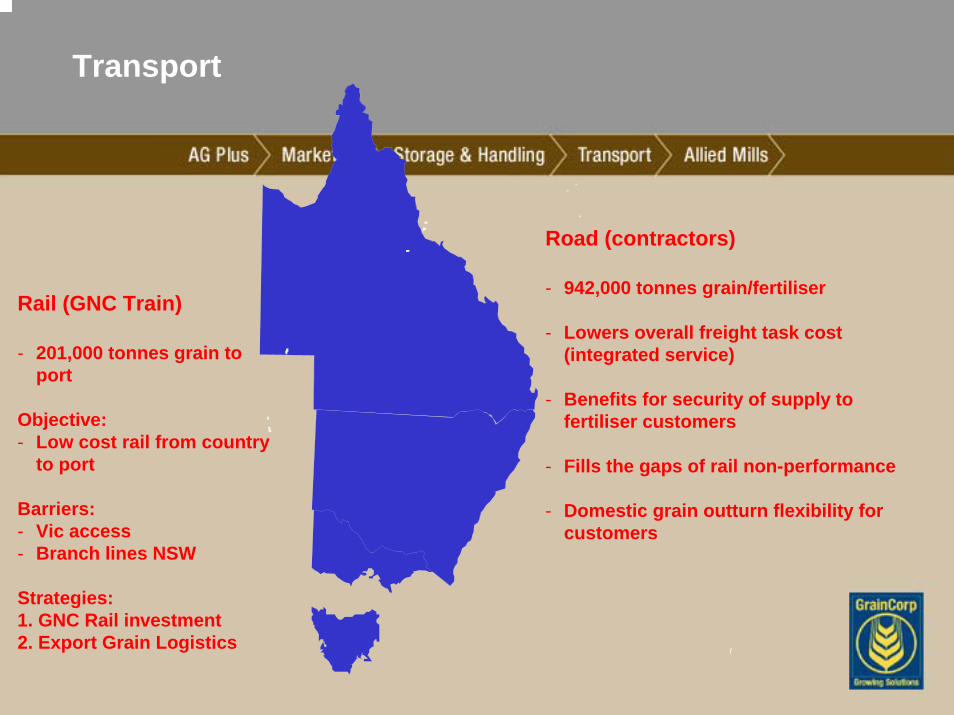
Transport
Road (contractors)
- 942,000 tonnes grain/fertiliser
- Lowers overall freight task cost (integrated service)
- Benefits for security of supply to fertiliser customers
- Fills the gaps of rail non-performance
- Domestic grain outturn flexibility for customers
Rail (GNC Train)
- 201,000 tonnes grain to port
Objective:- Low cost rail from country
to port
Barriers: - Vic access - Branch lines NSW
Strategies:1. GNC Rail investment 2. Export Grain Logistics
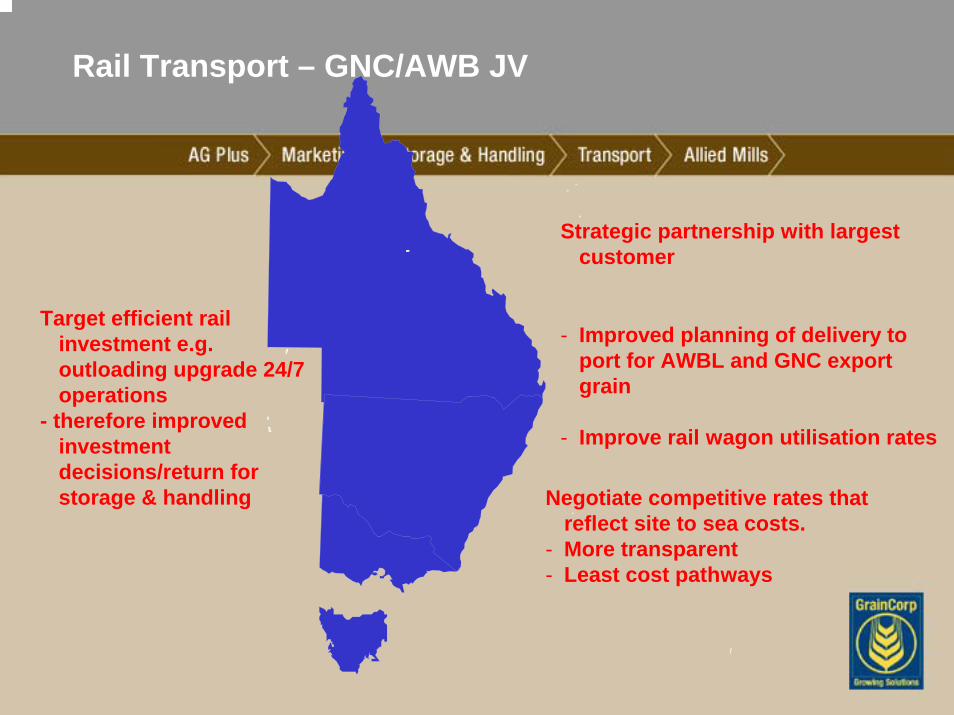
Rail Transport – GNC/AWB JV
Strategic partnership with largest customer
Target efficient rail investment e.g. outloading upgrade 24/7 operations
- therefore improved investment decisions/return for storage & handling
- Improved planning of delivery to port for AWBL and GNC export grain
- Improve rail wagon utilisation rates
Negotiate competitive rates that reflect site to sea costs.
- More transparent- Least cost pathways
GrainCorp Full Year Presentation
Business OperationsAllied Mills
ToowoombaTennysonDalby
Tamworth
Kingsgrove and Summer Hill
Albury
KensingtonBallarat
North Fremantle
BridgewaterMile End
Perth
Darwin
Brisbane
SydneyAdelaide
Melbourne
Hobart
State or Territory capital cityAllied Mills
production site
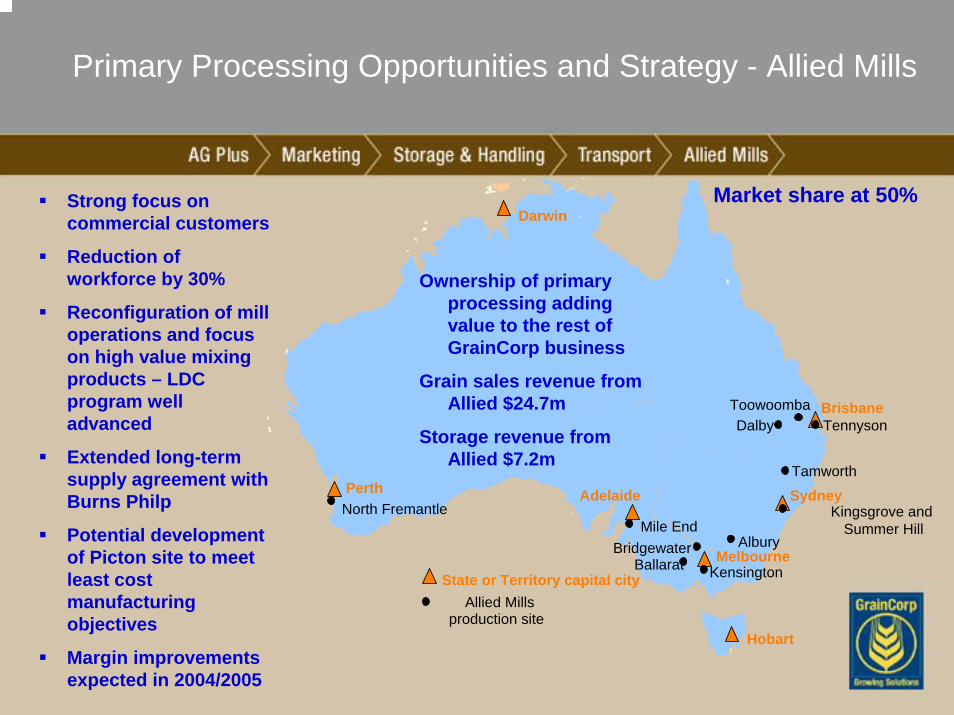
Primary Processing Opportunities and Strategy - Allied Mills
Strong focus on commercial customers
Reduction of workforce by 30%
Reconfiguration of mill operations and focus on high value mixing products – LDC program well advanced
Extended long-term supply agreement with Burns Philp
Potential development of Picton site to meet least cost manufacturing objectives
Margin improvements expected in 2004/2005
Market share at 50%
Ownership of primary processing adding value to the rest of GrainCorp business
Grain sales revenue from Allied $24.7m
Storage revenue from Allied $7.2m
FY02 FY03 FY04 FY02 FY03 FY04
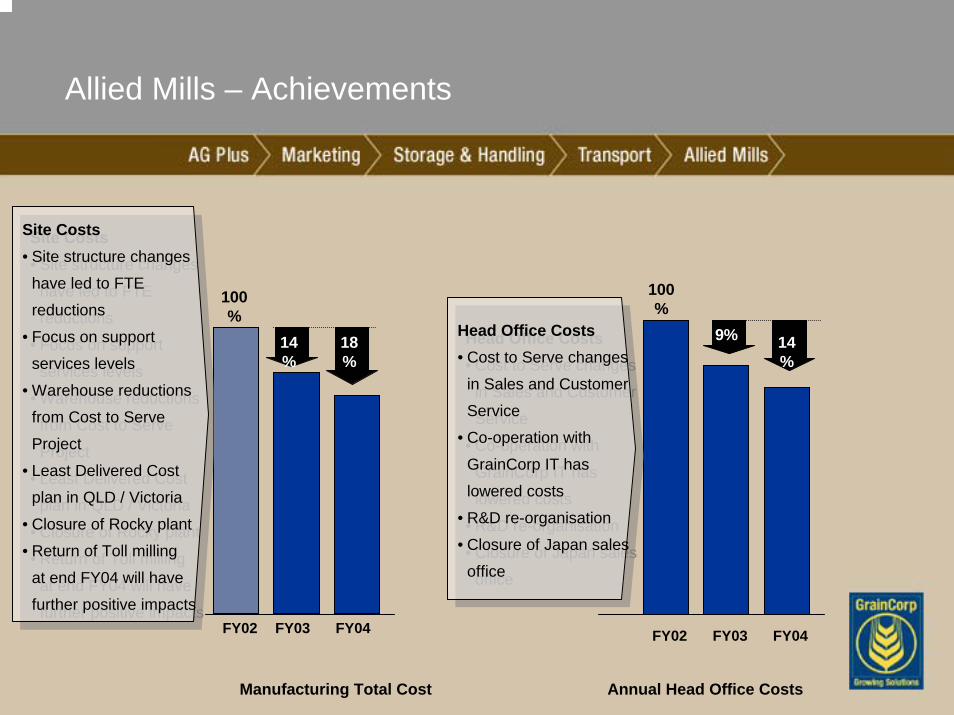
Site Costs• Site structure changes
have led to FTE
reductions
• Focus on support
services levels
• Warehouse reductions
from Cost to Serve
Project
• Least Delivered Cost
plan in QLD / Victoria
• Closure of Rocky plant
• Return of Toll milling
at end FY04 will have
further positive impacts
Site Costs• Site structure changes
have led to FTE
reductions
• Focus on support
services levels
• Warehouse reductions
from Cost to Serve
Project
• Least Delivered Cost
plan in QLD / Victoria
• Closure of Rocky plant
• Return of Toll milling
at end FY04 will have
further positive impacts
Head Office Costs• Cost to Serve changes
in Sales and Customer
Service
• Co-operation with
GrainCorp IT has
lowered costs
• R&D re-organisation
• Closure of Japan sales
office
Head Office Costs• Cost to Serve changes
in Sales and Customer
Service
• Co-operation with
GrainCorp IT has
lowered costs
• R&D re-organisation
• Closure of Japan sales
office
100%
18%
100%
14%
Allied Mills – Achievements
14%
9%
Manufacturing Total Cost Annual Head Office Costs
GrainCorp Full Year Presentation
OutlookGrainCorp Limited
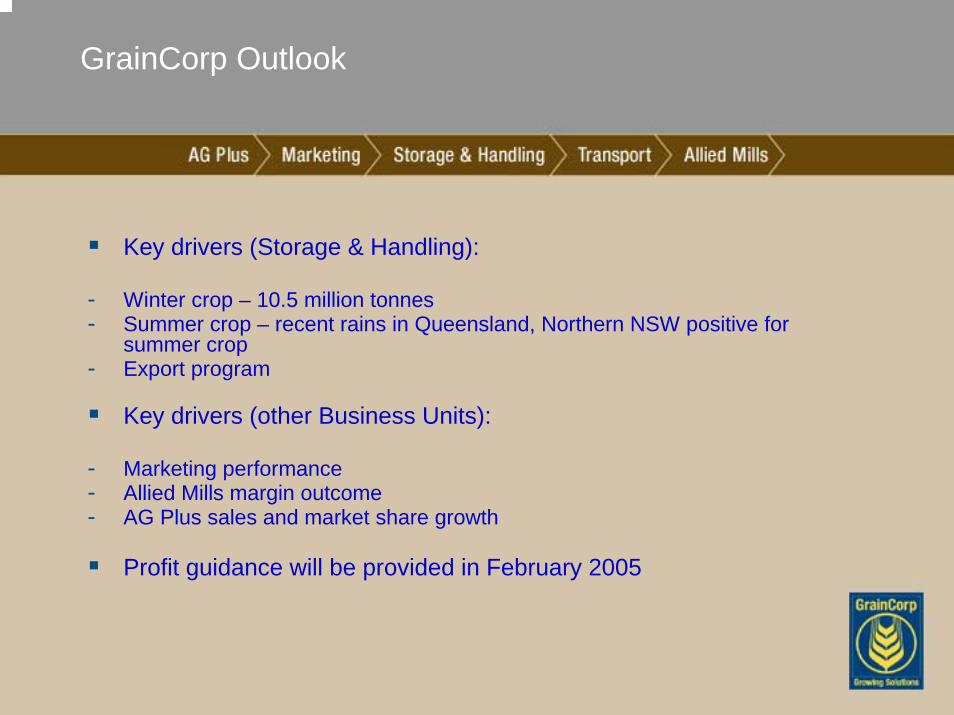
GrainCorp Outlook
Key drivers (Storage & Handling):
- Winter crop – 10.5 million tonnes- Summer crop – recent rains in Queensland, Northern NSW positive for
summer crop- Export program
Key drivers (other Business Units):
- Marketing performance- Allied Mills margin outcome- AG Plus sales and market share growth
Profit guidance will be provided in February 2005

Questions
Appendix
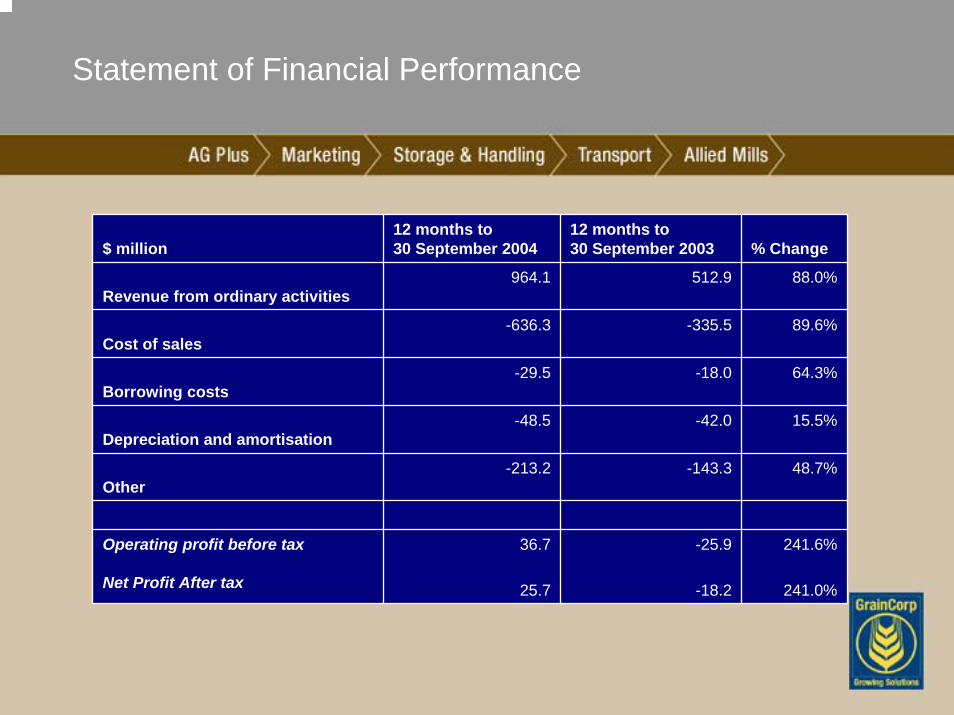
Statement of Financial Performance
$ million12 months to 30 September 2004
12 months to 30 September 2003 % Change
Revenue from ordinary activities964.1 512.9 88.0%
Cost of sales-636.3 -335.5 89.6%
Borrowing costs-29.5 -18.0 64.3%
Depreciation and amortisation-48.5 -42.0 15.5%
Other-213.2 -143.3 48.7%
Operating profit before tax
Net Profit After tax
36.7
25.7
-25.9
-18.2
241.6%
241.0%
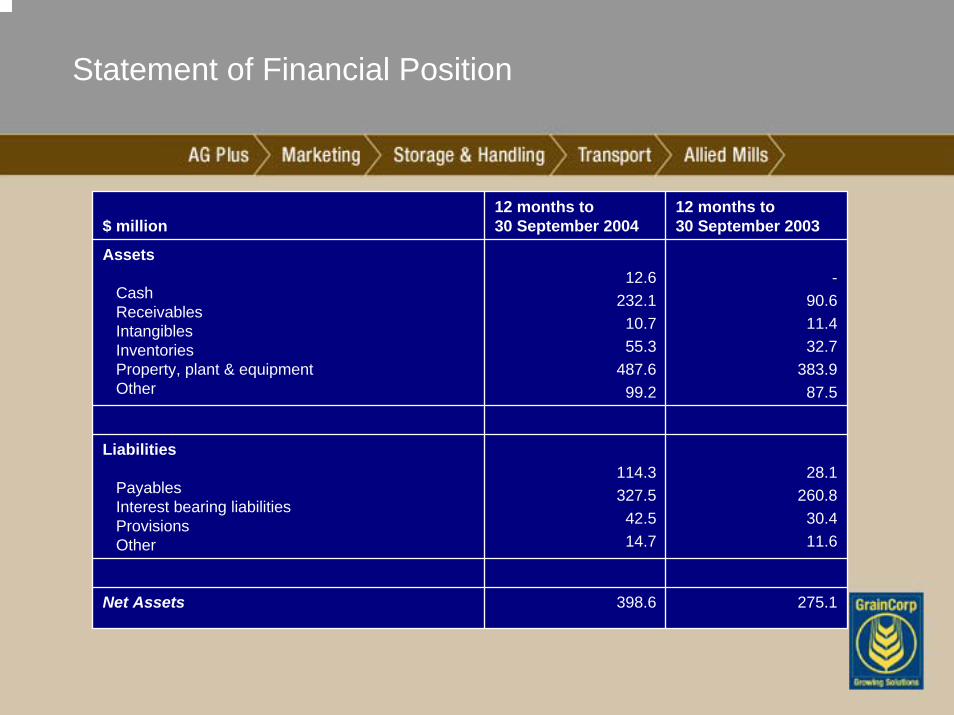
Statement of Financial Position
$ million12 months to 30 September 2004
12 months to 30 September 2003
Assets
CashReceivablesIntangiblesInventoriesProperty, plant & equipmentOther
12.6232.110.755.3
487.699.2
-90.611.432.7
383.987.5
Liabilities
PayablesInterest bearing liabilitiesProvisionsOther
114.3327.542.514.7
28.1260.830.411.6
Net Assets 398.6 275.1
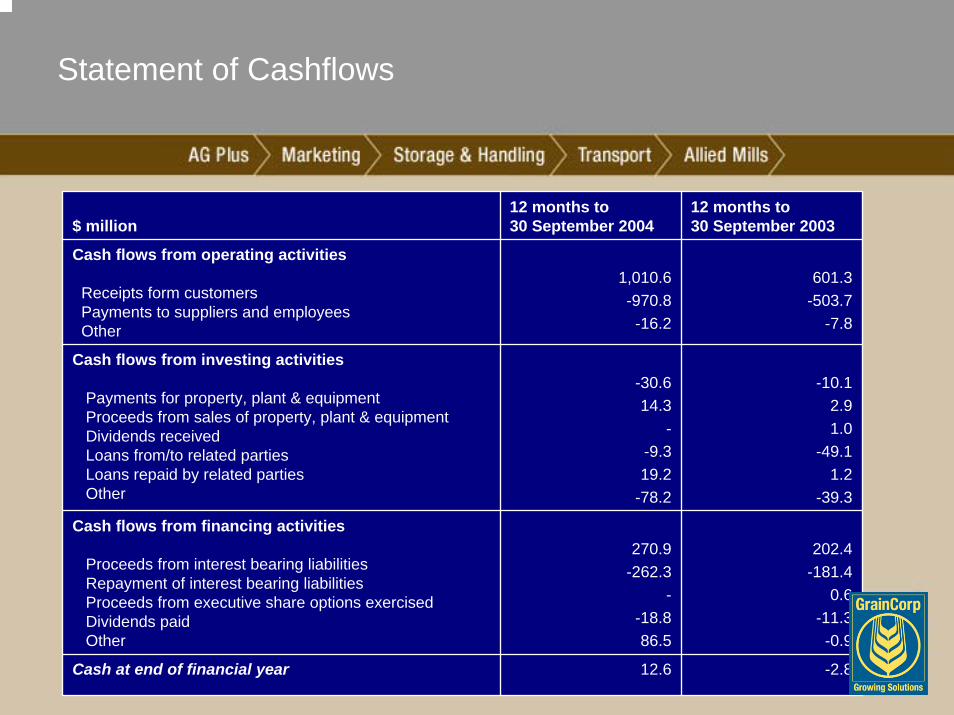
Statement of Cashflows
$ million12 months to 30 September 2004
12 months to 30 September 2003
Cash flows from operating activities
Receipts form customersPayments to suppliers and employeesOther
1,010.6-970.8-16.2
601.3-503.7
-7.8
Cash flows from investing activities
Payments for property, plant & equipmentProceeds from sales of property, plant & equipmentDividends receivedLoans from/to related partiesLoans repaid by related partiesOther
-30.614.3
--9.319.2
-78.2
-10.12.91.0
-49.11.2
-39.3
Cash flows from financing activities
Proceeds from interest bearing liabilitiesRepayment of interest bearing liabilitiesProceeds from executive share options exercisedDividends paidOther
270.9-262.3
--18.886.5
202.4-181.4
0.6-11.3-0.9
Cash at end of financial year 12.6 -2.8
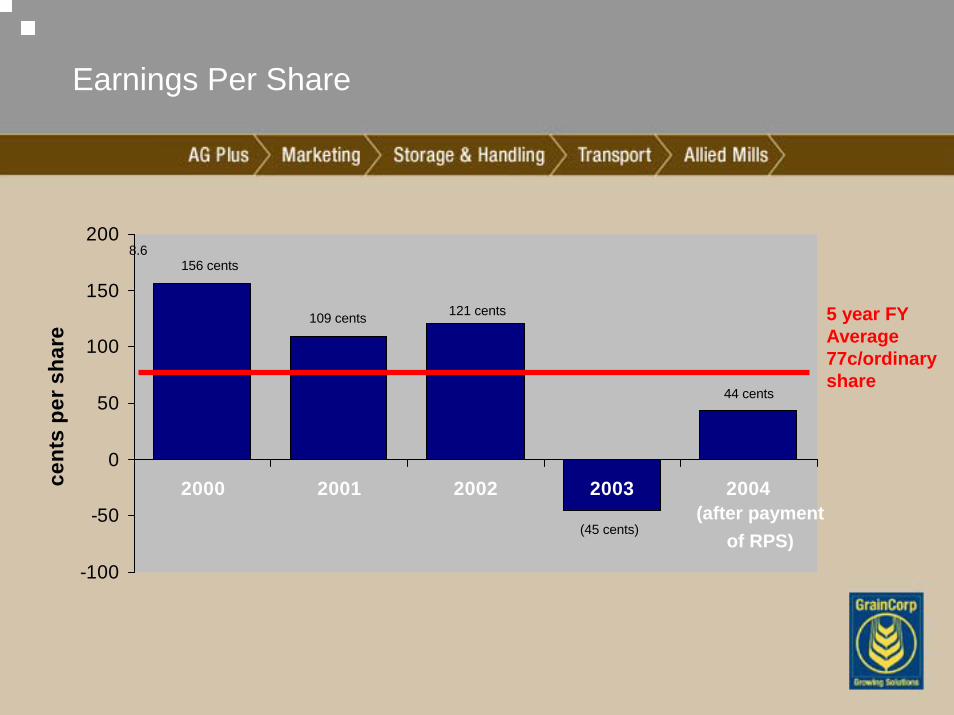
Earnings Per Share
-100
-50
0
50
100
150
200
2000 2001 2002 2003 2004cent
s pe
r sha
re
5 year FY Average 77c/ordinary share
(after payment of RPS)
156 cents
109 cents 121 cents
44 cents
8.6
(45 cents)
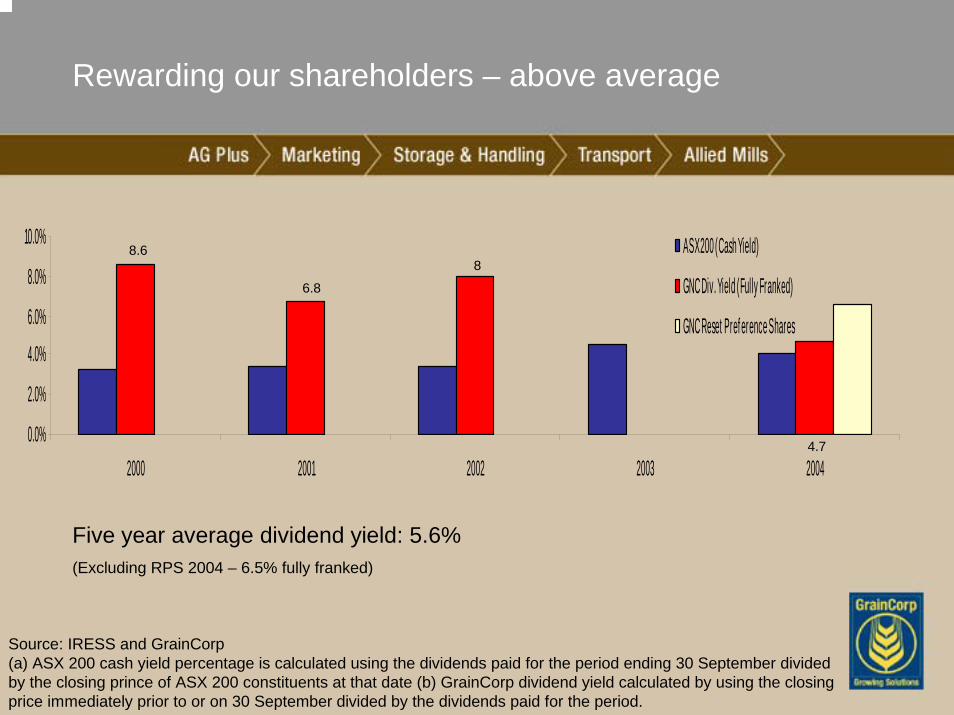
Rewarding our shareholders – above average
Source: IRESS and GrainCorp(a) ASX 200 cash yield percentage is calculated using the dividends paid for the period ending 30 September divided by the closing prince of ASX 200 constituents at that date (b) GrainCorp dividend yield calculated by using the closing price immediately prior to or on 30 September divided by the dividends paid for the period.
Five year average dividend yield: 5.6%(Excluding RPS 2004 – 6.5% fully franked)
0.0%
2.0%
4.0%
6.0%
8.0%
10.0%
2000 2001 2002 2003 2004
ASX 200 (Cash Yield)
GNC Div. Yield (Fully Franked)
GNC Reset Pref erence Shares
8.6
4.7
8
6.8