functional characterization of genes involved in lateral
TRANSCRIPT

Functional characterization of genes involved in lateral
root initiation in Arabidopsis thaliana and Zea mays
Ianto ROBERTS
Master’s dissertation submitted to obtain the degree of
Master of Biochemistry and Biotechnology
Major Plantbiotechnology
Academic year 2009-2010
Promoters: Prof. Dr. Tom Beeckman and Dr. Boris Parizot
Scientific supervisor: Leen Jansen
Department Plant Biotechnology and Genetics
VIB - Department Plant Systems Biology
Root Development Group

i
Confidentiality statement
Master thesis "Functional characterization of genes involved in lateral root initiation in
Arabidopsis thaliana and Zea mays" by Roberts Ianto, under the promotership of Prof. Dr. Tom
Beeckman.
This document and the information in it are provided in confidence, for the sole purpose of
evaluation of the MASTER thesis of Roberts Ianto, and may not be disclosed to any third party or
used for any other purpose without the explicit written permission of Prof. Dr. Tom Beeckman.

ii
ACKNOWLEDGEMENTS
First of all, I would like to thank my promoter Prof. Dr. Tom Beeckman for giving me the
opportunity to work in his research group and introducing me to the exciting research field of
root development. Also, thank you for investing time in trying to get a grant for my Phd.
Special thanks go to my scientific supervisor Leen Jansen, who did an excellent job in showing
how each technique used in this project is best handled and to which details I should pay special
attention. I have really learned a lot from you, thank you for that! Also, thank you for your
patience and the valuable discussions about several scientific subjects. And thank you for
critically reading my thesis and giving suggestions on how to improve it. I could not have wished
for a better supervisor.
I would also like to thank my co-promoter Dr. Boris Parizot for critically reading my thesis and
giving suggestions on how to improve it. Also, thank you for giving a short introduction to
EndNote, it really speeded up things.
I would like to thank Dr. Giel van Noorden for showing how interesting root development can be
during my Master project and thereby triggering my interest for this research field.
I would like to thank the entire Root Development Group for the enjoyable working environment
and the fact that everyone in the group is willing to help you without hesitating. This makes
coming to the lab a nice experience.
Then, I would also like to thank my family and girlfriend, Nikita, for supporting me the entire the
time. It is always a nice experience when you come home from the lab knowing that your diner is
ready.

iii
TABLE OF CONTENTS
Confidentiality statement ................................................................................................. i
Acknowledgements ........................................................................................................... ii
Table of contents .............................................................................................................. iii
List of abbreviations ........................................................................................................ vi
Nederlandse samenvatting ........................................................................................... viii
Abstract ............................................................................................................................. ix
PART I: INTRODUCTION ...................................................... 1
General introduction ........................................................................................................ 1
1. SECTION I: AUXIN ........................................................................................................ 2
1.1.The role of auxin in plant development ................................................................ 2
1.2.Auxin biosynthesis ................................................................................................... 2
1.3.Auxin transport ........................................................................................................ 2
1.3.1. Auxin influx ............................................................................................ 3
1.3.2. Auxin efflux ............................................................................................ 4
1.4.Auxin signaling ......................................................................................................... 5
1.4.1. ARFs ........................................................................................................ 5
1.4.2. Aux/IAAs ................................................................................................ 5
1.4.3. Auxin signaling ...................................................................................... 6
2. SECTION II: THE CELL CYCLE ............................................................................... 7
2.1.Basic events in the cell cycle ................................................................................... 7
2.2.Cell cycle regulators................................................................................................. 7
2.2.1. Cyclins ..................................................................................................... 7
2.2.2. Cyclin-dependent-kinases .................................................................... 8
2.2.3. The E2F transcription factors and RBR............................................ 9
2.3.Cell cycle progression ............................................................................................ 10
2.3.1. The G1/S transition ............................................................................. 10
2.3.2. The G2/M transition............................................................................ 10
2.4.Hormonal control of the cell cycle ....................................................................... 11
A
A

iv
3. SECTION III: ROOT DEVELOPMENT .................................................................. 12
3.1.Root morphology .................................................................................................... 12
3.2.Root anatomy .......................................................................................................... 13
3.2.1. Root histology ....................................................................................... 13
3.2.2. Comparative anatomy of the Arabidopis and maize root ............. 14
3.3.Embryonic root development ............................................................................... 15
3.4.Post-embryonic primary root growth ................................................................. 16
3.5.Lateral root development...................................................................................... 16
3.5.1. General aspects of lateral root development ................................... 16
3.5.2. Pericycle characteristics ..................................................................... 16
3.5.3. Lateral root initiation ......................................................................... 17
3.5.4. Auxin and lateral root development ................................................. 18
3.5.5. Lateral root development and the cell cycle .................................... 19
3.5.6. Other phytohormones ......................................................................... 20
3.5.7. Macronutrients .................................................................................... 20
3.6.Lateral root development in maize...................................................................... 21
1. PART II: AIM OF THE PROJECT ....................................... 23
1.1.Identification of conserved genes in LRI ............................................................ 23
1.2.The role of WRKY23 during root development................................................ 23
1.3.Further characterization of the maize LRIS ..................................................... 24
1. PART III: RESULTS ............................................................... 25
1.1.Characterization of the ZM and AT lines .......................................................... 25
1.2.Functional analysis of AtWRKY23 and ZM14 in Arabidopsis ...................... 31
1.2.1. Effect of ZM14 overexpression on the primary root ..................... 31
1.2.2. Functional analysis of AtWRKY23 in Arabidopsis ....................... 35
1.3.Characterization of the maize LRIS ................................................................... 38
1.3.1. qRT-PCR analysis of cell cycle genes in the maize LRIS.............. 38
1.3.2. Characterization of the maize LRIS using flow cytometry .......... 43
1.3.3. Characterization of the pericycle after long NPA treatment ....... 45
1.3.4. Transgenic maize lines ........................................................................ 48
A
A
A
A

v
1. PART IV: DISCUSSION ......................................................... 50
1.1.Functional Characterization of the ZM and AT lines ...................................... 50
1.2.Functional Characterization of WRKY23 and ZM14...................................... 51
1.3.Characterization of the maize LRIS ................................................................... 53
1.3.1. qRT-PCR analysis of cell cycle genes in the maize LRIS.............. 53
1.3.2. Characterization of the maize LRIS using flow cytometry .......... 55
1.3.3. Analysis of the pericycle after long NPA treatment ....................... 56
1. PART V: MATERIALS AND METHODS ........................... 57
1. PART VI: REFERENCES....................................................... 62
1. PART VII: ADDENDUM ........................................................ 73
1.1.Workflow ZM and AT lines ................................................................................. 73
1.2.Protocols WRKY project ...................................................................................... 89
1.3.Protocols maize project ......................................................................................... 95
A
A

vi
LIST OF ABBREVIATIONS
ABA: Abscisic acid
ACR4: ARABIDOPSIS CRINKLY4
AFB: AUXIN-RELATED F-BOX
ARE or AuxRE : Auxin-responsive element
ARF: Auxin response factor
ARF-GEF: ADP Ribosylation Factor-GTP/GDP Exchange Factor
AUX1: AUXIN RESISTANT 1
BDL: BODENLOS
BR: Brassinosteroid
CAK: Cyclin activating kinase
CaMV: Cauliflower Mozaic Virus
CFP: Cyan fluorescent protein
CDK: Cyclin-dependent-kinase
CK: Cytokinin
CKI: CDK inhibitor protein
CKL: CDK-like
CKS: CDK subunit
CWR: Cell wall remodeling
DAG: Days after germination
D-box: Destruction box
DEL: DP-E2F-Like
DP: Dimerization partner
E2F: Adenovirus E2 promoter-binding factor
EAR: ERF-associated amphiphilic repressor
FACS: Fluorescence-activated cell sorting
HU: Hydroxyurea
IAA: Indole-3-acetic acid
KRP: Kip-Related Proteins
LAX1-3: LIKE AUX1 1-3 (LAX1-3)
vii
LBD: LATERAL ORGAN BOUNDARIES DOMAINA
LCM: Laser capture microdissection
LR: Lateral root
LRD: Lateral root development
LRI: Lateral root initiation
LRIS: Lateral root inducible system
LRP: Lateral root primordium
LRT1: LATERAL ROOTLESS1
MDR: MULTIDRUG RESISTANCE
MP: MONOPTEROS
MR: Middle region
NAA: Naphthalene-1-acetic acid
NPA: N-1-naphthylphthalamic acetic acid
PAP1: PRODUCTION OF ANTHOCYANIN PIGMENT1
PGP: P-GLYCOPROTEINS
PID: PINOID
PIN: PIN FORMED
PKL: PICKLE
PPA2: Protein phosphatase 2A
QC: Quiescent centre
RAM: Root apical meristem
RBR: RETINOBLASTOMA RELATED
RSA: Root system architecture
RTCS: ROOTLESS CONCERNING CROWN AND SEMINAL ROOT
RUM1: ROOTLESS WITH UNDETECTABLE MERISTEMS1
SAM: Shoot apical meristem
SLR1: SOLITARY ROOT1
SCFTIR1/AFB
: ARABIDOPSIS SKP1-LIKE1 (ASK1), CULLIN HOMOLOGUE1 (CUL1), RING-
BOX PROTEIN1 (RBX1) and F-box protein TIR1 or AFB1-5.
TIR1: TRANSPORT INHIBITOR RESPONSE1
TPL: TOPLESS

viii
Nederlandse samenvatting
Met de toenemende wereld bevolking en de afname in beschikbare landbouwgrond, zal de
opbrengst van gewassen zoals maïs moeten stijgen. Het wortel systeem van de plant is een
interessant doelwit voor verbetering, aangezien de wortels een belangrijke rol spelen in
verankering in de grond en opname van water and mineralen uit de bodem. Het zijwortel systeem
is het meest interessant doelwit, aangezien dit het meest bijdraagt tot het contact oppervlak tussen
het wortel systeem en de omgeving. Om de capaciteit van zijwortel vorming aan te passen,
moeten eerst de moleculaire regulatoren van zijwortel ontwikkeling geïdentificeerd worden. In
het labo werd reeds een ZijWortel Induceerbaar Systeem (ZWIS) ontwikkelt voor het
identificeren van kandidaat regulatoren van zijwortel ontwikkeling in maïs. Dit induceerbaar
system werd in combinatie met transcriptionele analyse gebruikt om enkele kandidaat regulatoren
van zijwortel initiatie in maïs te bepalen. Aangezien maïs geen makkelijk systeem is om in te
werken, werd de modelplant Arabidopsis thaliana (Zandraket) gebruikt voor het functioneel
karakteriseren van de maïs genen en ook voor het bepalen of er geconserveerde mechanismen in
zijwortel initiatie bestaan tussen beide planten. Voor deze karakterisering werden de maïs genes
tot overexpressie gebracht in Arabidopsis met behulp van de 35S promoter, gevolgd door
fenotypering van het wortel systeem. In een parallelle aanpak, werden Arabidopsis orthologen
van enkele kandidaat regulatoren in maïs specifiek tot expressie gebracht in the xyleem-pool
geassocieerde pericyclus cellen, waaruit zijwortel ontstaan, gebruik makend van de UAS
promoter en de J0121 line. Beide aanpakken toonden aan dat meerdere kandidaat regulatoren
inderdaad echte regulatoren kunnen zijn van zijwortel initiatie. Een maïs gen dat werd
opgereguleerd in het maïs ZWIS was een mogelijk ortholoog van AtWRKY23 dat op zich reeds
eerder werd geïdentificeerd als kandidaat regulator van zijwortel initiatie in een gelijkaardig
ZWIS in Arabidopsis. Beide genen werden verder onderzocht en een mogelijk geconserveerd
mechanisme van auxine transport regulatie werd gevonden. Het maïs ZWIS werd ook verder
gekarakteriseerd om te bepalen in welke fase van de cel cyclus de xyleem-pool geassocieerde
pericyclus cellen zitten voor de inductie van zijwortelontwikkeling. Uit meerdere experiment
bleek dat deze cellen in de G2-fase van de cel cyclus zitten.
ix
Abstract
With the increasing world population and less arable land available for agriculture, crops such as
maize will need to increase in yield. The root system might be an interesting target for
engineering, considering the important functions of the roots, such as anchorage in the soil and
ensuring the acquirement of water and nutrients from the soil. The lateral root network is the best
target for engineering, considering this is contributes the most to increasing the contact surface
between the soil and the plant. In order to engineer lateral root formation, the molecular players
that regulate lateral root development need to be identified. To identify candidate regulators of
lateral root development in maize, a Lateral Root Inducible System (LRIS) was developed in the
lab. This inducible system in combination with transcriptomic analysis identified several
candidate regulators for lateral root initiation in maize. Considering maize is not an easy system
to work, the model plant Arabidopsis thaliana was used for functionally analyzing the maize
genes and also determining whether there are conserved mechanisms of lateral root initiation
between both species. For this, the maize genes were overexpressed in Arabidopsis using the 35S
promoter after which the root system was phenotypically characterized. In a parallel approach,
the Arabidopsis orthologs of several maize candidate regulators were specifically expressed in
the xylem-pole pericycle cells of Arabidopsis, the cells from which the lateral roots develop,
using the UAS promoter and introducing them into the J0121 line. These approaches revealed that
several candidate regulators were truly involved in the lateral root initiation process. One gene
that was upregulated in maize during the LRIS was a possible maize ortholog of AtWRKY23,
which was identified as a candidate regulator of LRI in a similar LRIS in Arabidopsis. These two
genes were functionally characterized in more detail and a possible conserved mechanism of
auxin transport regulation was found. The maize LRIS was also further characterized to
determine in which cell cycle phase the xylem-pole associated pericycle cells are residing prior to
the induction of lateral root development. It was found that these cells are in the G2-phase of the
cell cycle.

1
PART I: INTRODUCTION
General introduction
About 460-700 million years ago, plants started colonizing land (Heckman et al, 2001). A
major challenge for this was to free themselves from an aquatic environment, in which water
and nutrient uptake posed little problem, and make the transition to a relatively dry terrestrial
environment. To overcome this challenge, plants evolved roots. The major functions of roots
are a firm anchorage and the acquisition of nutrients and water from the soil. In order to
efficiently fulfill these functions, plants rely on the plasticity of the root system architecture
(RSA) to respond to their dynamic environment. The RSA can be modulated through
promotion or inhibition of primary root growth, through growth of lateral roots (LRs) and
through an increase in root hairs. Other functions of plant roots include interactions with both
beneficial and pathogenic organisms, gravity perception, photoassimilate storage (e.g. starch),
water storage, phytohormone synthesis (e.g. cytokinins) and clonal propagation.
With the exponentially growing world population and less arable land available for
agriculture, scientists are left with the task of increasing crop productivity to efficiently feed
this increasing number of mouths. Zea mays (maize) constitutes a major source of starch for
humans and livestock in many regions of the world. Future challenges that need to be
overcome to secure this crop are the effects of climate change (e.g. drought stress) and higher
costs for energy, fertilizers and water. Considering the functions of the root system,
engineering the RSA might allow designing crops with higher yield under dryer and nutrient-
poor conditions and thereby partly meet these challenges. Designing a more efficient RSA can
be achieved by marker-assisted breeding or by genetically engineering the crops in a more
targeted manner. Therefore however, we first need to identify the molecular regulators of root
formation. This is where the model plant Arabidopsis thaliana (Arabidopsis) comes into play.
Arabidopsis was chosen as model for dicotyledonous plants because it is small and has a short
generation time (6 - 9 weeks). Its development is largely documented and it has a relatively
simple morphology and anatomy. It is a self fertilizer that is easy to transform by floral
dipping with Agrobacterium tumefaciens and it produces a large number of seeds per plant. It
allows easy mutagenesis and has a small genome (~130 Mb), which is fully sequenced (The
Arabidopsis Genome Initiative, 2000).
During the last decade, Arabidopsis has been proven to be an efficient model plant to study
root development and this knowledge now needs to be extrapolated to important crop species
such as maize. The recent development of a maize transformation system and the availability
of the fully sequenced genome will pave the way for this extrapolation in the future (Schnable
et al, 2009; Sidorov & Duncan, 2009; Vega et al, 2008).
Since the efficiency of the RSA is largely determined by its LR network, it is crucial to
understand the molecular events during lateral root development (LRD). The phytohormones
auxin is a key player during LRD and will be handled in the first section of this introduction.
Regulation of the cell cycle also plays a dominant role in LRD and will be mainly discussed
in the second section. In the third section, the root system of Arabidopsis and maize will be
addressed in more detail. Also root development will be discussed through illustration of the
importance of auxin and cell cycle regulation during LRD.

2
SECTION I: AUXIN
1.1. The role of auxin in plant development
Auxin is a phytohormone that is involved in virtually every aspect of plant growth and
development. It mediates embryo development, organ initiation and positioning, vascular
tissue differentiation, growth responses to light and gravity, apical hook formation and shoot
and root elongation. Auxin also plays a very important role in root development (see Root
Development section).
1.2. Auxin biosynthesis
The auxin building block is an indole group. Two auxin biosynthesis pathways exist in plants:
one is dependent on the precursor tryptophan (Trp) and the other is Trp-independent (Ljung et
al, 2002). The main site of auxin biosynthesis is in young leaves, and auxin is transported
from this site to the rest of the plant (Ljung et al, 2001). However, auxin biosynthesis also
occurs in the root tips (Ljung et al, 2005); (Petersson et al, 2009).
Naturally occurring auxins include indole-
3-acetic acid (IAA), indole-3-butyric acid
(IBA), phenylacetic acid (PAA) and 4-
cholo-indoleacetic acid (4-Cl-IAA). The
major naturally occurring auxin is IAA.
Synthetic auxin analogs include amongst
others naphthalene-1-acetic acid (1-NAA),
2,4-dichlorophenoxyacetic acid (2,4-D), 2-
methoxy-3,6-dichlorobenzoic acid
(Dicamba) and 4-amino-3,5,6-
trichloropicolinic acid (picloram) (De
Rybel et al, 2009) (Figure 1).
Figure 1: Chemical structure of naturally
occurring auxins (IAA, IBA) and synthetic
auxins (1-NAA, 2,4-D) (adapted from De Rybel et
al., 2009).
Only 1 % of the synthesized IAA is present in the free, active form, whereas the remaining
part is conjugated to amino acids and sugars (Pollmann et al, 2002). The regulation of auxin
homeostasis depends partly on the hydrolysis of auxin conjugates (Bartel, 1997; Normanly &
Bartel, 1999; Ostin et al, 1998).
1.3. Auxin transport
In plants two major pathways for IAA transport are used. A first pathway is rapid, long-
distance nonpolar source-to-sink transport via the mature phloem, in which the distribution
occurs from young shoot tissues towards the root tip (Marchant et al, 2002). The second
pathway is a slow, short-distance polar cell-to-cell transport via influx and efflux carrier
proteins (Bennett et al, 1996; Galweiler et al, 1998; Luschnig et al, 1998) (Figure 2).
3
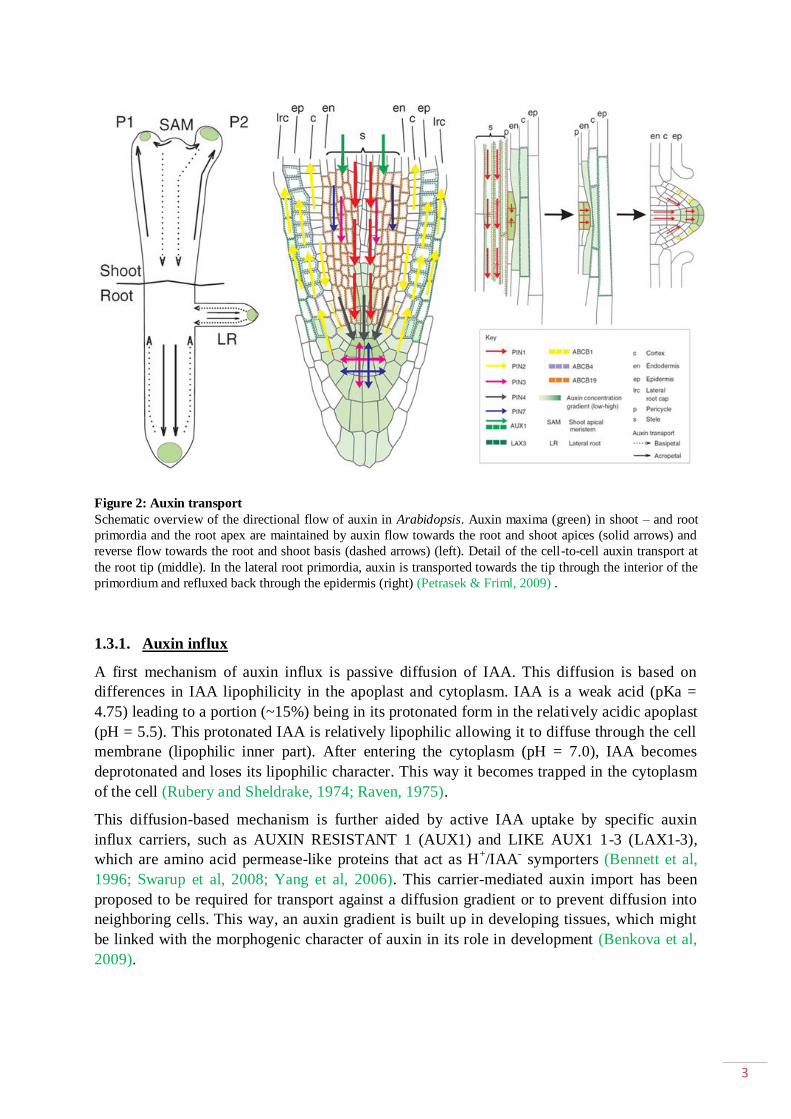
Figure 2: Auxin transport
Schematic overview of the directional flow of auxin in Arabidopsis. Auxin maxima (green) in shoot – and root
primordia and the root apex are maintained by auxin flow towards the root and shoot apices (solid arrows) and
reverse flow towards the root and shoot basis (dashed arrows) (left). Detail of the cell-to-cell auxin transport at
the root tip (middle). In the lateral root primordia, auxin is transported towards the tip through the interior of the
primordium and refluxed back through the epidermis (right) (Petrasek & Friml, 2009) .
1.3.1. Auxin influx
A first mechanism of auxin influx is passive diffusion of IAA. This diffusion is based on
differences in IAA lipophilicity in the apoplast and cytoplasm. IAA is a weak acid (pKa =
4.75) leading to a portion (~15%) being in its protonated form in the relatively acidic apoplast
(pH = 5.5). This protonated IAA is relatively lipophilic allowing it to diffuse through the cell
membrane (lipophilic inner part). After entering the cytoplasm (pH = 7.0), IAA becomes
deprotonated and loses its lipophilic character. This way it becomes trapped in the cytoplasm
of the cell (Rubery and Sheldrake, 1974; Raven, 1975).
This diffusion-based mechanism is further aided by active IAA uptake by specific auxin
influx carriers, such as AUXIN RESISTANT 1 (AUX1) and LIKE AUX1 1-3 (LAX1-3),
which are amino acid permease-like proteins that act as H+/IAA
- symporters (Bennett et al,
1996; Swarup et al, 2008; Yang et al, 2006). This carrier-mediated auxin import has been
proposed to be required for transport against a diffusion gradient or to prevent diffusion into
neighboring cells. This way, an auxin gradient is built up in developing tissues, which might
be linked with the morphogenic character of auxin in its role in development (Benkova et al,
2009).

4
1.3.2. Auxin efflux
To exit the cell, auxin is actively transported through the plasma membrane by specific auxin
efflux carriers, such as members of the MULTIDRUG RESISTANCE (MDR)-P-
GLYCOPROTEINS of the ABCB transporter family (PGP) and the PIN FORMED (PIN)
protein family ((Blakeslee et al, 2007; Cho et al, 2007; Geisler et al, 2005; Mravec et al, 2008;
Murphy et al, 2002). The PGP protein family in Arabidopsis comprises MDR1, PGP1, PGP2,
PGP4 and PGP19 (Murphy et al, 2002; Noh et al, 2003; Noh et al, 2001).These PGP proteins
typically have a nonpolar subcellular localization. The PIN protein family consists of eight
members in Arabidopsis (Paponov et al, 2005). PIN proteins are thought to be part of a
multicomponent complex ((Vieten et al, 2007; Wisniewska et al, 2006). The PIN and PGP
proteins colocalize and interact with each other, leading to a hypothesis that the PIN proteins
act to guide the action of several PGP transporters (Blakeslee et al, 2007).
PIN proteins can have a polar localization to the apical or basal membrane of the cell, thereby
regulating the direction of auxin transport. Subcellular localization of PINs is very dynamic as
they continuously cycle between the plasma membrane and endosomes by means of
endocytosis and exocytosis events. Internalization of the PIN auxin efflux carries is mediated
by clathrin-dependent endocytosis, while the ARF-GEF* GNOM-dependent exocytosis leads
to recycling of the PINs back to the plasma membrane (*footnote ARF-GEF: ADP
Ribosylation Factor-GTP/GDP Exchange Factor) ((Dhonukshe et al, 2007; Geldner et al,
2001). This constitutive cycling enables rapid and dynamic polar resorting of PINs after each
internalization step. Regulation of the subcellular polarity of PIN proteins occurs through the
antagonistically phosphorylation - and dephosphorylation events by the protein
serine/threonine kinase PINOID (PID) and the protein phosphatase 2A (PPA2), respectively.
PID–dependent phosphorylation of PINs leads to preferentially apical PIN localization, while
PP2A-dependent dephosphorylation leads to preferentially basal PIN targeting (Benjamins et
al, 2001; Christensen et al, 2000; Michniewicz et al, 2007) (Figure 3).
Figure 3: Schematic overview of auxin transport at the cellular level.

5
1.4. Auxin signaling and its key molecular players
1.4.1. ARFs
The auxin response factors (ARFs) are plant-specific B3-type transcription factors that
mediate auxin-dependent transcriptional regulation. The Arabidopsis genome encodes 23
ARFs (Ulmasov et al, 1999). They have an N-terminal DNA binding domain, which
specifically binds to the auxin-responsive element (ARE or AuxRE), a consensus sequence
found in promoters of auxin-inducible genes (Ulmasov et al, 1997). ARFs with a glutamine
(Q)-rich middle region (MR) are thought to act as transcriptional activators (e.g. ARF5, 7, 8
and 19), whereas ARFs without a Q-rich MR are thought to act as transcriptional repressors
(e.g. ARF1 and 2) (Tiwari et al, 2003). The C-terminal part contains the conserved domains
III and IV, which serve as a platform for homo- and hetero-dimerization with other ARFs or
Aux/IAAs (Guilfoyle & Hagen, 2007; Kim et al, 1997) (Figure 4).
1.4.2. Aux/IAAs
The Aux/IAA transcription factors are believed to act as transcriptional repressors by hetero-
dimerizing with the ARF transcriptional activators and thereby preventing these ARFs from
activating transcription of downstream target-genes (Abel et al, 1994). The Arabidopsis
genome encodes 29 different Aux/IAAs (Abel & Theologis, 1996). The proteins have four
highly conserved domains. Domain I contains an EAR-motif (ERF-associated amphiphilic
repressor) that is essential for its role in transcriptional repression. It is required for the
recruitment of the transcriptional co-repressor TOPLESS (TPL) (Szemenyei et al, 2008;
Tiwari et al, 2004). Domain II represents the target sequence for ubiquitination and is
essential for auxin-stimulated Aux/IAA proteolysis (Gray et al, 2001). Domain III and IV are
involved in homo- and heterodimerization with other Aux/IAAs and ARFs (Kim et al, 1997)
(Figure 4). In general it is believed that specific pairs of Aux/IAA and ARF proteins are
formed in different tissues and at different times and places in development, thus allowing a
wide variety of auxin effects.
Figure 4: Domain properties of ARF and Aux/IAA proteins.
The ARF proteins contain an N-terminal DNA binding domain (DBD), a middle region (MR) that determines
whether the ARF is a transcriptional activator or repressor, and at the C-terminus domain III and IV that are
involved in homo- and heterodimerization with other ARFs or Aux/IAAs.
The Aux/IAA proteins contain an N-terminal domain I that recruits the co-repressor TOPLESS (TPL), domain II
which is the target site for ubiquitination, and domain III and IV that are involved in homo- and
heterodimerization with other Aux/IAAs or ARFs.

6
1.4.3. Auxin signaling
In general, transcriptional regulation by IAA is largely dependent on targeted proteasomal
degradation of the Aux/IAA transcriptional regulators, leading to subsequent release of the
ARF transcription factors from inhibition.
When IAA enters the nucleus, it binds the leucine-rich repeat domain of its receptor TIR1
(TRANSPORT INHIBITOR RESPONSE1) or a member of the closely related AFB proteins
(AUXIN-RELATED F-BOX PROTEINS 1-5) (Dharmasiri et al, 2005b; Kepinski & Leyser,
2005; Tan et al, 2007). TIR1 and AFB1-5 are F-box proteins that are part of the SCFTIR1/AFB
E3 ubiquitin ligase complex, which consists of ARABIDOPSIS SKP1-LIKE1 (ASK1),
CULLIN HOMOLOGUE1 (CUL1), RING-BOX PROTEIN1 (RBX1) and the F-box protein
TIR1 or AFB1-5. This complex ubiquitinates target proteins that are subsequently targeted for
proteasomal degradation. The RBX1-CUL1 dimer catalyzes the transfer of activated ubiquitin
to the target protein while the target specificity is conferred by the F-box proteins ((Ruegger
et al, 1998). It is believed that IAA functions as a molecular glue between the TIR1/AFB1-5
subunit of SCFTIR1-AFB
and the conserved domain II of the Aux/IAA transcriptional regulators,
thereby increasing the affinity of the ubiquitin ligase for their Aux/IAA substrate proteins and
promoting their proteolysis (Dharmasiri et al, 2005a; Kepinski & Leyser, 2005) (Figure 5).
Auxin – induced gene expression is a self – regulatory mechanism. The auxin-dependent
degradation of Aux/IAA proteins releases ARF proteins to promote transcription of primary
auxin response genes, which include the Aux/IAA genes themselves, indicating a
transcriptional loop ((Dharmasiri & Estelle, 2002; Gray et al, 2001). Expression of auxin
transport components, such as PINs, are also under the control of ARF proteins, indicating
that auxin regulates its own transport (Vieten et al, 2005).
Figure 5: Cellular auxin signaling
At low auxin concentrations, Aux/IAA
transcriptional repressors dimerize through their
domains III and IV with ARF transcriptional
activators. Through their binding to ARFs,
Aux/IAAs recruit the transcriptional corepressor
TOPLESS (TPL) and thereby render the nearby
ARFs transcriptionally inactive. At higher auxin
concentrations, auxin serves as molecular glue
between domain II of Aux/IAAs and TIR1/AFB
F-box proteins. This stimulates Aux/IAA
ubiquitination by SCFTIR1/AFB
E3 ligase and
subsequent targeting for proteolysis mediated by
the 26S proteasome. Degradation of Aux/IAAs
derepresses the ARF activity on transcription.
(Vanneste & Friml, 2009).

7
SECTION II: THE CELL CYCLE
2.1. Basic events in the cell cycle
The cell cycle has a typical succession of phases: G1, S, G2 (together known as interphase),
and M. The G1-phase represents a gap between mitosis and DNA replication. At the G1/S
transition, there is a first cell cycle checkpoint that ensures the environment is beneficial for
cell division and the cell is ready to divide. The S-phase or DNA synthesis phase corresponds
to the duplication of the genetic material. There is a second checkpoint at the S/G2 transition
that ensures that the entire genome is duplicated properly. The G2-phase represents the gap
between DNA replication and mitosis and is characterized by cell growth and an increase in
cell organelle content. In the M-phase, chromosome segregation occurs during the mitosis
step, followed by a cytokinesis step. Mitosis contains four subphases: prophase, metaphase,
anaphase and telophase. The third checkpoint, before the metaphase, ensures that the
chromosomes are properly attached to the kinetochores ensuring a normal chromosome
separation. The cytokinesis step corresponds to the cytoplasmic division event after mitosis,
generating two daughter cells. Finally, cells that have temporarily or reversibly stopped
dividing are said to have entered a state of quiescence called G0 phase (Figure 6).
In response to physiological and developmental signals, proliferating cells can switch from
the mitotic cell cycle to the endoreduplication cycle. In this alternative cycle successive
rounds of full genome replication occur in the absence of an intervening mitosis step, which
leads to an exponential increase in genome ploidy level (from 2C to 4C, 8C, 16C etc.). Some
genes that play a role in mitotic cell cycle progression are also involved in endoreduplication
(Caro et al, 2008; de Jager et al, 2005; Gutierrez, 2005) (Figure 6).
A B
Figure 6: The mitotic cell cycle and the endoreduplication cycle
(A) The mitotic cell cycle: interphase (I) (G1 + S + G2) and mitosis (M) (profase (P) + metaphase (M) +
anaphase (A) + telophase (T) + cytokinesis (C). (B) The endoreduplication cycle: gap-phase (G) and S-phase (S).
2.2. Cell Cycle Regulators
There are several regulators that ensure progression through the cell cycle in a controlled
manner and a well defined irreversible order. These regulators will be briefly discussed in the
following sections.
2.2.1. Cyclins
Cyclins constitute the regulatory subunit of cyclin-dependent-kinases (CDKs). They contain a
cyclin-box that is involved in CDK binding and a region called the hydrophobic patch or
MRAIL motif, which binds with moderate affinity to substrate proteins that contain a
complementary hydrophobic sequence, known as the RLX motif (Figure 7).
8
Arabidopsis contains a large collection of cyclin genes, of which 32 appear to have a role in
the cell cycle ((Vandepoele et al, 2002; Wang et al, 2004). These cyclins belong to different
types: A (10 cyclins), B (11), D (10) and H (1). In general, the A-type cyclins are involved in
S/M transition, the B-type cyclins in both G2/M transition and intra-M-phase control, the D-
type cyclins in the G1/S transition and the H-type cyclin in both the G1/S transition and G2/M
transition (De Veylder et al, 2007; Inze & De Veylder, 2006).
The cellular level of cyclins is regulated both transcriptionally and post-translationally by
proteasome degradation. In general, A- and B-type cyclins are transcriptionally upregulated
during the G2/M transition, while D-type cyclins are upregulated during the G1/S transition
(Menges et al, 2005). Cyclins are selectively degraded by the proteasome. The A- and B-type
cyclins contain a consensus destruction box (D-box) required for proteasome targeting
(Genschik et al, 1998; Renaudin et al, 1996). Some B-type cyclins are ubiquitinated during
mitosis by a specific ubiquitin E3 ligase known as anaphase promoting complex (APC) and
subsequently degraded by the proteasome (Weingartner et al, 2003). The D-type cyclins
contain a PEST amino acid motif that also mediates their degradation by the proteasome
(Lechner et al, 2002; Planchais et al, 2004).
2.2.2. Cyclin-Dependent-Kinases
Cyclin-dependent-kinases (CDKs) are a class of serine-threonine-protein kinases that form the
central components of the cell cycle control system. They catalyze the phosphorylation of key
cell cycle regulators that are involved in the transitions during cell cycle progression. The
substrate specificity of CDKs is determined by their binding partners, the cyclins. Monomeric
CDK is inactive because its T-loop is positioned in such a way that it blocks binding of
substrate proteins at the entrance of the active site “cleft” of the enzyme. Cyclins bind CDKs
through an interaction between their cyclin-box and a conserved PSTAIRE helix in the CDK.
This interaction induces a conformational change in the CDK, causing reconfiguration of the
active site region and thereby activating the CDK. Thus, cyclins both control the substrate
specificity and activity of the CDKs. CDK activity is also regulated by cyclin activating
kinases (CAKs), which phosphorylate them at a conserved residue in the T-loop, thereby
inducing additional conformational changes at the active site region. Both cyclin binding and
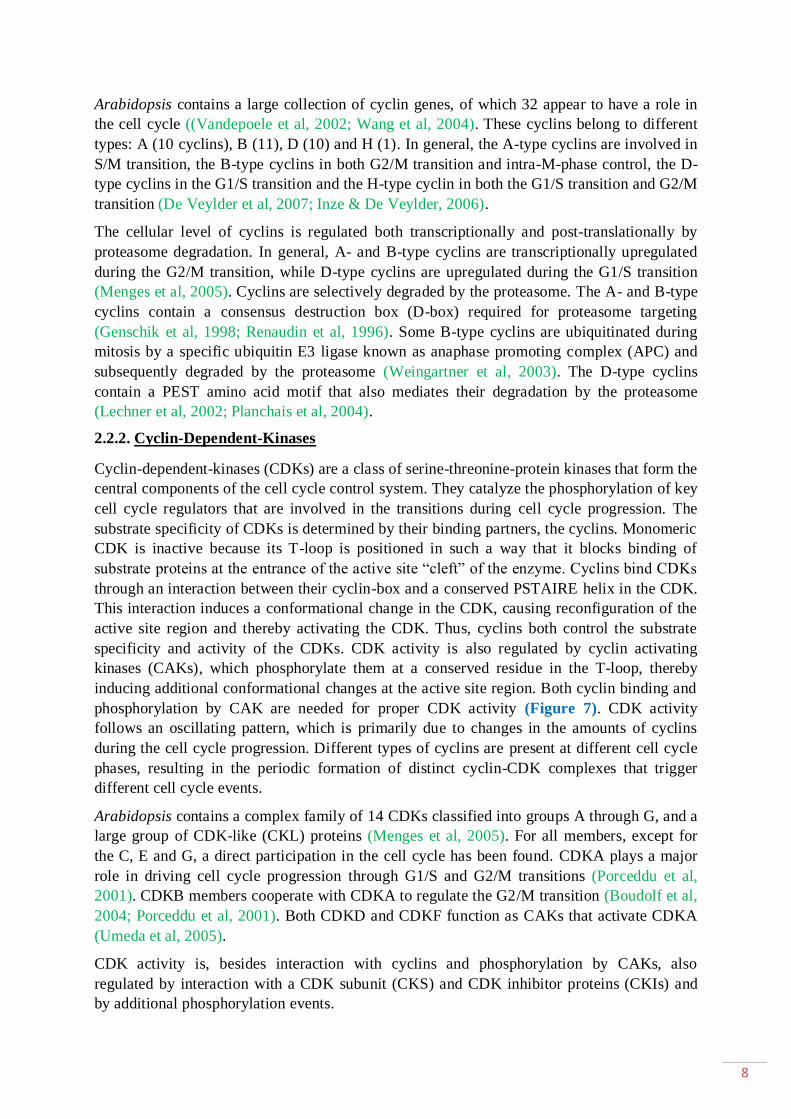
phosphorylation by CAK are needed for proper CDK activity (Figure 7). CDK activity
follows an oscillating pattern, which is primarily due to changes in the amounts of cyclins
during the cell cycle progression. Different types of cyclins are present at different cell cycle
phases, resulting in the periodic formation of distinct cyclin-CDK complexes that trigger
different cell cycle events.
Arabidopsis contains a complex family of 14 CDKs classified into groups A through G, and a
large group of CDK-like (CKL) proteins (Menges et al, 2005). For all members, except for
the C, E and G, a direct participation in the cell cycle has been found. CDKA plays a major
role in driving cell cycle progression through G1/S and G2/M transitions (Porceddu et al,
2001). CDKB members cooperate with CDKA to regulate the G2/M transition (Boudolf et al,
2004; Porceddu et al, 2001). Both CDKD and CDKF function as CAKs that activate CDKA
(Umeda et al, 2005).
CDK activity is, besides interaction with cyclins and phosphorylation by CAKs, also
regulated by interaction with a CDK subunit (CKS) and CDK inhibitor proteins (CKIs) and
by additional phosphorylation events.

9
CKS promotes effective CDK-mediated phosphorylation of substrate proteins by providing
the CDK with an accessory binding site that recognizes phosphorylated residues in the
substrate protein (Bourne et al, 1996) (Figure 7).
The activity of cyclin-CDK complexes is negatively regulated by CKIs. CKIs inhibit kinase
activity by binding both the cyclin and the CDK, thereby blocking the entrance of the
substrate active site cleft (Figure 8). One class of CKIs are the Kip-Related Proteins (KRPs).
Arabidopsis contains seven of these family members (KRP1-7) and all of them interact with
D-type cyclins (De Veylder et al, 2001a; De Veylder et al, 2001b; Jasinski et al, 2002; Lui et
al, 2000; Schnittger et al, 2003; Wang et al, 1998; Zhou et al, 2003). KRPs are ubiquitinated
by the SCFSKP2A
complex and subsequently degraded by the proteasome (Verkest et al,
2005b). Another class of CKIs are SIAMESE (SIM) and its family members SIM-RELATED
(SMR) proteins (Churchman et al, 2006; Peres et al, 2007).
Finally, CDKs are subject to an inhibitory phosphorylation event by WEE1 kinase, which
phosphorylates an N-terminal tyrosine and threonine residue of CDK, thereby preventing
proper ATP binding (Sorrell et al, 2002; Sun et al, 1999) (Figure 8).
2.2.3. The E2F transcription factors and RBR
The adenovirus E2 promoter-binding factor (E2F) proteins, together with the
RETINOBLASTOMA RELATED (RBR) protein regulate the G1/S transition during cell
cycle progression.
Arabidopsis has three different subclasses of E2F transcription factors (Figure 9). One class
contains three typical E2Fs (E2Fa, E2Fb and E2Fc), of which E2Fa and E2Fb operate as
Figure 8: CDK negative regulation. CDK activity can be inhibited by
phosphorylation by WEE1 kinases at a
conserved tyrosine and threonine residue
near the N – terminus of CDK. Binding
of CKI proteins, such as KRPs, also
inhibits CDK activity. CKIs bind both
CDK and cyclin, thereby blocking the
substrate entrance region. CKIs contain a
RXL motif that interacts with the
MRAIL motif in cyclins.
Figure 7: Cyclin-CDK-CKS-substrate complex. Monomeric CDK lacks activity until it is complexed
with cyclins and activated by CAK-dependent
phosphorylation. CAKs phosphorylate a conserved
residue in the T – loop region. The cyclin-box in
cyclin binds the PSTAIRE motif of CDK, thereby
inducing a conformational change in the active site
T-loop region of CDK. The MRAIL motif in cyclin
interacts with the RXL motif in substrate proteins.
The active site of CDK recognizes the S/TPXK motif
in substrate proteins as phosphorylation site. CKS
proteins are proposed to act as docking factors that
recognize phosphorylated residues in substrate
proteins.

10
transcriptional activators, whereas E2Fc is thought to function as a transcriptional repressor
(De Veylder et al, 2007; Gutierrez, 2005; Inze & De Veylder, 2006). These typical E2F
proteins have a single DNA binding domain and require heterodimerization with the
dimerization partner (DP) proteins for their function. These represent a second class of E2F
proteins and comprise DPa and DPb, which also have a single DNA-binding domain. The
E2Fa and E2Fb proteins dimerize preferentially with DPa and E2Fc with DPb ((del Pozo et al,
2006; Rossignol et al, 2002; Sozzani et al, 2006). The third class comprises three DP-E2F-
Like (DEL) proteins (DEL1, DEL2 and DEL3), which lack a transcriptional activation
domain and have two DNA binding domains. They are thought to bind as monomers to their
target genes and function as repressors by competing with E2F-DP-complexes for binding
sites (Ramirez-Parra & Gutierrez, 2007). The consensus E2F-binding-sequence is found in
E2F-responsive promoters of genes involved in G1/S transition, such as replication genes, but
also B-type CDKs necessary for the G2/M transition, indicating a feed forward mechanism
between both transitions ((Boudolf et al, 2004; Ramirez-Parra et al, 1999; Sekine et al, 1999).
Arabidopsis has a single Retinoblastoma-Related protein (RBR), which in its
hypophosphorylated-form interacts with E2F-DP-complexes to repress their activity by
recruiting histone deacetylases, rendering the chromatin less accessible for transcription.
Upon phosphorylation by cyclin-CDK complexes, RBR dissociates from the E2Fs, thereby
releasing their transcriptional activity (de Jager & Murray, 1999).
2.3. Cell cycle progression
2.3.1. The G1/S transition
Mitogens, such as auxins, cytokinins, brassinosteroids, gibberellins and sucrose, trigger the
production of D-type cyclins (CYCD), which in turn activate CDKA during the late G1-phase
(De Veylder et al, 2003). The CYCD-CDKA complexes are activated by a CAK-dependent
step and can be subjected to negative regulation by KRPs (e.g. KRP2). At the G1/S transition,
these KRPs are targeted for proteasome-mediated proteolysis after interaction with the F-box
protein SKP2A of the ubiquitin E3 ligase SCFSKP2A
complex (Verkest et al, 2005a). The
major target of CYCD-CDKA complexes in G1 is the RBR protein (Nakagami et al, 2002;
Nakagami et al, 1999). Phosphorylation of RBR leads to its dissociation from the E2Fa/b-DPa
complexes, allowing the E2F-target genes, such as CDKB and genes necessary for S-phase
progression, to be transcribed (Blais & Dynlacht, 2004). Both repressors E2Fc and DPb are
degraded by the proteasome after ubiquitination by the ubiquitin E3 ligase SCFSKP2A
complex
(del Pozo et al, 2002; del Pozo et al, 2006) (Figure 10).
2.3.2. The G2/M transition
A similar cascade of events occurs during the G2/M transition. Again CDKA is the major
driver of this transition after its association with D-, A- and, particularly, B-type cyclins (Inze
& De Veylder, 2006). In addition to CDKA, the G2/M transition requires the E2F-dependent

11
expression of CDKB (Boudolf et al, 2004). Both cyclin-CDKA and cyclin-CDKB complexes
need activation by CAK activity to further phosphorylate a variety of targets that contribute to
enter mitosis. In case of replication stress or DNA damage, there is evidence that CDKA is a
WEE1 kinase target, mediating G2-arrest (De Schutter et al, 2007). Target proteins of the
cyclin-CDKA and cyclin-CDKB complexes are the three Myb repeats (MYB3R) transcription
factors, which recognize M-phase-specific activator (MSA) elements in the promoter-region
of G2/M transition genes (Ito et al, 2001) (Figure 10).
Figure 10: Cell cycle progression. The G1/S transition is triggered by mitogens which induce D-type cyclin expression. The inactive CYCD-CDKA
complex is activated by CAKs (CDKF and/or the CYCH-CDKD complex). KRPs that inhibit CYCD-CDKA
activity are degraded through the SCFSKP2A
-proteasome pathway. The active CYCD-CDKA complex
phosphorylates RBR, which leads to degradation of RBR. The E2Fa/b-Dpa-complex is now relieved from
repression and can induce the expression of S-phase genes. Both E2Fc and DPb, which inhibit expression of S-
phase genes, are also targeted for destruction through the SCFSKP2A
-proteasome pathway. The G2/M transition is
triggered by expression of various cyclins and CDKB, which is a target gene of the E2Fa/b-Dpa-complex. Both
CDKA and CDKB are involved in the G2/M transition. The inactive CYC-CDK-complex is activated by CAKs
(CDKF and/or the CYCH–CDKD complex). The CYC–CDK complex can be inactived by WEE1 kinase in case
of DNA replication stress. The MYB3R transcription factors are activated by the CYC-CDK complex and
trigger entry into mitosis. Near the end of mitosis, mitotic cyclins are degraded through the APC-proteasome
pathway, leading to the exit from mitosis and re-entry into the G1-phase (Inze & De Veylder, 2006).
2.4. Hormonal control of the cell cycle
Hormones directly regulate the expression of key cell cycle target genes and/or the activity of
their products and therefore play a rather direct role in controlling cell division activity. Auxin
activates both the G1/S transition and G2/M transition by stimulating proteolysis of E2Fc,
DPb and KRP2 (del Pozo et al, 2002; del Pozo et al, 2006; Himanen et al, 2002). Cytokinins
(CKs) are suggested to activate both the G1/S transition and G2/M transition. CKs together
with brassinosteroids (BRs) induce the expression of CYCD3;1, which promotes the G1/S
transition (Riou-Khamlichi et al, 1999; Soni et al, 1995). CKs are thought to downregulate
WEE1 kinase activity, leading to CDKA activation during the G2/M transition. BRs are
believed to enhance CDKA;1 gene expression. Abscisic acid appears to have a negative role
in G1/S transition by repressing the expression of CDKA;1 and inducing the expression of
KRP1 ((Hemerly et al, 1993; Wang et al, 1998). In general, ethylene and jasmonic acid inhibit
cell cycle progression (Kazama et al, 2004; Swiatek et al, 2002).

12
SECTION III: ROOT DEVELOPMENT
3.1. Root morphology
There are two major types of roots in plant kingdom: the allorhizic or taproot-system and the
homorhizic or fibrous-system. The taproot-system is characteristic for dicotyledonous species,
such as Arabidopsis. The fibrous-system is typical for monocotyledonous species, such as
maize.
The root system of Arabidopsis is characterized by the formation of the embryonic primary
root, which remains dominant during the whole life span of the plants. Later in development,
post-embryonic lateral roots emerge from this primary root (Malamy & Benfey, 1997).
Maize forms an embryonic primary root and a variable number of embryonic seminal roots
that emerge from the scutellar node. This embryonic root system is functionally important
only for early vigor of the maize seedling and is functionally replaced by post-embryonic
shoot-borne crown roots that are initiated from the underground coleoptilar node. Later in
development, the adult maize plant develops post-embryonic shoot-borne brace roots that
initiate from the aboveground nodes. All root types are able to form lateral roots, although the
aboveground brace roots form lateral roots only after penetrating the soil. The extensive post-
embryonic shoot-borne root system makes up the major backbone of the maize root stock a
few weeks after germination, and can have a significant influence on grain yield in water-
limited conditions (Feldman, 1994).
A B C
Figure 11: Root morphology of Arabidopsis and maize.
Arabidopsis has a taproot-system, characterized by the embryonic primary root and its post-embryonic lateral
roots (A). Maize has a fibrous-system, in which the embryonic primary root and embryonic seminal roots are,
later in development, functionally replaced by the post-embryonic shoot-borne root system, which comprises the
underground initiated crown roots and aboveground initiated brace roots (B, C) (Hochholdinger & Tuberosa,
2009; Hochholdinger et al., 2004).
13
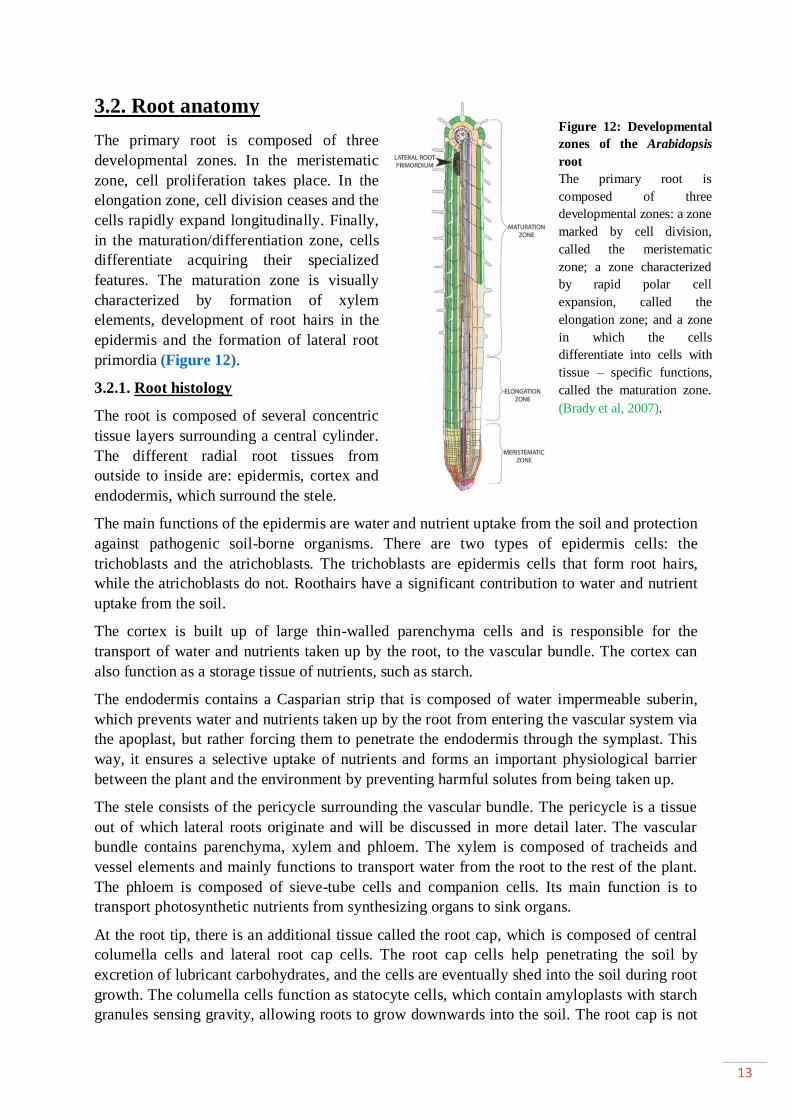
3.2. Root anatomy
The primary root is composed of three
developmental zones. In the meristematic
zone, cell proliferation takes place. In the
elongation zone, cell division ceases and the
cells rapidly expand longitudinally. Finally,
in the maturation/differentiation zone, cells
differentiate acquiring their specialized
features. The maturation zone is visually
characterized by formation of xylem
elements, development of root hairs in the
epidermis and the formation of lateral root
primordia (Figure 12).
3.2.1. Root histology
The root is composed of several concentric
tissue layers surrounding a central cylinder.
The different radial root tissues from
outside to inside are: epidermis, cortex and
endodermis, which surround the stele.
The main functions of the epidermis are water and nutrient uptake from the soil and protection
against pathogenic soil-borne organisms. There are two types of epidermis cells: the
trichoblasts and the atrichoblasts. The trichoblasts are epidermis cells that form root hairs,
while the atrichoblasts do not. Roothairs have a significant contribution to water and nutrient
uptake from the soil.
The cortex is built up of large thin-walled parenchyma cells and is responsible for the
transport of water and nutrients taken up by the root, to the vascular bundle. The cortex can
also function as a storage tissue of nutrients, such as starch.
The endodermis contains a Casparian strip that is composed of water impermeable suberin,
which prevents water and nutrients taken up by the root from entering the vascular system via
the apoplast, but rather forcing them to penetrate the endodermis through the symplast. This
way, it ensures a selective uptake of nutrients and forms an important physiological barrier
between the plant and the environment by preventing harmful solutes from being taken up.
The stele consists of the pericycle surrounding the vascular bundle. The pericycle is a tissue
out of which lateral roots originate and will be discussed in more detail later. The vascular
bundle contains parenchyma, xylem and phloem. The xylem is composed of tracheids and
vessel elements and mainly functions to transport water from the root to the rest of the plant.
The phloem is composed of sieve-tube cells and companion cells. Its main function is to
transport photosynthetic nutrients from synthesizing organs to sink organs.
At the root tip, there is an additional tissue called the root cap, which is composed of central
columella cells and lateral root cap cells. The root cap cells help penetrating the soil by
excretion of lubricant carbohydrates, and the cells are eventually shed into the soil during root
growth. The columella cells function as statocyte cells, which contain amyloplasts with starch
granules sensing gravity, allowing roots to grow downwards into the soil. The root cap is not
Figure 12: Developmental
zones of the Arabidopsis
root
The primary root is
composed of three
developmental zones: a zone
marked by cell division,
called the meristematic
zone; a zone characterized
by rapid polar cell
expansion, called the
elongation zone; and a zone
in which the cells
differentiate into cells with
tissue – specific functions,
called the maturation zone.
(Brady et al, 2007).

14
only responsible for gravitropism, but also phototropism, thigmotropism (obstacle sensing),
thermotropism, hydrotropism and chemotropism (Ishikawa and Evans 1990; Okada and
Shimura 1990; Takahashi 1997). Thus, the root cap perceives lots of environmental stimuli
and is a very important tissue for the plasticity of plant roots.
The radial pattern originates at the stem cell niche in the root apical meristem (RAM). This
stem cell niche is a population of stem cells or initials that generates every tissue layer in the
root. Initials divide asymmetrically to give rise to two distinct daughter cells, a copy of the
original initial and a daughter cell programmed for generating a cell file with a different cell
fate. The initials are situated around a group of mitotically less active cells, called the
quiescent centre (QC). The major function of the QC is the maintenance of the stem cell niche
by preventing differentiation of the initials.
3.2.2. Comparative anatomy of the Arabidopsis and maize root
The Arabidopsis root is composed of single concentric layers of epidermis, cortex,
endodermis and pericycle and a diarch vascular bundle with bilateral symmetry, consisting of
two xylem and two phloem poles. The radial number of cells in Arabidopsis is relatively
invariable (e.g. the cortex and endodermis have a fixed radial number of eight cells).
Arabidopsis forms a QC that always contains four cells surrounded by a limited number of
initial cells that give rise to the surrounding root tissues (Dolan et al, 1993; Schiefelbein et al,
1997) (Figure 13).
The maize root contains a single epidermal layer, eight to fifteen cortical cell layers, a single
endodermal layer, a single pericycle layer and a polyarch vascular bundle. The radial number
of cells in maize is variable (Feldman, 1994). The QC consists of 800 to 1200 cells and is
surrounded by the proximal and distal meristems, which consist of several hundred cells
(Jiang et al, 2003) (Figure 13).
A C
B D
Figure 13: Root anatomy in Arabidopsis and maize.
The Arabidopsis root (A, B) has a relatively simple
radial anatomy compared to the maize root (C, D).
(Hochholdinger e al., 2004).

15
3.3. Embryonic root development
The primary root of Arabidopsis is established very early in embryogenesis. After
fertilization, the zygote undergoes an asymmetric division to produce a basal and an apical
cell. The basal cell undergoes several horizontal divisions, giving rise to a single file of
suspensor cells, which forms a connection between the developing embryo and the maternal
tissues. The apical cell divides by consecutive rounds of vertical and horizontal divisions,
subsequently giving rise to the octant, dermatogen, globular, triangular, heart and torpedo
stage. At the globular stage, the uppermost suspensor cell is recruited by the apical part of the
embryo and becomes specified as the hypophysis. This is the founder cell of the primary root
meristem and divides asymmetrically, forming a large basal and a small apical daughter cell.
Later in embryogenesis, this apical cell produces the QC cells. At the torpedo stage, the stem
cell niche is established and leads to the formation of a fully functional root meristem, which
will support post-embryonic primary root development (Grunewald et al., 2007) (Figure 14).
The cell division pattern during maize root embryogenesis is not yet characterized in detail.
However, maize embryogenesis was divided into several consecutive stages: the pro-embryo,
transition, coleoptilar, first leaf (L1), second leaf (L2) and mature maize embryo stage (L5).
After the asymmetric division of the zygote, several rounds of divisions give rise to the pro-
embryo and the suspensor. During the transition stage, adaxial/abaxial polarity is established
by outgrowth of the scutellum at the abaxial side of the embryo. At the coleoptilar stage, the
coleoptile is formed, and the shoot apical meristem (SAM) and RAM are established. During
the L1-stage, the first leaf primordium emerges opposite the coleoptile. During the L2-stage,
the second leaf is formed opposite the first leaf. In the mature embryo stage, the coleoptiles
encloses the six formed leaves, while the RAM is protected by the coleorhiza. It should be
noted that the primary root is formed endogenously deep inside the embryo in contrast to
Arabidopsis and that there is laterally displaced axis in contrast to the apical-basal axis in
Arabidopsis ((Zimmermann & Werr, 2005; Grunewald et al., 2007) (Figure 14).
Figure 14: Arabidopsis and maize embryogenesis.
Arabidopsis embryogenesis (left) is divided into the following consecutive stages: (A) one-cell stage, (B) two-
cell stage, (C) octant stage, (D) dermatogens stage, (E) globular stage (arrow indicates asymmetrical division of
hypophysis), (F) triangular stage, (G) QC cell formation, (H) heart stage, (I) early and (J) late torpedo stage
(Grunewald et al., 2007). Maize embryogenesis (right) is divided into the following consecutive stages: (A) pro-
embryo stage, (B, C) transition stage, (D) coleoptilar stage, (E) L1 stage, (F) L2 stage and (G) mature embryo
(Zimmermann & Werr, 2005).

16
3.4. Post-embryonic primary root development
Post-embryonic primary root development
is supported by the RAM, in which the
stem cell niche, surrounding the QC,
generates every cell file in the root, thereby
supporting root growth. There are four sets
of meristematic initials in Arabidopsis
roots: one that forms the epidermis and
lateral root cap, one that forms the
columella root cap, one that produces both
the cortex and endodermal layers and one
that produces the cells of the stele and
pericycle (Dolan et al, 1993) (Figure 15).
3.5. Lateral root development in Arabidopsis
3.5.1. General aspects of lateral root development
In Arabidopis, lateral roots emerge from the primary root in an acropetal order and are
ordered along the main axis in a regular left-right alternating pattern (De Smet et al, 2007).
They are initiated post-embryonically from pericycle cells adjacent to the xylem pole (Dolan
et al, 1993). These cells are called the pericycle founder cells (Figure 16, A). A lateral root
primordium (LRP) is established by a well-defined cell division pattern that is described by
eight different developmental stages, based on a study using enhancer trap lines that mark
various root tissues (Malamy & Benfey, 1997) (Figure 16, B). During LRP emergence,
several parental tissues have to be penetrated, which necessitates cell separation in the
endodermis, cortex and epidermis cell layers. This is mediated by cell wall remodeling
(CWR) enzymes that are specifically expressed in these cell layers only adjacent to a LRP
(Laskowski et al, 2006; Neuteboom et al, 1999; Roberts et al., 2002). Once the lateral root
emerges from the parent root, it develops its own functional meristem, supporting its further
growth independently from the parent root (Malamy & Benfey, 1997).
3.5.2. Pericycle characteristics
The pericycle in Arabidopsis can be regarded as a heterogeneous tissue for several reasons:
the pericycle cells at the xylem poles differ from those at the phloem poles at the cytological
level, in cell division competence, cell cycle progression, cell size, and marker gene
expression. Xylem-pole associated pericycle cells exhibit meristematic features, such as large
nuclei, small vacuoles and dense cytoplasm, whereas those at the phloem-pole do not
(Himanen et al., 2004). It has been hypothesized that after leaving the RAM, pericycle cells at
the phloem poles remain in the G1-phase, whereas those at the xylem poles advance to the
G2-phase of the cell cycle and are in a mitosis-competent state (Beeckman et al, 2001).
Therefore, the pericycle cells at the phloem poles are quiescent, whereas those at the xylem
poles are competent to divide and initiate lateral roots, and can be regarded as an extended
meristem (Casimiro et al, 2003; Dubrovsky et al, 2000). Cell length measurements have
indicated that the pericycle cells at the xylem poles are shorter than those at the phloem poles
(Beeckman et al, 2001; Dubrovsky et al, 2000). Cell cycle marker gene expression and
enhancer trap reporter lines also reveal differences between both populations of pericycle
cells (Beeckman et al, 2001; Laplaze et al, 2005; Parizot et al, 2008).
Figure 15: Arabidopsis root stem cell niche
Four sets of initials surround the QC (pink): one that
forms the epidermis and lateral root cap (red), one that
forms the columella root cap (blue), one that produces
both the cortex and endodermis (yellow) and one that
produces the cells of the stele and pericycle (green).

17
Figure 16: Lateral root development in Arabidopsis
(A) In Arabidopsis, lateral roots originate from a small group of the pericycle cells adjacent to the xylem pole,
called the pericycle founder cells (Grunewald et al., 2007). (B) Lateral root primordium development. Stage I
The first anticlinal divisions of the xylem-pole associated pericycle founder cells generates 4-10 short pericycle
cells enlarged in a radial direction. Stage II A periclinal division generates two layers: the outer layer (OL) and
the inner layer (IL). Stage III A periclinal division of OL results in outer layer 1 (OL1) and outer layer 2 (OL2).
Stage IV A periclinal division of IL results in inner layer 1 (IL1) and inner layer 2 (IL2). At this stage the
endodermis is penetrated. Stage V An anticlinal division in the center cell of both OL1 and OL2 generates four
cuboidal cells. The adjacent cells also divide, creating an OL1 of 10-12 cells. Cells in IL2 enlarge radially and
divide, pushing the overlying layers up and compressing the cells in IL1 and OL2. The lateral root primordium
(LRP) is midway through the cortex. Stage VI A periclinal division in all but the center cells of OL2 creates
OL2a and OL2b. Four central cells in OL1 divide periclinally. The LRP has penetrated the epidermis. Stage VII
A lot of anticlinal divisions in all cells, especially in OL1, occur. The LRP appears to be just about to emerge
from the parent root. Stage VIII Corresponds to an emerged lateral root. The lateral root is pushed through the
epidermis by cell elongation, rather than cell divisions.
3.5.3. Lateral root initiation
The regular spacing of lateral roots is controlled by an endogenous mechanism, in which only
a limited number of pericycle cells become specified as founder cells in a well-defined spatial
order. It has recently been reported that the pericycle founder cell identity is established in a
zone immediately behind the RAM, called the basal meristem. In this basal meristem, xylem-
pole pericycle cells are primed to divide several millimeters distal to the RAM. This priming
is a pre-initiation event in pericycle cells and is induced by oscillation of local auxin response
(visualized by the DR5::GUS marker) in the protoxylem adjacent to the xylem-pole
associated pericycle cells. These oscillations occur at regular time intervals of approximately
15 hours and were associated with the induction of new LRP in the adjacent pericycle cells,
which ultimately gives rise to the regular spacing of LRs along the main root (De Smet et al,
2007). The exact molecular auxin signaling mechanism behind this priming event is currently
not yet known, although the GATA23 transcription factor and its upstream auxin regulatory
genes Aux/IAA28, ARF5, ARF6, ARF7, ARF8 and ARF19 are believed to play a crucial role
in this event (De Rybel et al., in preparation).
A B

18
Besides this endogenous control system, several other independent signaling mechanisms can
induce pericycle founder cell identity and thereby determine the lateral root spacing. These
include mechanical induction, gravitropic response and exogenous auxin application
(Ditengou et al, 2008; Lucas et al, 2008). Also other hormones and environmental signals,
such as water- and nutrient availability, have an effect on lateral root spacing.
The lateral root initiation (LRI) process corresponds to the signaling events in two adjacent
pericycle founder cells that occur after the priming event and lead up to their first anticlinal
asymmetric division further up in the root. This first anticlinal asymmetric division is
preceded by a nuclear migration towards the common cell wall of the two adjacent pericycle
founder cells (Figure 17).
3.5.4. Auxin and lateral root development
Auxin plays a dominant role in all aspects of LRD illustrated by the large number of auxin-
related mutants with a lateral root phenotype. These mutants are affected in auxin transport
(e.g. aux1 (Marchant et al, 2002)), auxin biosynthesis (e.g. superroot1 (Boerjan et al, 1995)),
auxin homeostasis (e.g. dfl1 (Nakazawa et al, 2001)) or auxin signaling (e.g. slr1/iaa14
(Fukaki et al, 2002)).
Auxin is needed for LRI, indicated by the presence of an auxin response maximum just prior
to and during the asymmetric division (visualized with the DR5::GUS marker line) and an
auxin gradient is needed during further LRP development as well (Benkova et al, 2003). This
auxin gradient likely acts as a morphogen during further LRP patterning (Benkova et al,
2009). When auxin transport is inhibited by N-1-naphthylphthalamic acetic acid (NPA), the
auxin gradient is abolished and LRD is prevented (Casimiro et al, 2001). Auxin also appears
to be a key player in the process of LR emergence. Auxin, originating from developing LRPs,
acts as a local inductive signal that induces the expression of the auxin influx carrier LIKE
AUX1 3 (LAX3) in cortical and epidermal cells directly overlaying the LRP and thereby
reinforcing the auxin-dependent induction of several CWR enzymes (Swarup et al., 2008).
Aux/IAA14/SOLITARY ROOT1 (SLR1), together with its interacting proteins ARF7 and
ARF19, are crucial auxin signaling regulators during LRI (Fukaki et al, 2005; Fukaki et al,
2002; Okushima et al, 2005; Wilmoth et al, 2005). Both ARF7 and ARF19 activate the
transcription of many auxin-responsive genes (Lee et al., 2009). Among the direct target
genes are LATERAL ORGAN BOUNDARIES DOMAIN16/AS2-LIKE18 (LBD16/ASL18)
and LBD29/ASL16, both of which encode nuclear proteins that are involved in LRI
(Okushima et al., 2007). It has recently been shown that the BODENLOS (BDL)/IAA12-
MONOPTEROS (MP) / ARF5-mediated auxin response succeeds the SLR1/IAA14 response
and guarantees further organized lateral root patterning (De Smet et al., 2010). ARF7 and
ARF19 can also be inhibited by other Aux/IAAs, such as IAA1, IAA3, IAA18, IAA19 and
IAA28, which have also been shown to play a role in LRD (Tian & Reed, 1999) (Rogg et al,
2001; Tatematsu et al, 2004; Uehara et al, 2008; Yang et al, 2004). This indicates that
Aux/IAA14/SLR1 and possibly other Aux/IAAs together might function redundantly to
negatively regulate LRI through the inhibition of ARF7 and ARF19. This inhibition event
depends on the chromatin-remodeling factor PICKLE (PKL)/SUPPRESSOR OF SLR2
(SSL2), indicating that chromatin remodeling is also a mechanism that controls gene
expression during LRI (Fukaki et al, 2006).

19
Figure 17: Lateral root priming and lateral root initiation events
Pericycle founder cell identity is established in the basal meristem zone. This priming event involves an auxin
signaling module that contains Aux/IAA28, which represses the activity of ARF5, ARF6, ARF7, ARF8 and
ARF19. These ARF proteins are thought to control GATA23 expression, which is involved in founder cell
specification. In the nuclear migration zone, another auxin signaling module controls the nuclear migration in the
pericycle founder cells. This auxin module includes Aux/IAA14 / SLR1 and its interacting ARFs. In the lateral
root initiation zone, two subsequent auxin signaling modules operate to trigger the asymmetric division. These
modules are the Aux/IAA14 / SLR1 – ARF7 / ARF19 module and the Aux/IAA12 / BDL – ARF5 module.
GATA23 expression might be induced by these modules and guides the LRI process (De Rybel et al., in
preparation).
Considering the fact that LRI is spatially and temporally asynchronous and involves only a
limited number of cells, it is very difficult to efficiently follow this process in detail with
molecular techniques. To overcome these problems, a system was developed that allows
synchronization of the pericycle and enhances the activation of LRI (Himanen et al, 2002).
This lateral root inducible system (LRIS) is based on seed germination in the presence of the
auxin transport inhibitor NPA, which prevents pericycle divisions, followed by a transfer to
the synthetic auxin NAA, which induces LRI. A targeted broad-scale transcript profiling
using the LRIS was used to identify candidate genes expressed during the LRI process. There
were 906 differentially regulated genes identified, such as genes involved in auxin transport
and signaling (LAX3, IAA2 and IAA11), the G1/S transition (E2FA and Histone H4) and the
G2/M transition (CYCB1;1, CYCB2;1 and CDKB1;1) (Himanen et al, 2002). In a subsequent
genome-wide transcript profiling analysis, the inclusion of the dominant auxin signaling
mutant slr1, impaired in LRI, was used to identify genes specifically involved in LRI and to
make a distinction with general auxin response (Vanneste et al, 2005). The availability of the
GAL4-enhancer trap line J0121, expressing GFP in xylem-pole pericycle cells, allowed
transcript profiling of auxin-activated pericycle cells by fluorescence-activated cell sorting
(FACS) in combination with the LRIS (Laplaze et al, 2007; De Smet et al, 2008). In a similar
study, transcript profiling on cell sorted xylem-pole and phloem-pole associated pericycle
cells was performed (Parizot et al, 2010).
3.5.5. Later root development and the cell cycle
Using the LRIS, it was revealed that LRI is accompanied by temporal transcriptional
regulation of several core cell cycle genes during cell cycle progression. At the onset of LRI,
KRP1 and KRP2 are downregulated, whereas E2Fa and CYCD3;1 are upregulated, which
together with the activation of CDKA:1, leads to the G1/S transition in cell cycle progression
(Himanen et al, 2002).

20
Several A-type cyclins (CYCA2;1-4) are upregulated during LRI and expressed at the site of
LRI (Vanneste et al., in preparation). CDKB1;1 expression is also induced during LRI, which
together with these A-type cyclins might stimulate the G2/M transition, eventually leading up
to the cell divisions during LRP development.
Although overexpression of CYCD3;1, E2Fa/DPa or CYCA2 triggers more proliferative cell
divisions at the site of LRI, it does not lead to the formation of organized primordia. However,
when supplying exogenous NAA, there is an increase in lateral root formation. This indicates
that cell cycle activation alone is not sufficient to trigger LRD and that auxin is necessary for
cell fate respecification in the pericycle founder cells for LRI and for lateral root primordia
development (Vanneste et al, 2005; Vanneste et al., in preparation). The MYB-type
transcription factors MYB124/FOUR LIPS (FLP) and MYB88 are upregulated after NAA
treatment in the LRIS and might be involved in this cell fate respecification pathway. They
are believed to regulate PIN3 expression and thereby influence the auxin gradient, which is
crucial during LRI and further LRD (Vanneste et al., in preparation).
Other regulators are the membrane-associated receptor-like kinase ARABIDOPSIS
CRINKLY4 (ACR4) and the related gene family members CRINKLY RELATED (CCRs).
These are key factors both in promoting formative cell divisions of the pericycle founder cells
and in repressing proliferative divisions in adjacent pericycle cells once organogenesis has
been started (De Smet et al, 2008).
3.5.6. Other phytohormones
Besides auxin, other phytohormones play an important role during LRD. Cytokinin (CK) is an
endogenous negative regulator of LR formation and plays an antagonistic role to auxin.
Exogenous CK inhibits LRI in Arabidopsis by blocking pericycle founder cells at the G2/M
transition (Li et al, 2006). Furthermore, CK inhibits auxin-induced expression of PIN genes,
thereby disrupting the establishment of the auxin maximum and inhibiting the asymmetric cell
division needed for LRI (Laplaze et al, 2007). Although abscisic acid (ABA) is necessary for
auxin-mediated LRI, it is a negative regulator of LR emergence (De Smet et al, 2006).
Brassinosteroids (BR) and auxin act synergistically to promote LR formation (Bao et al.,
2004). It has been shown that BRs promote acropetal auxin transport in the root and thereby
promote LRI. Ethylene negatively regulates Arabidopsis LR formation by altering auxin
transport (Negi et al, 2008). Increased ethylene synthesis and enhanced ethylene signaling
both decrease LR formation, while blocking the ethylene response increases LR formation.
Application of low concentrations of exogenous ACC (the precursor of ethylene) promotes
LRI, while high concentrations of exogenous ACC inhibit LRI, but promotes LRP emergence
(Ivanchenko et al, 2008).
3.5.7. Macronutrients
Nitrogen (N) is a major limiting macronutrient for plant growth. The plant senses patches of
higher N concentrations in the soil, and preferentially induces LRD in these zones, while not
investing energy in LRD in zones that are poor in nitrogen (Drew, 1975). Recently, it has
been shown that there might be a link between a nitrate transporter that acts as a nitrate
sensor, and auxin transport during LRD (Krouk et al., 2010 accepted for publication).
21
Phosphate is the second limiting macronutrient for plant growth. In Arabidopsis, primary root
growth is favored over lateral root growth in high levels of phosphate, whereas under low to
moderate levels of phosphate, lateral root growth is favored over primary root growth
(Linkohr et al, 2002; Williamson et al, 2001). Ecologically thinking, this is relevant, since in
phosphate-limiting conditions, there is a higher chance of finding higher phosphate
concentrations near the soil surface, thereby indicating why the plant no longer invests in
primary root growth downwards in the soil, but preferentially invests in local lateral root
development in the phosphate rich zone near the surface.
3.6. Lateral root development in Zea mays
Lateral roots in maize are initiated from phloem pole associated pericycle cells. Also
endodermal cells are involved in lateral root formation, giving rise to the epidermis and
columella of the newly formed lateral root, while the remaining root-tissues are derived from
the pericycle cells (Fahn, 1990).
There are two mutants known in maize that are defective in lateral root development. The
lateral rootless1 (lrt1) mutant is affected in lateral root initiation on both the embryonic
primary root and the embryonic seminal roots and is also affected in the formation of crown
roots at the coleoptilar (first) node. However, the lrt1 mutant shows normal crown root
development, including lateral roots, from the second node onwards (Hochholdinger and Feix,
1998). The rootless with undetectable meristems1 (rum1) mutant is affected in lateral root
initiation on the embryonic primary root and in the initiation of embryonic seminal roots. This
mutant develops crown root primordia at the coleoptilar node, but most of the time these
undifferentiated primordia do not lead to the formation of crown roots. However, normal
crown roots, including lateral roots, develop from the second node onwards (Woll et al,
2005). These mutants illustrate that there might be separate regulatory mechanisms for lateral
root development on embryonic roots and post-embryonic roots.
The rum1 mutant was used as a tool for comparative pericycle-specific transcriptomic and
proteomic analyses of the mutant versus wild-type (WT) pericycle cells and revealed several
transcripts and proteins specifically expressed in WT pericycle cells and might be related to
the LRI process (Liu et al, 2010; Woll et al, 2005). As there are no enhancer trap lines with
root tissue specific expression in maize, alternative approaches were needed to specifically
isolate phloem pole associated pericycle cells. Laser capture microdissection (LCM) is such
an alternative technique, in which cells of interest are isolated from fixed frozen or fixed
paraffin section. This can be done by physically linking them to a thermoplastic film with a
low-power laser beam or by catapulting them into a collection tube with a defocused laser
(Schnable et al, 2004). After isolation of phloem pole associated pericycle cells, protein
extraction or RNA extraction is performed to determine which genes are specifically
expressed in these cells. A protein that is downregulated in the rum1 mutant compared to the
WT is PHENYLALANINE AMMONIA-LYASE (PAL), which is a key enzyme in the
phenylpropanoid biosynthesis pathway (Liu et al, 2010; Dembinsky et al., 2008).
Phenylpropanoids are secondary metabolites that are involved in plant lignifications as well as
in various other developmental processes related to defense and growth (Ritter and Schulz,
2004).
22
Recently, it was reported that the rum1 mutant is affected in auxin response, possibly due to a
mutation in an Aux/IAA gene (a dominant-negative mutation; analogous to slr1/iaa14 in
Arabidopsis) and it was shown that the mutant has reduced auxin transport in the roots
(Fukaki et al, 2002; Woll et al, 2005; Taramino et al., 2008). A genome-wide analysis of the
primary auxin-responsive Aux/IAA gene family in maize was performed and will allow the
comparison with the Aux/IAA gene family in both rice and Arabidopsis, as the search for other
orthologs involved in root development in maize (Wang et al, 2010).
Rice (Oryza sativa), a monocot species that is closely related to maize, can also be used to
elucidate conserved mechanisms in LRI. The rice mutants adventitious rootless 1 (arl1) and
crown rootless1 (crl1) are devoid of postembryonic shoot-borne crown roots and have fewer
lateral roots. They are affected in a gene encoding a LBD protein, which contains a ARE in its
promoter that might be a target of OsARF16 (Inukai et al, 2005; Liu et al, 2005). ARL1/CRL1
is phylogenetically closely related to LBD16 and LBD29 in Arabidopsis, while OsARF16 is
the rice ortholog of both ARF7 and ARF19 in Arabidopsis (Okushima et al, 2007; Wang et al.,
2007). In maize, a mutation in a gene orthologous to ARL1/CRL1, called ROOTLESS
CONCERNING CROWN AND SEMINAL ROOT (RTCS), affects both crown root and seminal
root development, but does not affect the primary root, or its lateral roots (Taramino et al,
2007). RTCS and a duplicated homologous gene RTCS-LIKE (RTCL) also contain an ARE in
their promoters and are induced upon auxin treatment (Taramino et al, 2007). This indicates a
general auxin signaling mechanism that probably involves Aux/IAAs, ARFs and LBD
proteins in root development.
Thus in general, it can be concluded that there is a globally conserved mechanism of auxin
signaling during root primordium development in both dicotyledonous and
monocotyledonous species with specific regulators for each root type.
23
PART II: AIM OF THE PROJECT
1.1. Identification of conserved genes in LRI
The aim of this project was to discover key regulators for LRI in maize. In Arabidopsis, the
LRIS was used to discover new candidate genes involved in LRI (Himanen et al., 2002;
Vanneste et al., 2005). A similar inducible system was developed in the lab for maize (Jansen
et al., in preparation). As part of a cooperation between BASF/Cropdesign, this LRIS was
used to discover genes involved in LRI by transcriptomic analysis of phloem-pole associated
pericycle cells. Genes that were early upregulated in maize were compared with candidate
genes discovered in transcriptomic analyses of Arabidopsis (Himanen et al., 2002; Vanneste
et al., 2005; De Smet et al., 2008). This allowed for selection of genes that represent possible
conserved mechanisms between LRI in maize and Arabidopsis.
Functionally characterizing these candidate regulators was not performed in maize itself due
to lack of time (long generation time of maize) and tools (few marker lines available, maize
transformation is not yet efficient etc.). Instead, the function of the candidate regulators was
investigated in Arabidopsis thaliana, which is an easy model system to work with. Its genome
was sequenced a decade ago and a broad spectrum of mutants and tools are available for the
study of root development. Arabidopsis is easily transformed using the floral dip method.
Chemical genetics and RNAi technology are becoming well established and allow
circumvention of redundancy problems during genetic analyses. Large collections of marker
lines are available for determining the effects of genes of interest on development and these
lines also allow the isolation of specific cell-types using FACS for further analysis. Also for
the study of root development, working with Arabidopsis offers advantages: its root shows a
simple anatomy and is very thin, allowing whole-mount microscopic analysis.
To study the effect of the maize genes on LRI, maize sequences were ectopically expressed in
Arabidopsis using the Cauliflower Mozaic Virus (CaMV) 35S promoter. Transgenic plants
(ZM lines) are functionally characterized by determining the primary root length and lateral
root density. In a parallel approach, Arabidopsis gene orthologs identified in the LRIS were
overexpressed specifically in xylem-pole pericycle cells by using the UAS promoter in
combination with the GAL-4 enhancer trap line J0121 (AT lines).
1.2. The role of WRKY23 during root development
One candidate protein for LRI that was identified in two microarray experiments was
WRKY23 (Vanneste et al., 2005; Lejan et al., in preparation). WRKY23 is a member of a
superfamily of transcription factors with 74 members in Arabidopsis that is characterized by
an N-terminal conserved domain, containing the WRKYGQK and a novel zinc-finger motif,
which serves as the DNA-binding domain (Eulgem and Somssich, 2007). Further tissue
expression analysis of this WRKY23 protein revealed that it was expressed during the early
stages of lateral root development. Interestingly, a possible maize ortholog of WRKY23 was
also identified in the maize microarray experiment (ZM14). We wanted to determine whether
the functions of ZM14 and WRK23 are the same, verifying that they are true orthologs, and
study the role of both genes in LRI in more detail. To functionally characterize the role of
WRKY23 during LRI, the p35S::ZM14 line was analyzed in more detail, and a transgenic
p35S::WRKY23-SRDX Arabidopsis line was developed, which allows determining the effects
of dominant negative repression of WRKY23 gene targets (Hiratsu et al., 2003).

24
1.3. Further characterization of the maize LRIS
We wanted to characterize the LRIS in maize in more detail by studying what is happening in
the root before and after induction of LRI. To verify the auxin response at the site of LRI in
maize seedlings in the inducible system, two transgenic maize lines will be used: Zea mays
transformed with DR5::RFP or pPIN1::PIN1-YFP constructs (Gallavotti et al., 2008). Since
no cell cycle marker lines are available in maize, flow cytometry analysis combined with
qRT-PCR analysis on cell cycle genes was used to determine in which cell cycle phase the
pericycle cells of maize are blocked on NPA. Microscopic analysis of microtome root
sections of NPA- and NAA-treated maize seedlings will be performed to determine the effect
of NPA-treatment on the pericycle tissue layer.

25
PART III: RESULTS
1.1. Characterization of the ZM and AT lines
For functional characterization of the maize genes, they were expressed in Arabidopsis under
the control of the CaMV 35S promoter. Overexpression of the genes in the ZM lines was
tested by real-time qRT-PCR analysis, followed by phenotyping of root growth. Different
parameters were compared between Col-0 control plants and the transgenic lines: primary
root length, emerged lateral root density and length of the naked zone, which corresponds to
the zone from the roottip till the first emerged lateral root. The emerged lateral root density is
acquired by dividing the number of emerged lateral roots by the total length of the primary
root minus the length of the naked zone. In a parallel approach, the Arabidopsis orthologs of
some ZM genes were cloned from the Arabidopsis genome and expressed in J0121
Arabidopsis lines under the control of the UAS promoter, which resulted in expression of
these AT genes specifically in the xylem-pole associated pericycle cells (AT lines). This
allowed determining possible conserved mechanisms of action between AT protein and ZM
proteins and also avoiding aberrant effects due to ectopically overexpressing the protein in all
tissues. The ZM genes and their corresponding Arabidopsis orthologs are listed in Table 1.
The results of the phenotypic analysis are listed in Table 2.
Table 1: Overview of ZM genes and their corresponding Arabidopsis orthologs
ZM
gene
AGI code of
Arabidopsis
ortholog Protein ortholog in Arabidopsis
Corresponding
gene
ZM4 At1g51950 IAA18
ZM5 At2g33310 IAA13 AT4
ZM6 At1g80370 CYCA2;4
ZM8 At3g16500 PAP1
ZM10 At2g46990 IAA20
ZM11 At2g33310 IAA13 AT4
ZM14 At2g47260 WRKY23
ZM15 At1g31660 Protein with unknown function
ZM16 At3g51270 ATP binding/protein serine/threonine kinase
ZM18 At5g67150 Transferase family protein
ZM19 At1g04030 Protein with unknown function
ZM21 At5g62550 Protein with unknown function
ZM23 At5g67150 Transferase family protein
ZM25 At1g28440 HSL1 (HAESA-LIKE 1)
ZM27 At4g25730 FtsJ-like methyltransferase family protein
AT1 At4g22530 Protein with unknown function
AT2 At5g06860 PGIP1
AT3 At1g07370 PCNA1
AT4 At2g33310 IAA13 ZM11/ZM5
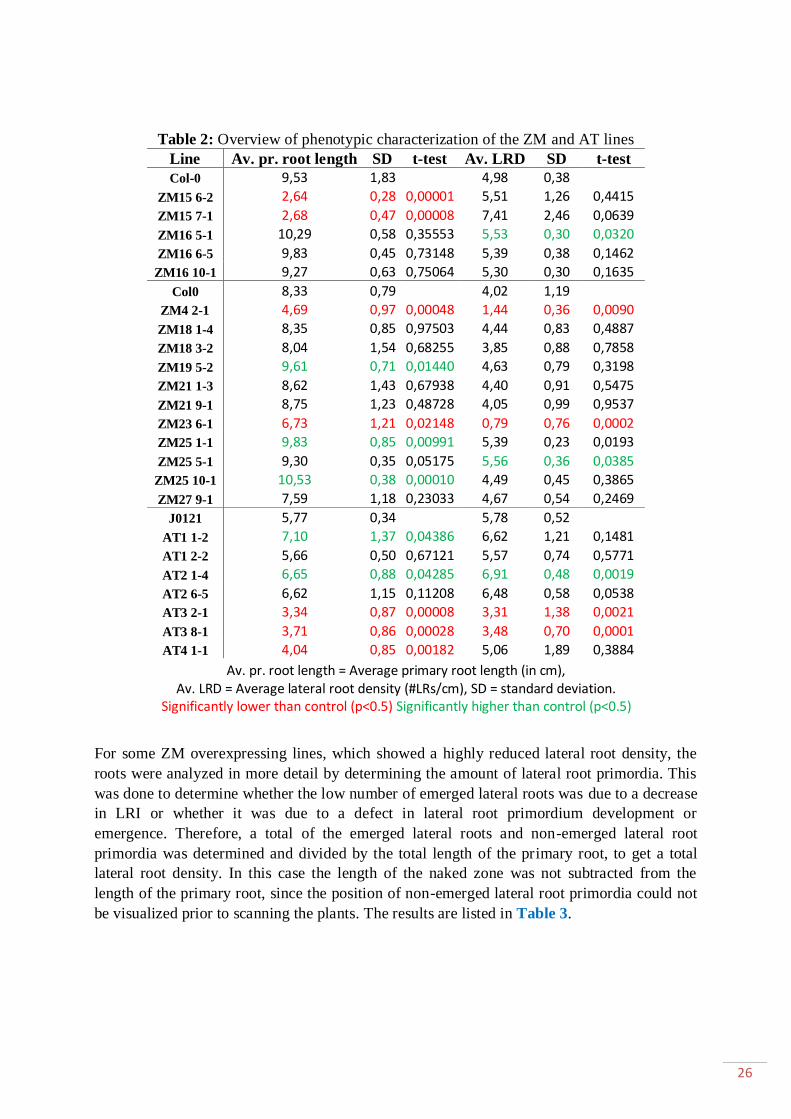
26
Table 2: Overview of phenotypic characterization of the ZM and AT lines
Line Av. pr. root length SD t-test Av. LRD SD t-test
Col-0 9,53 1,83
4,98 0,38 ZM15 6-2 2,64 0,28 0,00001 5,51 1,26 0,4415
ZM15 7-1 2,68 0,47 0,00008 7,41 2,46 0,0639
ZM16 5-1 10,29 0,58 0,35553 5,53 0,30 0,0320
ZM16 6-5 9,83 0,45 0,73148 5,39 0,38 0,1462
ZM16 10-1 9,27 0,63 0,75064 5,30 0,30 0,1635
Col0 8,33 0,79
4,02 1,19 ZM4 2-1 4,69 0,97 0,00048 1,44 0,36 0,0090
ZM18 1-4 8,35 0,85 0,97503 4,44 0,83 0,4887
ZM18 3-2 8,04 1,54 0,68255 3,85 0,88 0,7858
ZM19 5-2 9,61 0,71 0,01440 4,63 0,79 0,3198
ZM21 1-3 8,62 1,43 0,67938 4,40 0,91 0,5475
ZM21 9-1 8,75 1,23 0,48728 4,05 0,99 0,9537
ZM23 6-1 6,73 1,21 0,02148 0,79 0,76 0,0002
ZM25 1-1 9,83 0,85 0,00991 5,39 0,23 0,0193
ZM25 5-1 9,30 0,35 0,05175 5,56 0,36 0,0385
ZM25 10-1 10,53 0,38 0,00010 4,49 0,45 0,3865
ZM27 9-1 7,59 1,18 0,23033 4,67 0,54 0,2469
J0121 5,77 0,34
5,78 0,52 AT1 1-2 7,10 1,37 0,04386 6,62 1,21 0,1481
AT1 2-2 5,66 0,50 0,67121 5,57 0,74 0,5771
AT2 1-4 6,65 0,88 0,04285 6,91 0,48 0,0019
AT2 6-5 6,62 1,15 0,11208 6,48 0,58 0,0538
AT3 2-1 3,34 0,87 0,00008 3,31 1,38 0,0021
AT3 8-1 3,71 0,86 0,00028 3,48 0,70 0,0001
AT4 1-1 4,04 0,85 0,00182 5,06 1,89 0,3884
Av. pr. root length = Average primary root length (in cm), Av. LRD = Average lateral root density (#LRs/cm), SD = standard deviation.
Significantly lower than control (p<0.5) Significantly higher than control (p<0.5)
For some ZM overexpressing lines, which showed a highly reduced lateral root density, the
roots were analyzed in more detail by determining the amount of lateral root primordia. This
was done to determine whether the low number of emerged lateral roots was due to a decrease
in LRI or whether it was due to a defect in lateral root primordium development or
emergence. Therefore, a total of the emerged lateral roots and non-emerged lateral root
primordia was determined and divided by the total length of the primary root, to get a total
lateral root density. In this case the length of the naked zone was not subtracted from the
length of the primary root, since the position of non-emerged lateral root primordia could not
be visualized prior to scanning the plants. The results are listed in Table 3.
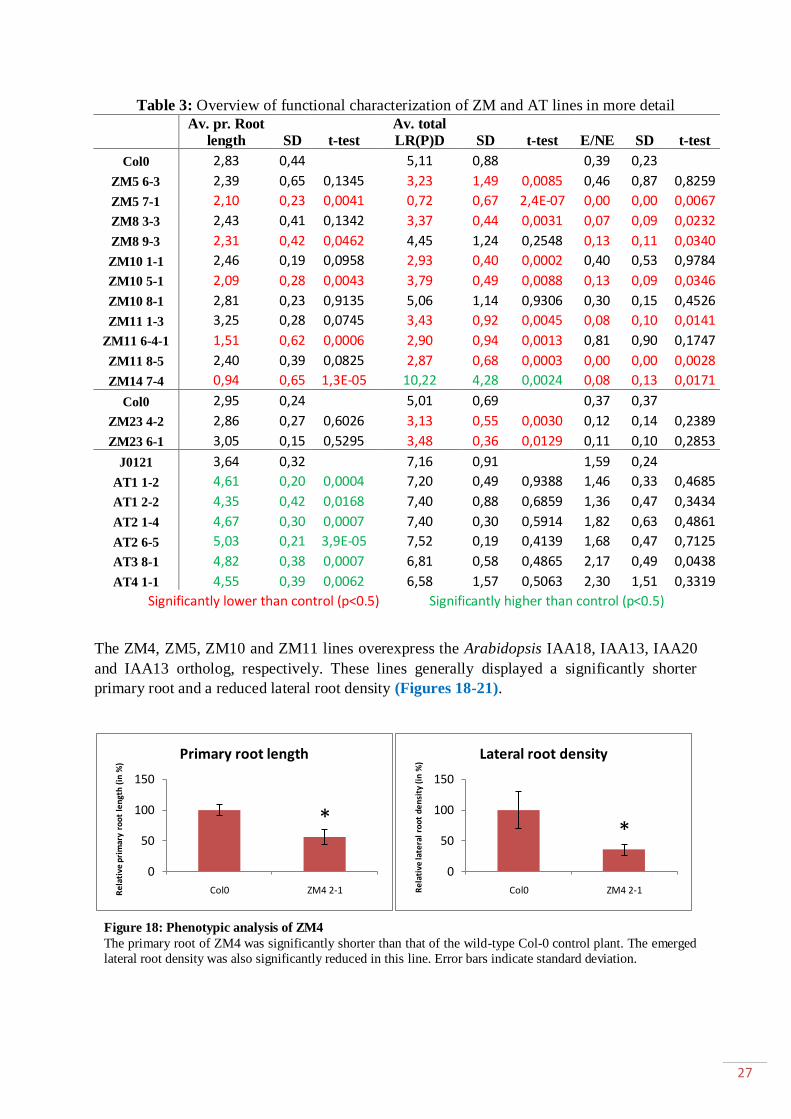
27
Table 3: Overview of functional characterization of ZM and AT lines in more detail
Av. pr. Root
length SD t-test
Av. total
LR(P)D SD t-test E/NE SD t-test
Col0 2,83 0,44
5,11 0,88
0,39 0,23 ZM5 6-3 2,39 0,65 0,1345 3,23 1,49 0,0085 0,46 0,87 0,8259
ZM5 7-1 2,10 0,23 0,0041 0,72 0,67 2,4E-07 0,00 0,00 0,0067
ZM8 3-3 2,43 0,41 0,1342 3,37 0,44 0,0031 0,07 0,09 0,0232
ZM8 9-3 2,31 0,42 0,0462 4,45 1,24 0,2548 0,13 0,11 0,0340
ZM10 1-1 2,46 0,19 0,0958 2,93 0,40 0,0002 0,40 0,53 0,9784
ZM10 5-1 2,09 0,28 0,0043 3,79 0,49 0,0088 0,13 0,09 0,0346
ZM10 8-1 2,81 0,23 0,9135 5,06 1,14 0,9306 0,30 0,15 0,4526
ZM11 1-3 3,25 0,28 0,0745 3,43 0,92 0,0045 0,08 0,10 0,0141
ZM11 6-4-1 1,51 0,62 0,0006 2,90 0,94 0,0013 0,81 0,90 0,1747
ZM11 8-5 2,40 0,39 0,0825 2,87 0,68 0,0003 0,00 0,00 0,0028
ZM14 7-4 0,94 0,65 1,3E-05 10,22 4,28 0,0024 0,08 0,13 0,0171
Col0 2,95 0,24
5,01 0,69
0,37 0,37 ZM23 4-2 2,86 0,27 0,6026 3,13 0,55 0,0030 0,12 0,14 0,2389
ZM23 6-1 3,05 0,15 0,5295 3,48 0,36 0,0129 0,11 0,10 0,2853
J0121 3,64 0,32
7,16 0,91
1,59 0,24 AT1 1-2 4,61 0,20 0,0004 7,20 0,49 0,9388 1,46 0,33 0,4685
AT1 2-2 4,35 0,42 0,0168 7,40 0,88 0,6859 1,36 0,47 0,3434
AT2 1-4 4,67 0,30 0,0007 7,40 0,30 0,5914 1,82 0,63 0,4861
AT2 6-5 5,03 0,21 3,9E-05 7,52 0,19 0,4139 1,68 0,47 0,7125
AT3 8-1 4,82 0,38 0,0007 6,81 0,58 0,4865 2,17 0,49 0,0438
AT4 1-1 4,55 0,39 0,0062 6,58 1,57 0,5063 2,30 1,51 0,3319
Significantly lower than control (p<0.5) Significantly higher than control (p<0.5)
The ZM4, ZM5, ZM10 and ZM11 lines overexpress the Arabidopsis IAA18, IAA13, IAA20
and IAA13 ortholog, respectively. These lines generally displayed a significantly shorter
primary root and a reduced lateral root density (Figures 18-21).
*
0
50
100
150
Col0 ZM4 2-1Re
lati
ve p
rim
ary
roo
t le
ngt
h (
in %
)
Primary root length
*
0
50
100
150
Col0 ZM4 2-1Re
lati
ve la
tera
l ro
ot
de
nsi
ty (
in %
)
Lateral root density
Figure 18: Phenotypic analysis of ZM4
The primary root of ZM4 was significantly shorter than that of the wild-type Col-0 control plant. The emerged
lateral root density was also significantly reduced in this line. Error bars indicate standard deviation.

28
*
0
50
100
150
Col0 ZM5 6-3 ZM5 7-1Re
lati
ve p
rim
ary
roo
t le
ngt
h (
in %
)Primary root length
*
*0
50
100
150
Col0 ZM5 6-3 ZM5 7-1Re
lati
ve t
ota
l LR
(P)
de
nsi
ty (
in %
)
Total LR(P) density
*
0
50
100
150
Col0 ZM10 1-1 ZM10 5-1 ZM10 8-1
Re
lati
ve p
rim
ary
roo
t le
ngt
h (
in %
)
Primary root length
* *
0
50
100
150
Col0 ZM10 1-1 ZM10 5-1 ZM10 8-1Re
lati
ve t
ota
l LR
(P)
de
nsi
ty (
in %
)
Total LR(P) density
*
-50
0
50
100
150
Col0 ZM11 1-3 ZM11 6-4-1 ZM11 8-5
Re
lati
ve p
rim
ary
roo
t le
ngt
h (
in %
) Primary root length
* * *
0
50
100
150
Col0 ZM11 1-3 ZM11 6-4-1 ZM11 8-5Re
lati
ve t
ota
l LR
(P)
de
nsi
ty (
in %
)
Total LR(P) density
Figure 21: Phenotypic analysis of ZM11
The primary root of one of the ZM11 lines was significantly shorter than that of the wild-type Col-0 control
plant, while the other lines also are shorter on average but this was not significant. The total lateral root
density was significantly reduced in all three lines. Note: Two of these lines display a significant difference in
the ratio of emerged lateral roots over non-emerged lateral roots. Error bars indicate standard deviation.
Figure 20: Phenotypic analysis of ZM10
The primary root of one of the ZM10 lines was significantly shorter than that of the wild-type Col-0 control
plant. The total lateral root density was significantly reduced in two lines. Note: One of these lines displayed
a significant difference in the ratio of emerged lateral roots over non-emerged lateral roots. Error bars
indicate standard deviation.
Figure 19: Phenotypic analysis of ZM5
The primary root of one of the ZM5 lines was significantly shorter than that of the wild-type Col-0 control
plant, while the other line was also reduced in primary root length, although not significantly. However, the
total lateral root density was significantly reduced in both lines. Note: The ZM5 7-1 line contained no
emerged lateral roots at all. Error bars indicate standard deviation.

29
The ZM8 line overexpresses a possible maize ortholog of PRODUCTION OF
ANTHOCYANIN PIGMENT1 (PAP1), which is a MYB domain transcription factor that is a
positive regulator of the biosynthesis of anthocyanins (flavonoids) (Matsui et al., 2004). An
interesting observation in the ZM8 lines was a low ratio of emerged lateral roots over non-
emerged lateral root primordia (Figure 22).
The ZM25 line overexpresses a possible maize ortholog of HAESA-LIKE1 (HSL1), which is
a serine/threonine kinase protein that is thought to play a role in cell cycle progression by
leading to the degradation of WEE1 kinase (Crutchley et al., 2009). In general, the ZM25
lines showed an increase in both primary root length and emerged lateral root density (Figure
23).
*
0
50
100
150
Col0 ZM8 3-3 ZM8 9-3Re
lati
ve p
rim
ary
roo
t le
ngt
h (
in %
)
Primary root length
*
0
50
100
150
Col0 ZM8 3-3 ZM8 9-3
Re
lati
ve t
ota
l LR
(P)
de
nsi
ty (
in %
)
Total LR(P) density
-50
0
50
100
150
200
Col0 ZM8 3-3 ZM8 9-3
Re
lati
ve E
me
rge
d/N
on
-em
erg
ed
LR
s ra
tio
(in
%)
Emerged/Non-emerged LRs
* *
0
50
100
150
Col0 ZM25 10-1 ZM25 5-1 ZM25 1-1Re
lati
ve p
rim
ary
roo
t le
ngt
h (
in %
)
Primary root length
* *
0
50
100
150
200
Col0 ZM25 10-1 ZM25 5-1 ZM25 1-1Re
lati
ve la
tera
l ro
ot
de
nsi
ty (
in %
)
Lateral root density
Figure 23: Phenotypic analysis of ZM25
The primary root of two out of three ZM25 lines was significantly longer than that of the wild-type Col-0
control plant. The other ZM25 line also showed an increase in primary root length, although it was not
significant. The emerged lateral root density was significantly increased in two ZM25 lines. No significant
differences in length of the naked zone were observed. Error bars indicate standard deviation.
Figure 22: Phenotypic analysis of ZM8
The primary root of one of the ZM8 lines was
significantly shorter than that of the wild-type Col-
0 control plant, while the other line was also
reduced in primary root length, although not
significantly. The total lateral root density was
significantly reduced in one line. Both lines
display a significant difference in the ratio of
emerged lateral roots over non-emerged lateral
roots. Error bars indicate standard deviation.

30
The ZM14 line overexpresses a possible maize ortholog of WRKY23 (Figure 24). The
primary root in the ZM14 line stopped growing 5-6 days after germination. The total lateral
root density (emerged lateral roots + non-emerged lateral root primordia) in the ZM14 line
was significantly higher than the control and there was a significant decrease in the ratio of
emerged lateral roots over non-emerged lateral root primordia (Figure 25). This ZM14
overexpressing line will be further analyzed in detail in the next section.
1,E-01
1,E+01
1,E+03
1,E+05
Col14 ZM14 7-4
Re
lati
ve t
ran
scri
pti
on
le
vel
ZM14
*
0
50
100
150
Col0 ZM14 7-4Re
lati
ve p
rim
ary
roo
t le
ngt
h (
in %
)
Primary root length
*
0
100
200
300
Col0 ZM14 7-4Re
lati
ve t
ota
l LR
(P)
de
nsi
ty (
in %
)
Total LR(P) density
*
-50
0
50
100
150
200
Col0 ZM14 7-4Re
lati
ve E
me
rge
d/N
on
-em
erg
ed
LR
s ra
tio
(in
%)
Emerged/Non-emerged LRs Figure 25: Phenotypic analysis of ZM14
The primary root of the ZM14 line was
significantly shorter than that of the wild-type Col-
0 control plant. The total lateral root density was
significantly increased. The ZM14 line showed a
significant difference in the ratio of emerged
lateral roots over non-emerged lateral roots. Error
bars indicate standard deviation.
Figure 24: Q-PCR analysis of ZM14
Shown are the relative transcriptional
levels of ZM14 in the wild-type Col-0
control plant and a ZM14 line. The ZM14
line clearly overexpresses the ZM14 gene.
Error bars indicate standard error (n=3).
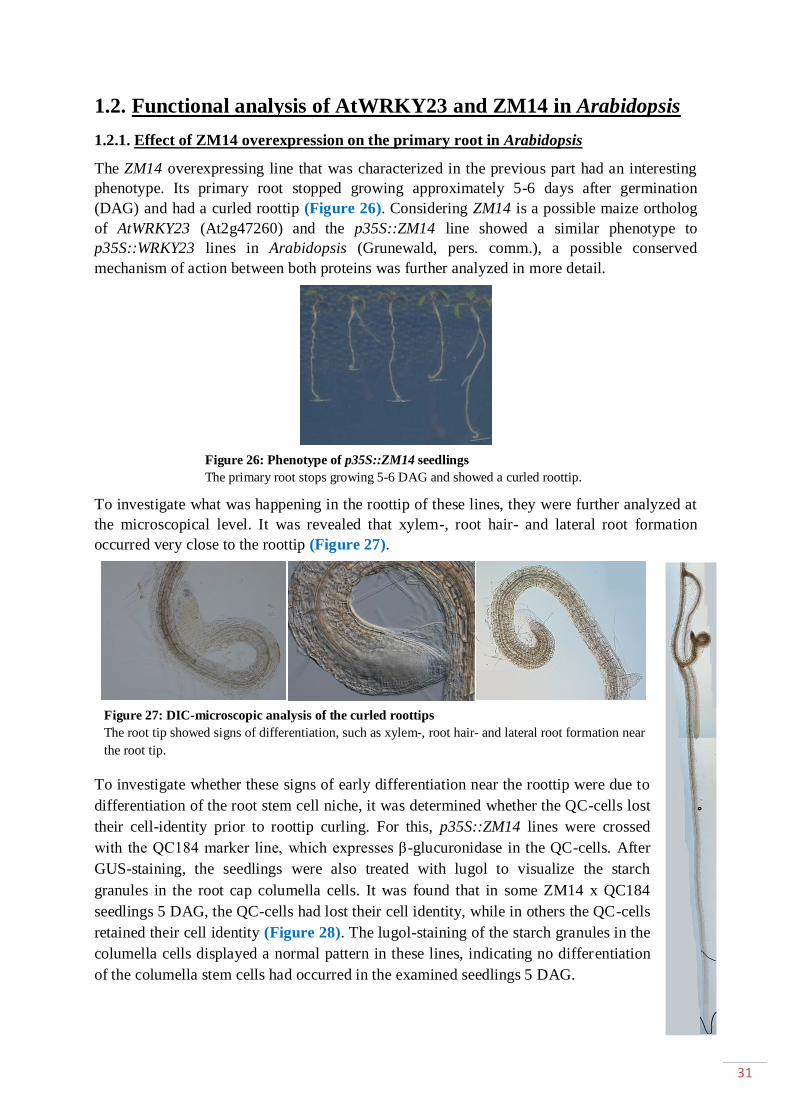
31
1.2. Functional analysis of AtWRKY23 and ZM14 in Arabidopsis
1.2.1. Effect of ZM14 overexpression on the primary root in Arabidopsis
The ZM14 overexpressing line that was characterized in the previous part had an interesting
phenotype. Its primary root stopped growing approximately 5-6 days after germination
(DAG) and had a curled roottip (Figure 26). Considering ZM14 is a possible maize ortholog
of AtWRKY23 (At2g47260) and the p35S::ZM14 line showed a similar phenotype to
p35S::WRKY23 lines in Arabidopsis (Grunewald, pers. comm.), a possible conserved
mechanism of action between both proteins was further analyzed in more detail.
To investigate what was happening in the roottip of these lines, they were further analyzed at
the microscopical level. It was revealed that xylem-, root hair- and lateral root formation
occurred very close to the roottip (Figure 27).
To investigate whether these signs of early differentiation near the roottip were due to
differentiation of the root stem cell niche, it was determined whether the QC-cells lost
their cell-identity prior to roottip curling. For this, p35S::ZM14 lines were crossed
with the QC184 marker line, which expresses β-glucuronidase in the QC-cells. After
GUS-staining, the seedlings were also treated with lugol to visualize the starch
granules in the root cap columella cells. It was found that in some ZM14 x QC184
seedlings 5 DAG, the QC-cells had lost their cell identity, while in others the QC-cells
retained their cell identity (Figure 28). The lugol-staining of the starch granules in the
columella cells displayed a normal pattern in these lines, indicating no differentiation
of the columella stem cells had occurred in the examined seedlings 5 DAG.
Figure 27: DIC-microscopic analysis of the curled roottips
The root tip showed signs of differentiation, such as xylem-, root hair- and lateral root formation near
the root tip.
Figure 26: Phenotype of p35S::ZM14 seedlings
The primary root stops growing 5-6 DAG and showed a curled roottip.

32
To investigate at which time point in development, the QC-cells lose their identity, a time
course experiment (1) was set up. Several ZM14 x QC184 seedlings were harvested daily
starting from 2 DAG until 7 DAG and the number of seedlings showing expression was
counted. The results are displayed in Table 4 and Figure 29. ZM14 x QC184 seedlings lost
their QC cell identity starting from 5 DAG, while the control Col-0 x QC184 seedlings still
contain GUS-stained QC cells at 5 DAG. This loss of QC-identity occurred prior to the roottip
curling event.
Table 4: Time course experiment (1) of QC184 GUS-staining
Col-0 x QC184 ZM14 x QC184
2 DAG 6 out of 6 10 out of 10
3 DAG 5 out of 5 9 out of 9
4 DAG 9 out of 9 9 out of 9
5 DAG 2 out of 2 2 out of 9
6 DAG 4 out of 5 0 out of 7
This table shows how many seedlings of the harvested seedlings display GUS-staining in the QC cells at each
time point in development: from 2 days after germination (DAG) until 7 DAG.
Figure 28: GUS- and lugol-stained p35S::ZM14 x QC184 and QC184 x Col-0 seedlings 5 DAG.
(A) Primary roottip of a QC184 x Col-0 seedling after GUS- and lugol-staining. (B,C) Primary roottip of
p35S::ZM14 x QC184 seedlings after GUS- and lugol-staining. In some of these seedlings, the QC-cells
had lost their cell identity, while in others the QC-cells did not lost their cell identity 5DAG. The
columella cells showed a normal pattern compared to the control.
Figure 29: Time course experiment
(1) of QC184 GUS-staining
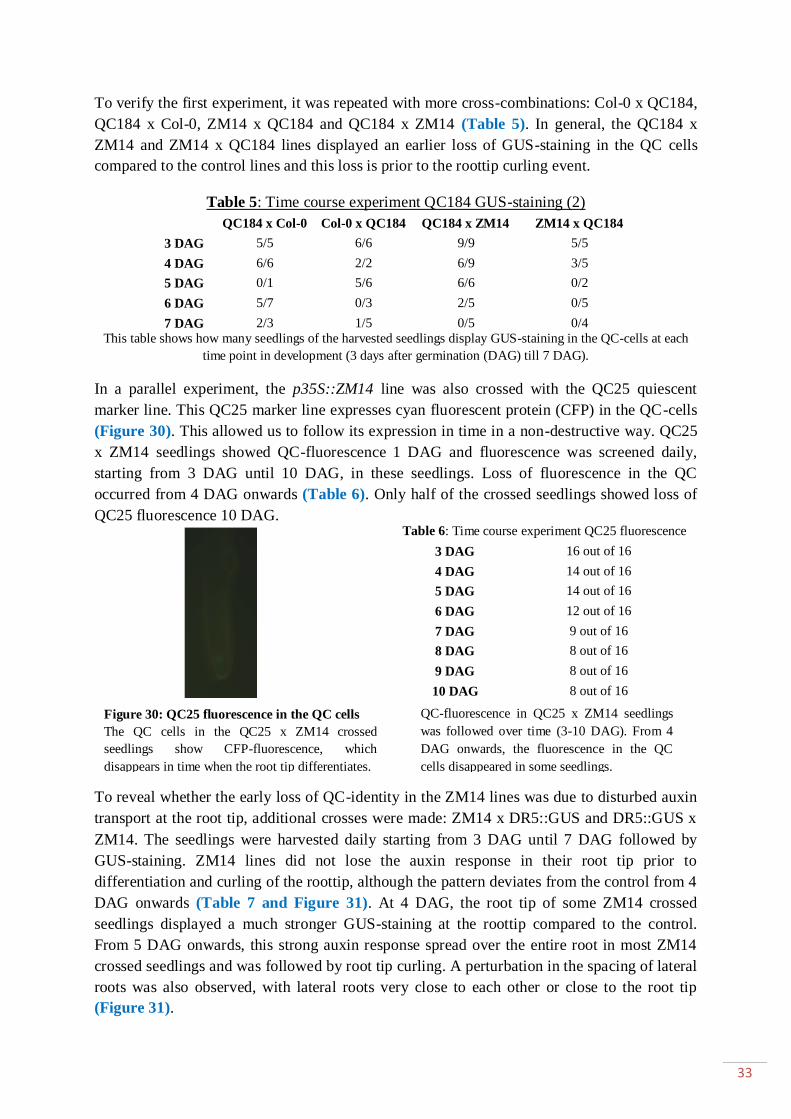
33
To verify the first experiment, it was repeated with more cross-combinations: Col-0 x QC184,
QC184 x Col-0, ZM14 x QC184 and QC184 x ZM14 (Table 5). In general, the QC184 x
ZM14 and ZM14 x QC184 lines displayed an earlier loss of GUS-staining in the QC cells
compared to the control lines and this loss is prior to the roottip curling event.
Table 5: Time course experiment QC184 GUS-staining (2)
QC184 x Col-0 Col-0 x QC184 QC184 x ZM14 ZM14 x QC184
3 DAG 5/5 6/6 9/9 5/5
4 DAG 6/6 2/2 6/9 3/5
5 DAG 0/1 5/6 6/6 0/2
6 DAG 5/7 0/3 2/5 0/5
7 DAG 2/3 1/5 0/5 0/4
This table shows how many seedlings of the harvested seedlings display GUS-staining in the QC-cells at each
time point in development (3 days after germination (DAG) till 7 DAG).
In a parallel experiment, the p35S::ZM14 line was also crossed with the QC25 quiescent
marker line. This QC25 marker line expresses cyan fluorescent protein (CFP) in the QC-cells
(Figure 30). This allowed us to follow its expression in time in a non-destructive way. QC25
x ZM14 seedlings showed QC-fluorescence 1 DAG and fluorescence was screened daily,
starting from 3 DAG until 10 DAG, in these seedlings. Loss of fluorescence in the QC
occurred from 4 DAG onwards (Table 6). Only half of the crossed seedlings showed loss of
QC25 fluorescence 10 DAG.
To reveal whether the early loss of QC-identity in the ZM14 lines was due to disturbed auxin
transport at the root tip, additional crosses were made: ZM14 x DR5::GUS and DR5::GUS x
ZM14. The seedlings were harvested daily starting from 3 DAG until 7 DAG followed by
GUS-staining. ZM14 lines did not lose the auxin response in their root tip prior to
differentiation and curling of the roottip, although the pattern deviates from the control from 4
DAG onwards (Table 7 and Figure 31). At 4 DAG, the root tip of some ZM14 crossed
seedlings displayed a much stronger GUS-staining at the roottip compared to the control.
From 5 DAG onwards, this strong auxin response spread over the entire root in most ZM14
crossed seedlings and was followed by root tip curling. A perturbation in the spacing of lateral
roots was also observed, with lateral roots very close to each other or close to the root tip
(Figure 31).
Table 6: Time course experiment QC25 fluorescence
3 DAG 16 out of 16
4 DAG 14 out of 16
5 DAG 14 out of 16
6 DAG 12 out of 16
7 DAG 9 out of 16
8 DAG 8 out of 16
9 DAG 8 out of 16
10 DAG 8 out of 16
QC-fluorescence in QC25 x ZM14 seedlings
was followed over time (3-10 DAG). From 4
DAG onwards, the fluorescence in the QC
cells disappeared in some seedlings.
Figure 30: QC25 fluorescence in the QC cells
The QC cells in the QC25 x ZM14 crossed
seedlings show CFP-fluorescence, which
disappears in time when the root tip differentiates.

34
Table 7: Time course experiment DR5 GUS-staining
Col-0 x DR5 DR5 x Col-0 ZM14 x DR5 DR5 x ZM14
3 DAG 6 /6 5/5 5/5 4/4
4 DAG 5/5 6/6 5/5 5/5
5 DAG 4/4 6/6 5/5 6/6
6 DAG 6/6 6/6 3/3 6/6
7 DAG 3/ 3 2/2 2/2 5/5 This table shows how many seedlings of the harvested seedlings display GUS-staining in the root tip at each
time point in development (3 – 7 DAG).
Figure 31: Time course experiment of DR5 GUS-staining
The control crossed seedlings (Col-0 x DR5::GUS and DR5::GUS x Col-0) displayed a normal auxin response in
their root tip, with mainly GUS-staining in the QC cells, the stem cell niche and the root cap columella cells,
from 3 DAG until 7 DAG. The ZM14 crossed seedlings (ZM14 x DR5::GUS and DR5::GUS x ZM14) displayed
a normal auxin response in the root tip until 3 DAG. However, starting from 4 DAG, some seedlings displayed a
normal auxin response in the root tip while others display a stronger auxin response in the root tip, in which the
GUS-straining had spread out past the QC cells. Starting from 5 DAG, in most seedlings the auxin response
spread over the entire root. At 7 DAG, the root tip in most seedlings is curled and showed root hair- and even
lateral root formation near the roottip. The spacing of lateral roots was also perturbed, with some lateral roots
initiated very close to each other.

35
In both ZM14 crossed seedlings, the cotyledons showed a strong auxin response prior to the
spread over the entire root, while the control crossed seedlings did not display this strong
GUS-staining in the cotyledons (Figure 32).
1.2.2. Functional analysis of AtWRKY23 in Arabidopsis
Considering both AtWRKY23 and ZM14 were candidate regulators of LRI according to
transcriptomic analyses using the LRIS in both Arabidopsis and maize respectively, the role
of WRKY23 in lateral root development was analyzed (Vanneste et al., 2005; Jansen et al., in
preparation). To determine if AtWRKY23 is involved in LRD, the expression pattern of the
WRKY23 protein was examined by characterizing the GUS-staining in a pWRKY23::uidA
transgenic line. In depth analysis revealed that WRKY23 was expressed in the pericycle
founder cells before their first asymmetric division and it remained expressed during further
lateral root primordium development (Figure 33, A-H). WRKY23 was also expressed in the
roottip (Figure 33, I).
Figure 33: Expression analysis of WRKY23
WRKY23 is expressed in pericycle founder cells before their first asymmetric division (A) and remains
expressed during the entire lateral root primordium developmental process: stage I (B,C,D), stage II (E), stage III
(F), stage IV (G) and stage V (H). WRKY23 is also expressed in the root tip (I).
Figure 32: GUS-staining in the cotyledons.
The cotyledons of the ZM14 crossed seedlings
displayed a strong auxin response prior to the spread
of the auxin response over the entire root, while the
control crossed seedlings did not show this.

36
In an first attempt to functionally characterize the role of WRKY23 during LRD a
p35S::WRKY23-SRDX transgenic line was developed. The WRKY23-SRDX overexpressing
line allows dominant transcriptional repression of WRKY23 target genes. This line expresses
a WRKY23 protein fused to a small domain of 12 amino acids (LDLDLELRLGFA) derived
from an EAR-motif that is designated as the SRDX domain and serves as a repression-
domain that inhibits transcription of the target genes of the transcription factor to which it is
fused (Hiratsu et al., 2003). The phenotype of several transgenic seedlings containing the
p35S::WRKY23-SRDX construct was analyzed. Some seedlings displayed a relatively normal
phenotype, while others displayed severe defects in leaf development (Figure 34). Seedlings
were transferred to soil and their phenotype was analyzed after one week (Figure 35). There
was a high variation in leaf-pigmentation and size of the plants, with smaller plants showing a
stronger pigmentation in the leaves (Figure 35, plant n°7) and the larger plants showing a
normal leaf-pigmentation (Figure 35, plant n°6). Later in development, several plants
displayed high shoot-branching above the rosette (Figure 36, A-D). These plants were also
affected in flower-development, illustrated by clusters of flowerbuds, while some flowers
contained five petals instead of four (Figure 36, E-F). Some plants showed reduced fertility
or were completely sterile.
Figure 35: Phenotype of p35S::WRKY23-SRDX transgenic lines (T1) one week after transfer to soil.
Figure 34: Phenotypic analysis of p35S::WRKY23-SRDX seedlings (T2).
Some transgenic seedlings had defects in leaf-development such as cup-shaped cotyledons.

37
Figure 36: Shoot-phenotypes of flowering p35S::WRKY23-SRDX transgenic lines (T1)
To determine whether there was a link between the expression level of WRKY23-SRDX and
the phenotype variation, a real-time qRT-PCR analysis was performed using WRKY23-
specific primers (Figure 37). There was no clear link between the expression level and the
phenotypic differences. To determine whether the phenotypic variation might have been due
to loss of transcription of the SRDX domain in some seedlings, a semi-quantitative RT-PCR
reaction was performed on the cDNA of the p35S::WRKY23-SRDX lines (Figure 37).
However, all p35S::WRKY23-SRDX lines contained the SRDX domain.
Figure 37: Expression analysis of p35S::WRKY23-SRDX T1 transgenic lines
(A) The relative transcription level of WRKY23(-SRDX) in Col-0 control plant and 19 transgenic T1
p35S::WRKY23-SRDX lines (error bars indicate standard error). (B) Semi-quantitative RT-PCR reaction for
checking the presence of the SRDX-construct in the p35S::WRKY23-SRDX lines. The housekeeping protein
EEF1α4 was used as a reference. All p35S::WRKY23-SRDX lines contained the SRDX domain, indicated by the
band at the expected size of approximately 300 bp. All samples (including the Col-0 control) showed an
additional PCR-amplicon of less than 200 bp in size, indicating an aspecificity of the primers used. The
Eurogentec Smartladder SFTM
was used.
0
10
20
30
40
50
60
70
80
90
100
Co
l0
SRD
X 1
SRD
X 2
SRD
X 3
SRD
X 4
SRD
X 5
SRD
X 6
SRD
X 7
SRD
X 8
SRD
X 9
SRD
X 10
SRD
X 11
SRD
X 12
SRD
X 13
SRD
X 14
SRD
X 15
SRD
X 16
SRD
X 17
SRD
X 18
SRD
X 19
Rel
ativ
e tr
ansc
rip
tio
n le
vel
WRKY23-SRDX expression level

38
1.3. Characterization of the maize LRIS
1.3.1. Real-time qRT-PCR analysis of cell cycle genes in the maize LRIS system
We wanted to determine in which cell cycle phase the pericycle cells are residing on NPA by
real-time qRT-PCR analysis of cell cycle genes regulation during the LRIS. For the maize
LRIS, seeds were sown in paper rolls placed in tubes containing sterile water supplemented
with 50 µM NPA in DMSO. After 64 hours, the paper rolls were transferred to new tubes
containing sterile water supplemented with 50 µM NAA in DMSO. For control samples,
seeds were germinated in sterile water with an equal amount of DMSO added. Roots were
sampled after 64 hours on water, 64 hours on NPA, 64 hours on NPA followed by 2 hours on
NAA, 64 hours on NPA followed by 3 hours on NAA and 64 hours on NPA followed by 4
hours on NAA. For sampling, root sections of the root tip (0-0.5 cm) were collected and root
sections of in the sampling zone (0.5-1.0 cm) were stripped from their cortex and the cortex
and stele were collected separately. After RNA extraction and cDNA synthesis, a real-time
qRT-PCR analysis was performed using primers for cell cycle genes to determine in which
phase the cells in the stele are residing during the LRIS. It was previously determined that the
pericycle cells are dividing 3 hours after transfer to NAA, so special attention will go to cell
cycle genes that are up- or down-regulated at this time-point in the LRIS (Jansen et al., in
preparation). The results are listed in the figures 38-48.
Figure 38: Q-PCR analysis of A-type cyclins during the maize LRIS
Shown are the relative transcription levels of four A-type cyclins during the maize LRIS. CYCA1;1 is
upregulated 3 hours after transfer to NAA, while CYCA3;1 is downregulated 3 hours after transfer to NAA.
CYCA3;2 and CYCA3;4 are not differentially expressed during the LRIS. Genes are up- or down-regulated in
case of more than 2-fold change compared to the control. Error bars indicate standard error (n=3).
0
5
10
15
H2O NPA NAA2h NAA3h NAA4h
Re
lati
ve t
ran
scri
pti
on
le
vel
CYCA1;1
0
0,5
1
1,5
2
H2O NPA NAA2h NAA3h NAA4h
Re
lati
ve t
ran
scri
pti
on
le
vel
CYCA3;1
0
0,5
1
1,5
H2O NPA NAA2h NAA3h NAA4h
Re
lati
ve t
ran
scri
pti
on
le
vel
CYCA3;2
0
0,5
1
1,5
H2O NPA NAA2h NAA3h NAA4h
Re
lati
ve t
ran
scri
pti
on
le
vel
CYCA3;4

39
Figure 39: Q-PCR analysis of B-type cyclins during the maize LRIS
Shown are the relative transcription levels of four B-type cyclins during the maize LRIS. CYCB1;1, CYCB1;3
and CYCB2;1 are upregulated 3 hours after transfer to NAA, while CYCB2;2 is not differentially expressed.
Genes are up- or down-regulated in case of more than 2-fold change compared to the control. Error bars indicate
standard error (n=3).
Figure 40: Q-PCR analysis of D-type cyclins during the maize LRIS
Shown are the relative transcription levels of three D-type cyclins during the maize LRIS. CYCD1;1 is
downregulated 4 hours after transfer to NAA, while CYCD4;1 and CYCD5;1 are not differentially expressed
during the LRIS. Genes are up- or down-regulated in case of more than 2-fold change compared to the control.
Error bars indicate standard error (n=3).
0
2
4
6
8
H2O NPA NAA2h NAA3h NAA4h
Re
lati
ve t
ran
scri
pti
on
le
vel
CYCB1;1
0
1
2
3
4
H2O NPA NAA2h NAA3h NAA4h
Re
lati
ve t
ran
scri
pti
on
le
vel
CYCB1;3
0
2
4
6
8
H2O NPA NAA2h NAA3h NAA4h
Re
lati
ve t
ran
scri
pti
on
le
vel
CYCB2;1
0
0,5
1
1,5
2
H2O NPA NAA2h NAA3h NAA4h
Re
lati
ve t
ran
scri
pti
on
le
vel
CYCB2;2
0
0,5
1
1,5
H2O NPA NAA2h NAA3h NAA4h
Re
lati
ve t
ran
scri
pti
on
le
vel
CYCD1;1
0
0,5
1
1,5
2
H2O NPA NAA2h NAA3h NAA4h
Re
lati
ve t
ran
scri
pti
on
le
vel
CYCD4;1
0
0,5
1
1,5
2
H2O NPA NAA2h NAA3h NAA4h
Re
lati
ve t
ran
scri
pti
on
le
vel
CYCD5;1

40
Figure 41: Q-PCR analysis of CYCH during the maize LRIS
Shown is the relative transcription levels of CYCH during the maize LRIS. CYCH is downregulated 4 hours
after transfer to NAA. Genes are up- or down-regulated in case of more than 2-fold change compared to the
control. Error bars indicate standard error (n=3).
Figure 42: Q-PCR analysis of CDKs during the maize LRIS
Shown are the relative transcription levels of CDKA1:1 and CDKB2;1 during the maize LRIS. CDKA1;1 is
upregulated 4 hours after transfer to NAA, while CDKB2;1 is not differentially expressed during the LRIS.
Genes are up- or down-regulated in case of more than 2-fold change compared to the control. Error bars indicate
standard error (n=3).
Figure 43: Q-PCR analysis of DPb during the maize LRIS
Shown is the relative transcription level of DPb during the maize LRIS. DPb is not differentially expressed
during the LRIS. Genes are up- or down-regulated in case of more than 2-fold change compared to the control.
Error bars indicate standard error (n=3).
0
0,5
1
1,5
2
H2O NPA NAA2h NAA3h NAA4h
Re
lati
ve t
ran
scri
pti
on
le
vel
CYCH
0
0,5
1
1,5
2
2,5
H2O NPA NAA2h NAA3h NAA4h
Re
lati
ve t
ran
scri
pti
on
le
vel
CDKA1;1
0
0,5
1
1,5
2
H2O NPA NAA2h NAA3h NAA4h
Re
lati
ve t
ran
scri
pti
on
le
vel
CDKB2;1
0
0,5
1
1,5
2
H2O NPA NAA2h NAA3h NAA4h
Re
lati
ve t
ran
scri
pti
on
le
vel
DPb

41
Figure 44: Q-PCR analysis of WEE1 during the maize LRIS
Shown is the relative transcription level of WEE1 kinase during the maize LRIS. WEE1 is upregulated 3 hours
after transfer to NAA. Genes are up- or down-regulated in case of more than 2-fold change compared to the
control. Error bars indicate standard error (n=3).
Figure 45: Q-PCR analysis of DEL-proteins during the maize LRIS
Shown are the relative transcription levels of DEL1 and DEL2 during the maize LRIS. DEL1 is upregulated 3
hours after transfer to NAA, while DEL2 is not differentially expressed during the LRIS. Genes are up- or down-
regulated in case of more than 2-fold change compared to the control. Error bars indicate standard error (n=3).
Figure 46: Q-PCR analysis of CKS-proteins during the maize LRIS
Shown are the relative transcription levels of CKS1 and CKS2 during the maize LRIS. CKS1 is upregulated 3
hours after transfer to NAA, while CKS2 is not differentially expressed during the LRIS. Genes are up- or down-
regulated in case of more than 2-fold change compared to the control. Error bars indicate standard error (n=3).
0
2
4
6
H2O NPA NAA2h NAA3h NAA4h
Re
lati
ve t
ran
scri
pti
on
le
vel
WEE1
0
2
4
6
8
10
H2O NPA NAA2h NAA3h NAA4h
Re
lati
ve t
ran
scri
pti
on
le
vel
DEL1
0
0,5
1
1,5
H2O NPA NAA2h NAA3h NAA4h
Re
lati
ve t
ran
scri
pti
on
le
vel
DEL2
0
1
2
3
4
H2O NPA NAA2h NAA3h NAA4h
Re
lati
ve t
ran
scri
pti
on
le
vel
CKS1
0
0,5
1
1,5
H2O NPA NAA2h NAA3h NAA4h
Re
lati
ve t
ran
scri
pti
on
le
vel
CKS2

42
Figure 47: Q-PCR analysis of KRPs during the maize LRIS
Shown are the relative transcription levels of KRP1, KRP3 and KRP4 during the maize LRIS. KRP3 is
downregulated 3 hours after transfer to NAA, while KRP1 and KRP4 levels seem to be slightly higher in the
NPA sample. Genes are up- or down-regulated in case of more than 2-fold change compared to the control. Error
bars indicate standard error (n=3).
Figure 48: Q-PCR analysis of E2F during the maize LRIS
Shown is the relative transcription level of E2F during the maize LRIS. E2F is not differentially expressed
during the LRIS. Genes are up- or down-regulated in case of more than 2-fold change compared to the control.
Error bars indicate standard error (n=3).
0
0,5
1
1,5
H2O NPA NAA2h NAA3h NAA4h
Re
lati
ve t
ran
scri
pti
on
le
vel
KRP1
0
0,5
1
1,5
H2O NPA NAA2h NAA3h NAA4h
Re
lati
ve t
ran
scri
pti
on
le
vel
KRP3
0
0,5
1
1,5
H2O NPA NAA2h NAA3h NAA4h
Re
lati
ve t
ran
scri
pti
on
le
vel
KRP4
0
0,5
1
1,5
2
H2O NPA NAA2h NAA3h NAA4h
Re
lati
ve t
ran
scri
pti
on
le
vel
E2F

43
1.3.2. Characterizing the maize LRIS using flow cytometry
In another approach of characterizing the LRIS in maize in more detail and determine in
which cell cycle phase the pericycle cells are residing on NPA, flow cytometry analysis was
performed on the stele of the sampling zone (0.5-1.0 cm). For this, three experiments were set
up. In a first experiment, a normal LRIS for maize was used in which seeds were germinated
on 50 µM NPA and after 64 hours transferred to 50 µM NAA (see Addendum for more
details on set up). In a second experiment, the LRIS was repeated but this time nocodazole
was supplemented, which is believed to interfere with microtubule polymerization and is
generally used to arrest cells in the M-phase of the cell cycle. Cells treated with nocodazole
can enter mitosis, but cannot form metaphase spindles because of inference of the
microtubules and therefore arrest in the M-phase. For this, seeds were germinated on 50 µM
NPA, followed by a transfer to 50 µM NPA supplemented with 10 µM nocodazole after 62
hours, followed by a transfer to 50 µM NAA supplemented with 10 µM nocodazole after 3
hours (see Addendum for more details on set up). In a third experiment, the LRIS was
repeat but this time hydroxyurea (HU) was supplemented, which is believed to interfere with
deoxyribonucleotide production by inhibiting ribonucleotide reductase enzymes and therefore
interferes with the S-phase during cell cycle progression in which these deoxyribonucleotides
are needed for genome duplication. For this, seeds were germinated on 50 µM NPA, followed
by a transfer to 50 µM NPA supplemented with 3 mM HU after 62 hours, followed by a
transfer to 50 µM NAA supplemented with 3 mM HU after 3 hours (see Addendum for
more details on set up). In both the nocodazole and HU experiment, the drugs were given 3
hours before transfer to NAA, to ensure that the drug was taken up by the root system and
could exert its effect before the NAA treatment. In a previous experiment, the pretreatment
was not included and the effects of the drugs were abolished, probably because NAA could
enter the root system more efficiently and therefore the drugs could not inhibit cell cycle
progression in time. The results are shown in Figure 49.
After flow cytometry analysis, it was revealed that in the normal LRIS, the amount of cells in
the stele that contained a 4C-content decreased, while the amount of cells that contained a 2C-
content increased 3-4 hours after transfer to NAA. In the LRIS supplemented with
nocodazole, the amount of cells in the stele that contained a 2C-content showed a smaller
increase compared to the normal LRIS 3-4 hours after transfer to NAA. In the LRIS
supplemented with nocodazole, the amount of cells in the stele with an 8C-content was higher
compared to the normal LRIS. In the LRIS supplemented with nocodazole, the amount of
cells in the stele that contained a 2C-content did not show a decrease but rather an increase
compared to the normal LRIS 3 hours after transfer to NAA.

44
Figure 49: Flow cytometry analysis of the maize LRIS
Shown are the C-contents of the cells of the stele in the sampling zone (0.5-1.0 cm). The cells with a 2C-conent
are marked by the A-zone, cells with a 4C-content are marked by the B-zone and cells with an 8C-content are
marked by the C-zone. The left column shows the normal LRIS, the middle column shows the LRIS
supplemented with nocodazole and the right column shows the LRIS supplemented with hydroxyurea (HU).

45
1.3.3. Anatomical characterization of the pericycle layer after long NPA treatment
Microscopic analysis was performed on root sections from maize seedlings grown 6 days on
50 µM NPA and from seedlings grown 6 days on 50 µM NPA followed by 4 days 50 µM
NAA. Both transversal and longitudinal microtome sections were made to determine what
was happening to the pericycle layer when seedlings were grown on NPA, and what happened
when the seedlings were transferred to NAA. It was previously found that the pericycle
showed multilayered structures when grown for 5 days on 50 µM NPA (Jansen et al., in
preparation). The results are given in Figures 50-57.
Figure 52: Longitudinal section of root section 0.5-1.0 cm from maize seedling grown 6 days on 50 µM NPA.
The arrow indicates radially swollen pericycle cells (p) at the phloem pole.
Figure 51: Transversal sections of root section 0.5-1.0 cm from maize seedlings grown 6 days on 50 µM NPA.
The arrow indicates radially swollen pericycle cells (p) at the phloem pole (e = endodermal cells).
Figure 50: Transversal sections of root section 0-0.5 cm from maize seedlings grown 6 days on 50 µM NPA.
The arrow indicates radially swollen pericycle cells (p) at the phloem pole (e = endodermal cells).
e p
e p
p
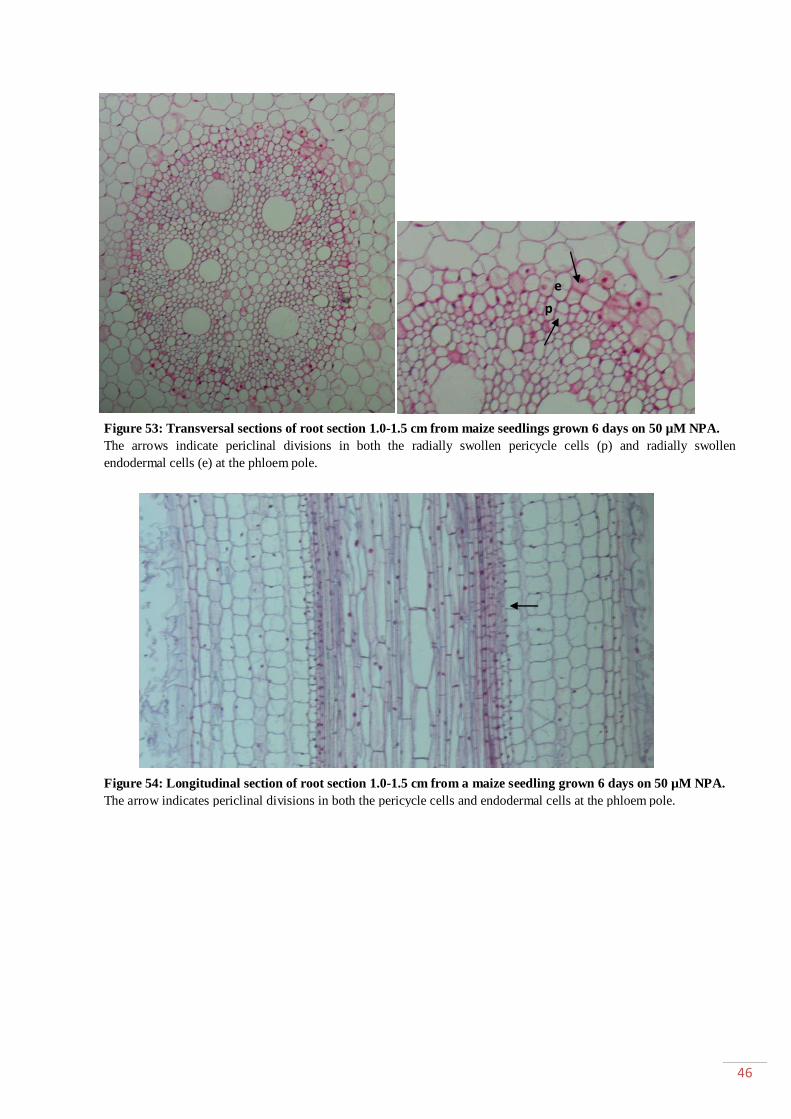
46
Figure 54: Longitudinal section of root section 1.0-1.5 cm from a maize seedling grown 6 days on 50 µM NPA.
The arrow indicates periclinal divisions in both the pericycle cells and endodermal cells at the phloem pole.
Figure 53: Transversal sections of root section 1.0-1.5 cm from maize seedlings grown 6 days on 50 µM NPA.
The arrows indicate periclinal divisions in both the radially swollen pericycle cells (p) and radially swollen
endodermal cells (e) at the phloem pole.
e
p

47
Figure 57: Transversal sections of root section 0.5-1.0 cm from maize seedlings grown 6 days on 50 µM NPA
followed by 4 days on 50 µM NAA.
Lateral root formation occurs at the entire pericycle layer instead of only at a single phloem pole.
Figure 56: Longitudinal section of root section 1.5-2.0 cm
from a maize seedling grown 6 days on 50 µM NPA.
The arrow indicates periclinal divisions in both the pericycle
cells and endodermal cells at the phloem pole.
Figure 55: Transversal section of root section 1.5-2.0 cm from maize seedlings grown 6 days on 50 µM NPA.
The arrows indicate periclinal divisions in both the pericycle cells and endodermal cells at the phloem poles.

48
1.3.4. Transgenic maize lines containing DR5 ::RFP or pPIN1 ::PIN1-YFP
To verify that the received maize lines containing the DR5::RFP or pPIN1::PIN1-YFP
construct truly contained these constructs, a PCR reaction was performed on DNA isolated
from collected roots using primers specific for the RFP-sequence and YFP-sequence. For the
transgenic maize lines containing the DR5::RFP construct, it was found that that eight out of
ten lines contained the expected amplicon of approximately 400 bp (Figure 58). For the
transgenic maize lines containing the pPIN1::PIN1-YFP construct a lot of aspecific amplicons
were generated (Figure 60). This is explained by the primer pair, which had to generate an
amplicon of approximately 4 kb, therefore giving rise to many aspecific amplicons during the
long elongation time in the PCR reaction. Two alternative approaches were used to confirm
that the transgenic maize lines contained the inserted gene construct. In a first approach,
another PCR reaction was performed on the DNA isolated from the roots, this time using
primers for the BAR gene, which confers BASTA-resistance to the transgenic maize lines
(Figure 59 and 61). From this, we could determine that all DR5::RFP transgenic lines
contained the expected PCR-amplicon of approximately 400 bp for the BAR gene, while for
the pPIN1::PIN1-YFP transgenic lines, some lines did not contain the BAR gene. In a second
approach, a BASTA-resistance test was performed on the fourth leaf of the transgenic plants
after transfer to soil (Figure 62). Combining all the previous results, only the DR5::RFP
transgenic lines that tested positive in all three tests were kept for further propagation. These
lines will be used to verify the auxin response during the maize LRIS.
Figure 59: PCR analysis on DR5 ::RFP transgenic lines using BAR-specific primers.
Shown are the results of a PCR-reaction using BAR-specific primers on DNA extracted from root
material of DR5::RFP transgenic maize lines. The Eurogentec Smartladder SFTM
was used.
Figure 58: PCR analysis on DR5::RFP constructs using RFP-specific primers
Shown are the results of a PCR-reaction using RFP-specific primers on DNA isolated from root material from
transgenic DR5::RFP maize lines. The DR5::RFP djx7 and dj3 11 lines did not contain PCR-amplicons. The
Eurogentec Smartladder SFTM
was used.

49
Figure 62: BASTA-resistance test
Shown are the results of the BASTA-resistance test. The leaf of a line that is BASTA-resistant remains normal,
while the leaf of a BASTA-sensitive line start to wilt after a couple of days. The transgenic maize lines that were
BASTA-resistant are indicated in green, while BASTA-sensitive lines are indicated in red.
Figure 61: PCR analysis on pPIN1 ::PIN1-YFP transgenic maize lines using BAR-specific primers.
Shown are the results of a PCR-reaction using BAR-specific primers on DNA extracted from root material
of pPIN1::PIN1-YFP transgenic maize lines. The Eurogentec Smartladder SFTM
was used.
Figure 60: PCR analysis on pPIN1 ::PIN1-YFP constructs using YFP-specific primers
Shown are the results of a PCR-reaction using YFP-specific primers on DNA extracted from
root material of pPIN1::PIN1-YFP transgenic maize lines. A lot of aspecific amplicons were
generated. The Eurogentec Smartladder SFTM
was used.

50
PART IV: DISCUSSION
1.1. Functional characterization of the ZM and AT lines
Phenotypical analysis of the ZM overexpressing lines revealed that some ZM proteins caused
an increase in primary root length and/or an increase in lateral root density, while others
showed an opposite phenotype. This indicates that not every ZM protein acted as a positive
regulator of root development, although they were upregulated in the LRIS in maize (Lejan et
al., in preparation). It should still be noted that the ZM proteins were ectopically
overexpressed in every tissue, which might therefore explain different phenotypes than those
expected.
A general observation during phenotypically characterizing the ZM4, ZM5, ZM10 and ZM11
overexpressing lines was that all four lines showed a similar phenotype: a reduced primary
root growth and a reduced total lateral root density (emerged lateral roots and non-emerged
lateral root primordia taken into account) (Figures 18-21). Overexpression of these Aux/IAA
maize orthologs seemed to have triggered a phenotype similar to that of dominant negative
iaa mutants. A possible explanation for this might be that domain II in the maize orthologs
differs from the consensus one in AtAux/IAA proteins and therefore these proteins are not
recognized by TIR1 in Arabidopsis and therefore not proteasome-degraded in the presence of
auxin.
ZM4 is a possible maize ortholog of AtIAA18 (At1g51950). In Arabidopsis, the gain-of-
function mutant iaa18 mutant that contains a mutation in domain II and is therefore not
proteasome-degraded, shows a strong defect in lateral root formation and a decrease in
primary root length (Uehara et al., 2008). It has been shown that IAA18 is normally expressed
in most tissues and is also expressed during the early stages of lateral root development
(Uehara et al., 2008). IAA18 has been shown to interact with ARF7 and ARF19 and might
therefore inhibit LRI by suppressing ARF7- and ARF19-induced transcription of downstream
targets involved in LRI, until the LRI event is beneficial for the plant.
ZM5 and ZM 11 are possible maize orthologs of AtIAA13 (At2g33310). The ZM5 and ZM11
overexpressing lines displayed a significant decrease in lateral root formation. They contained
much less lateral root primordia, indicating that they are involved in the early events of LRD.
Both lines showed a low ratio of emerged lateral roots over non-emerged lateral root
primordia indicating that the early stage primordia that did develop were unable to further
develop and emerge from the parent root. This suggests that they are also involved in further
lateral root primordium development after LRI.
ZM10 is a possible maize ortholog of AtIAA20 (At2g46990). Some ZM10 overexpressing
lines displayed a decrease in length of the primary root and a decrease in lateral root
formation, indicating that ZM10 is involved in root development. This phenotype may be
linked with the overexpression phenotype of a domain II-less AtIAA20 protein in
Arabidopsis. Overexpression of this protein showed a defect in the RAM of the primary root
and of the lateral roots, possibly affecting the stem cell niche (Sato and Yamamoto, 2008).

51
ZM25 is a possible maize ortholog of HSL1 (HAESA-LIKE 1) (At1g28440). The HSL1
protein is a serine/threonine kinase protein that is thought to play a role in cell cycle
progression by leading to the degradation of WEE1 kinase (Crutchley et al., 2009). Some
ZM25 overexpressing lines showed an increase in both the length of the primary root and the
lateral root density (Figure 23). This phenotype might be explained by an increase in cell
division due to degradation of the WEE1 kinase, which is responsible for cell cycle arrest at
the G2/M cell cycle checkpoint, in which the genome is checked for replication errors or
DNA damage. It would be interesting in the future to see whether the growth rate of these
lines under different stress conditions would be higher than wild-type plants.
ZM8 is a possible maize ortholog of PRODUCTION OF ANTHOCYANIN PIGMENT1
(PAP1), which is a MYB domain transcription factor that is a positive regulator of the
biosynthesis of anthocyanins (flavonoids) (Matsui et al., 2004). This is an interesting link
between flavonoid biosynthesis and an effect on root development, when it is combined with
the role of WRKY23 and its possible maize ortholog ZM14 in flavonoid biosynthesis
regulation. This suggests that there might be a general regulation of root development by
flavonoid-induced auxin transport regulation.
1.2. Functional characterization of WRKY23 and ZM14
WRKY23 (At2g47260) and a possible maize ortholog ZM14 were identified as candidate
regulators for LRI in two microarray experiments using the LRIS in both Arabidopsis and
maize (Vanneste et al., 2005; Jansen et al., in preparation). A possible conserved function of
both proteins was investigated.
When WRKY23 is overexpressed in Arabidopsis, the roottip curls and shows signs of
differentiation, such as the formation of root hair cells, differentiation of xylem down to the
root tip and loss of QC identity marker gene expression (Grunewald et al., in preparation).
After further analysis, WRKY23 was believed to play a role in maintaining the root stem cell
niche by modulating auxin transport by locally finetuning biosynthesis of flavonoids, which
are believed to interact with auxin transporters (Jacobs and Rubery, 1988; Grunewald et al., in
preparation).
In the p35S::ZM14 line, the primary root stopped growing 6-7 DAG and a similar curled
roottip was formed. To determine whether ZM14 might exert a similar function in maize, it
was further characterized in more detail. After microscopic analyses, it was revealed that the
ZM14 overexpressing line showed signs of differentiation close to the roottip, such as the
formation of root hair cells and a differentiation of xylem down to the root tip. To determine
whether these differentiation events were related to loss QC cell identity and an accompanied
loss of the stem cell niche, the ZM14 overexpressing line was crossed with two QC marker
lines: QC184 and QC25. It was found that the QC cells were correctly specified during early
development, indicated by GUS-stained QC cells in the ZM14 x QC184 seedlings and
fluorescence in the QC of the QC25 x ZM14 seedlings 1-3 DAG (Figure 29 and 30).
However, starting from 4-5 DAG, the QC cells in the ZM14 overexpressing line lost their cell
identity, indicated by loss of GUS-staining and fluorescence in the QC cells in the ZM14 x
QC184 and QC25 x ZM14 lines, respectively (Figure 30 and Table 6). It was found that this
occurred prior to the roottip curling event. Considering the main function of the QC-cells is
the maintenance of the root stem cell niche, the RAM became soon completely differentiated,
followed by the xylem, root hair and lateral root formation very close to the curled roottip.

52
It has been shown that an auxin maximum in the QC-cells is very important for retaining their
QC-identity (Sabatini et al., 1999; Sabatini et al., 2003; Aida et al., 2004). Therefore, to
determine whether the auxin response in the QC-cells of ZM14 overexpressing lines
diminished prior to loss of QC cell identity, the ZM14 overexpressing line was crossed with a
DR5::uidA reporter line. However, the auxin response did not diminish; instead a much
stronger auxin response was found in the roottip 4 DAG (Figure 31). Further in development
(5-6 DAG), this strong auxin response spread over the entire root, followed by roottip
differentiation (Figure 31). A strong auxin response was also present in the cotyledons, which
constitute the main biosynthesis site (Figure 32). The strong auxin response first appeared in
the root apex and in the cotyledons, both auxin biosynthesis sites, and then gradually spread
over the entire root from both sites. This indicated a change in auxin sensitivity or more likely
auxin transport. Considering WRKY23 was found to regulate auxin transport in the roottip,
there is an indication for a possible similar mode of action with the ZM14 protein, such that it
might regulate flavonoid production and thereby have an effect on auxin transport
(Grunewald et al., in preparation). Interestingly, during the screening for QC-fluorescence in
the QC25 x ZM14 seedlings, an increase in fluorescence in the root was observed, possibly
due to an accumulation of flavonoids. To determine whether there is an increase in flavonoids
in the root, a DPBA-staining (diphenylboric acid 2-aminoethylester) will need to be
performed in the future. DPBA complexes with flavonoids and thereby increases their
fluorescence properties (Buer et al., 2007).
The ZM14 overexpressing lines showed lateral root formation very close to each other
(Figure 31), indicating that the endogenous system that regulates lateral root spacing is
perturbed. This endogenous system functions in the basal meristem just above the RAM
region and displayed a strong auxin response in the ZM14 overexpressing seedlings 4 DAG
and might therefore have lead to the aberrant lateral root spacing. Interestingly, while the
primary root ceased growth and showed differentiation, the lateral roots did not display these
defects (at least not until 10 DAG) (Figure 27).
A possible role for WRKY23 in lateral root development was also further investigated.
Expression analysis revealed that WRKY23 is expressed in the primary roottip and during
lateral root development (Figure 33). WRKY23 is expressed in the pericycle founder cells
before their first asymmetric division (Grunewald, pers. comm.), indicating a role in the LRI
process. WRKY23 remained expressed in the lateral root primordium during its entire
developmental process, indicating a possible role in cell patterning.
In a first attempt to functionally characterize the role of WRKY23 during LRD, a transgenic
p35S::WRKY23-SRDX line was developed. The WRKY23-SRDX overexpressing line allows
studying the effects of dominant repression of WRKY23 target genes. Phenotypic analysis of
p35S::WRKY23-SRDX T1 and T2 transgenic lines, revealed several abnormalities in
development. Seedlings showed defects in leaf development, such as cup-shaped cotyledons
and malformed leaves (Figure 34). Further in development, these transgenic plants showed a
variation in size and pigmentation (Figure 35), and in flowering transgenic plants there was a
high degree of shoot branching just above the rosette and effects on flower development
(Figure 36). A link between the transcription level of WRKY23-SRDX and the different
phenotypes was not found (Figure 37). An interesting observation was the darker
pigmentation in the leaves of some transgenic plants (Figure 35). This could have been due to
different flavonoid content in the leaves. Considering WRKY23 might be involved in
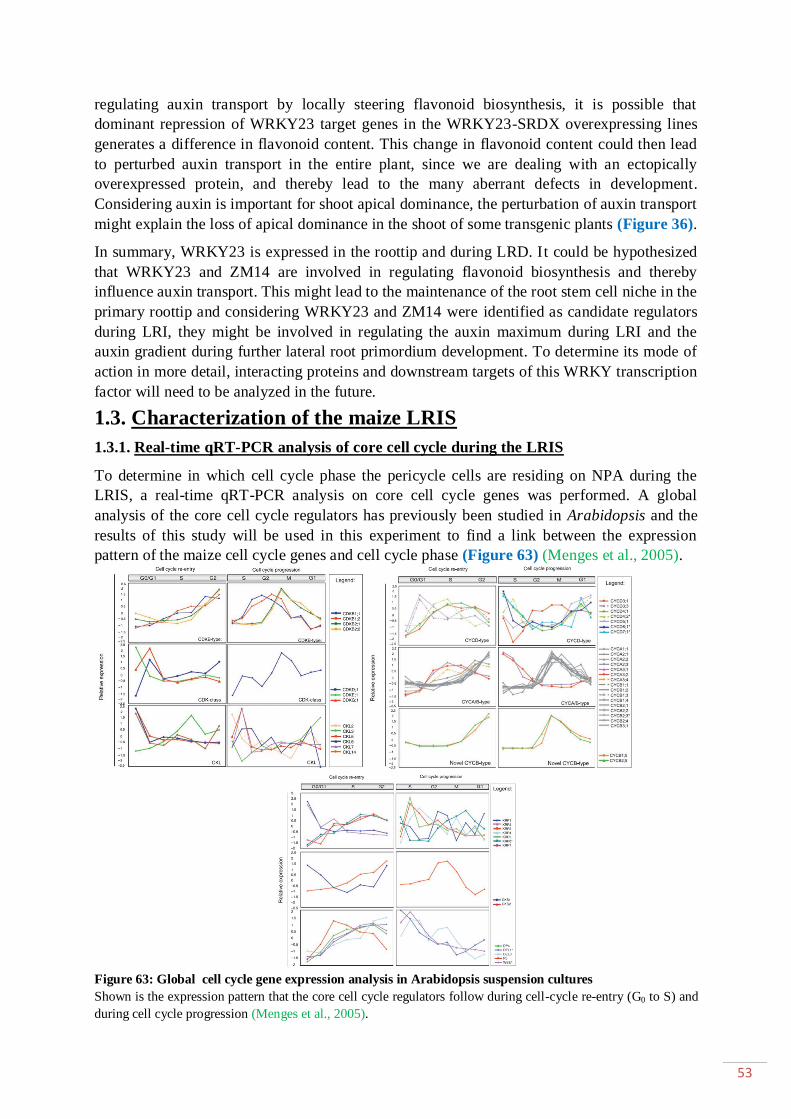
53
regulating auxin transport by locally steering flavonoid biosynthesis, it is possible that
dominant repression of WRKY23 target genes in the WRKY23-SRDX overexpressing lines
generates a difference in flavonoid content. This change in flavonoid content could then lead
to perturbed auxin transport in the entire plant, since we are dealing with an ectopically
overexpressed protein, and thereby lead to the many aberrant defects in development.
Considering auxin is important for shoot apical dominance, the perturbation of auxin transport
might explain the loss of apical dominance in the shoot of some transgenic plants (Figure 36).
In summary, WRKY23 is expressed in the roottip and during LRD. It could be hypothesized
that WRKY23 and ZM14 are involved in regulating flavonoid biosynthesis and thereby
influence auxin transport. This might lead to the maintenance of the root stem cell niche in the
primary roottip and considering WRKY23 and ZM14 were identified as candidate regulators
during LRI, they might be involved in regulating the auxin maximum during LRI and the
auxin gradient during further lateral root primordium development. To determine its mode of
action in more detail, interacting proteins and downstream targets of this WRKY transcription
factor will need to be analyzed in the future.
1.3. Characterization of the maize LRIS
1.3.1. Real-time qRT-PCR analysis of core cell cycle during the LRIS
To determine in which cell cycle phase the pericycle cells are residing on NPA during the
LRIS, a real-time qRT-PCR analysis on core cell cycle genes was performed. A global
analysis of the core cell cycle regulators has previously been studied in Arabidopsis and the
results of this study will be used in this experiment to find a link between the expression
pattern of the maize cell cycle genes and cell cycle phase (Figure 63) (Menges et al., 2005).
Figure 63: Global cell cycle gene expression analysis in Arabidopsis suspension cultures
Shown is the expression pattern that the core cell cycle regulators follow during cell-cycle re-entry (G0 to S) and
during cell cycle progression (Menges et al., 2005).
54
From our qRT-PCR analysis, it seems that CYCA1;1 is upregulated and CYCA3;1 is
downregulated 3 hours after transfer to NAA, while the other two A-type cyclins did not show
a significant change in expression pattern (Figure 38). In the experiment of Menges et al.,
CYCA1;1 and CYCA3;1 are respectively upregulated and downregulated during the G2/M
transition in cell cycle progression (Figure 63). Thus, from the expression analysis of the A-
type cyclins, it seems that the pericycle cells might be in G2 phase on NPA in the LRIS.
In our experiment, CYCB1;1, CYCB1;3 and CYCB2;1 are upregulated 3 hours after transfer
to NAA, while CYCB2;2 did not show a significant change in expression pattern (Figure 39).
In the experiment of Menges et al., all B-type cyclins were upregulated during the G2/M
transition in cell cycle progression (Figure 63). Thus, from the expression analysis of the B-
type cyclins, it seems that the pericycle cells might be in G2 phase on NPA in the LRIS.
In our experiment, CYCD1;1 is downregulated 3 hours after transfer to NAA, while
CYCD4;1 and CYCD5;1 did not show a significant change in expression pattern (Figure 40).
In the experiment of Menges et al. (2005), CYCD1;1 was not included, but a general trend of
D-type cyclin downregulation is shown during the G2/M transtition in cell cycle progression,
and they are upregulated during the G1/S transition (Figure 63). This indicates that the
pericycle cells are most probably in the G2 phase on NPA in the LRIS.
In our experiment, the CYCH expression pattern did not show a clear trend in up- or down
regulation after transfer to NAA, although it might be downregulated 4 hours after transfer to
NAA (Figure 41). According to Menges et al. (2005), CYCH was upregulated during cell
cycle re-entry (G0 to S). Considering CYCH was not upregulated during our experiment, it is
more probable that pericycle cells are not going through a G1/S transition but rather G2/M
transition during cell cycle progression.
In our experiment, CDKA1;1 is upregulated 4 hours after transfer to NAA, while CDKB2;1
did not show a significant change in expression pattern (Figure 42). According to Menges et
al. (2005), CDKB2;1 is upregulated during G2/M transitioin (Figure 63). From the CDK
expression patterns in our experiment, no conclusions can be drawn on the cell cycle phase of
pericycle cells on NPA in the LRIS.
In our experiment, DPb does not shown a significant change in expression pattern during the
LRIS (Figure 43). Considering this protein is involved in the G1/S transition, it favors a
G2/M transition rather than a G1/S transition in cell cycle progression in the LRIS.
In our experiment, WEE1 is upregulated 3 hours after transfer to NAA (Figure 44).
According to Menges et al., WEE1 is upregulated during the S/G2 transition (Figure 63).
Thus, the expression pattern of WEE1 seems to favor a G1/S transition instead of a G2/M
transition during cell cycle progression in the LRIS and is in contrast with the other results.
In our experiment, DEL1 is upregulated 3 hours after transfer to NAA, while DEL2 does not
show a significant change in expression pattern during the LRIS (Figure 45). It is believed
that DEL proteins are negative regulators of G1/S transition and in the experiment of Menges
et al., DEL proteins show a trend of upregulation after G1/S transition, probably to ensure that
the cells do not re-enter a G1/S transition (Figure 63). Considering an upregulation of DEL
proteins would disfavor a G1/S transition, it seems less likely that the pericycle cells were
residing in the G1 phase on NPA in the LRIS.
55
In our experiment, CKS1 is upregulated 3 hours after transfer to NAA, while CKS2 does not
show a significant change in expression pattern during the LRIS (Figure 46). According to
Menges et al. (2005), CKS proteins are upregulated during G2/M transition in cell cycle
progression (Figure 63), indicating that the pericycle cells are more likely to reside in the G2
phase on NPA in the LRIS.
In our experiment, KRP1, KRP3 and KRP4 are downregulated after transfer to NAA (Figure
47). According to Menges et al. (2005), the KRP proteins are generally downregulated during
G2/M transition (Figure 63). This favors a G2/M transition in the pericycle cells in the LRIS.
In our experiment, E2F does not show a significant change in expression pattern during the
LRIS (Figure 48). Considering E2F proteins play an important role during the G1/S transition
and there was no upregulation in our experiment, it seems less likely that the pericycle cells
were residing in the G1 phase on NPA.
In summary, the results for the real-time qRT-PCR analysis of the expression pattern of core
cell cycle genes in maize during the LRIS favors a model in which the pericycle cells are
residing in the G2 phase on NPA, and after transfer to NAA, a G2/M transition occurs.
Himanen et al. (2002) analyzed in which phase the pericycle cells of Arabidopsis are residing
on NPA in the LRIS. They used the cell cycle blocker hydroxyurea (HU), which blocks the
cell cycle during the G1/S transition, in combination with cell cycle marker lines to discover
that the pericycle cells in Arabidopsis were probably blocked in the G1 phase on NPA in the
LRIS (Planchais et al., 2000; Himanen et al., 2002). Thus, these results seem to contradict the
results obtained in the present experiment, although it should be noted that different time
points of sampling were used in both experiments. In the present experiment, sampling
occurred 2, 3 and 4 hours after transfer to NAA, while in the previous study, sampling
occurred 4, 6, 8, 10 and 12 hours after transfer to NAA. This might explain the different
outcomes.
1.3.2. Characterization of the maize LRIS using flow cytometry
After flow cytometry analysis of the stele in the sampling zones, it was revealed that in the
normal LRIS the amount of cells containing a 4C-content decreased while the amount of cells
containing a 2C-content increased 4 hours after transfer from NPA to NAA, indicating a
G2/G1 transition has occurred, since cells in the G2-phase contain a 4C-content, while those
in the G1-phase contain a 2C-content (Figure 49). In the LRIS supplemented with the
mitosis-blocking nocodazole, the amount of cells containing a 4C-content decreased, while
the amount of cells containing a 2C-content increased to a lesser amount compared to the
normal LRIS after transfer from NPA to NAA (Figure 49). In the LRIS supplemented with
the S-phase blocking hydroxyurea, the amount of cells containing a 4C-content decreased
with, while the amount of cells containing a 2C-content increased to a higher amount
compared to the normal LRIS 4 hours after transfer from NPA to NAA (Figure 49). Thus, it
seems that when nocodazole is supplemented, there is a smaller shift from 4C to 2C, with the
smaller decrease in 4C-content explained by the larger shift from 8C to 4C in the nocodazole
treatment, whereas when hydoxyurea is supplemented there is a larger shift from 4C to 2C
compared to the normal LRIS. Taking these three experiments into account and the results
from the qRT-PCR analysis, a model is favored in which the pericycle cells are probably
residing in the G2-phase on NPA and a G2/M transition is induced after transfer to NAA.

56
1.3.3. Microscopical analysis of the pericycle cells after long NPA treatment.
Microscopical analysis was performed on microtome sections of maize seedlings grown 6
days on 50 µM NPA. In the root sections 0-0.5 cm and 0.5-1.0 cm, some pericycle cells at the
phloem poles were radially swollen (Figure 50-52). In the root section 1.0-1.5 cm, some
radially swollen pericycle cells showed the first periclinal division and the adjacent radially
swollen cortical cells also showed the first periclinal division (Figure 53). In the root section
1.5-2.0 cm, pericycle and endodermal cells at multiple phloem poles showed multiple
periclinal divisions (Figure 55). Microscopical analysis on microtome sections of maize
seedlings grown 6 days on 50 µM NPA followed by 4 days grown on 50 µM NAA, revealed
that lateral roots were formed from pericycle and endodermal cells around the entire vascular
bundle (Figure 57). From these results it could be hypothesized that after long NPA treatment
the pericycle and endodermal cells eventually do start to show periclinal divisions, but these
do not occur at a single phloem pole like in a normal situation, but instead at multiple sites
along the radial pericycle and endodermal layer. After transfer to NAA, lateral roots are
formed from the multilayered periclinal and endodermal layers around the entire vascular
bundle. This results in lateral roots being formed right next to each other. Considering that
during lateral root emergence the cortical cell layers need to be penetrated and that this is
aided by stimulating the expression of CWR enzymes in these layers might explain why the
entire cortex seemed to have been shed (Figure 57).
In summary, maize seedlings grown for 64 hours on 50 µM NPA do not show periclinal
divisions in the pericycle, while maize seedlings do start to show periclinal divisions in the
pericycle and endodermal cells after a long NPA treatment of 6 days and this results in
multilayered pericycle and endodermal cell layers, which after transfer to 50 µM NAA,
results in the formation of lateral roots around the entire vascular bundle.

57
PART V: MATERIALS AND METHODS
Plant Material
Arabidopsis thaliana L. Heynh ecotype Columbia (Col-0) seeds were propagated from a batch
obtained at from the Nottingham Arabidopsis Stock Center. The marker line J0121 (C24
ecotype background) was obtained from the GAL4-GFP enhancer trap line collection of Jim
Haseloff laboratory (Department of Plant Sciences, University of Cambridge.
http://www.plantsci.cam.ac.uk./Haseloff) (Laplaze et al., 2005). The DR5::uidA marker line
(Col-0), QC25::CFP marker line (C24), QC184::uidA marker line (C24) and WRKY23::uidA
marker line were received from Dr. Wim Grunewald. Zea mays (ssp. mays L.) B73 inbred line
seeds were received and propagated from a batch obtained from Agri Obtention
(http://www.agriobtentions.fr/, France). Transgenic Zea mays containing the DR5::RFP or
pPIN1::PIN1-YFP construct, were received from the laboratory of David Jackson (Cold
Spring Harbor, New York, Gallavotti et al, 2008).
Generation of transgenic Arabidopsis plants (ZM and AT lines):
E. coli stab cultures with entry clones (pDONRTM
/Zeo), containg the ZM gene constructs,
were obtained from Cropdesign (BASF Plant Science Company, Ghent, Belgium). An
overnight liquid culture (LC) was prepared for plasmid extraction (High Pure Plasmid
Isolation Kit; Roche Applied Science). Plasmids were verified by digestion with restriction
enzymes (Promega). The fragments were separated by 1% agarose gel elektrophoresis (1%
UltraPureTM
Agarose (Invitrogen) in 0.5x TAE buffer supplemented with SYBR® Safe DNA
Stain (Invitrogen)) using the Mini Gel Eletrophoresis System (Labnet) and visualized with the
Safe Imager (Invitrogen) in combination with the Gel Logic 100 Imaging System (Kodak).
Gel images were obtained using the software program KODAK MI. In case the entry clone
was correct, the Gateway® recombination system (Invitrogen) was used to obtain expression
vectors (pK7WG2) (Karimi et al., 2002; Karimi et al., 2007). The expression vectors were
transformed into E. coli DH5αTM
Competent Cells (Invitrogen) using heat-shock
transformation. The expression vectors were isolated and verified as described previously.
These were transformed into Agrobacterium tumefaciens (C58C1RifR, pMP90) cells using a
heat-shock/freeze-thaw transformation protocol. Arabidopsis thaliana (Col-0) was
subsequently transformed by floral dipping.
In case of plants transformed with an Arabidopsis gene (AT lines), entry clones were prepared
in the lab previously by Gateway® cloning (Invitrogen) from the Arabidopsis genome,
followed by the procedures described above.
Generation of transgenic Arabidopsis plants (p35S::WRKY23-SRDX)
An entry clone containing a WRKY-SRDX construct (closed end) flanked by an attL1 and
attL3 site was available in the lab. A Multisite Gateway® Recombination LR reaction using
the entry clone the destination vector pK7WG2, yielded a p35S::WRKY23-SRDX expression
vector. The expression vector was transformed into E. coli DH5αTM
Competent Cells
(Invitrogen) using heat-shock transformation. Plasmids were verified by a colony-PCR using
the Phusion High Fidelity DNA Polymerase kit (BioLabs, New England) with attB and M13
primers. The plasmid was isolated from E. coli cells using the High Pure Plasmid Isolation Kit
(Roche Applied Science) followed by the procedures described above.
58
Plant growth conditions:
Arabidopsis seeds were bleach- or gas-sterilized with a mixture of NaOCl and NaOH, and
cold-treated (stratified) for 2 days at 4°C in the dark before transfer to the growth chamber.
For selection of transformed plants, seeds were sown on horizontally oriented square Petri
dishes (120x120x70 mm, Greiner Labortechnik, Frickenhausen, Germany) with solid medium
derived from half-strength Murashige and Skoog (MS) medium supplemented with 1%
sucrose, 0.1% myo-inositol, 0.5% MES and 0.8% agar (Sigma) (= 0.5x MS medium) and
supplemented with kanamycin (50 mg/L; Duchefa Biochemie, Haarlem, The Netherlands) or
hygromycin (30 mg/L; Duchefa Biochemie, Haarlem, The Netherlands) for ZM or AT
selection respectively. Plants were transferred into soil (Jiffy-7® system, Jiffy Products,
U.S.A.) and further growth occurred in a greenhouse (conditions: 06.00 – 22.00 light, 21°C)
using the Arasystem (Betatech, Belgium).
For analysis of transcriptional levels and measurements of primary root length and lateral root
density, Arabidopsis seedlings were grown on vertically oriented square Petri dishes
(120x120x70 mm, Greiner Labortechnik, Frickenhausen, Germany) with solid 0.5x MS
medium. Seedlings for selection, transcriptional analysis and phenotype analysis were
incubated in a growth chamber under continuous light (110 µE.m-2
.s-1
photosynthetically
active radiation, supplied by cool-white fluorescent tungsten tubes (Osram, München,
Germany)) at 22 °C.
Maize seeds were surface sterilized with 6% NaOCl for 6 minute and rinsed 3 times for 5 min
in sterile distilled water. Seeds were put on top of paper towels, which are rolled and
transferred to glass tubes containing sterile distilled water (Hoecker et al, 2006). Seedlings
were grown in an environmentally controlled chamber (Vötsch Industrietechnik GmbH; under
continuous light, 27°C, 70% humidity).
For propagation of maize plants, they were transferred from the paper rolls to a mixture of soil
supplemented with Osmocotte ® (Scotts company, Oostjachtpark 1. B-9100 Sint-Niklaas),
and grown further in greenhouse conditions (06.00 – 22.00 light, 26°C day and 22°C night).
Treatments
For the induction of lateral roots in maize, seeds were sown in paper rolls filled with sterile
water supplemented with 50 µM NPA in DMSO (Duchefa Biochemie, Haarlem, The
Netherlands). After 64h paper rolls were transferred to new tubes containing 50µM NAA. For
control samples an equal amount of DMSO was added.
Compounds used for cell cycle inhibition are nocodazole (10 µM in DMSO; Sigma) and
hydroxyurea (3mM in milliQ; Sigma).
Quantitative real-time qRT-PCR
ZM and AT lines
For qRT-PCR analysis of ZM and AT lines, RNA was extracted from roots of Arabidopsis
seedlings, grown for seven days after germination (DAG). For qRT-PCR analysis of
p35S::WRKY23-SRDX lines, RNA was extracted from leaves of T1 plants in one week in
soil. RNA was extracted using a protocol combining TRIzol® (Invitrogen) and the RNeasy
Mini Kit (Qiagen). The RNA concentration and quality was determined with the NanoDropTM
ND-1000 Spectrophotometer. cDNA was prepared from 1 µg of total RNA with either the
59
SuperScriptTM
III First Strand Synthesis for RT-PCR kit (Invitrogen), the iScriptTM cDNA
Synthesis kit (Bio-Rad) or the RETROscript® kit (Ambion The RNA Company).
Testing of overexpression lines was done in 96-well plates, using the Platinum®
SYBR®Green qPCR SuperMix – UDG Kit (Invitrogen) in combination with the iCycler
apparatus + iCycler Opticale Module (Bio-Rad). For this PCR, plates were heated for 2
minutes at 50°C, followed by 8 minutes 30 seconds at 95°C, followed by 50 cycles of
denaturation for 20 seconds at 95°C and annealing extension for 20 seconds at 55°C, followed
by 30 seconds at 94°C and 90 cycles of 10 seconds at 94°C.
Plate set-up for RNA quantification by qRT-PCR was performed manually for 384-well plates
or by using the Janus Robot system (JANUS Mini Format, Perkin Elmer). The
LightCycler®480 SYBR Green I Master Kit (Roche Applied Science) in combination with
the LightCycler®480 Instrument (Roche Applied Science) was used. A list of primers used to
quantify the gene expression level can be found in the Addendum. In all cases, reactions
were done in triplicate. Data were analyzed with qBase (Hellemans et al., 2007). Expression
levels were normalized to those of EEF1α4, CKIIa2 and CDKA1;1
RT-PCR on 35S::WRKY-SRDX transgenic plants
A reverse transcriptase-PCR reaction (Platinum®
Taq DNA Polymerase (Invitrogen)) was
performed using the cDNA obtained as described above. The following PCR program on the
PCR-machine iCycler (BioRad) was used: 3 minutes at 95°C, follow by 25 cycles of 20
seconds at 97°C, 45 seconds at 56°C and 1 minute 20 seconds at 72°C, and finally followed
by 5 minutes at 72°C. The amplicons were separated by 1% agarose gel elektrophoresis (1%
UltraPureTM
Agarose (Invitrogen) in 0.5x TAE buffer supplemented with SYBR® Safe DNA
Stain (Invitrogen)) using the Mini Gel Electrophoresis System (Labnet) and visualized with
the Safe Imager (Invitrogen) in combination with the Gel Logic 100 Imaging System
(Kodak). Gel images were obtained using the software program KODAK MI.
Maize real-time qRT-PCR analysis
Plant material was frozen in liquid nitrogen immediately after harvesting. RNA was extracted
using the RNeasy Mini Kit from Qiagen following the instructions of the manufacturer. The
RNA concentration and quality was determined with the NanoDropTM
ND-1000
Spectrophotometer. cDNA was prepared from 1 µg of total RNA with the SuperScriptTM
III
First Strand Synthesis for RT-PCR kit (Invitrogen).
Plate set-up for RNA quantification by qRT-PCR in 384-well plates was performed by using
the Janus Robot system (JANUS Mini Format, Perkin Elmer). The LightCycler®480 SYBR
Green I Master Kit (Roche Applied Science) in combination with the LightCycler®480
Instrument (Roche Applied Science) was used for qRT-PCR. A list of primers used to
quantify the gene expression level can be found in the Addendum. Reactions were done in
triplicate. Data were analyzed with qBase (Hellemans et al., 2007).
Root length and lateral root density measurements
Plants were grown on vertically oriented Petri dishes as describe before till 10-12 DAG.
Emerged lateral roots were counted using a stereo-microscope (CETI Belgium). A high
resolution scan from the plates was made with a V700 PHOTO scanner (Epson). Root length
was measured from digital images of the scanned plates using ImageJ1.41 software. Data
were analyzed using the Excel statistical package (Microsoft).

60
Microscopic Analyses
ZM and AT lines
For microscopic analyses of Arabidopsis roots, samples were cleared by mounting in 90%
lactic acid (Acros Organics) or by clearing as described in Malamy and Benfey, 1997. All
samples were analyzed by differential interference contrast microscopy (Olympus BX51).
P35S::WRKY23-SRDX transgenic lines
Complete seedlings of the crossed plants were incubated in 90% aceton (Biosolve,
Valkenswaard, The Netherlands) for 30 minutes at 4°C, followed by a wash-step in phosphate
buffer pH 7 (NaH2PO4 Merck, Darmstadt, Germany; Na2HPO4 BDH Biochemical), and
finally GUS-stained (1 mM X-Glc, 0.5% DMF, 0.5% Triton X-100, 1 mM EDTA pH 8, 0.5
mM K3Fe(CN)6, 0.5 mM K4Fe(CN)6 and 500 mM phosphate buffer Na2PO4 pH 7) in
multiwall plates (Falcon 3043; Becton Dickinson, Bedford, MA) for 2 hours in case of
DR5::uidA crosses and overnight for QC184::uidA crosses. Lugol stained samples, were
incubated for 5 minutes in lugol (Fluka) at room temperature and mounted in chloral hydrate
fixative. Other samples were cleared in 90% lactic acid (Acros Organics) or using the clearing
method described by Malamy and Benfey (1997). A screening for GUS-staining was
performed using a stereomicroscope (Stemi SV11; Zeiss, Jena, Germany). All samples were
further analyzed by differential interference contrast microscopy (Olympus BX51).
Photographs were taken with a Nikon Digital Sight DS-5Mc digital camera (Nikon) and
processed with Photoshop CS4 Extended (Adobe). Fluorescence of the QC in QC25 crossed
seedlings was observed using a fluorescence stereo-microscope (Leica).
Maize sections
Upon sampling, roots were fixed overnight in FAA (4% p-formaldehyde, 1% glutaraldehyde
in phosphate buffer pH 7). The root sections were Feulgen-stained (15 min), followed by a
dehydration step. Afterwards, they were embedded using the Technovit 7100 system and
mounted on plastic holders using the Technovit 3040 system. Longitudinal and transversal
sections of 4-5 µM thickness were made using a microtome (Reichert – Jung 2050 Supercut)
equipped with a metal knife (Superlab Knives, Adamas Instruments, The Netherlands).
Sections were placed Superfrost coated slides (Mendel glazer). The microtome sections were
stained 2 minutes in 0.1% aniline blue, or 10 minutes in 0.05% ruthenium red followed by 10
minutes 0.1% methylene blue. Glass coverslips were mounted DePex (BDH Microscopy DPX
mountant for microscopy, VWR International Ltd. Poole, England), followed by analysis with
the Leica DMLB microscope. Digital images were taken with a digital camera (Nikon Digital
Sight DS-Fi1) and processed using the software Photoshop CS4 Extended (Adobe).
Flow cytometry
For flow cytometry analysis, root material is harvested, immediately frozen in liquid nitrogen
and stored at -70°C. Next, 200 µl CyStain UV precise P Extraction Buffer (Partec) was added
to the sample, which was then quickly chopped for 2-3 minutes using a clean razor blade.
Afterwards 1.5 ml CyStain UV precise P Staining Buffer (Partec) was applied. After filtering
(Celltrixs, 3 µm pores), liquids were collected in glass tubes (Röhren tubes 3.5 ml, 55x12mm,
PS, SARSTEDT) and kept on ice. The CyFlow ML (Partec) flow cytometer in combination
with the software Partec FloMax was used for flow cytometry measurements (instrument
settings: Addendum). Analysis was performed using the software program CPX Analysis.

61
Analysis of transgenic maize lines
Test by PCR
To check whether the transgenic maize seeds contained the DR5::RFP or pPIN1::PIN1-YFP
construct, DNA was extracted using a miniprep for high-throughput PCR analysis
(Addendum), followed by an RT-PCR reaction using both gene-specific primers or primers
against the Basta-resistance gene.
Basta resistance test
An alternative approach was used by performing a Basta resistance test plants 2 weeks after
being transferred into soil (Addendum).

62
PART VI: REFERENCES Abel S, Oeller PW, Theologis A (1994) Early auxin-induced genes encode short-lived nuclear proteins. Proc
Natl Acad Sci U S A 91: 326-330
Abel S, Theologis A (1996) Early genes and auxin action. Plant Physiol 111: 9-17
Aida M, Beis D, Heidstra R, Willemsen V, Blilou I, Galinha C, Nussaume L, Noh YS, Amasino R, Scheres B
(2004) The PLETHORA genes mediate patterning of the Arabidopsis root stem cell niche. Cell 119: 109-120
Anderson HJ, Vonarx EJ, Pastushok L, Nakagawa M, Katafuchi A, Gruz P, Di Rubbo A, Grice DM, Osmond
MJ, Sakamoto AN, Nohmi T, Xiao W, Kunz BA (2008) Arabidopsis thaliana Y-family DNA polymerase eta
catalyses translesion synthesis and interacts functionally with PCNA2. Plant J 55(6): 895-908
Bartel B (1997) Auxin Biosynthesis. Annu Rev Plant Physiol Plant Mol Biol 48: 51-66
Beeckman T, Burssens S, Inze D (2001) The peri-cell-cycle in Arabidopsis. J Exp Bot 52: 403-411
Benjamins R, Quint A, Weijers D, Hooykaas P, Offringa R (2001) The PINOID protein kinase regulates organ
development in Arabidopsis by enhancing polar auxin transport. Development 128: 4057-4067
Benkova E, Ivanchenko MG, Friml J, Shishkova S, Dubrovsky JG (2009) A morphogenetic trigger: is there an
emerging concept in plant developmental biology? Trends Plant Sci 14: 189-193
Benkova E, Michniewicz M, Sauer M, Teichmann T, Seifertova D, Jurgens G, Friml J (2003) Local, efflux-
dependent auxin gradients as a common module for plant organ formation. Cell 115: 591-602
Bennett MJ, Marchant A, Green HG, May ST, Ward SP, Millner PA, Walker AR, Schulz B, Feldmann KA
(1996) Arabidopsis AUX1 gene: a permease-like regulator of root gravitropism. Science 273: 948-950
Blais A, Dynlacht BD (2004) Hitting their targets: an emerging picture of E2F and cell cycle control. Curr Opin
Genet Dev 14: 527-532
Blakeslee JJ, Bandyopadhyay A, Lee OR, Mravec J, Titapiwatanakun B, Sauer M, Makam SN, Cheng Y,
Bouchard R, Adamec J, Geisler M, Nagashima A, Sakai T, Martinoia E, Friml J, Peer WA, Murphy AS (2007)
Interactions among PIN-FORMED and P-glycoprotein auxin transporters in Arabidopsis. Plant Cell 19: 131-147
Boerjan W, Cervera MT, Delarue M, Beeckman T, Dewitte W, Bellini C, Caboche M, Van Onckelen H, Van
Montagu M, Inze D (1995) Superroot, a recessive mutation in Arabidopsis, confers auxin overproduction. Plant
Cell 7: 1405-1419
Boudolf V, Vlieghe K, Beemster GT, Magyar Z, Torres Acosta JA, Maes S, Van Der Schueren E, Inze D, De
Veylder L (2004) The plant-specific cyclin-dependent kinase CDKB1;1 and transcription factor E2Fa-DPa
control the balance of mitotically dividing and endoreduplicating cells in Arabidopsis. Plant Cell 16: 2683-2692
Bourne Y, Watson MH, Hickey MJ, Holmes W, Rocque W, Reed SI, Tainer JA (1996) Crystal structure and
mutational analysis of the human CDK2 kinase complex with cell cycle-regulatory protein CksHs1. Cell 84:
863-874
Brady SM, Orlando DA, Lee JY, Wang JY, Koch J, Dinneny JR, Mace D, Ohler U, Benfey PN (2007) A high-
resolution root spatiotemporal map reveals dominant expression patterns. Science 318: 801-806
Caro E, Desvoyes B, Ramirez-Parra E, Sanchez MP, Gutierrez C (2008) Endoreduplication control during plant
development. SEB Exp Biol Ser 59: 167-187
Casimiro I, Beeckman T, Graham N, Bhalerao R, Zhang H, Casero P, Sandberg G, Bennett MJ (2003)
Dissecting Arabidopsis lateral root development. Trends Plant Sci 8: 165-171

63
Casimiro I, Marchant A, Bhalerao RP, Beeckman T, Dhooge S, Swarup R, Graham N, Inze D, Sandberg G,
Casero PJ, Bennett M (2001) Auxin transport promotes Arabidopsis lateral root initiation. Plant Cell 13: 843-
852
Cho M, Lee SH, Cho HT (2007) P-glycoprotein4 displays auxin efflux transporter-like action in Arabidopsis
root hair cells and tobacco cells. Plant Cell 19: 3930-3943
Christensen SK, Dagenais N, Chory J, Weigel D (2000) Regulation of auxin response by the protein kinase
PINOID. Cell 100: 469-478
Churchman ML, Brown ML, Kato N, Kirik V, Hulskamp M, Inze D, De Veylder L, Walker JD, Zheng Z,
Oppenheimer DG, Gwin T, Churchman J, Larkin JC (2006) SIAMESE, a plant-specific cell cycle regulator,
controls endoreplication onset in Arabidopsis thaliana. Plant Cell 18: 3145-3157
Crutchley J, King KM, Keaton MA, Szkotnicki L, Orlando DA, Zyla TR, Bardes ES, Lew DJ (2009) Molecular
dissection of the checkpoint kinase Hsl1p. Mol Biol Cell 20(7): 1926-1936
de Jager SM, Maughan S, Dewitte W, Scofield S, Murray JA (2005) The developmental context of cell-cycle
control in plants. Semin Cell Dev Biol 16: 385-396
de Jager SM, Murray JA (1999) Retinoblastoma proteins in plants. Plant Mol Biol 41: 295-299
De Rybel B, Audenaert D, Beeckman T, Kepinski S (2009) The past, present, and future of chemical biology in
auxin research. ACS Chem Biol 4: 987-998
De Schutter K, Joubes J, Cools T, Verkest A, Corellou F, Babiychuk E, Van Der Schueren E, Beeckman T,
Kushnir S, Inze D, De Veylder L (2007) Arabidopsis WEE1 kinase controls cell cycle arrest in response to
activation of the DNA integrity checkpoint. Plant Cell 19: 211-225
De Smet I, Lau S, Voss U, Vanneste S, Benjamins R, Rademacher EH, Schlereth A, De Rybel B, Vassileva V,
Grunewald W, Naudts M, Levesque MP, Ehrismann JS, Inze D, Luschnig C, Benfey PN, Weijers D, Van
Montagu MC, Bennett MJ, Jurgens G, Beeckman T (2010) Bimodular auxin response controls organogenesis in
Arabidopsis. Proc Natl Acad Sci U S A 107: 2705-2710
De Smet I, Tetsumura T, De Rybel B, Frey NF, Laplaze L, Casimiro I, Swarup R, Naudts M, Vanneste S,
Audenaert D, Inze D, Bennett MJ, Beeckman T (2007) Auxin-dependent regulation of lateral root positioning in
the basal meristem of Arabidopsis. Development 134: 681-690
De Smet I, Vassileva V, De Rybel B, Levesque MP, Grunewald W, Van Damme D, Van Noorden G, Naudts M,
Van Isterdael G, De Clercq R, Wang JY, Meuli N, Vanneste S, Friml J, Hilson P, Jurgens G, Ingram GC, Inze D,
Benfey PN, Beeckman T (2008) Receptor-like kinase ACR4 restricts formative cell divisions in the Arabidopsis
root. Science 322: 594-597
De Smet I, Zhang H, Inze D, Beeckman T (2006) A novel role for abscisic acid emerges from underground.
Trends Plant Sci 11: 434-439
De Veylder L, Beeckman T, Beemster GT, Krols L, Terras F, Landrieu I, van der Schueren E, Maes S, Naudts
M, Inze D (2001a) Functional analysis of cyclin-dependent kinase inhibitors of Arabidopsis. Plant Cell 13:
1653-1668
De Veylder L, Beeckman T, Inze D (2007) The ins and outs of the plant cell cycle. Nat Rev Mol Cell Biol 8:
655-665
De Veylder L, Beemster GT, Beeckman T, Inze D (2001b) CKS1At overexpression in Arabidopsis thaliana
inhibits growth by reducing meristem size and inhibiting cell-cycle progression. Plant J 25: 617-626
De Veylder L, Joubes J, Inze D (2003) Plant cell cycle transitions. Curr Opin Plant Biol 6: 536-543

64
del Pozo JC, Boniotti MB, Gutierrez C (2002) Arabidopsis E2Fc functions in cell division and is degraded by the
ubiquitin-SCF(AtSKP2) pathway in response to light. Plant Cell 14: 3057-3071
del Pozo JC, Diaz-Trivino S, Cisneros N, Gutierrez C (2006) The balance between cell division and
endoreplication depends on E2FC-DPB, transcription factors regulated by the ubiquitin-SCFSKP2A pathway in
Arabidopsis. Plant Cell 18: 2224-2235
Dembinsky D, Woll K, Saleem M, Liu Y, Fu Y, Borsuk LA, Lamkemeyer T, Fladerer C, Madlung J, Barbazuk
B, Nordheim A, Nettleton D, Schnable PS, Hochholdinger F (2007) Transcriptomic and proteomic analyses of
pericycle cells of the maize primary root. Plant Phys. 145: 575-588
Dharmasiri N, Dharmasiri S, Estelle M (2005a) The F-box protein TIR1 is an auxin receptor. Nature 435: 441-
445
Dharmasiri N, Dharmasiri S, Weijers D, Lechner E, Yamada M, Hobbie L, Ehrismann JS, Jurgens G, Estelle M
(2005b) Plant development is regulated by a family of auxin receptor F box proteins. Dev Cell 9: 109-119
Dharmasiri S, Estelle M (2002) The role of regulated protein degradation in auxin response. Plant Mol Biol 49:
401-409
Dhonukshe P, Aniento F, Hwang I, Robinson DG, Mravec J, Stierhof YD, Friml J (2007) Clathrin-mediated
constitutive endocytosis of PIN auxin efflux carriers in Arabidopsis. Curr Biol 17: 520-527
Ditengou FA, Teale WD, Kochersperger P, Flittner KA, Kneuper I, van der Graaff E, Nziengui H, Pinosa F, Li
X, Nitschke R, Laux T, Palme K (2008) Mechanical induction of lateral root initiation in Arabidopsis thaliana.
Proc Natl Acad Sci U S A 105: 18818-18823
Dolan L, Janmaat K, Willemsen V, Linstead P, Poethig S, Roberts K, Scheres B (1993) Cellular organisation of
the Arabidopsis thaliana root. Development 119: 71-84
Drew MC (1975) Comparison of effects of a localized supply of phosphate, nitrate, ammonium and potassium
on growth of seminal root system, and shoot, in barley. New Phytol. 75: 479-490
Dubrovsky JG, Doerner PW, Colon-Carmona A, Rost TL (2000) Pericycle cell proliferation and lateral root
initiation in Arabidopsis. Plant Physiol 124: 1648-1657
Eulgem T, Somssich E (2007) Networks of WRKY transcription factors in defense signaling. Curr Opin Plant
Biol. 10(4): 366-371
Fahn A (1990) Plant Anatomy (4th edn), Pergamon Press
Feldman L (1994) The maize root. In The Maize Handbook (Freeling, M. and Walbot, V. eds), pp 239-248,
Marcel Dekker
Fukaki H, Nakao Y, Okushima Y, Theologis A, Tasaka M (2005) Tissue-specific expression of stabilized
SOLITARY-ROOT/IAA14 alters lateral root development in Arabidopsis. Plant J 44: 382-395
Fukaki H, Tameda S, Masuda H, Tasaka M (2002) Lateral root formation is blocked by a gain-of-function
mutation in the SOLITARY-ROOT/IAA14 gene of Arabidopsis. Plant J 29: 153-168
Fukaki H, Taniguchi N, Tasaka M (2006) PICKLE is required for SOLITARY-ROOT/IAA14-mediated
repression of ARF7 and ARF19 activity during Arabidopsis lateral root initiation. Plant J 48: 380-389
Gallavotti A, Yang Y, Schmidt RJ, Jackson D (2008) The Relationship between auxin transport and maize
branching. Plant Physiol 147(4): 1913-1923

65
Galweiler L, Guan C, Muller A, Wisman E, Mendgen K, Yephremov A, Palme K (1998) Regulation of polar
auxin transport by AtPIN1 in Arabidopsis vascular tissue. Science 282: 2226-2230
Geisler M, Blakeslee JJ, Bouchard R, Lee OR, Vincenzetti V, Bandyopadhyay A, Titapiwatanakun B, Peer WA,
Bailly A, Richards EL, Ejendal KF, Smith AP, Baroux C, Grossniklaus U, Muller A, Hrycyna CA, Dudler R,
Murphy AS, Martinoia E (2005) Cellular efflux of auxin catalyzed by the Arabidopsis MDR/PGP transporter
AtPGP1. Plant J 44: 179-194
Geldner N, Friml J, Stierhof YD, Jurgens G, Palme K (2001) Auxin transport inhibitors block PIN1 cycling and
vesicle trafficking. Nature 413: 425-428
Genschik P, Criqui MC, Parmentier Y, Derevier A, Fleck J (1998) Cell cycle -dependent proteolysis in plants.
Identification Of the destruction box pathway and metaphase arrest produced by the proteasome inhibitor
mg132. Plant Cell 10: 2063-2076
Gray WM, Kepinski S, Rouse D, Leyser O, Estelle M (2001) Auxin regulates SCF(TIR1)-dependent degradation
of AUX/IAA proteins. Nature 414: 271-276
Grunewald W, Parizot B, Inzé D, Gheysen G, Beeckman T (2007) Developmental Biology of Roots: One
Common Pathway for All Angiosperms? Int J Plant Dev Biol 1(2): 212-225
Guilfoyle TJ, Hagen G (2007) Auxin response factors. Curr Opin Plant Biol 10: 453-460
Gutierrez C (2005) Coupling cell proliferation and development in plants. Nat Cell Biol 7: 535-541
Heckman DS, Geiser DM, Eidell BR, Stauffer RL, Kardos NL, Hedges SB (2001) Molecular evidence for the
early colonization of land by fungi and plants. Science 293: 1129-1133
Hellemans J, Mortier G, De Paepe A, Speleman F, Vandesompele J (2007) qBase relative quantification
framework and software for management and automated analysis of real-time quantitative PCR data. Genome
Biol 8(2): R19
Hemerly AS, Ferreira P, de Almeida Engler J, Van Montagu M, Engler G, Inze D (1993) cdc2a expression in
Arabidopsis is linked with competence for cell division. Plant Cell 5: 1711-1723
Himanen K, Boucheron E, Vanneste S, de Almeida Engler J, Inze D, Beeckman T (2002) Auxin-mediated cell
cycle activation during early lateral root initiation. Plant Cell 14: 2339-2351
Hiratsu K, Matsui K, Koyama T, Ohme-Takagi M (2003) Dominant repression of target genes by chimeric
repressors that include the EAR motif, a repression domain in Arabidopsis. Plant J. 34(5): 733-739
Hochholdinger F, Feix G (1998) Early post-embryonic root formation is specifically affected in the maize
mutant lrt1. Plant J. 16: 247-255
Hochholdinger F, Park W J, Sauer M, Woll K (2004) From weeds to crops: genetic analysis of root development
in cereals. Trends in Plant Science 9: 42-48
Hochholdinger F, Tuberosa R (2009) Genetic and genomic dissection of maize root development and
architecture. Curr Opin Plant Biol 12: 172-177
Hoecker N, Keller B, Piepho HP, Hochholdinger F (2006) Manifestation of heterosis during early maize (Zea
mays L.) root development. Theor Appl Genet 112(3): 421-429
Inukai Y, Sakamoto T, Ueguchi-Tanaka M, Shibata Y, Gomi K, Umemura I, Hasegawa Y, Ashikari M, Kitano
H, Matsuoka M (2005) Crown rootless1, which is essential for crown root formation in rice, is a target of an
AUXIN RESPONSE FACTOR in auxin signaling. Plant Cell 17: 1387-1396
Inze D, De Veylder L (2006) Cell cycle regulation in plant development. Annu Rev Genet 40: 77-105
66
Ishikawa H, Evans ML (1990) Electrotropism of maize roots, Role of the root cap and relationship to
gravitropism. Plant Physiol. 94: 913-918
Ito M, Araki S, Matsunaga S, Itoh T, Nishihama R, Machida Y, Doonan JH, Watanabe A (2001) G2/M-phase-
specific transcription during the plant cell cycle is mediated by c-Myb-like transcription factors. Plant Cell 13:
1891-1905
Ivanchenko MG, Muday GK, Dubrovsky JG (2008) Ethylene-auxin interactions regulate lateral root initiation
and emergence in Arabidopsis thaliana. Plant J 55: 335-347
Jacobs M, Rubery PH (1988) Naturally occurring auxin transport regulators. Science 241: 346-349
Jasinski S, Riou-Khamlichi C, Roche O, Perennes C, Bergounioux C, Glab N (2002) The CDK inhibitor
NtKIS1a is involved in plant development, endoreduplication and restores normal development of cyclin D3; 1-
overexpressing plants. J Cell Sci 115: 973-982
Jiang K, Meng YL, Feldman LJ (2003) Quiescent center formation in maize roots is associated with an auxin-
regulated oxidizing environment. Development 130: 1429-1438
Karimi M, Bleys A, Vanderhaeghen R, Hilson P (2007) Building blocks for plant gene assembly. Plant Physiol
145(4): 1183-1191
Karimi M, Inze D, Depicker A (2002) GATEWAY vectors for Agrobacterium-mediated plant transformation.
Trends Plant Sci 7(5): 193-195
Kazama H, Dan H, Imaseki H, Wasteneys GO (2004) Transient exposure to ethylene stimulates cell division and
alters the fate and polarity of hypocotyl epidermal cells. Plant Physiol 134: 1614-1623
Kepinski S, Leyser O (2005) The Arabidopsis F-box protein TIR1 is an auxin receptor. Nature 435: 446-451
Kim J, Harter K, Theologis A (1997) Protein-protein interactions among the Aux/IAA proteins. Proc Natl Acad
Sci U S A 94: 11786-11791
Krouk G, Lacombe B, Bielach A, Perrine-Walker F, Malinska K, Mounier E, Hoyerová K, Tillard P, Leon S,
Ljung K, Zazimalová E, Benková E, Nacry P, Gojon A (2010) Nitrate-regulated auxin transport by NRT1.1
defines a mechanism for nutrient sensing in plant. Developmental Cell
Laplaze L, Benkova E, Casimiro I, Maes L, Vanneste S, Swarup R, Weijers D, Calvo V, Parizot B, Herrera-
Rodriguez MB, Offringa R, Graham N, Doumas P, Friml J, Bogusz D, Beeckman T, Bennett M (2007)
Cytokinins act directly on lateral root founder cells to inhibit root initiation. Plant Cell 19: 3889-3900
Laplaze L, Parizot B, Baker A, Ricaud L, Martiniere A, Auguy F, Franche C, Nussaume L, Bogusz D, Haseloff J
(2005) GAL4-GFP enhancer trap lines for genetic manipulation of lateral root development in Arabidopsis
thaliana. J Exp Bot 56: 2433-2442
Laskowski M, Biller S, Stanley K, Kajstura T, Prusty R (2006) Expression profiling of auxin-treated Arabidopsis
roots: toward a molecular analysis of lateral root emergence. Plant Cell Physiol 47: 788-792
Lechner E, Xie D, Grava S, Pigaglio E, Planchais S, Murray JA, Parmentier Y, Mutterer J, Dubreucq B, Shen
WH, Genschik P (2002) The AtRbx1 protein is part of plant SCF complexes, and its down-regulation causes
severe growth and developmental defects. J Biol Chem 277: 50069-50080
Lee HW, Kim NY, Lee DJ, Kim J (2009) LBD18/ASL20 regulates lateral root formation in combination with
LBD16/ASL18 downstream of ARF7 and ARF19 in Arabidopsis. Plant Physiol 151: 1377-1389
Li X, Mo X, Shou H, Wu P (2006) Cytokinin-mediated cell cycling arrest of pericycle founder cells in lateral
root initiation of Arabidopsis. Plant Cell Physiol 47: 1112-1123

67
Linkohr BI, Williamson LC, Fitter AH, Leyser HM (2002) Nitrate and phosphate availability and distribution
have different effects on root system architecture of Arabidopsis. Plant J 29: 751-760
Liu H, Wang S, Yu X, Yu J, He X, Zhang S, Shou H, Wu P (2005) ARL1, a LOB-domain protein required for
adventitious root formation in rice. Plant J 43: 47-56
Liu Y, von Behrens I, Muthreich N, Schutz W, Nordheim A, Hochholdinger F (2010) Regulation of the
pericycle proteome in maize (Zea mays L.) primary roots by RUM1 which is required for lateral root initiation.
Eur J Cell Biol 89: 236-241
Ljung K, Bhalerao RP, Sandberg G (2001) Sites and homeostatic control of auxin biosynthesis in Arabidopsis
during vegetative growth. Plant J 28: 465-474
Ljung K, Hull AK, Celenza J, Yamada M, Estelle M, Normanly J, Sandberg G (2005) Sites and regulation of
auxin biosynthesis in Arabidopsis roots. Plant Cell 17: 1090-1104
Ljung K, Hull AK, Kowalczyk M, Marchant A, Celenza J, Cohen JD, Sandberg G (2002) Biosynthesis,
conjugation, catabolism and homeostasis of indole-3-acetic acid in Arabidopsis thaliana. Plant Mol Biol 49: 249-
272
Lucas M, Godin C, Jay-Allemand C, Laplaze L (2008) Auxin fluxes in the root apex co-regulate gravitropism
and lateral root initiation. J Exp Bot 59: 55-66
Lui H, Wang H, Delong C, Fowke LC, Crosby WL, Fobert PR (2000) The Arabidopsis Cdc2a-interacting
protein ICK2 is structurally related to ICK1 and is a potent inhibitor of cyclin-dependent kinase activity in vitro.
Plant J 21: 379-385
Luschnig C, Gaxiola RA, Grisafi P, Fink GR (1998) EIR1, a root-specific protein involved in auxin transport, is
required for gravitropism in Arabidopsis thaliana. Genes Dev 12: 2175-2187
Malamy JE, Benfey PN (1997) Organization and cell differentiation in lateral roots of Arabidopsis thaliana.
Development 124: 33-44
Marchant A, Bhalerao R, Casimiro I, Eklof J, Casero PJ, Bennett M, Sandberg G (2002) AUX1 promotes lateral
root formation by facilitating indole-3-acetic acid distribution between sink and source tissues in the Arabidopsis
seedling. Plant Cell 14: 589-597
Matsui K, Tanaka H, Ohme-Takagi M (2004) Suppression of the biosynthesis of proanthocyanidin in
Arabidopsis by chimeric PAP1 repressor. Plant Biotechnol J. 6: 487-493
Menges M, de Jager SM, Gruissem W, Murray JA (2005) Global analysis of the core cell cycle regulators of
Arabidopsis identifies novel genes, reveals multiple and highly specific profiles of expression and provides a
coherent model for plant cell cycle control. Plant J 41: 546-566
Michniewicz M, Zago MK, Abas L, Weijers D, Schweighofer A, Meskiene I, Heisler MG, Ohno C, Zhang J,
Huang F, Schwab R, Weigel D, Meyerowitz EM, Luschnig C, Offringa R, Friml J (2007) Antagonistic
regulation of PIN phosphorylation by PP2A and PINOID directs auxin flux. Cell 130: 1044-1056
Mravec J, Kubes M, Bielach A, Gaykova V, Petrasek J, Skupa P, Chand S, Benkova E, Zazimalova E, Friml J
(2008) Interaction of PIN and PGP transport mechanisms in auxin distribution-dependent development.
Development 135: 3345-3354
Murphy AS, Hoogner KR, Peer WA, Taiz L (2002) Identification, purification, and molecular cloning of N-1-
naphthylphthalmic acid-binding plasma membrane-associated aminopeptidases from Arabidopsis. Plant Physiol
128: 935-950
68
Nakagami H, Kawamura K, Sugisaka K, Sekine M, Shinmyo A (2002) Phosphorylation of retinoblastoma-
related protein by the cyclin D/cyclin-dependent kinase complex is activated at the G1/S-phase transition in
tobacco. Plant Cell 14: 1847-1857
Nakagami H, Sekine M, Murakami H, Shinmyo A (1999) Tobacco retinoblastoma-related protein
phosphorylated by a distinct cyclin-dependent kinase complex with Cdc2/cyclin D in vitro. Plant J 18: 243-252
Nakazawa M, Yabe N, Ichikawa T, Yamamoto YY, Yoshizumi T, Hasunuma K, Matsui M (2001) DFL1, an
auxin-responsive GH3 gene homologue, negatively regulates shoot cell elongation and lateral root formation,
and positively regulates the light response of hypocotyl length. Plant J 25: 213-221
Negi S, Ivanchenko MG, Muday GK (2008) Ethylene regulates lateral root formation and auxin transport in
Arabidopsis thaliana. Plant J 55: 175-187
Neuteboom LW, Veth-Tello LM, Clijdesdale OR, Hooykaas PJ, van der Zaal BJ (1999) A novel subtilisin-like
protease gene from Arabidopsis thaliana is expressed at sites of lateral root emergence. DNA Res 6: 13-19
Noh B, Bandyopadhyay A, Peer WA, Spalding EP, Murphy AS (2003) Enhanced gravi- and phototropism in
plant mdr mutants mislocalizing the auxin efflux protein PIN1. Nature 423: 999-1002
Noh B, Murphy AS, Spalding EP (2001) Multidrug resistance-like genes of Arabidopsis required for auxin
transport and auxin-mediated development. Plant Cell 13: 2441-2454
Normanly J, Bartel B (1999) Redundancy as a way of life - IAA metabolism. Curr Opin Plant Biol 2: 207-213
Okada K, Shimura Y (1990) Reversible root tip rotation in Arabidopsis seedlings induced by obstacle-touching
stimulus. Science 250: 274-276
Okushima Y, Fukaki H, Onoda M, Theologis A, Tasaka M (2007) ARF7 and ARF19 regulate lateral root
formation via direct activation of LBD/ASL genes in Arabidopsis. Plant Cell 19: 118-130
Okushima Y, Overvoorde PJ, Arima K, Alonso JM, Chan A, Chang C, Ecker JR, Hughes B, Lui A, Nguyen D,
Onodera C, Quach H, Smith A, Yu G, Theologis A (2005) Functional genomic analysis of the AUXIN
RESPONSE FACTOR gene family members in Arabidopsis thaliana: unique and overlapping functions of ARF7
and ARF19. Plant Cell 17: 444-463
Ostin A, Kowalyczk M, Bhalerao RP, Sandberg G (1998) Metabolism of indole-3-acetic acid in Arabidopsis.
Plant Physiol 118: 285-296
Paponov IA, Teale WD, Trebar M, Blilou I, Palme K (2005) The PIN auxin efflux facilitators: evolutionary and
functional perspectives. Trends Plant Sci 10: 170-177
Parizot B, De Rybel B, Beeckman T (2010) VisuaLRTC: a new view on lateral root initiation by combining
specific transcriptome data sets. Plant Physiol 153: 34-40
Parizot B, Laplaze L, Ricaud L, Boucheron-Dubuisson E, Bayle V, Bonke M, De Smet I, Poethig SR, Helariutta
Y, Haseloff J, Chriqui D, Beeckman T, Nussaume L (2008) Diarch symmetry of the vascular bundle in
Arabidopsis root encompasses the pericycle and is reflected in distich lateral root initiation. Plant Physiol 146:
140-148
Peres A, Churchman ML, Hariharan S, Himanen K, Verkest A, Vandepoele K, Magyar Z, Hatzfeld Y, Van Der
Schueren E, Beemster GT, Frankard V, Larkin JC, Inze D, De Veylder L (2007) Novel plant-specific cyclin-
dependent kinase inhibitors induced by biotic and abiotic stresses. J Biol Chem 282: 25588-25596
Petersson SV, Johansson AI, Kowalczyk M, Makoveychuk A, Wang JY, Moritz T, Grebe M, Benfey PN,
Sandberg G, Ljung K (2009) An auxin gradient and maximum in the Arabidopsis root apex shown by high-
resolution cell-specific analysis of IAA distribution and synthesis. Plant Cell 21: 1659-1668
Petrasek J, Friml J (2009) Auxin transport routes in plant development. Development 136: 2675-2688

69
Planchais S, Samland AK, Murray JA (2004) Differential stability of Arabidopsis D-type cyclins: CYCD3;1 is a
highly unstable protein degraded by a proteasome-dependent mechanism. Plant J 38: 616-625
Pollmann S, Muller A, Piotrowski M, Weiler EW (2002) Occurrence and formation of indole-3-acetamide in
Arabidopsis thaliana. Planta 216: 155-161
Porceddu A, Stals H, Reichheld JP, Segers G, De Veylder L, Barroco RP, Casteels P, Van Montagu M, Inze D,
Mironov V (2001) A plant-specific cyclin-dependent kinase is involved in the control of G2/M progression in
plants. J Biol Chem 276: 36354-36360
Ramirez-Parra E, Gutierrez C (2007) E2F regulates FASCIATA1, a chromatin assembly gene whose loss
switches on the endocycle and activates gene expression by changing the epigenetic status. Plant Physiol 144:
105-120
Ramirez-Parra E, Xie Q, Boniotti MB, Gutierrez C (1999) The cloning of plant E2F, a retinoblastoma-binding
protein, reveals unique and conserved features with animal G(1)/S regulators. Nucleic Acids Res 27: 3527-3533
Raven JA (1975) Transport of indoacetic acid in plant cells in relation to pH and electrical potential gradients,
and its significance for polar IAA transport. New Phytol. 74: 163-172
Renaudin JP, Doonan JH, Freeman D, Hashimoto J, Hirt H, Inze D, Jacobs T, Kouchi H, Rouze P, Sauter M,
Savoure A, Sorrell DA, Sundaresan V, Murray JA (1996) Plant cyclins: a unified nomenclature for plant A-, B-
and D-type cyclins based on sequence organization. Plant Mol Biol 32: 1003-1018
Riou-Khamlichi C, Huntley R, Jacqmard A, Murray JA (1999) Cytokinin activation of Arabidopsis cell division
through a D-type cyclin. Science 283: 1541-1544
Roberts JA, Elliot KA, Gonzalez-Carranza ZH (2002) Abscission, dehiscence, and other cell separation
processes. Annu Rev Plant Biol. 53: 131-158
Rogg LE, Lasswell J, Bartel B (2001) A gain-of-function mutation in IAA28 suppresses lateral root
development. Plant Cell 13: 465-480
Rossignol P, Stevens R, Perennes C, Jasinski S, Cella R, Tremousaygue D, Bergounioux C (2002) AtE2F-a and
AtDP-a, members of the E2F family of transcription factors, induce Arabidopsis leaf cells to re-enter S phase.
Mol Genet Genomics 266: 995-1003
Rubery M, Sheldrake AR (1974) Carrier-mediated auxin transport. Planta 118: 101-121
Ruegger M, Dewey E, Gray WM, Hobbie L, Turner J, Estelle M (1998) The TIR1 protein of Arabidopsis
functions in auxin response and is related to human SKP2 and yeast grr1p. Genes Dev 12: 198-207
Sabatini S, Heidstra R, Wildwater M, Scheres B (2003) SCARECROW is involved in positioning the stem cell
niche in the Arabidopsis root meristem. Genes Dev. 17: 354-358
Sabatini S, Beis D, Wolkenfelt H, Murfett J, Guilfoyle T, Malamy J, Benfey P, Leyser O, Bechtold N, Weisbeek
P, Scheres B (1999) An auxin-dependent distal organizer of pattern and polarity in the Arabidopsis root. Cell 99:
463-372
Sato A, Yamamoto KT (2008) What's the physiological role of domain II-less Aux/IAA proteins? Plant Signal
Behav 3(7): 496-497
Schiefelbein JW, Masucci JD, Wang H (1997) Building a root: the control of patterning and morphogenesis
during root development. Plant Cell 9: 1089-1098
Schnable PS, Hochholdinger F, Nakazono M (2004) Global expression profiling applied to plant development.
Curr Opin Plant Biol 7: 50-56
70
Schnable PS, Ware D, Fulton RS, Stein JC, Wei F, Pasternak S, Liang C, Zhang J, Fulton L, Graves TA, Minx P,
Reily AD, Courtney L, Kruchowski SS, Tomlinson C, Strong C, Delehaunty K, Fronick C, Courtney B, Rock
SM, Belter E, Du F, Kim K, Abbott RM, Cotton M, Levy A, Marchetto P, Ochoa K, Jackson SM, Gillam B,
Chen W, Yan L, Higginbotham J, Cardenas M, Waligorski J, Applebaum E, Phelps L, Falcone J, Kanchi K,
Thane T, Scimone A, Thane N, Henke J, Wang T, Ruppert J, Shah N, Rotter K, Hodges J, Ingenthron E, Cordes
M, Kohlberg S, Sgro J, Delgado B, Mead K, Chinwalla A, Leonard S, Crouse K, Collura K, Kudrna D, Currie J,
He R, Angelova A, Rajasekar S, Mueller T, Lomeli R, Scara G, Ko A, Delaney K, Wissotski M, Lopez G,
Campos D, Braidotti M, Ashley E, Golser W, Kim H, Lee S, Lin J, Dujmic Z, Kim W, Talag J, Zuccolo A, Fan
C, Sebastian A, Kramer M, Spiegel L, Nascimento L, Zutavern T, Miller B, Ambroise C, Muller S, Spooner W,
Narechania A, Ren L, Wei S, Kumari S, Faga B, Levy MJ, McMahan L, Van Buren P, Vaughn MW, Ying K,
Yeh CT, Emrich SJ, Jia Y, Kalyanaraman A, Hsia AP, Barbazuk WB, Baucom RS, Brutnell TP, Carpita NC,
Chaparro C, Chia JM, Deragon JM, Estill JC, Fu Y, Jeddeloh JA, Han Y, Lee H, Li P, Lisch DR, Liu S, Liu Z,
Nagel DH, McCann MC, SanMiguel P, Myers AM, Nettleton D, Nguyen J, Penning BW, Ponnala L, Schneider
KL, Schwartz DC, Sharma A, Soderlund C, Springer NM, Sun Q, Wang H, Waterman M, Westerman R,
Wolfgruber TK, Yang L, Yu Y, Zhang L, Zhou S, Zhu Q, Bennetzen JL, Dawe RK, Jiang J, Jiang N, Presting
GG, Wessler SR, Aluru S, Martienssen RA, Clifton SW, McCombie WR, Wing RA, Wilson RK (2009) The B73
maize genome: complexity, diversity, and dynamics. Science 326: 1112-1115
Schnittger A, Weinl C, Bouyer D, Schobinger U, Hulskamp M (2003) Misexpression of the cyclin-dependent
kinase inhibitor ICK1/KRP1 in single-celled Arabidopsis trichomes reduces endoreduplication and cell size and
induces cell death. Plant Cell 15: 303-315
Sekine M, Ito M, Uemukai K, Maeda Y, Nakagami H, Shinmyo A (1999) Isolation and characterization of the
E2F-like gene in plants. FEBS Lett 460: 117-122
Shin R, Burch AY, Huppert KA, Tiwari SB, Murphy AS, Guilfoyle TJ, Schachtman DP (2007) The Arabidopsis
transcription factor MYB77 modulates auxin signal transduction. Plant Cell 19: 2440-2453
Sidorov V, Duncan D (2009) Agrobacterium-mediated maize transformation: immature embryos versus callus.
Methods Mol Biol 526: 47-58
Soni R, Carmichael JP, Shah ZH, Murray JA (1995) A family of cyclin D homologs from plants differentially
controlled by growth regulators and containing the conserved retinoblastoma protein interaction motif. Plant
Cell 7: 85-103
Sorrell DA, Marchbank A, McMahon K, Dickinson JR, Rogers HJ, Francis D (2002) A WEE1 homologue from
Arabidopsis thaliana. Planta 215: 518-522
Sozzani R, Maggio C, Varotto S, Canova S, Bergounioux C, Albani D, Cella R (2006) Interplay between
Arabidopsis activating factors E2Fb and E2Fa in cell cycle progression and development. Plant Physiol 140:
1355-1366
Sun Y, Dilkes BP, Zhang C, Dante RA, Carneiro NP, Lowe KS, Jung R, Gordon-Kamm WJ, Larkins BA (1999)
Characterization of maize (Zea mays L.) Wee1 and its activity in developing endosperm. Proc Natl Acad Sci U S
A 96: 4180-4185
Swarup K, Benkova E, Swarup R, Casimiro I, Peret B, Yang Y, Parry G, Nielsen E, De Smet I, Vanneste S,
Levesque MP, Carrier D, James N, Calvo V, Ljung K, Kramer E, Roberts R, Graham N, Marillonnet S, Patel K,
Jones JD, Taylor CG, Schachtman DP, May S, Sandberg G, Benfey P, Friml J, Kerr I, Beeckman T, Laplaze L,
Bennett MJ (2008) The auxin influx carrier LAX3 promotes lateral root emergence. Nat Cell Biol 10: 946-954
Swiatek A, Lenjou M, Van Bockstaele D, Inze D, Van Onckelen H (2002) Differential effect of jasmonic acid
and abscisic acid on cell cycle progression in tobacco BY-2 cells. Plant Physiol 128: 201-211
Szemenyei H, Hannon M, Long JA (2008) TOPLESS mediates auxin-dependent transcriptional repression
during Arabidopsis embryogenesis. Science 319: 1384-1386

71
Takahashi H (1997) Hydrotropism: the current state of our knowledge. J. Plant Res. 110: 163-169
Tan X, Calderon-Villalobos LI, Sharon M, Zheng C, Robinson CV, Estelle M, Zheng N (2007) Mechanism of
auxin perception by the TIR1 ubiquitin ligase. Nature 446: 640-645
Taramino G, Sauer M, Stauffer JL, Jr., Multani D, Niu X, Sakai H, Hochholdinger F (2007) The maize (Zea
mays L.) RTCS gene encodes a LOB domain protein that is a key regulator of embryonic seminal and post-
embryonic shoot-borne root initiation. Plant J 50: 649-659
Taramino G, Sakai H, Komatsu K, Xiaomu N (2008) Plants with altered root architecture, involving the RUM1
gene, related constructs and methods. Patent application #20080201803. E.I. Dupont de Nemours and Company,
USA
Tatematsu K, Kumagai S, Muto H, Sato A, Watahiki MK, Harper RM, Liscum E, Yamamoto KT (2004)
MASSUGU2 encodes Aux/IAA19, an auxin-regulated protein that functions together with the transcriptional
activator NPH4/ARF7 to regulate differential growth responses of hypocotyl and formation of lateral roots in
Arabidopsis thaliana. Plant Cell 16: 379-393
Tian Q, Reed JW (1999) Control of auxin-regulated root development by the Arabidopsis thaliana SHY2/IAA3
gene. Development 126: 711-721
Tiwari SB, Hagen G, Guilfoyle T (2003) The roles of auxin response factor domains in auxin-responsive
transcription. Plant Cell 15: 533-543
Tiwari SB, Hagen G, Guilfoyle TJ (2004) Aux/IAA proteins contain a potent transcriptional repression domain.
Plant Cell 16: 533-543
Uehara T, Okushima Y, Mimura T, Tasaka M, Fukaki H (2008) Domain II mutations in CRANE/IAA18
suppress lateral root formation and affect shoot development in Arabidopsis thaliana. Plant Cell Physiol 49:
1025-1038
Ulmasov T, Hagen G, Guilfoyle TJ (1999) Activation and repression of transcription by auxin-response factors.
Proc Natl Acad Sci U S A 96: 5844-5849
Ulmasov T, Murfett J, Hagen G, Guilfoyle TJ (1997) Aux/IAA proteins repress expression of reporter genes
containing natural and highly active synthetic auxin response elements. Plant Cell 9: 1963-1971
Umeda M, Shimotohno A, Yamaguchi M (2005) Control of cell division and transcription by cyclin-dependent
kinase-activating kinases in plants. Plant Cell Physiol 46: 1437-1442
Vandepoele K, Raes J, De Veylder L, Rouze P, Rombauts S, Inze D (2002) Genome-wide analysis of core cell
cycle genes in Arabidopsis. Plant Cell 14: 903-916
Vanneste S, De Rybel B, Beemster GT, Ljung K, De Smet I, Van Isterdael G, Naudts M, Iida R, Gruissem W,
Tasaka M, Inze D, Fukaki H, Beeckman T (2005) Cell cycle progression in the pericycle is not sufficient for
SOLITARY ROOT/IAA14-mediated lateral root initiation in Arabidopsis thaliana. Plant Cell 17: 3035-3050
Vanneste S, Friml J (2009) Auxin: a trigger for change in plant development. Cell 136: 1005-1016
Vega JM, Yu W, Kennon AR, Chen X, Zhang ZJ (2008) Improvement of Agrobacterium-mediated
transformation in Hi-II maize (Zea mays) using standard binary vectors. Plant Cell Rep 27: 297-305
Verkest A, Manes CL, Vercruysse S, Maes S, Van Der Schueren E, Beeckman T, Genschik P, Kuiper M, Inze D,
De Veylder L (2005a) The cyclin-dependent kinase inhibitor KRP2 controls the onset of the endoreduplication
cycle during Arabidopsis leaf development through inhibition of mitotic CDKA;1 kinase complexes. Plant Cell
17: 1723-1736
Verkest A, Weinl C, Inze D, De Veylder L, Schnittger A (2005b) Switching the cell cycle. Kip-related proteins
in plant cell cycle control. Plant Physiol 139: 1099-1106

72
Vieten A, Sauer M, Brewer PB, Friml J (2007) Molecular and cellular aspects of auxin-transport-mediated
development. Trends Plant Sci 12: 160-168
Vieten A, Vanneste S, Wisniewska J, Benkova E, Benjamins R, Beeckman T, Luschnig C, Friml J (2005)
Functional redundancy of PIN proteins is accompanied by auxin-dependent cross-regulation of PIN expression.
Development 132: 4521-4531
Wang G, Kong H, Sun Y, Zhang X, Zhang W, Altman N, DePamphilis CW, Ma H (2004) Genome-wide
analysis of the cyclin family in Arabidopsis and comparative phylogenetic analysis of plant cyclin-like proteins.
Plant Physiol 135: 1084-1099
Wang D et al (2007) Genome-wide analysis of the auxin response factors (ARF) gene family in rice (Oryza
sativa). Gene 394: 13-24
Wang H, Qi Q, Schorr P, Cutler AJ, Crosby WL, Fowke LC (1998) ICK1, a cyclin-dependent protein kinase
inhibitor from Arabidopsis thaliana interacts with both Cdc2a and CycD3, and its expression is induced by
abscisic acid. Plant J 15: 501-510
Wang Y, Deng D, Bian Y, Lv Y, Xie Q (2010) Genome-wide analysis of primary auxin-responsive Aux/IAA
gene family in maize (Zea mays. L.). Mol Biol Rep
Weingartner M, Pelayo HR, Binarova P, Zwerger K, Melikant B, de la Torre C, Heberle-Bors E, Bogre L (2003)
A plant cyclin B2 is degraded early in mitosis and its ectopic expression shortens G2-phase and alleviates the
DNA-damage checkpoint. J Cell Sci 116: 487-498
Williamson LC, Ribrioux SP, Fitter AH, Leyser HM (2001) Phosphate availability regulates root system
architecture in Arabidopsis. Plant Physiol 126: 875-882
Wilmoth JC, Wang S, Tiwari SB, Joshi AD, Hagen G, Guilfoyle TJ, Alonso JM, Ecker JR, Reed JW (2005)
NPH4/ARF7 and ARF19 promote leaf expansion and auxin-induced lateral root formation. Plant J 43: 118-130
Wisniewska J, Xu J, Seifertova D, Brewer PB, Ruzicka K, Blilou I, Rouquie D, Benkova E, Scheres B, Friml J
(2006) Polar PIN localization directs auxin flow in plants. Science 312: 883
Woll K, Borsuk LA, Stransky H, Nettleton D, Schnable PS, Hochholdinger F (2005) Isolation, characterization,
and pericycle-specific transcriptome analyses of the novel maize lateral and seminal root initiation mutant rum1.
Plant Physiol 139: 1255-1267
Yang X, Lee S, So JH, Dharmasiri S, Dharmasiri N, Ge L, Jensen C, Hangarter R, Hobbie L, Estelle M (2004)
The IAA1 protein is encoded by AXR5 and is a substrate of SCF(TIR1). Plant J 40: 772-782
Yang Y, Hammes UZ, Taylor CG, Schachtman DP, Nielsen E (2006) High-affinity auxin transport by the AUX1
influx carrier protein. Curr Biol 16: 1123-1127
Zhou Y, Wang H, Gilmer S, Whitwill S, Fowke LC (2003) Effects of co-expressing the plant CDK inhibitor
ICK1 and D-type cyclin genes on plant growth, cell size and ploidy in Arabidopsis thaliana. Planta 216: 604-613
Zimmermann R, Werr W (2005) Pattern formation in the monocot embryo as revealed by NAM and CUC3
orthologues from Zea mays L. Plant Mol Biol 58: 669-685
73
PART VII: ADDENDUM
1.1. Workflow ZM and AT lines
E. coli cells containing an Entry Clone plasmid (e.g. ZM4s13278: will be used as an example)
were received from Cropdesign. To check whether this Entry Clone truly contained the gene
of interest, a restriction digest needs to be performed. An E. coli liquid culture (4 ml LB-
medium containing Zeocine (25 µg / ml)) was incubated overnight at 37 °C. The next day, 3
ml of this liquid culture was used for plasmid isolation with the High Pure Plasmid Isolation
Kit (Roche Applied Science):
Plasmid isolation from E. coli using the High Pure Plasmid Isolation Kit from Roche
Applied Science
Protocol for preparing DNA from 0.5 – 4.0 ml of E. coli culture with a density of 1.5 – 5.0
A600 units per ml.
- Place Binding Buffer on ice
- Prepare the starting material:
o Pellet the bacterial cells from 0.5 – 4.0 ml of E. coli culture with a density of
1.5 – 5.0 A600 units per ml
o Discard the supernatant
o Add 250 µl Suspension Buffer (50 mM Tris-HCl and 10 mM EDTA, pH 8.0) +
RNase A (0.1 mg of supplied RNase A powder / ml Suspension Buffer) to the
centrifuge tube containing the bacterial pellet
o Resuspend the bacterial pellet and mix well
- Treat the resuspended bacterial pellet as follows:
o Add 250 µl Lysis Buffer (0.2 M NaOH and 1 % SDS)
o Mix gently by inverting the tube 3 to 6 times
(to avoid shearing genomic DNA, do not vortex!)
o Incubate for 5 min at any temperature between 15 °C and 25 °C
(do not incubate for more than 5 min!)
- Treat the lysed solution as follows:
o Add 350 µl chilled Binding Buffer (0.4 M guanidine hydrochloride and 0.5 M
potassium acetate, pH 4.2)
o Mix gently by inverting the tube 3 to 6 times
o Incubate on ice for 5 min
(the solution should become cloudy and a flocculant precipitate should form)
o Centrifuge for 10 min at approx. 13,000 g
- After centrifugation:
o Insert one High Pure Filter Tube into one Collection Tube
o Transfer entire supernatant into upper buffer reservoir of the Filter Tube
o Insert the entire High Pure Tube assembly into a standard tabletop
microcentrifuge
o Centrifuge for 1 min at full speed
- After centrifugation:
o Remove the Filter Tube from the Collection Tube, discard the flowthrough
liquid, and re-insert the Filter Tube in the same Collection Tube

74
- To wash the cells:
o Add 700 µl Wash Buffer II (20 mM NaCl and 2 mM Tris-HCl, pH 7.5) to the
upper reservoir of the Filter Tube
o Centrifuge for 30 – 60 s at full speed and discard the flowthrough
- After discarding the flowthrough liquid:
o Centrifuge the entire High Pure tube assembly for additional 1 min
o Discard the Collection Tube
(the extra centrifugation time ensures removal of residual Wash Buffer)
- To elute the DNA:
o Insert the Filter Tube into a clean, sterile 1.5 ml microcentrifuge tube
o Add 80 µl Elution Buffer (10 mM Tris-HCl, pH 8.5) or double dist. water (pH
adjusted to 8.0 – 8.5) to the upper reservoir of the Filter Tube
o Centrifuge the tube assembly for 1 min at full speed
- The microcentrifuge tube now contains the eluted plasmid DNA
Restriction Digest reaction:
The collected Entry Clone plasmid DNA was used in three separate restriction digest
reactions to be completely sure that the Entry Clone truly contains the correct gene.
The Restriction Enzymes PstI, AvaI and NcoI were used with their corresponding Buffer H,
Buffer B and Buffer D.
Restriction Enzyme Buffer
PstI Buffer H
AvaI Buffer B
NcoI Buffer D
Prepare the following mix of components in “PCR strip tubes”
- 7.3 µl milliQ H2O
- 2 µl Buffer (H,B or D)
- 0.2 µl BSA
- 0.5 µl Restriction Enzyme (PstI, AvaI or NcoI)
- 10 µl collected plasmid DNA
The restriction digest reaction was performed overnight at 37 °C.
1% Agarose gel eletrophoresis
The following day, 4 µl Orange G loading dye is added to each restriction digest sample and
used (along with a 5 µl SmartLadderTM
SF Eurogentec) for 1 % agarose gel electrophoresis
(Parameters: 100 V, 25 min, 0.5 x TAE buffer)

75
Protocol for making a 1 % agarose gel:
- Weigh 4 g of “UltraPureTM
Agarose (Invitrogen)
- Transfer into a DURAN 500 ml bottle with a yellow cap
- Add 400 ml of 0.5 x TAE buffer
- Heat in a microwave until the agarose is completely dissolved
- Let the bottle is cool down to approximately 60 °C
- Add 40 µl of SYBR® Safe DNA Stain (Invitrogen) (in the flow hood) and mix
- Take a mold, place a gelholderplate in it and then place the appropriate combs
- Pour the 1% agarose solution until the combs are submerged
- Let the gel harden for approximately 30 min
- Remove the combs gently
- Take the gelholderplate with the gel and place it in the Mini Gel Electrophoresis
System (Labnet) containing 0.5 x TAE buffer
- The gel is now ready for loading samples
- Load 5 µl of Smart Ladder in the first well
- Load 10 µl of each sample in the other wells
- Run electrophoresis for 25 min at 100 V
- Visualize the bands with the Safe Imager (Invitrogen) in combination with the Gel
Logic 100 Imaging System (Kodak).
- Gel images are obtained using the software program KODAK MI
After confirming the Entry Clone contained the correct gene, a Gateway Recombination
reaction is performed to get an Expression Vector.
Entry Clone + Destination Vector Expression Vector
During Gateway Recombination, the attL sites of the Entry Clone recombine with the attR
sites of the Destination Vector to get an Expression Vector containing the p35S:gene:35Sterm
construct.
Protocol Gateway Recombination LR reaction
pENTRY 40 ng ~ 1 µl
pDEST 50 ng ~ 1 µl
LR ClonaseII 1 µl
TE or MilliQ Up to 5 µl
- Mix and incubate at 25 °C for minimum 2 hours (or overnight)
- Add 0.5 µl Proteinase K, mix and incubate at 37 °C for 10 minutes
- Deactivate Proteinase K by putting it at 70 °C for 10 minutes (heating block or oven)
- Keep on ice
- Transform 1 µl into competent E. coli cells
76
E. coli transformation
This is based on the Library Efficiency ® DH5αTM Competent Cells (Invitrogen – 18263-
012), which are heat shock competent E. coli cells that can be used for cloning experiments
and efficient transformation.
- Thaw competent cells on ice
- Place the required number of 14 ml Falcon tubes on ice
- Gently mix the cells by pipetting up and down and aliquot 25 µl competent cells into
the chilled Falcon tubes
- Add 1 µl plasmid
- Incubate 30 minutes on ice
- Have a 42 °C waterbath ready for the next step
- Heat-shock cells for 45 seconds in a 42 °C water bath; do not shake
- Place on ice for 2 minutes
- Add 900 µl of room temperature SOC medium Shake at 225 rpm at 37 °C for 1 hour
- Spread 100 µl on LB medium (plate) containing the appropriate antibiotic
(Spectinomycin) with triangle that is sterilized by dipping in 70 °C ethanol followed
by holding in a flame
- Incubate overnight at 37 °C
Refreezing cells: Cells that have been thawed but not used can be refrozen. Put the cells in a
dry ice / ethanol bath for 5 minutes before returning them to the – 80 °C freezer. Never use
liquid nitrogen! (dry ice: downstairs next to liquid nitrogen canisters, ethanol: in stock room
metal canister next to flow hood left)
- Select several (n = 5 [a – e]) grown single colonies to separately inoculate 4 ml liquid
LB medium (containing Spectinomycin 25 µg/ml) in 6 ml falcon tubes
- Incubate in shaker at 225 rpm at 37 °C overnight
These liquid cultures are then used for plasmid isolation using the High Pure Plasmid
Isolation Kit from Roche Applied Science.
The correct Expression Vector can now be transformed into Agrobacterium.
Preparation of heat-shock / freeze-thaw competent Agrobacterium PMP90 cells
- Grow overnight in 5 ml YEB + Rif / Gm (28 °C, shaker)
- Transfer to 100 ml YEB + Rif / Gm until OD600 = 0.5 – 1.0
(6 – 7 h in Erlenmeyer on shaker at 28 °C)
- Chill Erlenmeyer on ice
- Centrifuge at 3,000 g for 5 min at 4 °C (pre-chilled centrifuge)
- Add 1 ml 20 mM CaCl2 (ice-cold) or 400 µl if less bacteria (29.4 mg/10 ml)
- Make 100 µl aliquots in pre-chilled eppendorfs
These are stored in – 80 °C freezer

77
Transformation of Agrobacterium PMP90 (Freeze – Thaw shock)
- Add 1 µg plasmid (10 µl)
- Vortex
- Freeze in liquid N2
- Thaw in 37 °C waterbath (5 min)
- Add 1 ml YEB
- Incubate for 2 h at 28 °C shaking
- Centrifuge 30 s at 3,000 g
- Take away supernatans (900 µl)
- Resuspend pellet in 100 µl YEB (stands for??)
- Plate out on YEB – plate Rif/Gm/Sp
- Colonies after 2 days at 28 °C (Oven in LAF Bacteria Room 1st floor next to ice room)
After the colonies are of sufficient size, a colony-mix is taken to inoculate a liquid culture
[100 ml YEB medium containing 100 µl Rifampicin (50 µg / ml), 100 µl Gentamycin (40 µg /
ml) and 100 µl Spectinomycin (100 µg / ml)]
This liquid culture will be used for floral dip of Arabidopsis.
A stock of this Agrobacterium in liquid culture is made by taking 500 µl of the liquid culture
containing the colony mix (just made by inoculating it) and adding 500 µl 100 % glycerol (in
a screw tube eppendorf) and then freeze in liquid nitrogen and is then stored in the – 80 °C
freezer.
Seed sterilization
There are two possibilities of seed sterilization (bleach sterilization and chloral gas
sterilization)
Bleach sterilization
- The desired amount of Arabidopsis seeds is collected in a 1.5 ml eppendorf
- Add 1 ml 70 % EtOH and incubate 2 min.
- Remove EtOH.
- Add 1 ml of NaOCl-solution for 10 min (Bleach-solution in flow!).
(10 ml NaOCl - solution contains: 3.85 ml NaOCl, 5 µl Tween 20 and 6.15 ml H20)
- Remove NaOCl in sterile environment (Laminar Flow) with sterile cut pipette-tips
(200 µl).
- Wash five times with 1 ml of sterile H20.
- Keep sterilized seeds in 1 ml of sterile H20 and store in fridge at 4°C.
- Sowing is done after a minimum of 2 days acclimation at 4 °C
Chloral gas sterilization
This method uses toxic chlorine gas and should therefore always be performed in a safe fume
hood.
Reagentia:
100 ml sodium hypochlorite
3.3 ml hydrochloric acid fuming 37 °C

78
- Place labeled 2 ml eppendorfs containing the seeds (eppendorf remains open) in an
approximately 8 liter bell jar under a fume hood containing a beaker with 100 ml of bleach
(sodium hypochlorite).
- Put on the lid of the jar, but leave a small opening for a pipet
- Add 3.3 ml of hydrochloric acid fuming 37% (HCl) to the bleach through that opening and
quickly seal the jar
- Sterilize for at least 4 hours or overnight
- After sterilization, remove the lid of the jar and leave it open in the fume hood for at least 20
minutes. Do not take the jar or lid out of the fumehood!
- Close the eppendorfs and put them in a vertical flow
- Open the tubes to let the remaining chlorine gas escape for about an hour at least
- Discard the beaker in the sink after an extra night in the fumehood. Do not let it stand in the
fumehood until all liquid is evaporated
- Sow the same day
Bleach sterilization Chlorine gas sterilization
Advantages Fast (1 hour) Suitable for large amounts
Safer Less labor-intensive
Disadvantages Labor-intensive Dangerous
The seeds are kept in
water and can germinate
after some time
You have to sow the same day,
since the seed viability
decreases in time
Sow after 2 days
stratification at 4 °C
Slow (4 hours or overnight)
In general, the bleach sterilization is used for small amounts of seed samples, while the
chlorine gas sterilization is used for large amounts of seed samples.

79
Protocol Growth Medium for Arabidopsis thaliana (K1-medium,0.5 x MS)
- Mix the following components on a magnet-mixer
0.5 L 1.0 L 1.5 L 2.0 L 3.0 L 4.0 L 5.0 L
MS salts
(Duchefa
Biochemie,
Haarlem, The
Netherlands) 1.077 g 2.154 g 3.231 g 4.308 g 6.462 g 8.616 g 10.77g
Sucrose (Acros
Organics, New
Jersey, USA) 5 g 10 g 15 g 20 g 30 g 40 g 50g
Myo-inositol
(Sigma Aldrich) 0.05 g 0.1 g 0.15 g 0.2 g 0.3 g 0.4 g 0.5g
MES (Duchefa
Biochemie,
Haarlem, The
Netherlands) 0.25 g 0.5 g 0.75 g 1 g 1.5 g 0.2 g 2.5g
MilliQ water 0.5 L 1.0 L 1.5 L 2.0 L 3.0 L 4.0 L 5.0 L
- Adjust pH to 5.7 with 1 M KOH (Merck, Darmstadt, Germany) (pH-optimum for agar
solidification) [flow hood stock room]
- Add 8 g / L Plant Tissue Culture Agar, which is special Agar for plant tissues and not
just any Agar ( = 0.8 %) 4 g / 0.5 L DURAN bottle
- The growth medium is sterilized by autoclaving 20 minutes at 121°C (1 atm) and
after that kept in 60 °C oven.
Murashige & Skoog (MS) salts & 2-[N-Morpholino]ethane sulfonic acid (MES)
In case of making antibiotic selection growth media, 500 µl of the desired antibiotic
(kanamycin, hygromycin and/or carbenicilin) is added to the 500 ml liquid growth medium (=
1000 x dilution of antibiotic stock solutions) (make sure growth medium is cooled down until
you can hold it in your hands without burning yourself to avoid antibiotic degradation)
For UAS::AT lines = Hygromycin (in case of T1 selection also Carbenicilin)
For 35S::ZM lines = Kanamycin (in case of T1 selection also Carbenicilin)
Next, square Petri dishes (120x120x70 mm, Greiner Labortechnik, Frickenhausen, Germany)
are poured with the growth medium (approximately 50 ml/plate) (with or without antibiotic)
and left to harden in the laminar flow hood
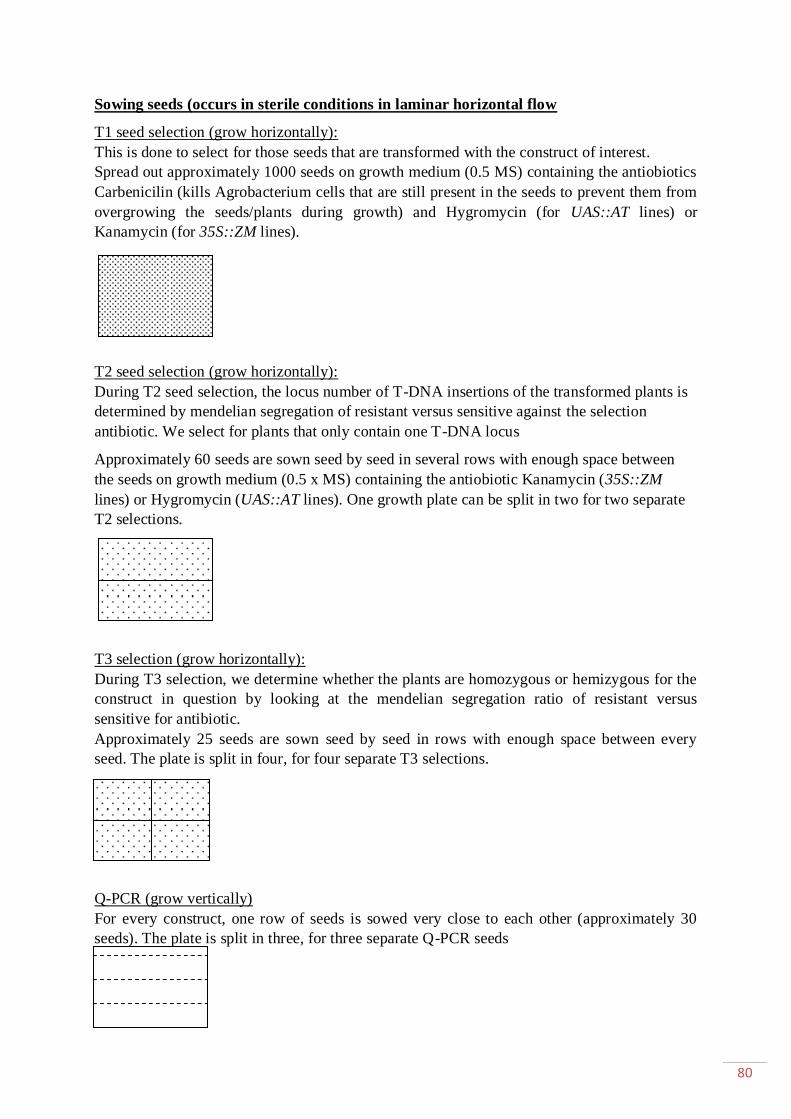
80
Sowing seeds (occurs in sterile conditions in laminar horizontal flow
T1 seed selection (grow horizontally):
This is done to select for those seeds that are transformed with the construct of interest.
Spread out approximately 1000 seeds on growth medium (0.5 MS) containing the antiobiotics
Carbenicilin (kills Agrobacterium cells that are still present in the seeds to prevent them from
overgrowing the seeds/plants during growth) and Hygromycin (for UAS::AT lines) or
Kanamycin (for 35S::ZM lines).
T2 seed selection (grow horizontally):
During T2 seed selection, the locus number of T-DNA insertions of the transformed plants is
determined by mendelian segregation of resistant versus sensitive against the selection
antibiotic. We select for plants that only contain one T-DNA locus
Approximately 60 seeds are sown seed by seed in several rows with enough space between
the seeds on growth medium (0.5 x MS) containing the antiobiotic Kanamycin (35S::ZM
lines) or Hygromycin (UAS::AT lines). One growth plate can be split in two for two separate
T2 selections.
T3 selection (grow horizontally):
During T3 selection, we determine whether the plants are homozygous or hemizygous for the
construct in question by looking at the mendelian segregation ratio of resistant versus
sensitive for antibiotic.
Approximately 25 seeds are sown seed by seed in rows with enough space between every
seed. The plate is split in four, for four separate T3 selections.
Q-PCR (grow vertically)
For every construct, one row of seeds is sowed very close to each other (approximately 30
seeds). The plate is split in three, for three separate Q-PCR seeds

81
Macro-Phenotyping (grow vertically)
Sow one row of 8 seeds
General:
Note down your name, construct (e.g. 35S::ZM32 or UAS::AT3), mention generation (T1,
T2, T3,…) and the date that the plate is put in the growth chamber (remember seeds are first
put two days at 4 °C stratification). Wrap MicroporeTM
Tape around the square petri dishes
for keeping the inside sterile.
Planting in soil
Plants from T1 selection that are resistant, plants with one T-DNA locus from T2 selection
that are resistant, T3 selection that are homozygous (or T4 plants that are homozygous or T3
plants that are hemizygous and need another round for selection of homozygous lines) are
transferred to soil.
- Place the desired amount of jiffy’s in water
- Write name of plant line on white plastic labels
- Put tape in the corner of tray with name and date written on it
- Once the jiffy’s have taken up a sufficient amount of water they are placed in the tray
- Take a 1 ml pipet tip and make holes in which you can place the plants
- Use a tweezer to pick up plants from plates and transfer into soil
- Fill the hole afterwards with soil using the tweezer and 1 ml pipet tip
- Put the tray in a growth chamber (conditions: 06.00 – 22.00 light, 21°C)
Plant growth
After the plants have grown to a sufficient size, place Aracons (Betatech, Belgium) over them.
After they have grown to the next sufficient size limit, place Arasheets (Betatech, Belgium)
over them (to prevent cross-contamination, and falling over of plants)
Seed harvesting
Material:
Scissor, blue marker, white A4 sized paper sheet, small white paperbags for seeds
- Use a scissor to cut the dry plants at their base under the aracon
- Take the plant, arasheet and aracon out of the tray
- Remove seeds from the aracon in a green box (biological waste) and throw aracon in a
box for empty aracons
- Hold the arasheet containing the dry plant over a white A4 size papersheet (which is
folded first) and rub the arasheet such that the seeds fall onto the papersheet
- Remove the plant material into the green box and throw the arasheet in the grey box
- Fold the papersheet and remove the dry siliques and remaining plantmaterial in the
green box
- Collect the seeds in paperbags
- Write name of plant line on the white paperbags (name is on white plastic label,
remember that T1 becomes T2, T2 becomes T3, T3 becomes T4 etc)

82
RNA extraction protocol (Trizol – Qiagen hybrid)
To perform a Q-PCR reaction or RT-PCR reaction on plant material, the roots are first cut off
with a sterile RNase free scalpel and are collected with a sterile RNase-free tweezer into a 2
ml sterile RNase-free eppendorf. Drop the eppendorf in liquid nitrogen to freeze the root
material (optional: the plant material can be stored at -80 °C in the freezer, but when used for
RNA extraction should first be put in liquid nitrogen again before grinding).
Plant material grinding can be done in two ways:
The manual way, in which pistels that are treated with RNase ERASE are used to grind the
plant material in the eppendorf, which is kept in liquid nitrogen during grinding.
The Retscher grinder way, in which the 2 ml eppendorfs are put in holding blocks (stored in –
80 °C freezer) and then grinded at 30 Hz for 30 seconds. REMARK: make sure eppendorfs
are labeled on top AND on the side, because the top can be damaged during grinding and
thereby erasing the name of the plant sample!
- Grind plant material in liquid N2
- Make sure the eppendorfs are still labeled on top and on the side, and wrap transparent
tape around the eppendorf to make sure that the notes on the side can not be erased
during further handling (many steps include solutions that can erase the names!)
- Add 1 ml TRIZOL, this is done under the fume hood (stored in fridge at 4 °C)
- Mix well and keep 5 min at room temperature (RT) (under fume hood)
- Add 0.2 ml chloroform and shake for 15 s (under fume hood)
- Centrifuge at 12,000 g for 15 min at 4 °C in standard table top centrifuge
- After the phase separation, transfer the upper layer in new tube (label top and size and
wrap transparent tape around side) (under fume hood)
- Add 0.5 ml isopropanol (under fume hood)
- 10 min at RT (under fume hood)
- Transfer to an RNeasy column (pink) and centrifuge at 8,000 g for 15 s (RT) and
discard the flow through in organic solvents containing halogens (this is done in two
steps of 500 µl, since no more than 700 µl should be loaded onto the RNeasy column
in one step and our sample contains around 1 ml) (under fume hood)
- Add 700 µl RW1 buffer and centrifuge at 8,000 g for 15 s (RT) and discard the flow
through (bench)
- Add 500 µl RPE buffer and centrifuge at 8,000 g for 2 min (RT) and discard the flow
through (bench)
- Add 500 µl RPE buffer and centrifuge at 8,000 g for 2 min (RT) and discard the flow
through (bench)
- New tube and centrifuge at max g for 1 min (bench)
- Place column in a new tube (bench)
- Add 40 µl DEPEC water or Rnase free water from the Qiagen kit, and centrifuge at
8,000 g for 1 min (RT) (bench)
- Measure concentration (NanoDrop ND – 1000 Spectrophotometer) (Systems biology
of yield group lab)
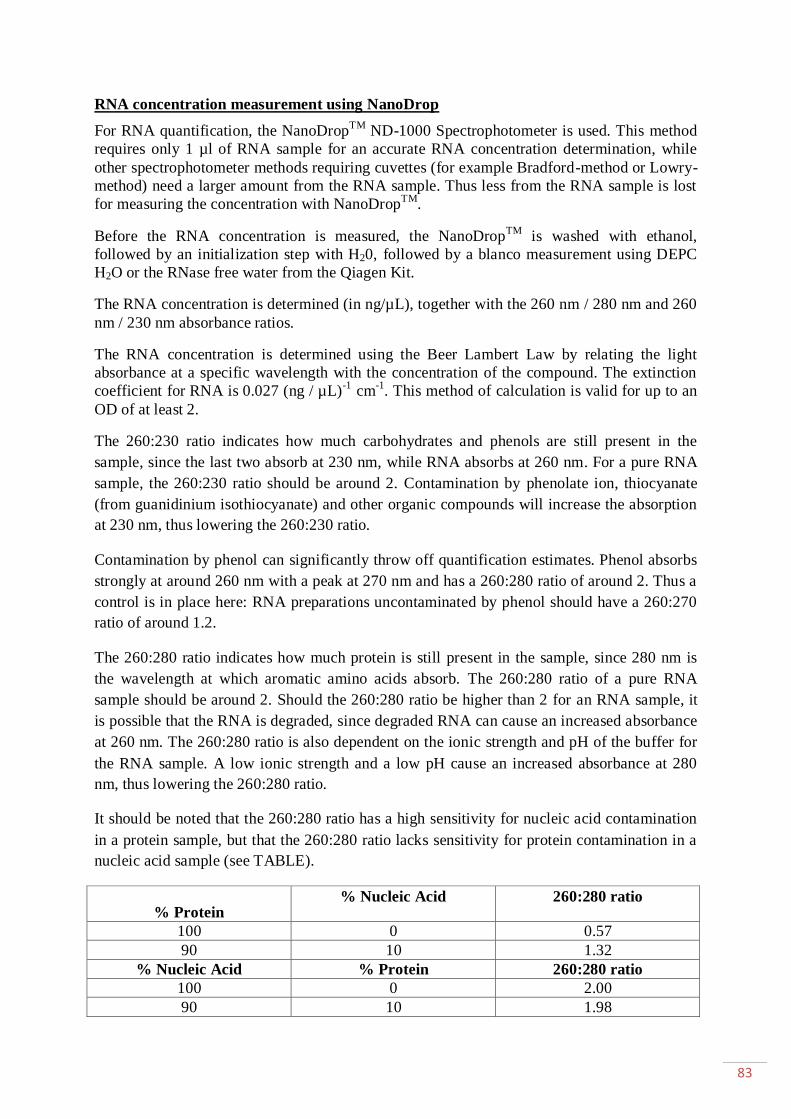
83
RNA concentration measurement using NanoDrop
For RNA quantification, the NanoDropTM
ND-1000 Spectrophotometer is used. This method
requires only 1 µl of RNA sample for an accurate RNA concentration determination, while
other spectrophotometer methods requiring cuvettes (for example Bradford-method or Lowry-
method) need a larger amount from the RNA sample. Thus less from the RNA sample is lost
for measuring the concentration with NanoDropTM
.
Before the RNA concentration is measured, the NanoDropTM
is washed with ethanol,
followed by an initialization step with H20, followed by a blanco measurement using DEPC
H2O or the RNase free water from the Qiagen Kit.
The RNA concentration is determined (in ng/µL), together with the 260 nm / 280 nm and 260
nm / 230 nm absorbance ratios.
The RNA concentration is determined using the Beer Lambert Law by relating the light
absorbance at a specific wavelength with the concentration of the compound. The extinction
coefficient for RNA is 0.027 (ng / µL)-1
cm-1
. This method of calculation is valid for up to an
OD of at least 2.
The 260:230 ratio indicates how much carbohydrates and phenols are still present in the
sample, since the last two absorb at 230 nm, while RNA absorbs at 260 nm. For a pure RNA
sample, the 260:230 ratio should be around 2. Contamination by phenolate ion, thiocyanate
(from guanidinium isothiocyanate) and other organic compounds will increase the absorption
at 230 nm, thus lowering the 260:230 ratio.
Contamination by phenol can significantly throw off quantification estimates. Phenol absorbs
strongly at around 260 nm with a peak at 270 nm and has a 260:280 ratio of around 2. Thus a
control is in place here: RNA preparations uncontaminated by phenol should have a 260:270
ratio of around 1.2.
The 260:280 ratio indicates how much protein is still present in the sample, since 280 nm is
the wavelength at which aromatic amino acids absorb. The 260:280 ratio of a pure RNA
sample should be around 2. Should the 260:280 ratio be higher than 2 for an RNA sample, it
is possible that the RNA is degraded, since degraded RNA can cause an increased absorbance
at 260 nm. The 260:280 ratio is also dependent on the ionic strength and pH of the buffer for
the RNA sample. A low ionic strength and a low pH cause an increased absorbance at 280
nm, thus lowering the 260:280 ratio.
It should be noted that the 260:280 ratio has a high sensitivity for nucleic acid contamination
in a protein sample, but that the 260:280 ratio lacks sensitivity for protein contamination in a
nucleic acid sample (see TABLE).
% Protein % Nucleic Acid 260:280 ratio
100 0 0.57
90 10 1.32
% Nucleic Acid % Protein 260:280 ratio
100 0 2.00
90 10 1.98

84
cDNA synthesis: using SuperScriptTM
III First-Strand Synthesis System for RT-PCR kit
from Invitrogen
RNA targets from 100 bp to >12kb can be detected with this system.
Protocol
Denaturation step RNA (x µl) + 50 µM oligo(dT)20 Primer (1 µl) + 10 mM dNTP mix
(1 µl) + DEPC-treated water (up to 10 µl) at 65°C for 5 min
Place on ice for at least 1 min
Annealing step Add 10 µl cDNA Synthesis Mix to each RNA / primer mixture, mix
gently, and collect by brief centrifugation
cDNA synthesis 50°C for 50 minutes
Terminate Reaction 85°C for 5 minutes and chill on ice. Collect reactions by brief
centrifugation.
Remove RNA Add 1 µl of RNase H and incubate for 20 minutes at 37°C
Final step Add 500 µl MilliQ water
cDNA Synthesis Mix 1 reaction
10 x RT buffer 2 µl
25 mM MgCl2 4 µl
0.1 M DTT 2 µl
RNaseOUTTM
(40 U / µl) 1 µl
SuperScriptTM
III RT (200 U / µl) 1 µl
Total 10 µl
General remark: label samples on top and on the side of the eppendorf and mention the date of
cDNA synthesis.
- After NanoDropTM measurement, the concentration of RNA (ng / µL) was determined and from this we can calculate the volume of the RNA sample we have to use, to get a final concentration of RNA of 1 µg in 4 µl (diluted in MQ H2O).
- Next, 0.5 µl oligo (dT)20 (50 µM) and 0.5 µl dNTP mix (10 mM) are added. - This is put at 65 °C for 5 min (Denaturation) and then 5 min on ice. - Then 5 µl of MasterMix (At room temperature for annealing) is added containing:
o 1 µl 10x RT buffer [200 mM Tris – HCl (pH 8.4), 500 mM KCl]
o 2 µl 25mM MgCl2 o 1 µl 0.1 M DTT o 0.5 µl RNaseOUTTM (40 U / µl) o 0.5 µl SuperscriptTM III RT (200 U / µl)
- This is incubated for 50 min at 50 °C (Temperature optimum for SuperScriptTM III cDNA synthesis).
- Then for 5 min at 85 °C (Termination of the cDNA synthesis reaction).
- If RNA removal is desired: Add 1 µl RNase H and incubate for 20 min at 37 °C. - Finally 500 µl DEPC H2O is added to get the cDNA sample. - This is stored at - 20 °C.
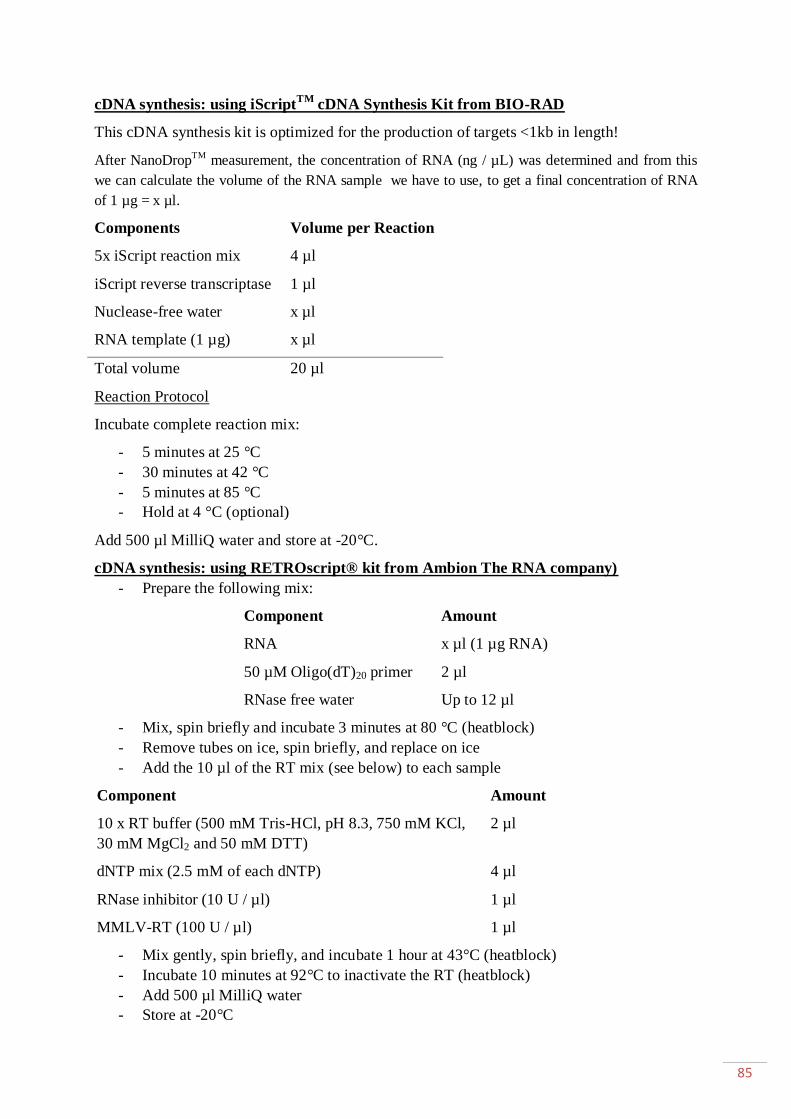
85
cDNA synthesis: using iScriptTM
cDNA Synthesis Kit from BIO-RAD
This cDNA synthesis kit is optimized for the production of targets <1kb in length!
After NanoDropTM measurement, the concentration of RNA (ng / µL) was determined and from this
we can calculate the volume of the RNA sample we have to use, to get a final concentration of RNA
of 1 µg = x µl.
Components Volume per Reaction
5x iScript reaction mix 4 µl
iScript reverse transcriptase 1 µl
Nuclease-free water x µl
RNA template (1 µg) x µl
Total volume 20 µl
Reaction Protocol
Incubate complete reaction mix:
- 5 minutes at 25 °C
- 30 minutes at 42 °C
- 5 minutes at 85 °C
- Hold at 4 °C (optional)
Add 500 µl MilliQ water and store at -20°C.
cDNA synthesis: using RETROscript® kit from Ambion The RNA company)
- Prepare the following mix:
Component Amount
RNA x µl (1 µg RNA)
50 µM Oligo(dT)20 primer 2 µl
RNase free water Up to 12 µl
- Mix, spin briefly and incubate 3 minutes at 80 °C (heatblock)
- Remove tubes on ice, spin briefly, and replace on ice
- Add the 10 µl of the RT mix (see below) to each sample
Component Amount
10 x RT buffer (500 mM Tris-HCl, pH 8.3, 750 mM KCl,
30 mM MgCl2 and 50 mM DTT)
2 µl
dNTP mix (2.5 mM of each dNTP) 4 µl
RNase inhibitor (10 U / µl) 1 µl
MMLV-RT (100 U / µl) 1 µl
- Mix gently, spin briefly, and incubate 1 hour at 43°C (heatblock)
- Incubate 10 minutes at 92°C to inactivate the RT (heatblock)
- Add 500 µl MilliQ water
- Store at -20°C

86
Q-PCR using Janus Robot and iCycler
One well in the 384 - microtiterplate contains:
- 2.5 µl 2x Mix (Lightcycler 480 SYBR GREEN I Master 2x Concentration)
- 2 µl cDNA sample (cDNA obtained from 1 µg RNA in 620 µl DEPC H2O)
- 0.5 µl primers (forward and backward 5 µM each)
2x SYBR Green PCR Master Mix contains: HotStarTaq DNA Polymerase, QuantiTect SYBR
Green PCR Buffer, dNTP Mix, SYBR Green I and ROX passive reference dye.
Before mounting the 384 – microtiterplate on the LightCycler 480, the 384 – microtiterplate
has to be covered with a transparent plastic and centrifuged for 3 min at 3000 x g to make sure
all components for the PCR – reaction are at the bottom of the well.
Q – PCR program:
Pre-incubation 95 °C 10 min
95 °C 10 s
Amplification (45 cycles) 60 °C 15 s
72 °C 15 s
Melting curve 65 °C - 97 °C 2.5 °C/s
Cool Down 97 °C - 40 °C /
Q-PCR manual 96x well plate iCycler
Set up:
Component 1 reaction
MilliQ water 4 µl
SYBR mix 12.5 µl
Fluoresceine (1/10000) 2.5 µl
Fw primer (10 mM) 0.5 µl
Rev primer (10 mM) 0.5 µl
cDNA 5 µl
Done in 96x well plates

87
Q-PCR program
1x 2 min 50°C
1x 8 min 30 s 95°C
50x 20 s 95°C
20 s 55°C
1x 15 min 30 s 94°C
1x ∞ 10°C
Results are analyzed using Qbase.
RT-PCR
Set up:
Component 1 reaction
10x PCR mix 2 µl
5 mM dNTPs 0.5 µl
MgCl2 0.6 µl
10 mM Fw primer 1 µl
10 mM Rev primer 1 µl
MilliQ water 9.8 µl
cDNA 5 µl
RT-PCR program
1x 3 min 95°C
20 s 97°C
35x 45 s 56°C
x s 72°C
1x 5 min 72°C
1x ∞ 15°C
X depends on the amplicon length (Taq polymerase has an elongation rate of 1kb / min).
4 µl Orange G loading dye is added to each sample and used in 1% Agarose gel
electrophoresis (SYBR safe/green?) [25 min at 100 V].

88
Macroscopically phenotyping root system using ImageJ1.41
- Use a light microscope to count (and mark with dots) the number of lateral roots of the
primary root of every plant and note down the number of lateral roots on the plate
- Scan the growth plates, with the agar-side downwards, and make sure that the date,
plant line name are visible, and add a ruler for setting the scale afterwards
- Open ImageJ1.41
- Select open new file: open scanned jpg. Files
- Rightmouseclick on line-selections and select straight lines
- Click at 0 cm line of the ruler and hold/drag till 5 cm
- Go to Analyze, Set Scale, fill in 5.00 cm at Known Distance and mark Global to keep
this scale for all images of that day (note down scale: e.g. 236.50 pixels / cm)
- Rightmouseclick on line-selections and select segmented lines
- Zoom in on image by + sign or zoom out on image by – sign
- Go over the primary root of a plant using the segmented lines
- To measure the length of a segmented line, press the M key (measure)
- In the results-window, go to Edit, Set Measurements and de-mark Area, Min&Max
Gray Value, Mean Gray Value (and others if necessary) to only have length
measurements
- Note down the results in an Excell sheet

89
1.2. Protocols WRKY project
Gateway Recombination Cloning
We start with the Entry Clone :
- An Entry Clone that contains a WRKY23-SRDX construct (closed end) flanked by an
L1 and L3 site.
And the Destination Vectors:
- pK7WG2: contains the 35S promoter
The following construct was made:
p35S::WRKY23-SRDX
Components Amount
MilliQ water 2 µl
pK7WG2 Destination Vector 1 µl
WRKY23-SRDX Entry Clone 1 µl
LR Clonase (normal) 1 µl
Collect these components in small PCR tubes and incubate overnight at 25°C (oven
freezer room)
- Remove samples from 25°C oven
- Add 0.5 µl Proteinase K and incubate 10 minutes at 37°C
- Deactivate Proteinase K by incubating 10 minutes at 70°C
E. coli transformation
This is based on the Library Efficiency ® DH5αTM Competent Cells (Invitrogen – 18263-
012), which are heat shock competent E. coli cells that can be used for cloning experiments
and efficient transformation.
- Thaw competent cells (- 80 °C freezer red boxes) on ice
- Place the required number of 14 ml Falcon tubes on ice
- Gently mix the cells by pipetting up and down and aliquot 25 µl competent cells into
the chilled Falcon tubes (in LAF bacteria room in lateral flow)
- Add 1 µl plasmid
- Incubate 30 minutes on ice
- Have a 42 °C waterbath ready for the next step
- Heat-shock cells for 45 seconds in a 42 °C water bath; do not shake
- Place on ice for 2 minutes
- Add 900 µl of room temperature SOC medium (contains???) (in LAF bacteria room in
lateral flow)
- Shake at 225 rpm at 37 °C for 1 hour (shaker in ice room)
- Spread 100 µl on LB medium (plate) containing the appropriate antibiotic
(Spectinomycin) with triangle that is sterilized
- Incubate overnight at 37 °C (oven root development lab)
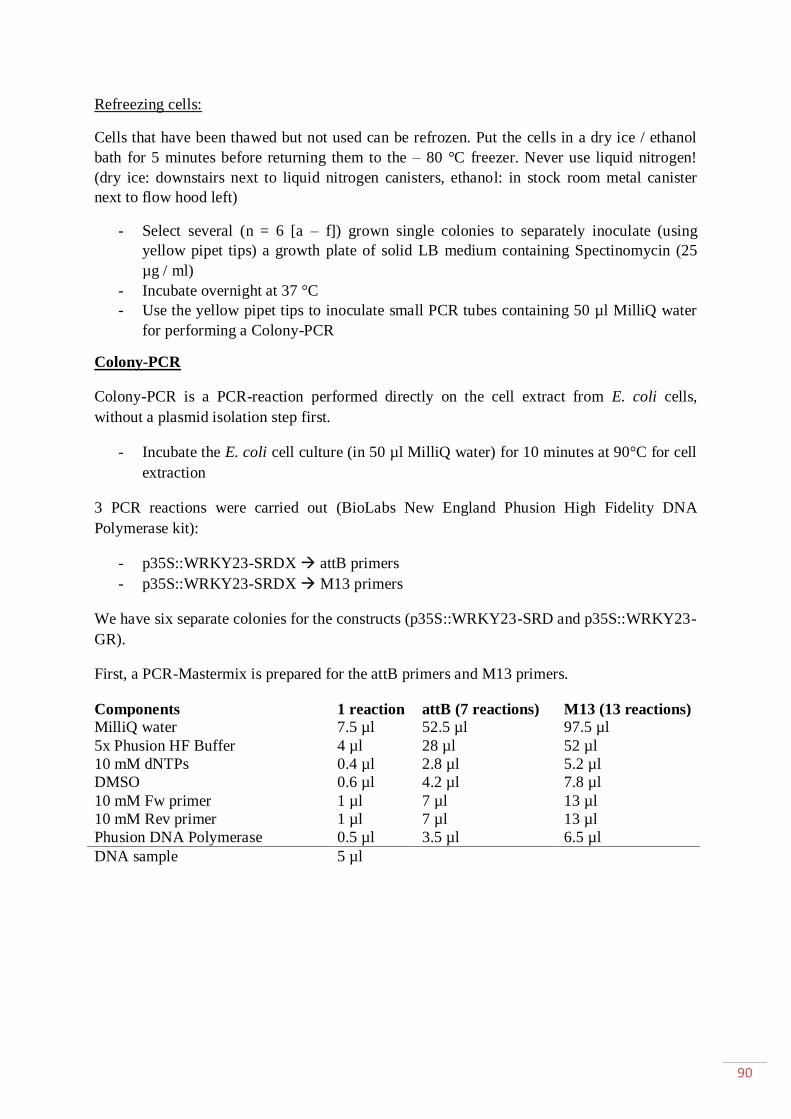
90
Refreezing cells:
Cells that have been thawed but not used can be refrozen. Put the cells in a dry ice / ethanol
bath for 5 minutes before returning them to the – 80 °C freezer. Never use liquid nitrogen!
(dry ice: downstairs next to liquid nitrogen canisters, ethanol: in stock room metal canister
next to flow hood left)
- Select several (n = 6 [a – f]) grown single colonies to separately inoculate (using
yellow pipet tips) a growth plate of solid LB medium containing Spectinomycin (25
µg / ml)
- Incubate overnight at 37 °C
- Use the yellow pipet tips to inoculate small PCR tubes containing 50 µl MilliQ water
for performing a Colony-PCR
Colony-PCR
Colony-PCR is a PCR-reaction performed directly on the cell extract from E. coli cells,
without a plasmid isolation step first.
- Incubate the E. coli cell culture (in 50 µl MilliQ water) for 10 minutes at 90°C for cell
extraction
3 PCR reactions were carried out (BioLabs New England Phusion High Fidelity DNA
Polymerase kit):
- p35S::WRKY23-SRDX attB primers
- p35S::WRKY23-SRDX M13 primers
We have six separate colonies for the constructs (p35S::WRKY23-SRD and p35S::WRKY23-
GR).
First, a PCR-Mastermix is prepared for the attB primers and M13 primers.
Components 1 reaction attB (7 reactions) M13 (13 reactions)
MilliQ water 7.5 µl 52.5 µl 97.5 µl
5x Phusion HF Buffer 4 µl 28 µl 52 µl
10 mM dNTPs 0.4 µl 2.8 µl 5.2 µl
DMSO 0.6 µl 4.2 µl 7.8 µl
10 mM Fw primer 1 µl 7 µl 13 µl
10 mM Rev primer 1 µl 7 µl 13 µl
Phusion DNA Polymerase 0.5 µl 3.5 µl 6.5 µl
DNA sample 5 µl

91
PCR program:
1x 3 min 95°C
20 s 97°C
25x 45 s 56°C
1 min 30 s 72°C
1x 5 min 72°C
1x ∞ 15°C
To verify the Colony-PCR results, a restriction digest was performed on the plasmids. First,
the plasmids were isolated using the High Pure Plasmid Isolation Kit (Roche Applied
Science).
Restriction Digest
We used the PstI (Buffer H) restriction digest on the construct for two colonies.
Prepare the following:
Component Amount (1 reaction) Amount (5 reactions)
Buffer H 2 µl 10 µl
BSA 0.2 µl 1.0 µl
MilliQ water 7.3 µl 36.5 µl
PstI 0.5 µl 2.5 µl
Plasmid DNA 10 µl
- Incubate 3 hours at 37°C
- Add 4 µl Orange G Loading Dye
- Load on 1% Agarose gel electrophoresis in 0.5x TAE buffer for 25 min at 100 V
The best ones were used for Agrobacterium transformation.
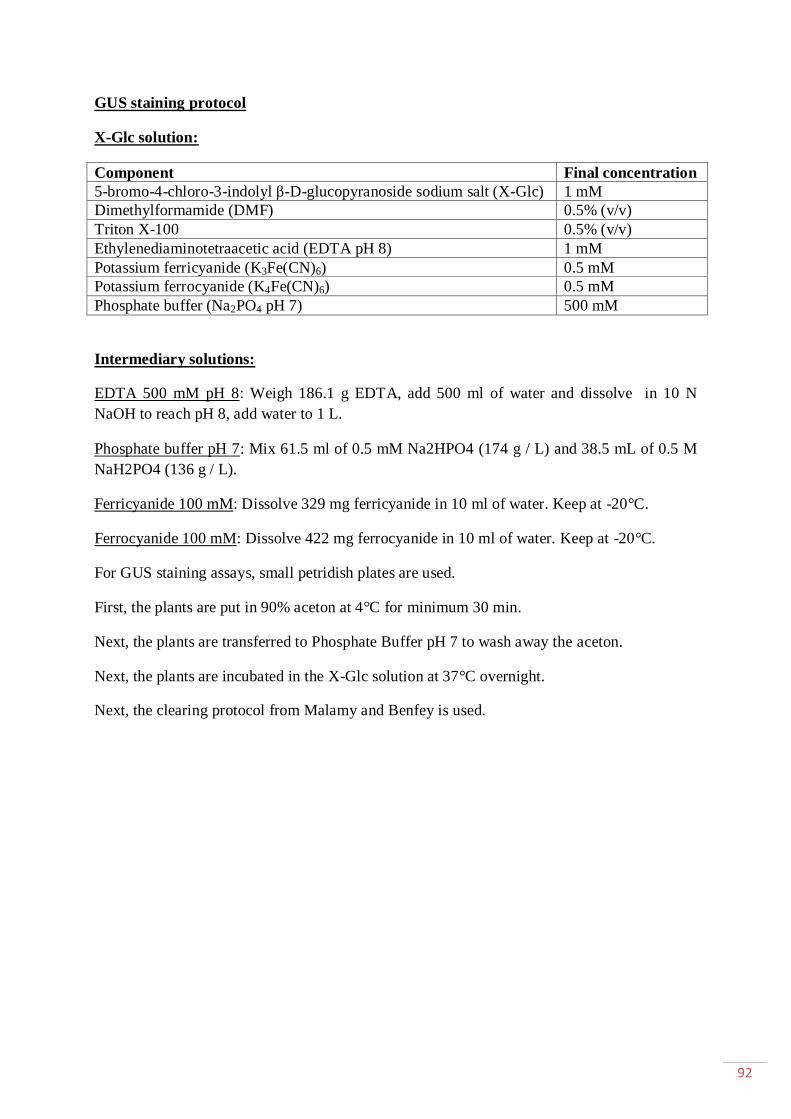
92
GUS staining protocol
X-Glc solution:
Component Final concentration
5-bromo-4-chloro-3-indolyl β-D-glucopyranoside sodium salt (X-Glc) 1 mM
Dimethylformamide (DMF) 0.5% (v/v)
Triton X-100 0.5% (v/v)
Ethylenediaminotetraacetic acid (EDTA pH 8) 1 mM
Potassium ferricyanide (K3Fe(CN)6) 0.5 mM
Potassium ferrocyanide (K4Fe(CN)6) 0.5 mM
Phosphate buffer (Na2PO4 pH 7) 500 mM
Intermediary solutions:
EDTA 500 mM pH 8: Weigh 186.1 g EDTA, add 500 ml of water and dissolve in 10 N
NaOH to reach pH 8, add water to 1 L.
Phosphate buffer pH 7: Mix 61.5 ml of 0.5 mM Na2HPO4 (174 g / L) and 38.5 mL of 0.5 M
NaH2PO4 (136 g / L).
Ferricyanide 100 mM: Dissolve 329 mg ferricyanide in 10 ml of water. Keep at -20°C.
Ferrocyanide 100 mM: Dissolve 422 mg ferrocyanide in 10 ml of water. Keep at -20°C.
For GUS staining assays, small petridish plates are used.
First, the plants are put in 90% aceton at 4°C for minimum 30 min.
Next, the plants are transferred to Phosphate Buffer pH 7 to wash away the aceton.
Next, the plants are incubated in the X-Glc solution at 37°C overnight.
Next, the clearing protocol from Malamy and Benfey is used.
93
Alternative GUS staining protocol
Material:
- Solution A: 90% aceton (kept at 4°C)
- Solution B: NT-buffer (100 mM Tris / 50 mM NaCl)
o for 1 liter: 100 mM Tris = 12.114 g / L in H2O (pH 7.0 with HCl and KOH)
50 mM NaCl = 2.922 g / L
- Solution C: ferricyanide stock (0.32 g K3Fe(CN)6 in 10 ml NT-buffer
- Solution D: ferricyanide solution (49 ml NT-buffer + 1 ml ferricyanide stock)
- Solution E: X-Glc stock (0.0261 g X-Glc in 500 µl DMSO
- Solution F: assay-solution (24.5 ml ferricyanide solution + 0.5 ml X-Glc stock)
Note: Always make solutions D, E and F fresh.
Protocol:
- Harvest plants
- Incubate in solution A for minimum 30 minutes (maximum overnight) at 4°C
- Replace solution A with solution B (wash away aceton)
- Incubate in solution D for minimum 30 minutes at 37°C
- Replace solution D with solution F and incubate at 37°C overnight
- Wash plants in NT-buffer for 5 minutes at room temperature
Lugol staining: p35S::ZM14 lines crossed with QC184 lines
- Transfer plants to lugol for 5 minutes at room temperature
- Transfer to water, to wash away lugol-staining solution
Next, the plants are mounted on slides in chloral hydrate fixative, which is better to look at
meristems (but lugol-staining disappears faster).
Chloral hydrate fixate: 250 g chloral hydrate + 94 ml H2O + 25 ml glycerol
Clearing protocol from Malamy and Benfey
The Malamy & Benfey clearing method is used for DIC-microscopy preparation of whole
mounts.
Material needed:
- Solution 1: 0.24 N HCl in 20% methanol (100 ml 20% methanol + 2 ml 37% HCl)
- Solution 2: 7% NaOH in 60% ethanol (100 ml 60% ethanol + 7g NaOH)
Protocol:
- Roots are transferred to small Petri dishes containing 0.24 M HCl in 20 % methanol
and incubated on a 57 °C heat block for 15 min.
- This solution is replaced with 7 % NaOH, 7 % hydroxylamine - HCl in 60 % ethanol
for 15 min at room temperature.
- Roots are then rehydrated for 5 min each in 40 %, 20 % and 10 % ethanol.
- And infiltrated for 15 min in 5 % ethanol, 25 % glycerol.
- Roots are mounted in 50 % glycerol on glass microscope slides.

94
Time Lapse experiment QC differentiation in p35S::ZM14 lines
Crossing plants
To cross a trait from one plant (male donor plant) into another plant (female motherplant)
containing another trait, the following method is used:
- Use a tweezer to strip the flower of the female motherplant down to only the pistil by
removing the petals, sepals and stamina (flowertargets need to be closed, green and
thick)
- Use a tweezer to pinch off the flower from the male donorplant at its base in a whole
- Use pollen from the male donorplant to fertilize the stripped stamen of the female
motherplant
- Indicate the crossings by wrapping a thin wire around the the flowers that were
crossed and indicate the corresponding name of the mother – and donorplant.
- When the siliques have produced seeds and are dry, harvest them in 1.5 ml eppendorfs
Nomenclature of crossings: (female motherplant x male donorplant)
Male / female Col-0 p35S::ZM14 7-4 QC184 QC25 DR5::GUS J0121
Col-0 - - 5x 5x 5x 5x
p35S::ZM14 7-4 - - 5x 5x 5x 5x
QC184 5x 5x - - - -
QC25 5x 5x - - - -
DR5::GUS 5x 5x - - - -
J0121 - 5x - - - -

95
1.3. Protocols Maize Project
Maize seed sowing
Maize seeds from the B73 inbred lines were used in all experiments.
Maize seed sterilization:
- Sterilize 5 minutes in 100 ml 6% NaOCl (mixing on magnetmixer)
- Wash 3 times 5 minutes in sterile distilled water
Maize seed sowing:
- Take two sheets from a paper roll without separating them
- Take two such double sheets and put them on top of each other to form a double layer
- Fold them in the middle
- Use a tweezer to put the maize kernels from the sterile distilled water onto the paper,
with the scutellar node facing downwards, such that the root will grow downwards,
without having to grow upwards before it can grow downwards.
- Make a paper roll with the maize seeds kept in position
- Place the paper roll in glass bottles containing a solution (e.g. water, NPA, …)
Maize growth chamber conditions
- Continuous light
- 27°C
- 70% humidity
Microtome sections of maize roots
Growth conditions for maize:
1) 144 h (6 days) 50 µM NPA
2) 144 h (6 days) 50 µM NPA followed by 96 h (4 days) 50 µM NAA
NAA Stock Solution (50 mM): 0.01862 g NAA in 2 ml DMSO
NPA Stock Solution (25 mM): 0.01456 g NPA in 2 ml DMSO
96
Time course for growth:
Friday 18 h:
1) 7 seeds in 100 ml 50 µM NPA
2) 7 seeds in 100 ml 50 µM NPA
Thursday 18 h:
1) Sample the whole primary root of the seedlings (6 days 50 µM NPA) in FAA at 4°C
2) Measure the length of the primary root of the seedlings (6 days 50 µM NPA followed
by 4 days 50 µM NAA) and transfer to 100 ml 50 µM NAA solution
Monday 18 h:
4) Sample the whole primary root of the seedlings (6 days 50 µM NPA followed by 4
days 50 µM NAA). Cut off and discard the newly grown piece of primary root that has
only been in contact with NAA and not NPA. Collect in FAA at 4°C.
Protocol for making fixative FAA:
1) 4% p-formaldehyde (1.6 g) + 1% glutaraldehyde (0.4 g) + 40 ml P-buffer
2) Mix on magnetmixer heated at 90°C
3) When completely dissolved, store at 4°C
Feulgen staining protocol for maize roots
Cut off root tip sections (0 – 0.5 cm) from the seedlings grown 64 h in H2O and from the
seedlings grown 64 h in 50 µM NPA. Collect the root tip sections in two separate glass
bottles.
Cut off root sections (0 – 0.5 cm, 0.5 – 1.0 cm, 1.0 – 1.5 cm and 1.5 – 2.0 cm) from the
seedlings grown 6 days in 50 µM NPA and from the seedlings grown 6 days in 50 µM NPA
followed by 4 days in 50 µM NAA. Collect the root sections in two separate glass bottles.
Treat all collected root sections as followed:
Feulgen staining step:
- Rinse 3 times 15 minutes in 2 ml distilled water
- Incubate 10 minutes in 2 ml 1N HCl at 60°C (oven)
- Rinse 3 times 5 minutes in 2 ml distilled water
- Incubate 15 minutes in 2 ml Schiff’s Reagent (= Feulgen staining)
- Rinse 3 times 10 minutes in 2 ml of a solution that contains 5 ml 1 N HCl, 5 ml 10%
K2S2O5 and 100 ml MilliQ water
- Rinse 1 hour in 2 ml distilled water

97
Dehydration step (get rid of water, so resin can replace it in the next step):
- Incubate 2 times 10 minutes in 10% ethanol
- Incubate 2 times 10 minutes in 20% ethanol
- Incubate 2 times 10 minutes in 30% ethanol
- Incubate 2 times 10 minutes in 40% ethanol
- Incubate 2 times 10 minutes in 50% ethanol
- Incubate 2 times 10 minutes in 70% ethanol
- Incubate 2 times 15 minutes in 80% ethanol
- Incubate 2 times 15 minutes in 90% ethanol
- Incubate 2 times 30 minutes in 100% ethanol (2nd
time can be overnight at 4°C)
Pre-infiltration step with resin (Technovit 7100 + Hardener I):
- Incubate 2 hours in 30% Technovit 7100 + Hardener I
- Incubate 2 hours in 50% Technovit 7100 + Hardener I
- Incubate 2 hours in 70% Technovit 7100 + Hardener I
- Incubate overnight in 100% Technovit 7100 + Hardener I
Resin embedding and mounting
- Put the root sections in a home-fabricated mold (developed by Dr. Boris Parizot, see
next section for visually following the steps)
- Pour the polymerization mix over it, cover with a thin transparent sleeve and let it
polymerize overnight:
o The polymerization mix contains 14 parts Technovit 7100 + Hardener I and 1
part Hardener II
- Put embedded root section cubes in a larger mold
- Add 1 ml of the polymerization mix, cover with a thin transparent sleeve and let it
polymerize overnight
- The embedded root section cubes are mounted on plastic holders by using the
Technovit 3040 system:
o Quickly mix 2 parts powder (4 ml) with 1 part liquid (2 ml) using the back of a
glass pipet and pour this yellow cement solution over the plastic holders that
are put over the embedded root sections in the mold
o Let the yellow cement harden
o Use a pair of tongs to remove the mounted samples
o The samples are ready for microtomy

98
Resin Embedding system for maize roots developed by Dr. Boris Parizot
Fabrication of the molds:
Rectangular holes of 5 x 6 mm were cut in tip box. The border of the holes is smoothed to be
less cutting. A strip of parafilm® is fixed on the box by the help of some tips. Then, a stamp is
made in gum which has the same size than the alls and that have the thickness corresponding
to the diameter of the sample which will be embedded. Holes are made in the parafilm® by
applying the gum stamp in the preformed holes.
Preparation of the samples and embedding
The prepared samples were cut to be max 6 mm long which correspond to the length of the
holes. The samples are disposed in the holes filled with Technovit 7100 resin + hardener 1 &
2 and then covered by a thin transparent sleeve (8 x 10mm).
Unmolding the samples
The entire parafilm® molds are then taken out of the tip box and the resin blocks unmolded.
Second embedding
Then, the following procedure is nearly identical as the one described in Beeckman and Viane
(1999). The small blocks can be cut with a scalpel blade on the borders (to orientate then
correctly and to get the sample in a good perpendicular or longitudinal axe in the mold) or in
the sample itself to bring the interesting part near the surface of the block.
99
Microtome sections
Using the microtome Reichert – Jung 2050 Supercut, 5 µm thick coupes are made and put on
a drop of water Superfrost coated slides (Mendel glazer) after which the coupes are left to dry
on a warming plate.
Staining the microtome sections
Staining in 0.1% Methylene Blue and 0.05% Ruthenium Red:
- Make a stock solution of 0.1% Methylene Blue (250 ml)
o 0.25 g Methylene Blue in 250 ml H2O
- Make a stock solution of 0.05% Ruthenium Red
o 0.125 g Ruthenium Red in 250 ml H2O
- Pour both stock solutions in separate glass holders and also fill two separate glass
holders with water for rinsing
- Place microtome coupes in glass holdingsystem
- Incubate 10 minutes in 0.05% Ruthenium Red
- Rinse 30 seconds in water
- Incubate 10 minutes in 0.1% Methylene Blue
- Rinse 30 seconds in water
Staining in 0.1% Aniline Blue:
- Make a stock solution of 0.1% Aniline Blue (250 ml)
o 0.25 g Aniline Blue in 250 ml H2O
- Pour this stock solution in a glass holder and also fill another glass holder with water
- Place microtome coupes in glass holdingsystem
- Incubate 2 minutes in 0.1% Aniline Blue
- Rinse 30 seconds in water
After the rinse step, let the microtome coupes dry at room temperature overnight.
Apply DePex over the microtome sections and apply a cover glass (in fume hood) and
incubate overnight.
The slides are now ready for Microscopical analysis.
100
Q-PCR cell cycle analysis experiment
Growth conditions:
1) 64 h H2O
2) 64 h 50 µM NPA
3) 64 h 50 µM NPA followed by 2 h 50 µM NAA
4) 64 h 50 µM NPA followed by 3 h 50 µM NAA
5) 64 h 50 µM NPA followed by 4 h 50 µM NAA
Time Course growth:
Tuesday 18 h:
1) 8 seeds in 100 ml H2O
2) 8 seeds in 100 ml 50 µM NPA
3) 8 seeds in 100 ml 50 µM NPA
4) 8 seeds in 100 ml 50 µM NPA
5) 8 seeds in 100 ml 50 µM NPA
Friday 10 h:
1) Sample the root tip (0 – 0.5 cm), the cortex (0.5 – 1.0 cm) and the stele (0.5 – 1.0 cm)
from the seedlings grown 64 h on H2O in DEPC - water in RNase-free 2 ml
eppendorfs and quick-freeze in liquid nitrogen. Store at -80°C.
2) Sample the root tip (0 – 0.5 cm), the cortex (0.5 – 1.0 cm) and the stele (0.5 – 1.0 cm)
from the seedlings grown 64 h on 50 µM NPA in DEPC - water in RNase-free 2 ml
eppendorfs and quick-freeze in liquid nitrogen. Store at -80°C.
3) Transfer seeds from 50 µM NPA to 100 ml 50 µM NAA
4) Transfer seeds from 50 µM NPA to 100 ml 50 µM NAA
5) Transfer seeds from 50 µM NPA to 100 ml 50 µM NAA
Friday 12 h:
3) Sample the root tip (0 – 0.5 cm), the cortex (0.5 – 1.0 cm) and the stele (0.5 – 1.0 cm)
from the seedlings grown 64 h on NPA followed by 2 h 50 µM NAA in DEPC-treated
water in RNase-free 2 ml eppendorfs and quick-freeze in liquid nitrogen. Store at -
80°C.
Friday 13 h:
4) Sample the root tip (0 – 0.5 cm), the cortex (0.5 – 1.0 cm) and the stele (0.5 – 1.0 cm)
from the seedlings grown 64 h on NPA followed by 2 h 50 µM NAA in DEPC-treated
water in RNase-free 2 ml eppendorfs and quick-freeze in liquid nitrogen. Store at -
80°C.
Friday 14 h:
5) Sample the root tip (0 – 0.5 cm), the cortex (0.5 – 1.0 cm) and the stele (0.5 – 1.0 cm)
from the seedlings grown 64 h on NPA followed by 2 h 50 µM NAA in DEPC-treated
water in RNase-free 2 ml eppendorfs and quick-freeze in liquid nitrogen. Store at -
80°C.

101
RNA extraction on maize roots using the RNeasy Mini Kit from Qiagen
- Grind root material by adding an RNase-free 4 mm grinding ball to the 2 ml
eppendorfs and grind in the Retscher-machine for 30 seconds at 30 Hz. Do not allow
frozen tissues to thaw during grinding or further handling prior to disruption in Buffer
RLT.
- Before the RNA extraction protocol:
o Add β-mercaptoethanol to Buffer RLT (10 µl per 1 ml Buffer RLT)
o Add 4 volumes of ethanol (96-100%) to Buffer RPE
- Add 450 µl Buffer RLT to the sample and vortex vigorously
- Transfer the lysate to a QIAshredder spin colum (lilac) placed in a 2 ml collection
tube, and centrifuge for 2 min at full speed at 25°C. Carefully transfer the supernatant
of the flow-through to a new microcentrifuge tube (not supplied) without disturbing
the cell-debris pellet in the collection tube. Use only this supernatant in subsequent
steps.
- Add 0.5 volume of ethanol (96-100%) to the cleared lysate, and mix immediately by
pipetting. Do not centrifuge. Proceed immediately to the next step.
- Transfer the sample (usually 650 µl), including any precipitate that may have formed,
to an RNeasy spin column (pink) placed in a 2 ml collection tube (supplied). Close the
lid gently, and centrifuge for 15 seconds at 8000 g at 25°C. Discard the flow-through.
- Add 700 µl Buffer RW1 to the RNeasy spin column. Close the lid gently, and
centrifuge for 15 seconds at 8000 g at 25°C to wash the spin column membrane.
Discard the flow-through.
- Add 500 µl Buffer RPE to the RNeasy spin column. Close the lid gently, and
centrifuge for 15 seconds at 8000 g at 25°C to wash the spin column membrane.
Discard the flow-through.
- Add 500 µl Buffer RPE to the RNeasy spin column. Close the lid gently, and
centrifuge for 2 minutes at 8000 g at 25°C to wash the spin column membrane. After
centrifugatipon, carefully remove the RNeasy spin column from the collection tube so
that the column does not contact the flow-through.
- Optional: Place the RNeasy spin column in a new 2 ml collection tube (supplied), and
discard the old collection tube with the flow-through. Close the lid gently, and
centrifuge at full speed for 1 min.
- Place the RNeasy spin column in a new 1.5 ml collection tube (supplied). Add 40 µl
RNase-free water directly to the spin column membrane. Close the lid gently, and
centrifuge for 1 minute at 8000 g at 25°C to elute the RNA.
Measure the RNA concentration and quality on the NanoDrop spectrophotometer.

102
cDNA synthesis using SuperScript III First-strand synthesis system for RT-PCR kit
from Invitrogen
RNA targets from 100 bp to >12kb can be detected with this system.
Protocol
Denaturation step RNA (x µl) + 50 µM oligo(dT)20 Primer (1 µl) + 10 mM dNTP mix
(1 µl) + DEPC-treated water (up to 10 µl) at 65°C for 5 min
Place on ice for at least 1 min
Annealing step Add 10 µl cDNA Synthesis Mix to each RNA / primer mixture, mix
gently, and collect by brief centrifugation
cDNA synthesis 50°C for 50 minutes
Terminate Reaction 85°C for 5 minutes and chill on ice. Collect reactions by brief
centrifugation.
Remove RNA Add 1 µl of RNase H and incubate for 20 minutes at 37°C
Final step Add 500 µl MilliQ water
cDNA Synthesis Mix 1 reaction
10 x RT buffer 2 µl
25 mM MgCl2 4 µl
0.1 M DTT 2 µl
RNaseOUTTM
(40 U / µl) 1 µl
SuperScriptTM
III RT (200 U / µl) 1 µl
Total 10 µl
General remark: label samples on top and on the side of the eppendorf and mention the date of
cDNA synthesis.
- After NanoDropTM measurement, the concentration of RNA (ng / µL) was determined and from this we can calculate the volume of the RNA sample we have to use, to get a final concentration of RNA of 1 µg in 4 µl (diluted in MQ H2O).
- Next, 0.5 µl oligo (dT)20 (50 µM) and 0.5 µl dNTP mix (10 mM) are added. - This is put at 65 °C for 5 min (Denaturation) and then 5 min on ice. - Then 5 µl of MasterMix (At room temperature for annealing) is added containing:
o 1 µl 10x RT buffer [200 mM Tris – HCl (pH 8.4), 500 mM KCl]
o 2 µl 25mM MgCl2 o 1 µl 0.1 M DTT o 0.5 µl RNaseOUTTM (40 U / µl) o 0.5 µl SuperscriptTM III RT (200 U / µl)
- This is incubated for 50 min at 50 °C (Temperature optimum for SuperScriptTM III cDNA synthesis).
- Then for 5 min at 85 °C (Termination of the cDNA synthesis reaction). - If RNA removal is desired: Add 1 µl RNase H and incubate for 20 min at 37 °C.
- Finally 500 µl DEPC H2O is added to get the cDNA sample. - This is stored at - 20 °C.

103
Q-PCR using Janus Robot and LightCycler®480 system
The Janus Robot (JANUS Mini Format, Perkin Elmer) was used for Q-PCR set-up in a 384-
well plate.
Set up (final volume 5 µl) per well:
- 2 µl 10% cDNA template
- 0.5 µl primers (both forward and reverse primer 5 µM)
- 2.5 µl LightCycler®480 SYBR Green I Master 2x Mix (Roche Applied Science)
(contains HotStarTaq DNA Polymerase, QuantiTect SYBR Green PCR Buffer, dNTP
Mix, SYBR Green I and ROX passive reference dye)
Number of replicates = 3
Before mounting the 384 – microtiterplate on the LightCycler 480, the 384-well plate has to
be covered with a transparent plastic and centrifuged for 3 min at 3000 x g to make sure all
components for the PCR – reaction are at the bottom of the well.
The LightCycler®480 Instrument (Roche Applied Science) was used for the Q-PCR reaction.
Q – PCR program:
Pre-incubation 95 °C 10 min
95 °C 10 s
Amplification (45 cycles) 60 °C 15 s
72 °C 15 s
Melting curve 65 °C - 97 °C 2.5 °C/s
Cool Down 97 °C - 40 °C /

104
Flow Cytometry analysis on maize root sections
LRIS experiment
Growth conditions:
1) 64 h H2O + DMSO
2) 64 h 50 µM NPA
3) 64 h 50 µM NPA followed by 2 hours 50 µM NAA
4) 64 h 50 µM NPA followed by 3 hours 50 µM NAA
5) 64 h 50 µM NPA followed by 4 hours 50 µM NAA
6) 64 h 50 µM NPA followed by 7 hours 50 µM NAA
Time course:
Friday 18 h:
1) Sow 8 seeds in 100 ml H2O + 200 µl DMSO
2) Sow 8 seeds in 100 ml 50 µM NPA
3) Sow 8 seeds in 100 ml 50 µM NPA
4) Sow 8 seeds in 100 ml 50 µM NPA
5) Sow 8 seeds in 100 ml 50 µM NPA
6) Sow 8 seeds in 100 ml 50 µM NPA
Monday 10 h:
1) Sample the root tip (0 – 0.5 cm), the cortex (0.5 – 1.0 cm) and the stele (0.5 – 1.0 cm)
from the seedlings grown 64 h on H2O + 200 µl DMSO in 2 ml eppendorfs and quick-
freeze in liquid nitrogen. Store at -80°C.
2) Sample the root tip (0 – 0.5 cm), the cortex (0.5 – 1.0 cm) and the stele (0.5 – 1.0 cm)
from the seedlings grown 64 h in 50 µM NPA in 2 ml eppendorfs and quick-freeze in
liquid nitrogen. Store at -80°C.
3) Transfer the seeds to 100 ml 50 µM NAA
4) Transfer the seeds to 100 ml 50 µM NAA
5) Transfer the seeds to 100 ml 50 µM NAA
6) Transfer the seeds to 100 ml 50 µM NAA
Monday 12 h:
3) Sample the root tip (0 – 0.5 cm), the cortex (0.5 – 1.0 cm) and the stele (0.5 – 1.0 cm)
from the seedlings grown 64 h in 50 µM NPA followed by 2 hours 50 µM NAA in 2
ml eppendorfs and quick-freeze in liquid nitrogen. Store at -80°C.
Monday 13 h:
4) Sample the root tip (0 – 0.5 cm), the cortex (0.5 – 1.0 cm) and the stele (0.5 – 1.0 cm)
from the seedlings grown 64 h in 50 µM NPA followed by 3 hours 50 µM NAA in 2
ml eppendorfs and quick-freeze in liquid nitrogen. Store at -80°C.
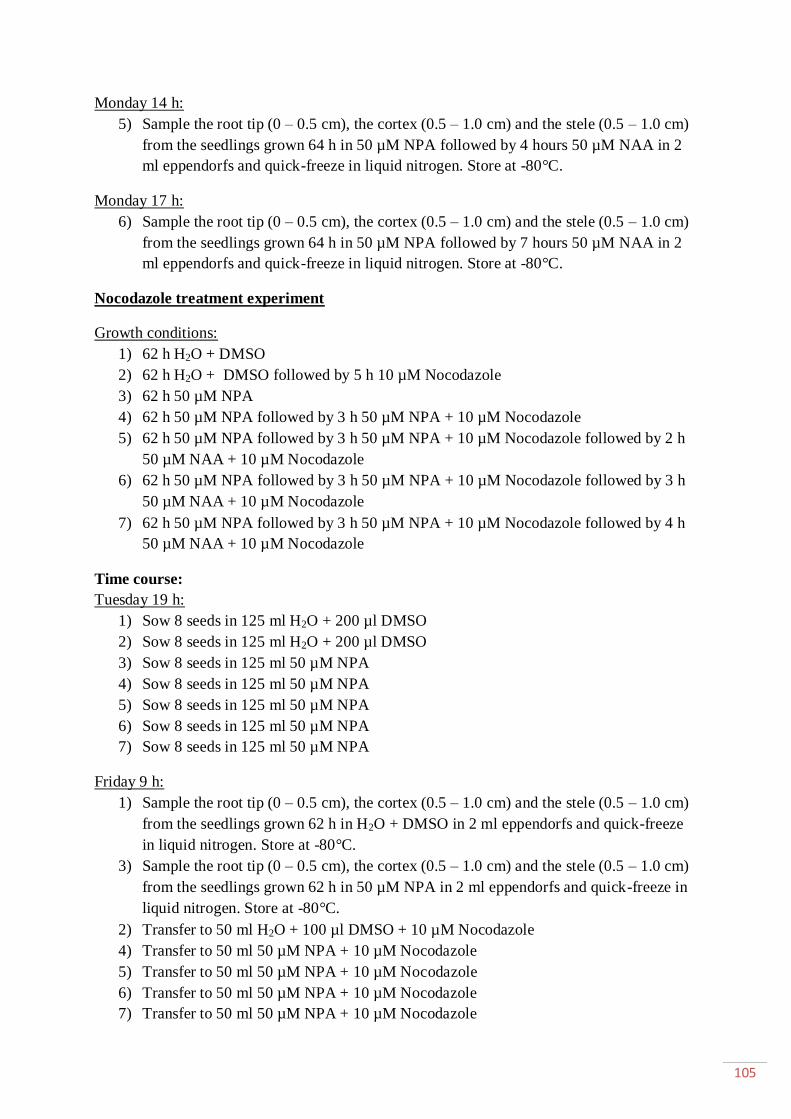
105
Monday 14 h:
5) Sample the root tip (0 – 0.5 cm), the cortex (0.5 – 1.0 cm) and the stele (0.5 – 1.0 cm)
from the seedlings grown 64 h in 50 µM NPA followed by 4 hours 50 µM NAA in 2
ml eppendorfs and quick-freeze in liquid nitrogen. Store at -80°C.
Monday 17 h:
6) Sample the root tip (0 – 0.5 cm), the cortex (0.5 – 1.0 cm) and the stele (0.5 – 1.0 cm)
from the seedlings grown 64 h in 50 µM NPA followed by 7 hours 50 µM NAA in 2
ml eppendorfs and quick-freeze in liquid nitrogen. Store at -80°C.
Nocodazole treatment experiment
Growth conditions:
1) 62 h H2O + DMSO
2) 62 h H2O + DMSO followed by 5 h 10 µM Nocodazole
3) 62 h 50 µM NPA
4) 62 h 50 µM NPA followed by 3 h 50 µM NPA + 10 µM Nocodazole
5) 62 h 50 µM NPA followed by 3 h 50 µM NPA + 10 µM Nocodazole followed by 2 h
50 µM NAA + 10 µM Nocodazole
6) 62 h 50 µM NPA followed by 3 h 50 µM NPA + 10 µM Nocodazole followed by 3 h
50 µM NAA + 10 µM Nocodazole
7) 62 h 50 µM NPA followed by 3 h 50 µM NPA + 10 µM Nocodazole followed by 4 h
50 µM NAA + 10 µM Nocodazole
Time course:
Tuesday 19 h:
1) Sow 8 seeds in 125 ml H2O + 200 µl DMSO
2) Sow 8 seeds in 125 ml H2O + 200 µl DMSO
3) Sow 8 seeds in 125 ml 50 µM NPA
4) Sow 8 seeds in 125 ml 50 µM NPA
5) Sow 8 seeds in 125 ml 50 µM NPA
6) Sow 8 seeds in 125 ml 50 µM NPA
7) Sow 8 seeds in 125 ml 50 µM NPA
Friday 9 h:
1) Sample the root tip (0 – 0.5 cm), the cortex (0.5 – 1.0 cm) and the stele (0.5 – 1.0 cm)
from the seedlings grown 62 h in H2O + DMSO in 2 ml eppendorfs and quick-freeze
in liquid nitrogen. Store at -80°C.
3) Sample the root tip (0 – 0.5 cm), the cortex (0.5 – 1.0 cm) and the stele (0.5 – 1.0 cm)
from the seedlings grown 62 h in 50 µM NPA in 2 ml eppendorfs and quick-freeze in
liquid nitrogen. Store at -80°C.
2) Transfer to 50 ml H2O + 100 µl DMSO + 10 µM Nocodazole
4) Transfer to 50 ml 50 µM NPA + 10 µM Nocodazole
5) Transfer to 50 ml 50 µM NPA + 10 µM Nocodazole
6) Transfer to 50 ml 50 µM NPA + 10 µM Nocodazole
7) Transfer to 50 ml 50 µM NPA + 10 µM Nocodazole
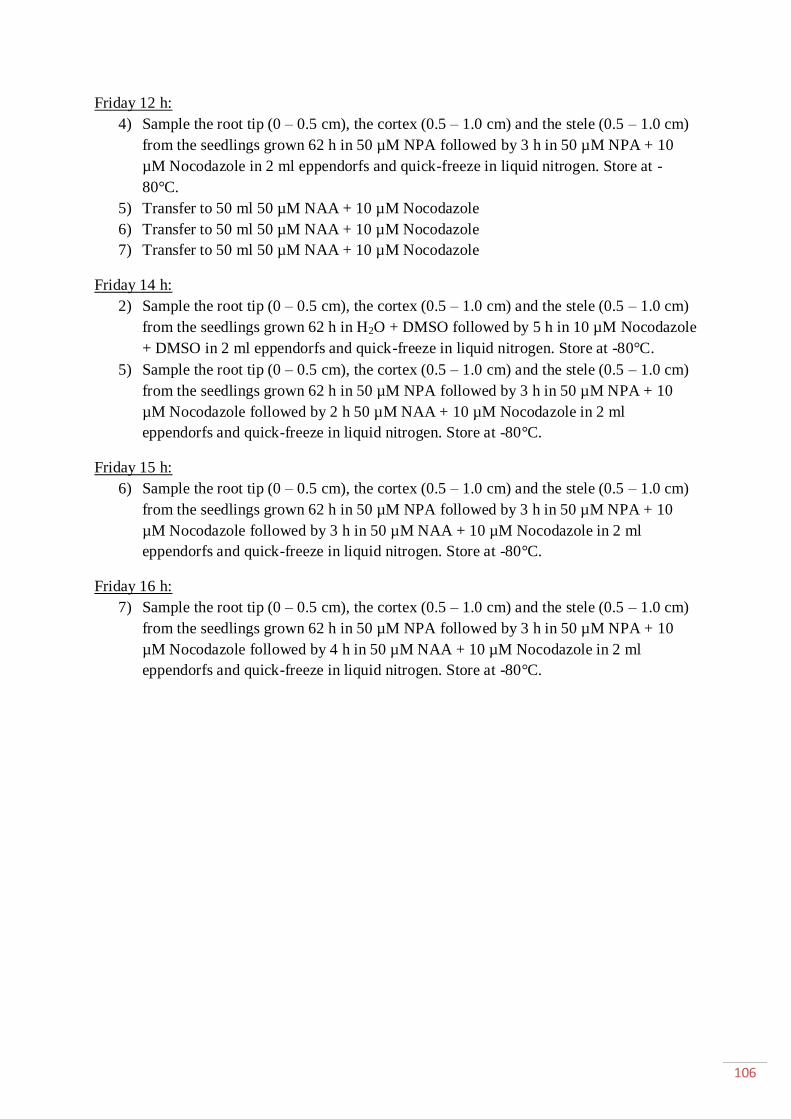
106
Friday 12 h:
4) Sample the root tip (0 – 0.5 cm), the cortex (0.5 – 1.0 cm) and the stele (0.5 – 1.0 cm)
from the seedlings grown 62 h in 50 µM NPA followed by 3 h in 50 µM NPA + 10
µM Nocodazole in 2 ml eppendorfs and quick-freeze in liquid nitrogen. Store at -
80°C.
5) Transfer to 50 ml 50 µM NAA + 10 µM Nocodazole
6) Transfer to 50 ml 50 µM NAA + 10 µM Nocodazole
7) Transfer to 50 ml 50 µM NAA + 10 µM Nocodazole
Friday 14 h:
2) Sample the root tip (0 – 0.5 cm), the cortex (0.5 – 1.0 cm) and the stele (0.5 – 1.0 cm)
from the seedlings grown 62 h in H2O + DMSO followed by 5 h in 10 µM Nocodazole
+ DMSO in 2 ml eppendorfs and quick-freeze in liquid nitrogen. Store at -80°C.
5) Sample the root tip (0 – 0.5 cm), the cortex (0.5 – 1.0 cm) and the stele (0.5 – 1.0 cm)
from the seedlings grown 62 h in 50 µM NPA followed by 3 h in 50 µM NPA + 10
µM Nocodazole followed by 2 h 50 µM NAA + 10 µM Nocodazole in 2 ml
eppendorfs and quick-freeze in liquid nitrogen. Store at -80°C.
Friday 15 h:
6) Sample the root tip (0 – 0.5 cm), the cortex (0.5 – 1.0 cm) and the stele (0.5 – 1.0 cm)
from the seedlings grown 62 h in 50 µM NPA followed by 3 h in 50 µM NPA + 10
µM Nocodazole followed by 3 h in 50 µM NAA + 10 µM Nocodazole in 2 ml
eppendorfs and quick-freeze in liquid nitrogen. Store at -80°C.
Friday 16 h:
7) Sample the root tip (0 – 0.5 cm), the cortex (0.5 – 1.0 cm) and the stele (0.5 – 1.0 cm)
from the seedlings grown 62 h in 50 µM NPA followed by 3 h in 50 µM NPA + 10
µM Nocodazole followed by 4 h in 50 µM NAA + 10 µM Nocodazole in 2 ml
eppendorfs and quick-freeze in liquid nitrogen. Store at -80°C.

107
Hydroxyurea treatment experiment
Growth conditions:
1) 62 h H2O + DMSO
2) 62 h H2O + DMSO followed by 6 h 3 mM HU + DMSO
3) 64 h 50 µM NPA
4) 64 h 50 µM NPA followed by 2 h 50 µM NAA
5) 64 h 50 µM NPA followed by 3 h 50 µM NAA
6) 64 h 50 µM NPA followed by 4 h 50 µM NAA
7) 64 h 50 µM NPA followed by 7 h 50 µM NAA
8) 62 h 50 µM NPA
9) 62 h 50 µM NPA followed by 3 h 50 µM NPA + 3 mM HU
10) 62 h 50 µM NPA followed by 3 h 50 µM NPA + 3 mM HU followed by 2 h 50 µM
NAA + 3 mM HU
11) 62 h 50 µM NPA followed by 3 h 50 µM NPA + 3 mM HU followed by 3 h 50 µM
NAA + 3 mM HU
12) 62 h 50 µM NPA followed by 3 h 50 µM NPA + 3 mM HU followed by 4 h 50 µM
NAA + 3 mM HU
13) 62 h 50 µM NPA followed by 3 h 50 µM NPA + 3 mM HU followed by 6 h 50 µM
NAA + 3 mM HU
Time course:
Friday 19 h:
1) Sow 8 seeds in 125 ml H2O + 250 µl DMSO
2) Sow 8 seeds in 125 ml H2O + 250 µl DMSO
3) Sow 8 seeds in 125 ml 50 µM NPA
4) Sow 8 seeds in 125 ml 50 µM NPA
5) Sow 8 seeds in 125 ml 50 µM NPA
6) Sow 8 seeds in 125 ml 50 µM NPA
7) Sow 8 seeds in 125 ml 50 µM NPA
8) Sow 8 seeds in 125 ml 50 µM NPA
9) Sow 8 seeds in 125 ml 50 µM NPA
10) Sow 8 seeds in 125 ml 50 µM NPA
11) Sow 8 seeds in 125 ml 50 µM NPA
12) Sow 8 seeds in 125 ml 50 µM NPA
13) Sow 8 seeds in 125 ml 50 µM NPA

108
Monday 9 h:
1) Sample the root tip (0 – 0.5 cm), the cortex (0.5 – 1.0 cm) and the stele (0.5 – 1.0 cm)
from the seedlings grown 62 h in H2O + DMSO in 2 ml eppendorfs and quick-freeze
in liquid nitrogen. Store at -80°C.
8) Sample the root tip (0 – 0.5 cm), the cortex (0.5 – 1.0 cm) and the stele (0.5 – 1.0 cm)
from the seedlings grown 62 h in 50 µM NPA in 2 ml eppendorfs and quick-freeze in
liquid nitrogen. Store at -80°C.
2) Transfer to 50 ml 3 mM HU + 100 µl DMSO
9) Transfer to 50 ml 50 µM NPA + 3 mM HU
10) Transfer to 50 ml 50 µM NPA + 3 mM HU
11) Transfer to 50 ml 50 µM NPA + 3 mM HU
12) Transfer to 50 ml 50 µM NPA + 3 mM HU
Monday 11 h:
3) Sample the root tip (0 – 0.5 cm), the cortex (0.5 – 1.0 cm) and the stele (0.5 – 1.0 cm)
from the seedlings grown 64 h in 50 µM NPA in 2 ml eppendorfs and quick-freeze in
liquid nitrogen. Store at -80°C.
4) Transfer to 50 ml 50 µM NAA
5) Transfer to 50 ml 50 µM NAA
6) Transfer to 50 ml 50 µM NAA
7) Transfer to 50 ml 50 µM NAA
Monday 12 h:
9) Sample the root tip (0 – 0.5 cm), the cortex (0.5 – 1.0 cm) and the stele (0.5 – 1.0 cm)
from the seedlings grown 62 h in 50 µM NPA followed by 3 h in 50 µM NPA + 3 mM
HU in 2 ml eppendorfs and quick-freeze in liquid nitrogen. Store at -80°C.
10) Transfer to 50 ml 50 µM NAA + 3 mM HU
11) Transfer to 50 ml 50 µM NAA + 3 mM HU
12) Transfer to 50 ml 50 µM NAA + 3 mM HU
13) Transfer to 50 ml 50 µM NAA + 3 mM HU
Monday 13 h:
4) Sample the root tip (0 – 0.5 cm), the cortex (0.5 – 1.0 cm) and the stele (0.5 – 1.0 cm)
from the seedlings grown 64 h in 50 µM NPA followed by 2 h in 50 µM NAA in 2 ml
eppendorfs and quick-freeze in liquid nitrogen. Store at -80°C.
Monday 14 h:
5) Sample the root tip (0 – 0.5 cm), the cortex (0.5 – 1.0 cm) and the stele (0.5 – 1.0 cm)
from the seedlings grown 64 h in 50 µM NPA followed by 3 h in 50 µM NAA in 2 ml
eppendorfs and quick-freeze in liquid nitrogen. Store at -80°C.
10) Sample the root tip (0 – 0.5 cm), the cortex (0.5 – 1.0 cm) and the stele (0.5 – 1.0 cm)
from the seedlings grown 62 h in 50 µM NPA followed by 3 h in 50 µM NPA + 3
mM HU followed by 2 h 50 µM NAA + 3 mM HU in 2 ml eppendorfs and quick-
freeze in liquid nitrogen. Store at -80°C.
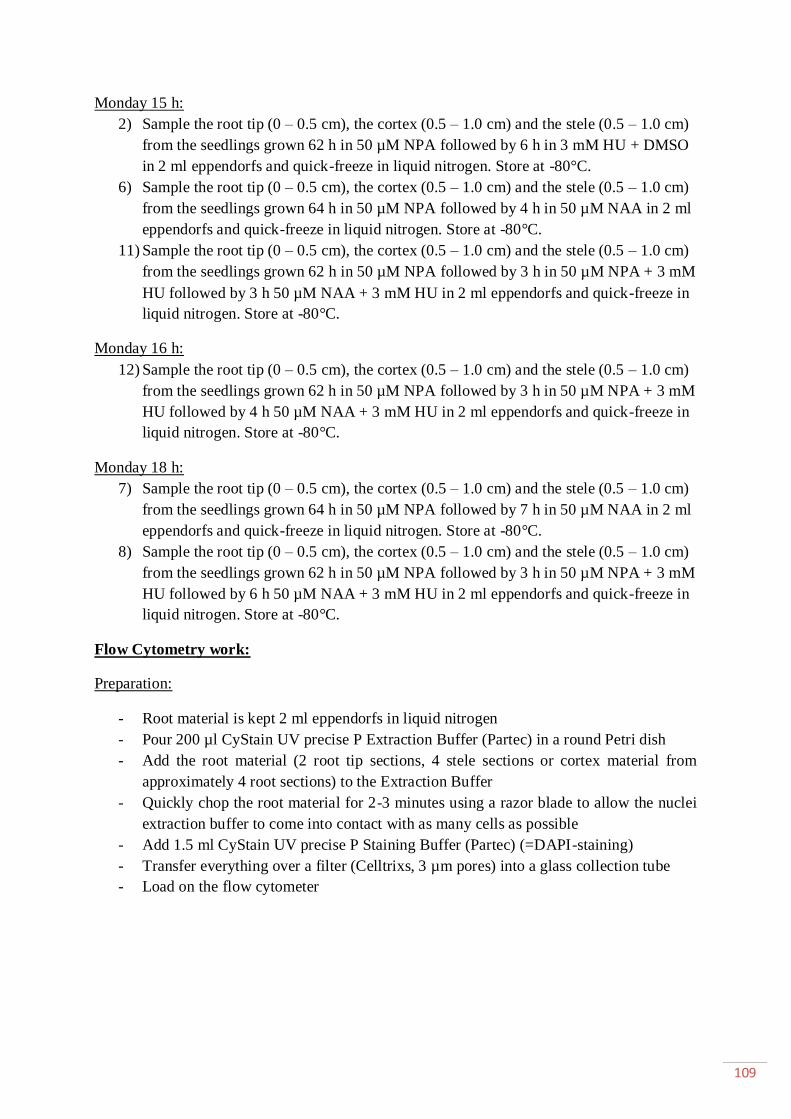
109
Monday 15 h:
2) Sample the root tip (0 – 0.5 cm), the cortex (0.5 – 1.0 cm) and the stele (0.5 – 1.0 cm)
from the seedlings grown 62 h in 50 µM NPA followed by 6 h in 3 mM HU + DMSO
in 2 ml eppendorfs and quick-freeze in liquid nitrogen. Store at -80°C.
6) Sample the root tip (0 – 0.5 cm), the cortex (0.5 – 1.0 cm) and the stele (0.5 – 1.0 cm)
from the seedlings grown 64 h in 50 µM NPA followed by 4 h in 50 µM NAA in 2 ml
eppendorfs and quick-freeze in liquid nitrogen. Store at -80°C.
11) Sample the root tip (0 – 0.5 cm), the cortex (0.5 – 1.0 cm) and the stele (0.5 – 1.0 cm)
from the seedlings grown 62 h in 50 µM NPA followed by 3 h in 50 µM NPA + 3 mM
HU followed by 3 h 50 µM NAA + 3 mM HU in 2 ml eppendorfs and quick-freeze in
liquid nitrogen. Store at -80°C.
Monday 16 h:
12) Sample the root tip (0 – 0.5 cm), the cortex (0.5 – 1.0 cm) and the stele (0.5 – 1.0 cm)
from the seedlings grown 62 h in 50 µM NPA followed by 3 h in 50 µM NPA + 3 mM
HU followed by 4 h 50 µM NAA + 3 mM HU in 2 ml eppendorfs and quick-freeze in
liquid nitrogen. Store at -80°C.
Monday 18 h:
7) Sample the root tip (0 – 0.5 cm), the cortex (0.5 – 1.0 cm) and the stele (0.5 – 1.0 cm)
from the seedlings grown 64 h in 50 µM NPA followed by 7 h in 50 µM NAA in 2 ml
eppendorfs and quick-freeze in liquid nitrogen. Store at -80°C.
8) Sample the root tip (0 – 0.5 cm), the cortex (0.5 – 1.0 cm) and the stele (0.5 – 1.0 cm)
from the seedlings grown 62 h in 50 µM NPA followed by 3 h in 50 µM NPA + 3 mM
HU followed by 6 h 50 µM NAA + 3 mM HU in 2 ml eppendorfs and quick-freeze in
liquid nitrogen. Store at -80°C.
Flow Cytometry work:
Preparation:
- Root material is kept 2 ml eppendorfs in liquid nitrogen
- Pour 200 µl CyStain UV precise P Extraction Buffer (Partec) in a round Petri dish
- Add the root material (2 root tip sections, 4 stele sections or cortex material from
approximately 4 root sections) to the Extraction Buffer
- Quickly chop the root material for 2-3 minutes using a razor blade to allow the nuclei
extraction buffer to come into contact with as many cells as possible
- Add 1.5 ml CyStain UV precise P Staining Buffer (Partec) (=DAPI-staining)
- Transfer everything over a filter (Celltrixs, 3 µm pores) into a glass collection tube
- Load on the flow cytometer

110
Flow cytometer (CyFlow ML, Partec) handling:
- Start up the flow cytometer
- Open the software program Partec FloMax
- Before using the flow cytometer, load 1 ml of green Partec Cleaning Solution for Flow
Systems, followed by 1 ml of nanopure water to clean the cytometer
- In the Partec FloMax program, use the following instrument settings:
Gain Scale
300 (log3)
*DAPI 200 (log3)
- Select a R1 range window that excludes background signal
- Collect a total amount of 6000 nuclei for every sample
Flow cytometer results analysis
The results from flow cytometer experiments were analyzed using CPX.
Maize DR5 ::RFP and pPIN1 ::PIN1-YFP
We have B73 maize inbred lines that are transformed with the constructs:
- DR5::RFP
- pPIN1::PIN1-YFP
DNA extraction of maize plants DR5::RFP and pPIN1::PIN1-YFP using Miniprep (for
high throughput PCR)
- Harvest maize root section in a 1 ml 96 well tube cooled in liquid nitrogen (each tube
contains one 4 mm grinding ball) in a blue rack
- Keep in liquid nitrogen while sampling
- Grind for 30 seconds at 30 Hz using the Retch-machine (do not forget to take off the
transparent lid before grinding)
- Add 400 µl extraction buffer (using a multichannel pipet) and mix well
- Extract for 30 minutes at 60°C in an oven
- Centrifuge for 15 minutes at 4000 rpm at room temperature in the SH3000 rotor
- Transfer 300 µl supernatant to new (1 ml 96 well) tubes using a multichannel pipet
- Add 300 µl isopropanol using a multichannel pipet, mix by inverting
- Centrifuge for 15 minutes at 4000 rpm at room temperature in the SH3000 rotor
- Pour off the supernatant (Organic solvents, non-halogenized)
- Add 100 µl 70% ethanol to the samples using a multichannel pipet
- Centrifuge for 15 minutes at 4000 rpm at room temperature in the SH3000 rotor
- Pour of the supernatant, leave the pellets as dry as possible
- Dry the pellets at room temperature or at 50°C in an oven (do not close the caps, but
leave the lid on the rack)
- Dissolve the pellet in 200 µl MilliQ water using a multichannel pipet
- Use 5 µl per PCR reaction
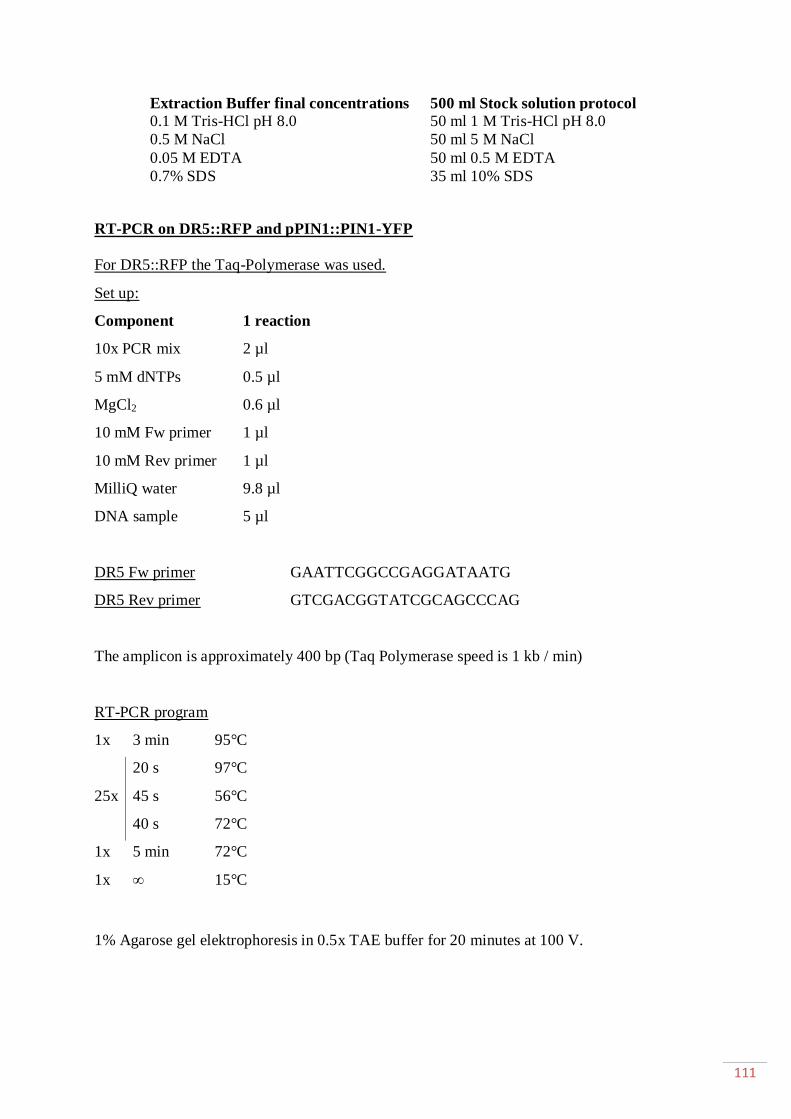
111
Extraction Buffer final concentrations 500 ml Stock solution protocol
0.1 M Tris-HCl pH 8.0 50 ml 1 M Tris-HCl pH 8.0
0.5 M NaCl 50 ml 5 M NaCl
0.05 M EDTA 50 ml 0.5 M EDTA
0.7% SDS 35 ml 10% SDS
RT-PCR on DR5::RFP and pPIN1::PIN1-YFP
For DR5::RFP the Taq-Polymerase was used.
Set up:
Component 1 reaction
10x PCR mix 2 µl
5 mM dNTPs 0.5 µl
MgCl2 0.6 µl
10 mM Fw primer 1 µl
10 mM Rev primer 1 µl
MilliQ water 9.8 µl
DNA sample 5 µl
DR5 Fw primer GAATTCGGCCGAGGATAATG
DR5 Rev primer GTCGACGGTATCGCAGCCCAG
The amplicon is approximately 400 bp (Taq Polymerase speed is 1 kb / min)
RT-PCR program
1x 3 min 95°C
20 s 97°C
25x 45 s 56°C
40 s 72°C
1x 5 min 72°C
1x ∞ 15°C
1% Agarose gel elektrophoresis in 0.5x TAE buffer for 20 minutes at 100 V.
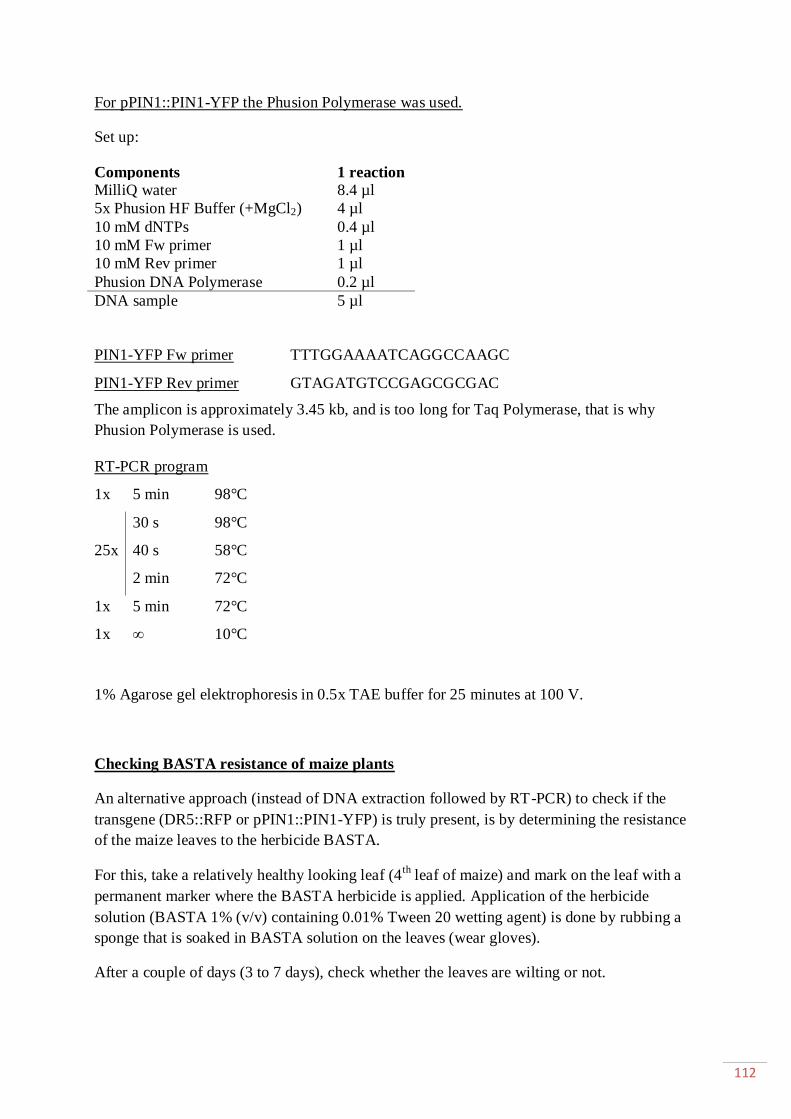
112
For pPIN1::PIN1-YFP the Phusion Polymerase was used.
Set up:
Components 1 reaction
MilliQ water 8.4 µl
5x Phusion HF Buffer (+MgCl2) 4 µl
10 mM dNTPs 0.4 µl
10 mM Fw primer 1 µl
10 mM Rev primer 1 µl
Phusion DNA Polymerase 0.2 µl
DNA sample 5 µl
PIN1-YFP Fw primer TTTGGAAAATCAGGCCAAGC
PIN1-YFP Rev primer GTAGATGTCCGAGCGCGAC
The amplicon is approximately 3.45 kb, and is too long for Taq Polymerase, that is why
Phusion Polymerase is used.
RT-PCR program
1x 5 min 98°C
30 s 98°C
25x 40 s 58°C
2 min 72°C
1x 5 min 72°C
1x ∞ 10°C
1% Agarose gel elektrophoresis in 0.5x TAE buffer for 25 minutes at 100 V.
Checking BASTA resistance of maize plants
An alternative approach (instead of DNA extraction followed by RT-PCR) to check if the
transgene (DR5::RFP or pPIN1::PIN1-YFP) is truly present, is by determining the resistance
of the maize leaves to the herbicide BASTA.
For this, take a relatively healthy looking leaf (4th
leaf of maize) and mark on the leaf with a
permanent marker where the BASTA herbicide is applied. Application of the herbicide
solution (BASTA 1% (v/v) containing 0.01% Tween 20 wetting agent) is done by rubbing a
sponge that is soaked in BASTA solution on the leaves (wear gloves).
After a couple of days (3 to 7 days), check whether the leaves are wilting or not.
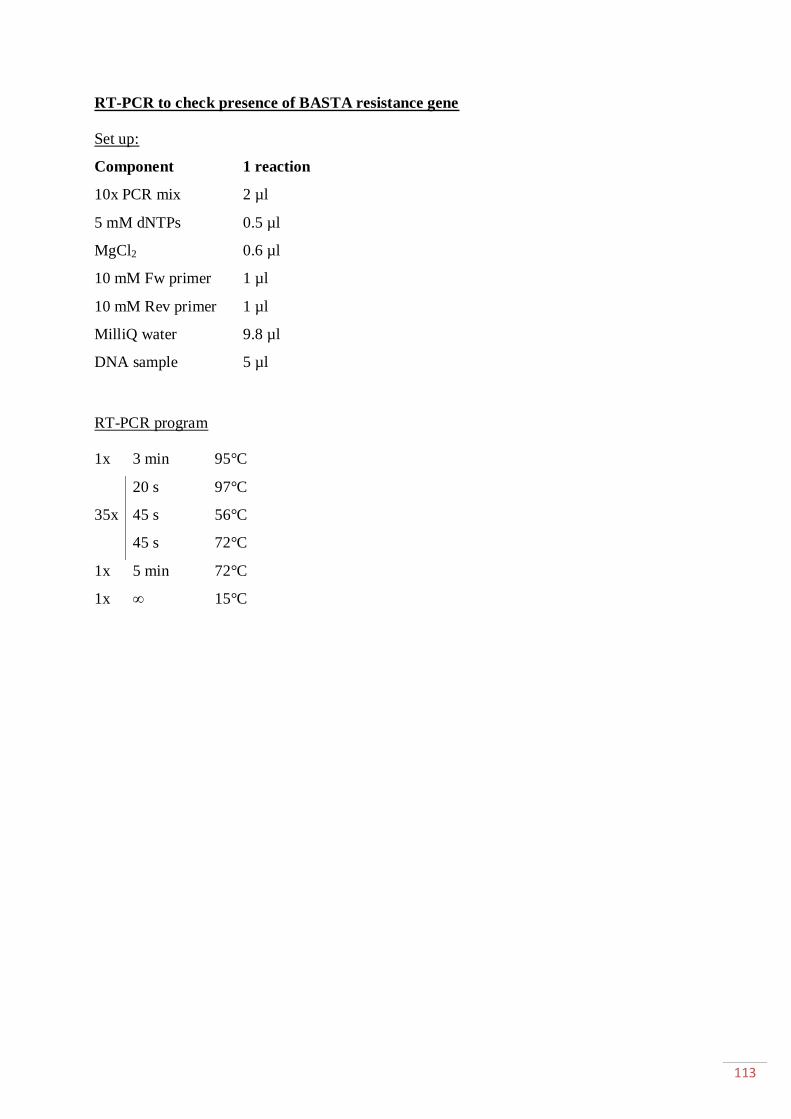
113
RT-PCR to check presence of BASTA resistance gene
Set up:
Component 1 reaction
10x PCR mix 2 µl
5 mM dNTPs 0.5 µl
MgCl2 0.6 µl
10 mM Fw primer 1 µl
10 mM Rev primer 1 µl
MilliQ water 9.8 µl
DNA sample 5 µl
RT-PCR program
1x 3 min 95°C
20 s 97°C
35x 45 s 56°C
45 s 72°C
1x 5 min 72°C
1x ∞ 15°C

114
Leaf painting assay for detection of Bar gene-based herbicide resistance
A. Commercially available herbicides:
Basta: active ingredient = glufosinate (an ammonium salt of phosphinothricin, PPT)
Commercial formulation = 200 mg/ml glufosinate
B. References:
Dennehey et al., 1994, Plant Cell Tiss. Org. Cult. 36:1-7.
Spencer et al., 1992, Plant Mol. Biol. 18: 201-210.
C. Procedure
1. Draw a line across one of the upper, fully emerged leaves using a black permanent marker.
Below the line and toward the leaf tip, paint a 1 inch long strip of herbicide solution (1% (v/v)
Basta (or Liberty) solution containing 0.01% Tween 20 wetting agent) using a cotton or
spongetipped applicator (see Figure1A and Figure 1B).
3. Score plants for susceptibility (Figure 2A, Figure 2B, and Figure 2C) or resistance (Figure
2D, Figure 2E. and Figure 2F) to the herbicide 3 to 7 days after application. Symptom
progress
may depend on environmental conditions. Young susceptible plants can be killed by this
application, but susceptible plants treated at the 8 to 9 leave stage or older generally continue
to
grow even though the treated leaf is damaged.
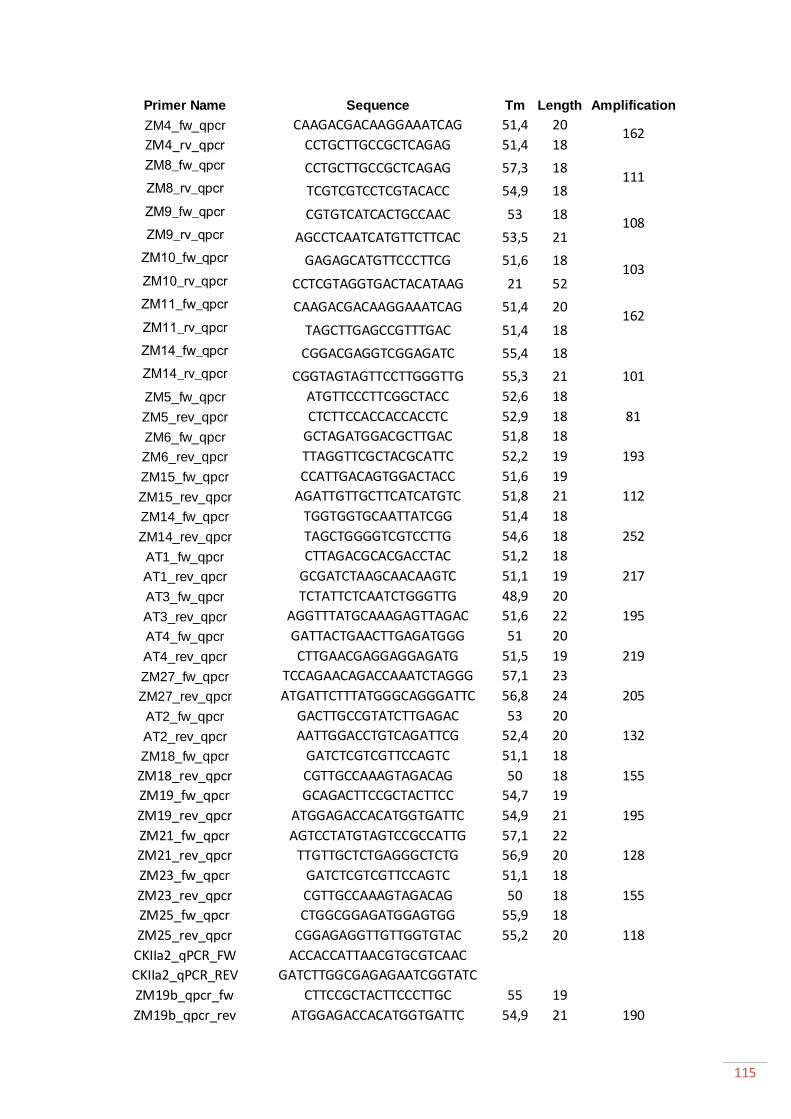
115
Primer Name Sequence Tm Length Amplification
ZM4_fw_qpcr CAAGACGACAAGGAAATCAG 51,4 20 162
ZM4_rv_qpcr CCTGCTTGCCGCTCAGAG 51,4 18
ZM8_fw_qpcr CCTGCTTGCCGCTCAGAG 57,3 18 111
ZM8_rv_qpcr TCGTCGTCCTCGTACACC 54,9 18
ZM9_fw_qpcr CGTGTCATCACTGCCAAC 53 18 108
ZM9_rv_qpcr AGCCTCAATCATGTTCTTCAC 53,5 21
ZM10_fw_qpcr GAGAGCATGTTCCCTTCG 51,6 18 103
ZM10_rv_qpcr CCTCGTAGGTGACTACATAAG 21 52
ZM11_fw_qpcr CAAGACGACAAGGAAATCAG 51,4 20 162
ZM11_rv_qpcr TAGCTTGAGCCGTTTGAC 51,4 18
ZM14_fw_qpcr CGGACGAGGTCGGAGATC 55,4 18
101 ZM14_rv_qpcr CGGTAGTAGTTCCTTGGGTTG 55,3 21
ZM5_fw_qpcr ATGTTCCCTTCGGCTACC 52,6 18
81 ZM5_rev_qpcr CTCTTCCACCACCACCTC 52,9 18
ZM6_fw_qpcr GCTAGATGGACGCTTGAC 51,8 18
193 ZM6_rev_qpcr TTAGGTTCGCTACGCATTC 52,2 19
ZM15_fw_qpcr CCATTGACAGTGGACTACC 51,6 19
112 ZM15_rev_qpcr AGATTGTTGCTTCATCATGTC 51,8 21
ZM14_fw_qpcr TGGTGGTGCAATTATCGG 51,4 18
252 ZM14_rev_qpcr TAGCTGGGGTCGTCCTTG 54,6 18
AT1_fw_qpcr CTTAGACGCACGACCTAC 51,2 18
217 AT1_rev_qpcr GCGATCTAAGCAACAAGTC 51,1 19
AT3_fw_qpcr TCTATTCTCAATCTGGGTTG 48,9 20
195 AT3_rev_qpcr AGGTTTATGCAAAGAGTTAGAC 51,6 22
AT4_fw_qpcr GATTACTGAACTTGAGATGGG 51 20
219 AT4_rev_qpcr CTTGAACGAGGAGGAGATG 51,5 19
ZM27_fw_qpcr TCCAGAACAGACCAAATCTAGGG 57,1 23
205 ZM27_rev_qpcr ATGATTCTTTATGGGCAGGGATTC 56,8 24
AT2_fw_qpcr GACTTGCCGTATCTTGAGAC 53 20
132 AT2_rev_qpcr AATTGGACCTGTCAGATTCG 52,4 20
ZM18_fw_qpcr GATCTCGTCGTTCCAGTC 51,1 18
155 ZM18_rev_qpcr CGTTGCCAAAGTAGACAG 50 18
ZM19_fw_qpcr GCAGACTTCCGCTACTTCC 54,7 19
195 ZM19_rev_qpcr ATGGAGACCACATGGTGATTC 54,9 21
ZM21_fw_qpcr AGTCCTATGTAGTCCGCCATTG 57,1 22
128 ZM21_rev_qpcr TTGTTGCTCTGAGGGCTCTG 56,9 20
ZM23_fw_qpcr GATCTCGTCGTTCCAGTC 51,1 18
155 ZM23_rev_qpcr CGTTGCCAAAGTAGACAG 50 18
ZM25_fw_qpcr CTGGCGGAGATGGAGTGG 55,9 18
118 ZM25_rev_qpcr CGGAGAGGTTGTTGGTGTAC 55,2 20
CKIIa2_qPCR_FW ACCACCATTAACGTGCGTCAAC
CKIIa2_qPCR_REV GATCTTGGCGAGAGAATCGGTATC
ZM19b_qpcr_fw CTTCCGCTACTTCCCTTGC 55 19
190 ZM19b_qpcr_rev ATGGAGACCACATGGTGATTC 54,9 21

116
ZM27_fw_qpcr CGGCAAGTCGGTCTACATC 54,8 19
133 ZM27_rev_qpcr TCCCTAGATTTGGTCTGTTCTG 54,6 22
CC2 - Fw AGTACCTGGATCTGGACCTCAAG 57 23 CDKA1;1
CC2 - Rev GCAACACCGTGGAGTATCTGG 56 21 CDKA1;1
CC3 - Fw GTTGATGTGTGGTCAGTTGGTTG 55 23 CDKA2;1
CC3 - Rev GCCATGTTTCTTTAGTTGGAGTGC 56 24 CDKA2;1
CC4 - Fw CCACAACACAACACTCCACTCC 57 22 CDKB1;1
CC4 - Rev ACCGTCGATGGGCAAGGG 55 18 CDKB1;1
CC5 - Fw CAAGCAGGGCGTCAACAAGG 56 20 CDKB2;1
CC5 - Rev GAACTTCTTCAGGTCGGTGTCC 57 22 CDKB2;1
CC6 - Fw AGCAACAGAGGCAGGCAGAG 56 20 CDKC2
CC6 - Rev GCAAGCGAGAATGTGGTGGAG 56 21 CDKC2
CC7 - Fw GTTGCTGCACCTCCACTACG 56 20 CKDD1
CC7 - Rev GCCTTGGAAGCTGCGATGG 55 19 CKDD1
CC8 - Fw GCCTTCAACGCTGCCTCAC 55 19 CDKE1
CC8 - Rev TCCGCCTTCCTTCTCAACTGG 56 21 CDKE1
CC12 - Fw CCAGTATCACGCCATGACAGC 56 21 CYCA1;2
CC12 - Rev AGGCAGGAGCACGACTTGG 55 19 CYCA1;2
CC13 - Fw GCCTCCGACATCTACACCTACC 59 22 CYCA3;1
CC13 - Rev CACCCGCCGCACCAAATC 55 18 CYCA3;1
CC14 - Fw CGCTTCCTCTCCGTCAATGC 56 20 CYCA3;2
CC14 - Rev TTGGTGTAGGTGTTGTCTGTGATG 56 24 CYCA3;2
CC15 - Fw CCGATAACACCTACACCAAGCAAG 57 24 CYCA3;3
CC15 - Rev GTGACGGCAAGAAGCGAAGC 56 20 CYCA3;3
CC16 - Fw TCCTACCGCCAAGACGTTCC 56 20 CYCA3;4
CC16 - Rev GAATCAAGCCATAATCCAGCAAGC 56 24 CYCA3;4
CC17 - Fw AGCAGGACGCAGTTGGAGAG 56 20 CYCB1;1
CC17 - Rev GAGCCGAGAGCACAGAAGAAAG 57 22 CYCB1;1
CC18 - Fw GATGGACTACGGTATGGTGATGAC 57 24 CYCB1;2
CC18 - Rev CAGTGTGGTGCTTCAAGGTCTC 57 22 CYCB1;2
CC19 - Fw CGGGTTCGCTCCACGTTTAC 56 20 CYCB1;3
CC19 - Rev CGCCGCCGTTCATCTGTTC 55 19 CYCB1;3
CC20 - Fw TGAGATGGAGAGGAGGATAGTGAAC 58 25 CYCB2;1
CC20 - Rev CTGATTGTGCTGCCTTTAGAAACC 56 24 CYCB2;1
CC21 - Fw CAGTAGTCCAGTCCTCCTCCTTC 59 23 CYCB2;2
CC21 - Rev ATAATAACAAGCAGCAACGGTAACG 54 25 CYCB2;2
CC22 - Fw ACTCGCACTCGCACTGACC 55 19 CYCD1;1
CC22 - Rev CAAGTGATGAGGGAGGGTAGAGG 59 23 CYCD1;1
CC23 - Fw CAAGTAGGTGGCGTGGCAAG 56 20 CYCD2;1
CC23 - Rev CCGAGAATAGCAGCGTTGTCC 56 21 CYCD2;1
CC24 - Fw GGTCTGGTGGAGCGGGAAC 58 19 CYCD4;1
CC24 - Rev CTGTGGTGCGTGTAAGCCTTC 56 21 CYCD4;1
CC25 - Fw ATCAGAGCCAGACAGCCAATC 54 21 CYCD4;2
CC25 - Rev AGGGTGGAAGCCGCCATC 55 18 CYCD4;2
CC26 - Fw CATCGCCGTAGCATCCATCC 56 20 CYCD5;1
CC26 - Rev CGGTGTCTAGCTGCGGAAATG 56 21 CYCD5;1

117
CC27 - Rev TCTCGTCAGACGTGTCACCAC 56 21 CYCD5;2
CC27 - Fw GTTCTTGGCTTCTTGCTTCTTGC 55 23 CYCD5;2
CC28 - Fw CCCGCCGCCGCTGAATC 57 17 CYCH
CC28 - Rev GCCGCCCACCTCTCCATC 57 18 CYCH
CC29 - Fw CCACGAGGAGACCAATATGAGAAC 57 24 DEL1
CC29 - Rev GCCCTACCCAACCAACGAAAC 56 21 DEL1
CC30 - Fw CAGCCGCAAGCAGAAGTCG 55 19 DEL2
CC30 - Rev TCGTCCAGCCCAATCACCTC 56 20 DEL2
CC31 - Fw GAAGCGTCGGCGGCAATG 55 18 DPa
CC31 - Rev GTAGTCCGTCCTTTGGTCTCAAC 57 23 DPa
CC32 - Fw CGCTGAATGTCCTAATGGCTATGG 57 24 DPb
CC32 - Rev GCTGCTCATTTCGCCGAACC 56 20 DPb
CC33 - Fw GTTCACTGGCGTTGTCGTCTG 56 21 DPc
CC33 - Rev GTTACACCCGTCGTTCTACCAATC 57 24 DPc
CC34 - Fw CGCTTGTTGTCTCCTTCCCTAG 57 22 DPd
CC34 - Rev CGAGGAGAGCGGGAGCTAG 58 19 DPd
CC35 - Fw ACTACCCCTGGACCTGTAAAAGC 57 23 E2F
CC35 - Rev ATAGCGGCAGTGGTTTAATGTGG 55 23 E2F
CC36 - Fw AGCAGCAGACGCAGTGGG 55 18 KRP1
CC36 - Rev ACGCCTCAGCCTCCTTAGTTG 56 21 KRP1
CC37 - Fw GGCATGGTCTCCGTTTCTCTTG 57 22 KRP2
CC37 - Rev TCTGACAGTGGTCTGGTGGTAG 57 22 KRP2
CC38 - Fw CACACCCACCTACCTACCTACC 59 22 KRP3
CC38 - Rev GGTCCCGTCCGTGCTAAGC 58 19 KRP3
CC39 - Fw GTCCCTCAACTCCAATGTAACCC 57 23 KRP4
CC39 - Rev CATTAATTCGGCAACTGGTAACAGG 56 25 KRP4
CC40 - Fw AGGACAGTTTACTTGGTAGTGGAAG 56 25 RBR1;1
CC40 - Rev CGTGGAGGAGACATTGGATTTGG 57 23 RBR1;1
CC41 - Fw GGCATCTCCCACAAAGACAATAAAG 56 25 RBR2;1
CC41 - Rev CACCTCACGAAGCCACTTAGC 56 21 RBR2;1
CC42 - Fw GGCGAGAAGTCATTGCTGCTAGC 59 23 RBR2;2
CC42 - Rev CCCTTCTCCATTTGCTAGGAACAAG 58 25 RBR2;2
CC43 - Fw TGGTAATGGTCTTTCACGCTATCG 56 24 WEE1
CC43 - Rev TCTTTCACTGCTTGCCTCCTTTC 55 23 WEE1
CC44 - Fw GGATGATGCGTGTAACCGTAACG 57 23 CYCB3
CC44 - Rev CAACGAGCCTCAACCTGACAAC 57 22 CYCB3

118