functional studies of genes associated with muscle growth ...563920/fulltext01.pdf · functional...
TRANSCRIPT
ACTAUNIVERSITATIS
UPSALIENSISUPPSALA
2012
Digital Comprehensive Summaries of Uppsala Dissertationsfrom the Faculty of Medicine 836
Functional Studies of GenesAssociated with Muscle Growthin Pigs and Hair Greying
LIN JIANG
ISSN 1651-6206ISBN 978-91-554-8527-6urn:nbn:se:uu:diva-183715
in Horses
Dissertation presented at Uppsala University to be publicly examined in room B22, BMC, Uppsala, Friday, December 14, 2012 at 13:15 for the degree of Doctor of Philosophy (Facultyof Medicine). The examination will be conducted in English.
AbstractJiang, L. 2012. Functional Studies of Genes Associated with Muscle Growth in Pigsand Hair Greying in Horses. Acta Universitatis Upsaliensis. Digital ComprehensiveSummaries of Uppsala Dissertations from the Faculty of Medicine 836. 52 pp. Uppsala.ISBN 978-91-554-8527-6.
Domestic animals have become very different from their wild ancestors during domesticationand animal breeding. This provides a good model to unravel the molecular mechanismsunderlying phenotypic variation. In my thesis I have studied genes affecting two important traits,leanness in pigs and hair greying-associated melanoma in horses.
In the first part of the thesis, I focused on an intronic mutation leading to more musclegrowth and less fat deposition in domestic pigs to identify a transcription factor (TF) that bindsto the regulatory element overlapping with the mutation. The aim has been to further studythe function of the previously unknown TF in mouse myoblast cells and in insulin-producingcells (Paper I-III). We discovered a new TF ZBED6 binding to intron 3 of the IGF2 gene,in which a single nucleotide substitution in pigs abrogates the binding and causes increasedleanness in domestic pigs. Silencing of ZBED6 expression in mouse myoblasts increased Igf2expression, cell proliferation and migration, and myotube formation. This result is in line withthe increased leanness phenotype in mutant pigs. Chromatin Immunoprecipitation-sequencing(ChIP-seq) using an anti-ZBED6 antibody identified 1200 ZBED6 target genes besides IGF2and many are TFs controlling fundamental biological processes. In the first follow-up study wefound ZBED6 mainly affected the expression of muscle protein genes by directly regulating Igf2and Twist2 expression, in agreement with our previous observation of faster myotube formationin ZBED6-silenced cells. ChIP-seq with antibodies against six different histone modificationsrevealed that ZBED6 preferentially binds to active promoters and modulates transcriptionalactivity by a novel mechanism rather than by recruiting repressive histone modifications. Thesecond follow-up study revealed that ZBED6 affects the morphology and insulin content andrelease in pancreatic ß cells.
In the second part (Paper IV), we investigate the functional significance of an intronicduplication in the Syntaxin 17 (STX17) gene causing hair greying and melanoma in horses.We found two Microphtalmia-associated transcription factor (MITF) binding sites within theduplication and showed that the duplicated sequence up-regulates reporter gene expression ina melanocyte-specific manner both by reporter assays in mouse melanocytes and in transgeniczebrafish. These results established that the intronic duplication acts as a melanocyte-specificenhancer that becomes much stronger when it is duplicated.
Keywords: QTN, muscle development, IGF2, ZBED6, RNA-seq, ChIP-seq, myoblasts,pancreatic beta cells, Grey horse, melanoma, MITF
Lin Jiang, Uppsala University, Department of Medical Biochemistry and Microbiology,Box 582, SE-751 23 Uppsala, Sweden.
© Lin Jiang 2012
ISSN 1651-6206ISBN 978-91-554-8527-6urn:nbn:se:uu:diva-183715 (http://urn.kb.se/resolve?urn=urn:nbn:se:uu:diva-183715)

To my family

List of Papers
This thesis is based on the following papers, which are referred to in the text by their Roman numerals.
I Markljung E *, Jiang L*, Jaffe JD, Mikkelsen TS, Wallerman
O, Larhammar M, Zhang X, Wang L, Saenz-Vash V, Gnirke A, Lindroth AM, Barrés R, Yan J, Strömberg S, De S, Pontén F, Lander ES, Carr SA, Zierath JR, Kullander K, Wadelius C, Lindblad-Toh K, Andersson G, Hjälm G, Andersson L (2009). ZBED6, a novel transcription factor derived from a domesticat-ed DNA transposon regulates IGF2 expression and muscle growth. PLoS Biology 7:e1000256. *Contributed equally
II Jiang L, Rubin CJ, Gilbert ER, Sundström E, Wallerman O,
Ghazal A, Zhang X, Wang L, Mikkelsen TS, Andersson G, An-dersson L. The role of ZBED6 in transcriptional regulation studied by transcriptome analysis after RNAi in mouse my-oblast. Submitted.
III Jiang L*, Wang X*, Wallerman O, Klaesson A, Welsh N and
Andersson L. Stable silencing of ZBED6 affects the morpholo-gy, gene expression and insulin content in insulin producing cells. Manuscript. *Contributed equally
IV Sundström E, Komisarczuk AZ, Jiang L, Golovko A, Navrati-
lova P, Rinkwitz S, Becker TS, Andersson L (2012). Identifica-tion of a melanocyte-specific, microphthalmia-associated tran-scription factor-dependent regulatory element in the intronic duplication causing hair greying and melanoma in horses. Pig-ment Cell Melanoma Research 25:28-36.
Reprints were made with permission from the respective publishers.
Related Publications by the Author
(Not included in the thesis) Andersson L, Andersson G, Hjälm G, Jiang L, Lindblad-Toh K, Lindroth AM, Markljung E, Nyström AM, Rubin CJ, Sundström E (2010). ZBED6 – the birth of a new transcription factor in the common ancestor of placental mammals. Transcription 1:144-148. Jiang L, Saetre P, Radomska KJ, Jazin E, Lindholm Carlström E (2010). QKI-7 regulates expression of interferon-related genes in human astrocyte glioma cells. PLoS One 5:e13079. Rubin CJ, Zody MC, Eriksson J, Meadows JR, Sherwood E, Webster MT, Jiang L, Ingman M, Sharpe T, Ka S, Hallböök F, Besnier F, Carlborg O, Bed′hom B, Tixier-Boichard M, Jensen P, Siegel P, Lindblad-Toh K, An-dersson L (2010). Whole-genome resequencing reveals loci under selection during chicken domestication. Nature 464:587-91. Jiang L, Saetre P, Jazin E, Carlström EL (2009). Haloperidol changes mRNA expression of a QKI splice variant in human astrocytoma cells. BMC Pharmacology 31:9-15. Aberg K, Axelsson E, Saetre P, Jiang L, Wetterberg L, Pettersson U, Lind-holm E, Jazin E (2008). Support for schizophrenia susceptibility locus on chromosome 2q detected in a Swedish isolate using a dense map of mi-crosatellites and SNPs. American Journal of Medical Genetics Part B: Neuropsychiatric Genetics 147B:1238-44.
Contents
Introduction ................................................................................................... 11Porcine muscle growth ............................................................................. 11
Pig domestication ................................................................................. 11Genetic selection for pork production .................................................. 11Mutations associated with muscle growth in pigs ............................... 12
IGF2 and muscle development ................................................................. 13Regulation of muscle development ...................................................... 13IGF2 in muscle development ............................................................... 13C2C12 as an in vitro model for muscle development .......................... 15
Grey horses ............................................................................................... 15Greying and melanoma ........................................................................ 15An intronic duplication is causing greying with age in horses ............ 16
Transcriptional regulation ......................................................................... 17Background .......................................................................................... 17Transcriptional activation .................................................................... 18Transcriptional repression .................................................................... 18Distant control regions play an important role .................................... 18
Integrated genome wide functional analysis ............................................ 19Chromatin Immunoprecipitation sequencing analysis (ChIP-seq) ...... 20Whole transcriptome analysis .............................................................. 21Loss-of-function studies ....................................................................... 22
Aim of the thesis ........................................................................................... 23
Present investigations .................................................................................... 24Identification of ZBED6, a novel transcription factor in placental mammals (Paper I) .................................................................................... 24
Background .......................................................................................... 24Results and discussion ......................................................................... 26
The role of ZBED6 in transcriptional regulation studied by transcriptome analysis after RNAi (Paper II) ........................................... 30
Background .......................................................................................... 30Results and discussion ......................................................................... 31

Stable silencing of ZBED6 affects the function of insulin producing ß cells (Paper III) ......................................................................................... 34
Background .......................................................................................... 34Results and discussion ......................................................................... 35
A melanocyte-specific regulatory element in the duplication causing greying and melanoma in horses (Paper IV) ............................................ 37
Background .......................................................................................... 37Results and discussion ......................................................................... 38
Future prospects ............................................................................................ 40
Summary in Chinese/中文摘要 .................................................................... 44
Acknowledgment .......................................................................................... 45
References ..................................................................................................... 47
Abbreviations
ATP Adenosine tri-phosphate BAHD1 Bromo adjacent homology domain-containing protein 1 BEAF Boundary element-associated factor ChIP Chromatin immunoprecipitation CpG Cytosine-phosphate-guanine DMR Differentially methylated region DNA Deoxyribonucleic acid DREF DNA replication-related element factor EMSA Electrophoretic mobility shift assay ER Endoplasmic reticulum GH Growth hormone GTF General transcription factor H3K4 Histone 3 lysine 4 H3K9 Histone 3 lysine 9 H3K20 Histone 3 lysine 20 H3K27 Histone 3 lysine 27 H3K36 Histone 3 lysine 36 IGF Insulin-like growth factor IGF2AS IGF2 antisense kb Kilobase MAPK Mitogen-activated protein kinase MC1R Melanocortin 1 receptor MC4R Melanocortin 4 receptor MITF Microphthalmia-associated transcription factor mRNA Messenger RNA Myf5 Myogenic factor 5 MyoD Myoblast determination protein NGS Next-generation sequencing NR4A Nuclear receptor subfamily 4, group A PCR Polymerase chain reaction PI3K Phosphatidylinositol-3-kinase Pol I RNA ploymerase I Pol II RNA polymerase II Pol III RNA polymerase III QTL Quantitative trait locus QTN Quantitative trait nucleotide

RNA Ribonucleic acid RNA-seq Whole transcriptome sequencing SILAC Stable isotope labeling by amino acid in cell culture siRNA Small interference RNA SNP Single nucleotide polymorphism STX17 Syntaxin 17 TF Transcription factor t-SNARE trans-soluble NSF attachment protein receptor TSS Transcription start site UV Ultraviolet light ZBED Zinc finger, BED-domain containing ZC3H11A Zinc finger CCCH type containing 11A
11
Introduction
Porcine muscle growth
Pig domestication Pig belongs to the genus Sus, within the Suidae family of even-toed ungu-lates. The domestic pigs (Sus domesticus) were domesticated from the wild boar (Sus scrofa). Pigs were first domesticated at least 9000 years ago in the Near East, suggested by an extensive zooarcheological record (Epstein and Bichard 1984). Further molecular evidence suggested that a second, inde-pendent domestication occurred in China (Giuffra et al. 2000). Recent genet-ic data revealed multiple locations of pig domestication across Eurasia (Larson et al. 2005). There are at least 16 different subspecies of the wild boar and over 730 domestic breeds worldwide of which two thirds reside in China and Europe (Rischkowsky et al. 2007).
Pig domestication has been an integral part of the rise of agriculture throughout the world and the domestic pigs have become one of the major human nutritional sources of animal-based protein. The modern domestic pigs, compared with their wild ancestor, show such remarkable morphologi-cal differences that Darwin considered the two forms as distinct species (Darwin 1868). This is principally due to human and novel environmental pressures during pig domestication. Over the centuries, different global pig farming conditions have resulted in traits of heat/cold tolerance and disease resistance and farmers have been breeding for a variety of traits with a major focus on growth, fertility and meat production.
Genetic selection for pork production Since the 18th century, successive years of breeding enabled the improve-ment of European pig breeds with the sole purpose of providing meat. The improvement of the pig breeds was associated with an increased preference for fatness until 1900, because fat was seen as a beneficial character to pro-vide energy to a population of manual workers at that time (Whittemore 2006). The introgression of Chinese pigs with the European breeds through-out the 19th century led to increased fatness and reduced age and size at ma-turity in the indigenous European breeds (Kijas and Andersson 2001). How-
12
ever, after the Second World War, production efficiency required a faster growth rate, while consumers' preference drove selection for a reduction in fat content (Whittemore 2006). Presently there are two distinct kinds of pig populations, indigenous Asian types (e.g. Chinese Meishan) in village tradi-tional farms in China and commercial pig breeds in Europe and North Amer-ica. Most of the commercial pig breeds, such as Yorkshire/Large White, Landrace, Duroc and Hampshire have all been under strong selection for lean growth.
Selection for lean growth in pig leads to an increase in muscle growth and a reduction in fat deposition. The identification of mutations affecting lean growth helps us to identify genes that play important roles in muscle growth. Mutations that increase muscle growth in pig are also highly valuable to the pork industry. The pig meat market has risen linearly during the twentieth century. In Europe, food and drink manufacturing contributes to at least 2% of Gross Domestic Product (GDP) and of the total food expenditure, 20% comprises pork (Whittemore 2006). There are now in total 120,000,000 pigs in the European Union and the average consumption of pig meat per head per year is more than 40 kg.
Mutations associated with muscle growth in pigs Thus far, only the ryanodine receptor (RYR1) gene (Fujii et al. 1991), AMP-activated protein kinase gamma 3 (PRKAG3) gene (Milan et al. 2000), mela-nocortin-4 receptor (MC4R) gene (Kim et al. 2000), and insulin-like growth factor 2 (IGF2) gene (Van Laere et al. 2003), have been shown to bear muta-tions associated with muscle growth or leanness in pigs.
The first mutation that was involved in the muscle growth in pig and characterized at the molecular level was identified in the RYR1 gene, encod-ing a skeletal muscle calcium release channel in the sarcoplasmic reticulum. A missense mutation in the porcine RYR1 gene is causative of malignant hyperthermia and is also associated with lean body mass (Fujii et al. 1991).
A second mutation was found in PRKAG3 encoding a muscle-specific isoform of the regulatory γ subunit of the AMP-activated protein kinase. This mutation, also a missense mutation, has beneficial effects on meat con-tent but detrimental effects on processing yield (Milan et al. 2000).
A third known mutation is located in MC4R and influences mainly fatness and to a lesser extent muscle growth (Kim et al. 2000). However, the effects of this missense mutation could not unambiguously be confirmed in later studies in different breeds (Park et al. 2002; Stachowiak et al. 2006).
A fourth famous mutation affecting porcine muscle growth was discov-ered in the paternally expressed IGF2 gene in the major commercial lean breeds (Jeon et al. 1999; Nezer et al. 1999; Van Laere et al. 2003). Insulin-like growth factor 2 (IGF2) is known to play an essential role during myo-genesis (Florini et al. 1991). This mutation is a single base cis-regulatory
13
substitution, in an evolutionary conserved CpG island within intron 3 of IGF2, and leads to 3-4% increased muscle mass and enlarged heart in pig.
Furthermore, it was suggested that the myostain (MSTN) and cathepsin D (CTSD) genes contain mutations affecting muscle growth in specific breeds (Stinckens et al. 2008; Fontanesi et al. 2010). However, more genetic and functional evidence is required to confirm the causative mutations within those two genes.
Among all these mutations associated with muscle growth, the one locat-ed in the IGF2 gene is the most widespread, with no obvious detrimental effects. Most of the commercial breeds including Yorkshire/Large White, Landrace, Hampshire, Pietrain and Duroc, which have been under selection for lean growth, do carry the mutation.
IGF2 and muscle development
Regulation of muscle development Muscle development requires strict transcriptional regulation of myogenic regulatory factors (MRF), a gene family of muscle basic helix-loop-helix transcription factors including MyoD, Myf5 and myogenin (Buckingham et al. 2003). During muscle growth, satellite cells up-regulate myogenic deter-mination factors, Myf5 and/or MyoD, undergo a period of regulated prolif-eration, express the terminal MRF myogenin, exit the cell cycle, express muscle-specific structural proteins including myosins and troponins, and finally fuse to form multinucleated myofibres (Holterman and Rudnicki 2005). During the early embryonic development, the myoblast determination protein (MyoD) has the ability to determine the skeletal muscle lineage and has been shown to induce fibroblasts as well as other non-muscle cell lines to differentiate into myoblasts (Weintraub et al. 1989). Myf5 is also required for the determination of the skeletal myoblasts and the muscle develops normally if only one of MyoD or Myf5 is absent. However, the absence of both genes in the embryo leads to complete lack of muscle formation (Rudnicki et al. 1993). In the second stage, the identity of the myoblasts is not crucial. During this stage myogenin has a critical role in the terminal differentiation of specified muscle cells (Hasty et al. 1993; Nabeshima et al. 1993).
IGF2 in muscle development IGF2 is a secreted peptide hormone that plays an important role in muscle tissues via both endocrine and local autocrine/paracrine mechanisms pri-marily by stimulating the IGF1 receptors (Igf1r) (Jones and Clemmons 1995;
14
Nakae et al. 2001). The muscle hypoplasia phenotype of Igf1r null mice confirms the necessity of IGF signaling in muscle development (Liu et al. 1993). IGF1 receptors, with early and widespread expression, mediate the major effects of both IGF1 and IGF2 on different biological actions includ-ing the proliferation and differentiation of myoblast cells; while the only function of the IGF2 receptors is to mediate the uptake and degradation of IGF2 (Jones and Clemmons 1995).
The production of IGF2 is stimulated by the binding of the growth hor-mone to the GH receptors (Florini et al. 1996). IGF2 expression appears as early as embryonic day 5.5 (E5.5) after implantation in all of the components forming the chorioallantoic placenta (Lee et al. 1990), and is more activated in embryonic tissues particularly derived from somites and in developing muscles (Stylianopoulou et al. 1988; Bondy et al. 1990). The expression continues during the early neonatal period and then ceases in most tissues (Soares et al. 1986). Mice carrying the Igf2 null allele exhibits 40% decrease of body size at birth and this defect continues during postnatal development (DeChiara et al. 1990). Interestingly, Igf2 is a tissue-specific parentally im-printed gene, thus homozygous Igf2 null mice are indistinguishable in ap-pearance from the paternal heterozygous siblings that have the growth de-fects (DeChiara et al. 1991). On the other hand, Igf2 overexpression in mice results in fetal and neonatal lethality and disproportionate organ overgrowth including larger heart with thickened muscle wall (Sun et al. 1997). These studies confirm that IGF2 is indispensable for embryonic growth and muscle development.
Autocrine IGF2 controls muscle differentiation initiation by regulating MyoD function and myogenin expression through the activation of IGFI receptors and the phosphoinositide 3-kinase (PI3K)/Akt signaling pathway (Wilson and Rotwein 2006). Besides the PI3K/Akt signaling pathway, a functional p38 mitogen-activated protein kinase (MAPK) pathway is also necessary for myoblast differentiation. This pathway activates myoblast differentiation via p38 phosphorylation (Wu et al. 2000), activation of myo-cyte enhancer factor 2 and E-box binding proteins to facilitate dimer for-mation with MRFs (Zhao et al. 1999; Lluis et al. 2005), and remodeling chromatin at muscle-specific loci (Simone et al. 2004). The activation of p38, stimulated by cell-cell contact, induces IGF2 expression and acts in a feed-forward mechanism to accelerate myoblast differentiation (Lovett et al. 2006). Therefore, p38 (in particular p38α) converts signals that indicate cell density into promyogenic gene expression in the form of the key peptide, IGF2 (Lovett et al. 2010). Although IGF2 is a key regulator of myoblast differentiation, surprisingly the transcription factors that directly regulate Igf2 expression are not well characterized. Further characterization of a new factor that regulates Igf2 expression is presented in this thesis (Paper I-III).
15
C2C12 as an in vitro model for muscle development Murine myoblast C2C12 cells are the most widely used cell line to study muscle differentiation since it was established from the thigh muscle of mice (Yaffe and Saxel 1977). When maintained in a mitogen-rich culture medium with 10% to 20% fetal bovine serum (growth medium), C2C12 cells grow as myoblasts, expressing myoblast determination protein (MyoD), but not acti-vating downstream genes associated with muscle differentiation. When cul-tured in low-mitogen conditions (differentiation medium), C2C12 cells dif-ferentiate into skeletal muscle cells and activate the expression of muscle genes. The C2C12 cells can be rapidly induced to a differentiation state to produce muscle proteins and form contractile myotubes by simply replacing the growth medium with differentiation medium at 50%-60% confluence.
C2C12 myoblast cells are frequently studied as in vitro model of growth, migration, differentiation and death based on several advantages. Firstly they are commercially available. Secondly they have a reasonably fast growth rate, achieving 90% confluence in two to three days after being seeded in a normal tissue culture plate at ten-fold dilution. Thirdly, it is easy to differen-tiate C2C12 myoblast cells to multi-nucleated myofibres. Finally, many functional studies including wound-healing assays, immunostainings, transi-ent transfections with expression vectors or siRNA oligos, and stable trans-fections with bacterial artificial chromosome (BAC) constructs are simple to perform in these cells.
Grey horses
Greying and melanoma Grey horses exhibit a fascinating pigment cell disorder phenotype. Although born colored, Grey horses progressively lose the hair pigmentation and be-come white by the age of 6-8 years, while the skin stays dark throughout life. This indicates different cellular fates for the melanocytes in the hair follicle and in the skin. The greying process in grey horses is comparable to the greying of human hair.
A second remarkable phenotype demonstrated by grey horses is a very high incidence of melanoma. It is estimated that ~80% of Grey horses older than 15 years have melanomas, while this is a rare condition in horses with other coat color phenotypes (Sutton and Coleman 1997). The primary tumours arise in the dermis of the glabrous skin under the tail, in the perianal and genital re-gions, lips and eyelids, but could also occur internally (Sutton and Coleman 1997; Smith et al. 2002). The tumors grow as black pigmented, hemispheri-cal-shaped, well-isolated nodules and can grow big as an apple in size.
16
Although most of the melanomas have a long and initially benign growth period, up to 66% of these tumors may become malignant with metastases formation in other organs including the skeletal muscle, heart, abdominal fat and lymph nodes (Gorham and Robl 1986; Sutton and Coleman 1997). De-spite this unusual clinical behaviour, the Grey horse melanomas share a number of features with human cutaneous melanomas, suggesting similari-ties in pathogenesis (Seltenhammer et al. 2004). A large proportion of Grey horses develop vitiligo-like skin depigmentation, commonly on the muzzle and under the tail, which is thought to be an autoimmune reaction induced by the presence of melanomas.
An intronic duplication is causing greying with age in horses A 4.6-kb duplication in intron 6 of syntaxin 17 (STX17) has been identified as the causative mutation for greying with age (Rosengren Pielberg et al. 2008). This mutation significantly up-regulates the expression of both STX17 and the neighboring nuclear receptor subfamily 4, group A, member 3 (NR4A3) in melanomas of Grey horses.
STX17 encodes two transcripts: the full-length one and an alternative truncated transcript retaining only the last two exons of the full-length coun-terpart. The expression of both transcripts is strongly up-regulated in Grey melanomas (Rosengren Pielberg et al. 2008). The full-length transcript en-codes a t-SNARE syntaxin implicated in the ER-to-Golgi vesicle transport in a number of cell types (Steegmaier et al. 1998; Gordon et al. 2010). Interest-ingly, the protein was reported to have an altered nuclear localization in some malignant cells in contrast to the ER localization in normal cells (Zhang et al. 2005). The truncated STX17 lacks the N-terminal part with a well-conserved SNARE domain, but retains the two-pass membrane region and a carboxyterminal tail, the two unique features of the full-length STX17 (Rosengren Pielberg et al. 2008).
The NR4A members are early-response TFs implicated in cell cycle regu-lation, apoptosis and carcinogenesis (Maxwell and Muscat 2006). In mela-nocytic cells NR4A members mediate MC1R-induced DNA-damage re-sponse to UV exposure (Smith et al. 2008). Accumulating evidence suggests that the NR4A family may have a pro-tumourigenic role in melanoma. Smith et al. (2011) have reported that down-regulation of both NR4A1 and NR4A2 affected gene targets involved in melanoma tumourigenicity in human mela-noma cells with oncogenic serine/threonine-protein kinase B-Raf. Moreover, increased expression of NR4A3 has been reported as a distinct feature of melanoma cell lines in contrast to non-melanoma cancer cell lines (Holbeck et al. 2010).
17
Transcriptional regulation
Background Essentially, all human cells have the same protein-coding gene content (ap-proximately 22,000), yet these genes are regulated in different spatial and temporal patterns. Thus the number of genes is not the only factor to deter-mine gene expression patterns and tissue type, for example. Transcription of a protein-coding gene first requires access of RNA polymerase II and gen-eral as well as tissue-specific transcription factors to the gene locus in the chromatin. The chromatin is composed of nucleosomes and keeps the gene in an inactive state by forming condensed structures and restricting access of RNA polymerase II and transcription factors. It can be subdivided into het-erochromatin and euchromatin. Heterochromatin, often present at the nuclear periphery, near nucleoli or in chromocenters, is compact and transcriptional-ly silent. Euchromatin, usually located toward the interior of a nucleus, is decondensed and contains transcriptionally active regions of the genome. Nucleosomes are arranged into higher-order structures and subject to numer-ous forms of regulation. Thus, a process called chromatin remodeling at the position of the gene and its control regions is necessary to permit transcrip-tion. Transcription is regulated by different combinations of ubiquitous and tissue-specific regulatory proteins (Maston et al. 2006). The combinatorial regulation enables an organism to employ a small number of regulatory pro-teins (approximately 1,800) to achieve a large number of regulatory activi-ties (Carey et al. 2009). A typical combinatorial regulatory example contains two parts: core promoters bound by general transcription factors (GTFs) and proximal promoter and distant control regions bound by activators or re-pressors. Different GTFs and RNA polymerase II constitute the general tran-scription machinery and mediate basal transcription on a core promoter en-compassing DNA approximately 35-40 bp up-/downstream a transcription start site (Maston et al. 2006). About 25% of the core promoters contain a consensus TATA box, which is typically located in tissue-specific or devel-opmentally specific genes (Yang et al. 2007). More than 60% of ubiquitous-ly expressed housekeeping genes lack a TATA box and contain unmethylat-ed CpG islands 100 bp upstream of TSS. The proximal promoter is usually located within 250-300 bp upstream of the core promoter (Maston et al. 2006). The distant control regions include enhancers, silencers, locus control regions, boundary elements, and matrix attachment regions. Enhancers can be positioned many kilobases upstream of the gene, in introns, or at the 3’ end of the coding region. Enhancers can greatly augment the low level of activity of the proximal promoters but cannot function in the absence of a proximal promoter. Silencers have been used to define elements that act in the opposite manner of enhancers and are distant control regions that sup-press gene expression in any assay.
18
Transcriptional activation Transcriptional activators, typically small modular proteins, tether to the proximal promoter and enhancer and stimulate all mRNA-encoding genes (Ptashne and Gann 1990). Most of them contain both DNA-binding domain and transcription activation domain that interacts with chromatin remodel-ing/modification proteins and co-activators. According to many studies in yeast, it is clear that the activator must first alter the chromatin at the pro-moter and enhancer before recruiting general transcription machinery (Reinke and Horz 2003). Indeed, histone modifications (e.g. acetylation) and remodeling of the promoter precede transcription in many cases (Workman 2006) and activators can recruit various histone acetyltransferases to the promoter. The acetylated histone tails destabilize higher-order chromatin structures at the promoter and serve as recognition sites for ATP-dependent remodeling proteins, which can evict nucleosomes from the chromatin (Workman 2006; Li et al. 2007). A platform for the recruitment of the gen-eral transcription machinery is generated and the RNA Pol II transcription cycle including initiation, elongation, and termination is initiated. The tri-methylation of H3K4 is required to remodel the nucleosome near the start site at the initial states of elongation while trimethylation of H3K36 is neces-sary to prevent remodeling of the trailing nucleosomes behind Pol II poly-merase, which prevents cryptic initiation.
Transcriptional repression Gene repression is associated with five types of mechanisms: histone deacetylation, H3K9 di- and trimethylation, H3K27 trimethylation, H4K20 trimethylation, and DNA methylation at CpG residues. For instance, Bierne et al. (2009) demonstrated that human Bromo adjacent homology domain-containing protein 1 (BAHD1) promotes heterochromatic gene silencing by first binding to transcription factors and then recruiting H3K27 trimethyla-tion and histone deacetylases to repress the target sites including the human IGF2 P3 promoter. Gene expression profiling after silencing of BAHD1 in human kidney cells revealed IGF2 as the most up-regulated transcript. Con-versely, over-expression of BAHD1 was followed by a 40% decrease in IGF2 mRNA abundance. They further demonstrated that BAHD1 binds within the CpG island located upstream of the IGF2 P3 promoter, which overlaps the QTN region in IGF2 intron 3 affecting muscle growth in pigs.
Distant control regions play an important role Both promoter regions and distal control regions need to be considered when analyzing the transcriptional regulation of certain genes. The promoter often is easier to identify because it relies solely on determination of the transcrip-
19
tion start site. Distant control regions are considered to be crucial for tran-scriptional regulation, but they are much more difficult to identify. One chal-lenge is that their defining features are imprecise. Some regions function only in the context of a chromosome, which is difficult to repeat in a transi-ent transfection with plasmid vectors. Multiple distant control regions act cooperatively to orchestrate the proper regulation of transcription. Therefore, despite the dramatic progress that has been made to understand transcription activators or repressors, the precise mechanisms often remain unknown. The current methods to identify distant control regions start with a phylogenetic analysis of the locus to search in the vicinity of a gene for highly conserved non-coding sequences through evolution. The UCSC genome browser (http://genome.ucsc.edu) is a preferred tool for evaluating conservation among mammals or other vertebrates. It is also possible to overlap the re-gions with other features from the genome browser such as previously iden-tified transcription factor binding sites, histone modifications and nuclease hypersensitivity. Candidate transcription factor binding sites can be inferred from other databases (e.g. TRANSFAC or JASPAR). The histone modifica-tion patterns in a particular cell type or tissue indicate whether a region is subject to transcriptional activation or repression. The nuclease hypersensi-tivity indicates if the region is undergoing nucleosome-free or is assembled into nucleosomes with altered structures. After a putative control region is localized, an appropriate functional assay is required to determine the func-tional relevance. A common approach is to perform reporter gene assays using a foreign protein as reporter e.g. commonly a luciferase assay. Numer-ous small putative control regions can be introduced into a luciferase report-er vector containing either the endogenous promoter or heterologous pro-moter driving expression of the luciferase gene. The resulting constructs can be tested using a transient or stable transfection assay. When pursuing a more complete understanding of a control region, a comprehensive muta-tional analysis needs to be performed.
Integrated genome wide functional analysis After 30 years during which the primary choice for sequencing has been ‘Sanger’ dideoxy sequencing, the past five years since the introduction of next generation sequencing (NGS) technology have seen an explosion of NGS data. There are three main NGS platforms including Roche 454 (Roche Life Sciences), SOLiD (Applied Biosystems) and Hi-Seq (Illumina) plat-forms. These technologies produce relatively short reads compared with Sanger sequencing. The principle behind NGS technology is that the bases of a small DNA fragment are sequentially identified from signals emitted as each fragment is re-synthesized from the DNA template strand. NGS extends
20
this process across millions of reactions in a parallel fashion to achieve high throughput.
NGS data output has increased at a rate of more than doubling each year and by 2012, it has nearly reached a terabase (Tb) of data in a single se-quencing run using the Illumina HiSeq 2000/1000 platform. NGS technolo-gy reduces the cost and time for genome-wide sequencing tremendously. Researchers can now sequence more than five human genomes in a single run in roughly one week, at 5000 USD per genome, while the first human genome required 10 years and 3 billion USD. Therefore, NGS methods have transformed the field of genomics, transcriptomics and epigenomics of all species.
Chromatin Immunoprecipitation sequencing analysis (ChIP-seq) This method can be used to detect protein-DNA interactions in vivo. It is possible to investigate the interactions at specific sites when followed by PCR but also in the entire genome when coupled with arrays (ChIP-chip) or high throughput sequencing (ChIP-seq). ChIP can also be used to determine genomic regions associated with certain histone modifications.
In order to enrich the DNA sequences bound by a certain protein, a cross-linking reagent (e.g. formaldehyde) is used to fix protein-DNA interactions in the tissues or cells. The chromatin is then fragmented by sonication to sizes of 100-500 bp and a specific antibody is applied to capture the DNA fragments bound to the protein of interest. The complexes are pulled down by protein A/G coupled agarose or magnetic beads that have been coupled to the antibody. Beads are then washed with buffers of different salt concentra-tions to remove unspecific interactions. The naked ChIP-DNA is purified after reversing the formaldehyde crosslinks by heating in buffers with high salt concentration and removing the proteins by proteinase K digestion. The level of enrichment for a genomic region can be calculated as the ratio of the amplified product from ChIP-DNA to that from its corresponding input DNA and then compared to the ratio for the genomic regions with no inter-action with the protein of interest. The quantification can be done by PCR amplification of the ChIP-DNA versus the input DNA. Compared with semi-quantitative PCR, real-time PCR is a more sophisticated method for measur-ing the enrichment. With the enrichment of one or two known binding re-gions confirmed, the eluted ChIP-DNA can be submitted to NGS platforms for sequencing without a negative control, however, since background reads are not randomly distributed compared to an input or negative control, it can yield a low level of false positives. ChIP-seq peaks from technical replicates have been found to have a good correlation, so doing more than two repli-cates from the same library is generally not necessary.
The amount of data produced by NGS in combination with short read length and relatively high error rate make bioinformatics analysis demand-
21
ing. For ChIP-seq analysis, the goal is to achieve as many correctly placed reads as possible, thus we may allow more mismatches in alignments. There are many types of alignment errors that may lead to false positive peaks in-cluding high GC content, reference genome errors, and the definition of unique reads. Peak detection should rely on unique reads since many align-ments from ChIP-seq libraries have the same origin. There are many pub-lished peak finders (e.g. MACS and FindPeaks are used in Paper I-III) to identify the enriched regions and peaks. All ChIP-seq experiments give false positive peaks, thus in order to reduce these we use several filtering steps like removing reads close to centromeric gaps and repeated regions.
Usually, the peak detection software can generate ‘wiggle’ files with the peak signals, which can be uploaded to a genome browser (e.g. UCSC ge-nome browser) for direct data visualization of the putative binding sites for the specific factor. By using the genome-wide data from public databases, it is possible to integrate several related factors, histone modifications, DNA methylations, and experiments like DNase I hypersensitivity, which identi-fies regions of open chromatin structure. The integrated data are used to define the regulatory regions of the specific transcription factor.
The peak identified by ChIP-seq is often relatively long, several hundred bases, so we need to apply certain motif finding method to identify the most likely binding sites within the enriched region. Motif finders were originally developed to detect overrepresented short sequences in promoters of related genes and now can be successfully applied to ChIP-seq peaks identified from mammals. If the motif sequence is known beforehand as in the case of Paper I, the motif discovery based on genome-wide ChIP-seq peaks can be used to refine the known motif, allowing better predictions of putative binding sites. It is also important to identify co-binding transcription factors or more than one motifs based on the discovered motif sequence.
Whole transcriptome analysis The transcriptome is the complete set of the variety of transcripts produced by three RNA polymerases (Pol I-III) and the transcript quantity in a cell at specific development stages or under certain conditions. The whole tran-scriptome contains ribosomal (r)RNA, messenger (m)RNA, small nuclear (sn)RNA, small nucleolar (sno)RNA, transfer (t)RNA, micro (mi)RNA and long non-coding (lnc)RNA, which have different functions. Both rRNA and tRNA produced by Pol I and III are responsible for the protein synthesis. Pol II transcribes the protein coding genes into mRNA and also generates snR-NA, which is required for RNA splicing. The majority of vertebrate snoRNA genes are encoded in the introns of protein coding genes that are involved in ribosome synthesis or translation and can be either transcribed together with these genes by Pol II or from their own promoters by Pol II or III. The miR-NA can affect translation of mRNA to protein and lncRNA are crucial for
22
imprinting events, allowing gene silencing on either paternal or maternal allele.
Various methods have been used to characterize and quantify the trancrip-tome, including hybridization-based microarrays and sequencing-based analysis termed RNA-seq. Both approaches are high throughput and inex-pensive. But RNA-seq has clear advantages over existing approaches includ-ing not relying on existing genome annotation, very low background, large dynamic range of detection (e.g. from 1 to 1 million copies in Paper IV), high reproducibility, and the ability to detect novel transcripts, insertions and deletions, alternative splice variants and differential expression simultane-ously.
Ideally RNA-seq should be able to directly identify and quantify all RNAs, small or large. In general, a population of RNA, poly(A) enriched or rRNA removed, is submitted for library construction, because rRNA is the major part of the total RNA and is not of interest to many studies. In order to be compatible with relative short reads from NGS methods, larger RNA molecules must be fragmented into smaller fragments (200-500 bp) and then converted into a library of cDNA fragments with adaptors attached to the ends. Each molecule is then sequenced by NGS to obtain short reads from one end (single-end sequencing) or both ends (pair-end sequencing). Follow-ing sequencing, all short reads are aligned to a reference genome or tran-scripts, or assembled de novo into a new transcriptome by using RNA-seq aligners, for example, TopHat.
Loss-of-function studies One particularly powerful advantage of RNA-seq is that it can compare tran-scriptomes across different tissues or conditions (e.g. liver vs. muscle, si-lencing vs. non-silencing, case vs. control) directly after normalizing with the total number of reads and the length of the gene model. To study func-tional relevance of the interaction between a transcription factor and DNA sequences, it is important to disrupt the binding of the factor by either re-moving the factors from the cell or mutating the DNA sequences. It is usual-ly very time consuming to get even one mutant DNA sequence, but by using small interference RNAs or viral vector expressing small hairpin RNAs, both of which can target the factor specifically, it is possible to achieve either transient or stable loss-of-function, respectively, for a specific factor at all the binding sites (identified by ChIP-seq analysis previously) at the same time. Subsequently, RNA-seq analysis of silenced cells versus controls can identify the differential expression of all these putative target genes and vali-date the functional relevance of interactions between the factor and DNA sequences. This strategy is used in both Paper II and IV in the thesis.
23
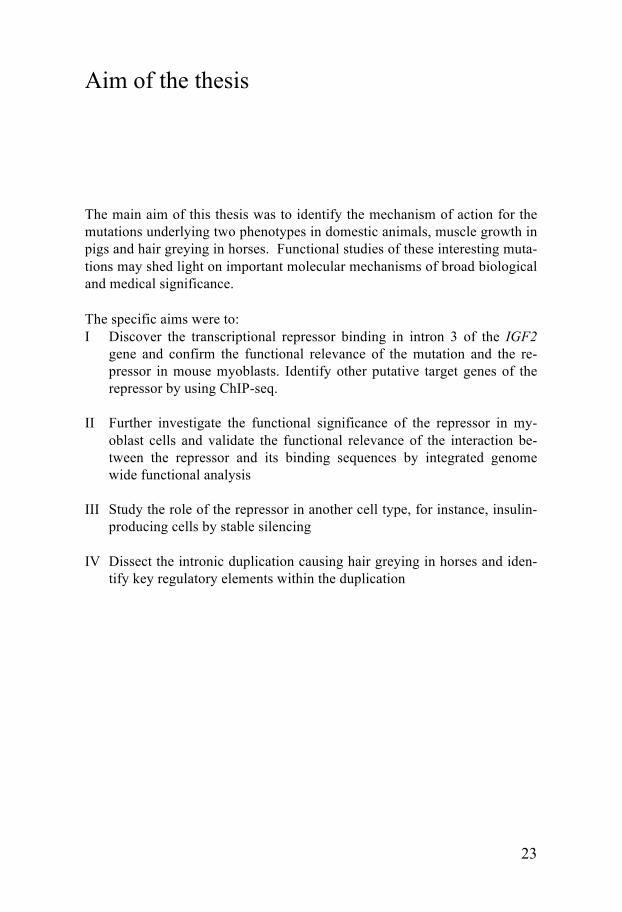
Aim of the thesis
The main aim of this thesis was to identify the mechanism of action for the mutations underlying two phenotypes in domestic animals, muscle growth in pigs and hair greying in horses. Functional studies of these interesting muta-tions may shed light on important molecular mechanisms of broad biological and medical significance. The specific aims were to: I Discover the transcriptional repressor binding in intron 3 of the IGF2
gene and confirm the functional relevance of the mutation and the re-pressor in mouse myoblasts. Identify other putative target genes of the repressor by using ChIP-seq.
II Further investigate the functional significance of the repressor in my-
oblast cells and validate the functional relevance of the interaction be-tween the repressor and its binding sequences by integrated genome wide functional analysis
III Study the role of the repressor in another cell type, for instance, insulin-
producing cells by stable silencing
IV Dissect the intronic duplication causing hair greying in horses and iden-tify key regulatory elements within the duplication
24
Present investigations
Identification of ZBED6, a novel transcription factor in placental mammals (Paper I)
Background A quantitative trait locus (QTL) is a genomic region affecting a quantitative trait or traits that vary in degree and can be controlled by multiple loci (Andersson 2001). Most economically important traits of interest in pigs, such as growth, carcass, fatness and meat quality, have a multifactorial background and are controlled by environmental factors as well as an un-known number of QTLs. A powerful approach for mapping these trait loci is to use intercrosses between divergent populations. Therefore two intercross-es were generated independently between the European wild boar and the domestic Large White and between the Pietrain and Large White pigs for mapping QTLs affecting muscle growth, fat deposition and heart size (Jeon et al. 1999; Nezer et al. 1999). Both revealed a QTL at the distal tip of the short arm of porcine chromosome 2, with a major effect on muscle mass, back-fat thickness and heart size of the pig and the QTL shows clear paternal expression. The QTL was mapped in the near vicinity of the paternally ex-pressed IGF2 gene, which became the main candidate gene. By resequenc-ing of the shared QTL haplotype in different pig breeds, a single nucleotide substitution, a G to A transition in intron 3 of IGF2, was identified as the causative mutation (Van Laere et al. 2003).
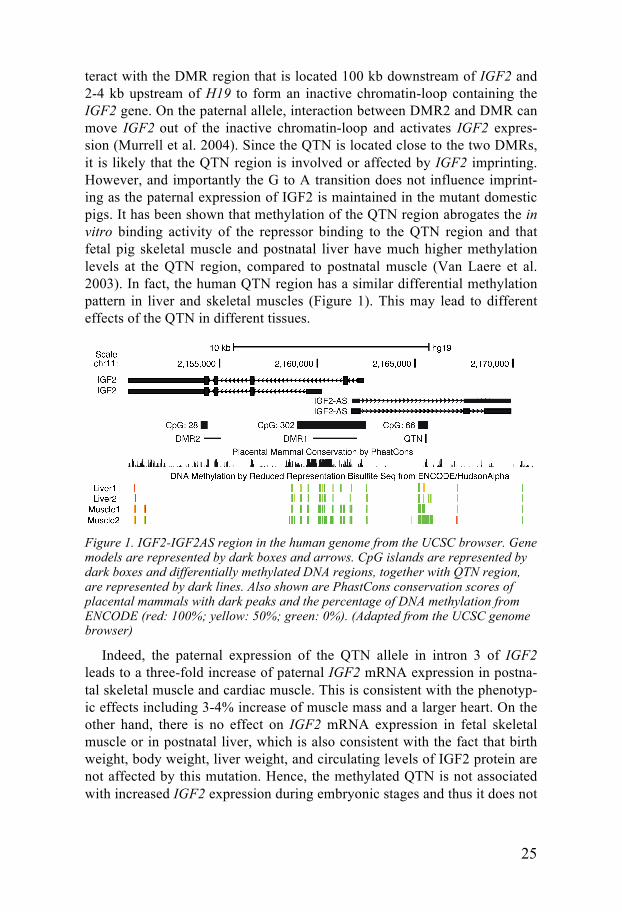
Thus this QTL was transformed to a QTN (quantitative trait nucleotide) for lean growth in pigs. The lean growth (high muscle mass and low fat dep-osition) has been selected intensively in commercial pigs over the past 50 years because the consumers favor lean and tender meat. This QTN is found at high frequency in several breeds under strong selection for lean growth but absent in wild boars, suggesting the mutant allele has experienced a se-lective sweep and has been spread between breeds by cross-breeding. The QTN is located in an evolutionary conserved CpG island, located upstream of two differentially methylated regions DMR1 and DMR2 (Rodriguez et al. 2007)(see Figure 1). The 16 bp DNA sequence flanking the causative muta-tion show 100% identity among all 18 placental mammals for which se-quence data are available (Figure 1). At the maternal allele, DMR1 can in-
25
teract with the DMR region that is located 100 kb downstream of IGF2 and 2-4 kb upstream of H19 to form an inactive chromatin-loop containing the IGF2 gene. On the paternal allele, interaction between DMR2 and DMR can move IGF2 out of the inactive chromatin-loop and activates IGF2 expres-sion (Murrell et al. 2004). Since the QTN is located close to the two DMRs, it is likely that the QTN region is involved or affected by IGF2 imprinting. However, and importantly the G to A transition does not influence imprint-ing as the paternal expression of IGF2 is maintained in the mutant domestic pigs. It has been shown that methylation of the QTN region abrogates the in vitro binding activity of the repressor binding to the QTN region and that fetal pig skeletal muscle and postnatal liver have much higher methylation levels at the QTN region, compared to postnatal muscle (Van Laere et al. 2003). In fact, the human QTN region has a similar differential methylation pattern in liver and skeletal muscles (Figure 1). This may lead to different effects of the QTN in different tissues.
Figure 1. IGF2-IGF2AS region in the human genome from the UCSC browser. Gene models are represented by dark boxes and arrows. CpG islands are represented by dark boxes and differentially methylated DNA regions, together with QTN region, are represented by dark lines. Also shown are PhastCons conservation scores of placental mammals with dark peaks and the percentage of DNA methylation from ENCODE (red: 100%; yellow: 50%; green: 0%). (Adapted from the UCSC genome browser)
Indeed, the paternal expression of the QTN allele in intron 3 of IGF2 leads to a three-fold increase of paternal IGF2 mRNA expression in postna-tal skeletal muscle and cardiac muscle. This is consistent with the phenotyp-ic effects including 3-4% increase of muscle mass and a larger heart. On the other hand, there is no effect on IGF2 mRNA expression in fetal skeletal muscle or in postnatal liver, which is also consistent with the fact that birth weight, body weight, liver weight, and circulating levels of IGF2 protein are not affected by this mutation. Hence, the methylated QTN is not associated with increased IGF2 expression during embryonic stages and thus it does not
26
cause similar organ overgrowth as in mice with IGF2 overexpression (Sun et al. 1997).
The expression level of IGF2 mRNA from promoters P2, P3, and P4 were all affected by the QTN. The P3 promoter, which is the main active promoter in skeletal muscle, has the highest activity of transcription (Van Laere et al. 2003). Interestingly the QTN region also affects the transcription of the IGF2 antisense RNA, which is also paternally expressed (Braunschweig et al. 2004).
Electrophoretic mobility shift assay (EMSA) showed that the mutant QTN allele disrupts the interaction with an unknown nuclear factor and the luciferase reporter assays confirmed that the unknown nuclear factor re-presses the wild-type QTN allele but not the mutant one using a construct containing the endogenous IGF2 P3 promoter (Van Laere et al. 2003). Fur-thermore, a wild-type oligonucleotide methylated at the QTN CpG also dis-rupts the binding of the unknown nuclear factor. The QTN region is not con-served outside of placental mammals indicating that this regulatory element is unique to placental mammals. Furthermore it has been shown that the core binding site of the unknown repressor was defined to 5’-GCTCG-3’ with the QTN in the 3’end (Van Laere 2005). However, bioinformatic analysis did not reveal any known transcription factor-binding site spanning the QTN.
Results and discussion The obvious next step of the work was to identify the unknown repressor binding the QTN site in the third intron of IGF2. However, it turned out to be extremely difficult after we failed to discover it by using several ap-proaches including one-hybrid screening, southwestern screening and bio-chemical purification. Finally this task was accomplished by combining sta-ble isotope labeling by amino acids in cell culture (SILAC) and high-resolution mass spectrometry. SILAC is a straightforward technique for met-abolic incorporation of isotope labeled amino acid into proteins for mass spectrometric quantitative proteomic analysis (Ong et al. 2002). This ap-proach can be used for relative quantification of changes of protein amount between experimental and control samples. Thus in our experimental design, all proteins from mouse C2C12 cells were labeled with SILAC technology to contain either ‘heavy’ or ‘light’ proteins. ‘Heavy’ and ‘light’ nuclear pro-teins were incubated with wild type and mutant oligonucleotides, respective-ly. The two oligonucleotides, 16 bp long, differed by a single nucleotide substitution at the QTN. The two protein populations captured were mixed, size separated, and trypsinized for the analysis by liquid chromatography coupled to mass spectrometry. The ‘heavy’ and ‘light’ peptides were separa-ble in the mass spectra thus the differential enrichment of proteins by the two different oligonucleotides was quantifiable. In this way, we found a protein showing the most significant enrichment with the wild-type oligonucleotide.
27
Analyses in protein databases of the peptides derived from the isolated pro-tein identified it to be encoded from a hitherto undefined coding sequence only reported as an unknown open reading frame in intron 1 of ZC3H11A in the human genome. Recombinant expression of this protein, combined with EMSA confirmed that this protein specifically binds to the wild type se-quence but not the mutant sequence. Thus we proved this protein to be the long sought IGF2 repressor. A subsequent study by Butter et al. (2010) con-firmed the identification of this protein as the repressor of the IGF2 locus also using the SILAC technology.
The single exon, comprising more than 900 codons, encoding this protein is located in the first intron of Zc3h11a, a gene encoding a poorly character-ized zinc-finger CCCH type-containing protein; however, we found that the new protein has no significant sequence similarity to the ZC3H11A protein. This new protein contains two amino-terminal zinc finger BED domains, named from chromatin-boundary-element-binding proteins BEAF and DREF (Aravind 2000). We therefore decided to name the gene ZBED6, since it is the sixth mammalian protein carrying BED domains. In the car-boxyl-terminal, ZBED6 contains a hATC dimerization domain, a feature characteristic of the hobo-Ac-Tam3 transposase superfamily (Calvi et al. 1991), indicating that ZBED6 originated from an hAT DNA transposon. Interestingly, in the initial analysis of the human genome, ZBED6 was one of the 43 genes listed as probably derived from DNA transposons but it re-ceived no attention before our discovery. The primary amino acid sequence of ZBED6, in particular the region comprising the DNA binding BED do-mains (residues 129-183 and 266-318), is highly conserved among 18 out of 18 placental mammals. ZBED6 is unique to placental mammals. It is found at the same genomic position in all placental mammals with available ge-nome sequence data, but not outside the mammals. Only non-functional remnants of ZBED6 were found both in the playtus and the opossum ge-nomes. Thus a possible scenario of evolution is that a DNA transposon inte-grated into the genome of a primitive mammal some 200 million years ago, and evolved an essential function in a common ancestor of all placental mammals after divergence between eutherian mammals and marsupials.
Northern blot analysis showed that ZBED6 is co-expressed with ZC3H11A as a composite transcript and this was further confirmed by long-range RT-PCR analysis. This, together with the Pol II signature at the tran-scription start site, suggested that ZBED6 hitchhikes on the promoter of ZC3H11A. The expression of ZBED6 probably depends on intron retention of the composite transcript. There are two possible translation start sites in ZBED6, which produce two isoforms of ZBED6 (122 and 116 KD). These two isoforms have been confirmed by western blot analysis with a polyclo-nal antibody against the BED-domains in ZBED6 and are denoted as ZBED6a and ZBED6b. In mice, experiments including northern blot, quanti-tative PCR and immunofluorescence analysis showed that ZBED6 is widely
28
expressed in postnatal tissues. ZBED6 expression in muscle appears late in the embryonic stages E18 and is most activated at early postnatal stages P7 according to our northern blot experiment. This in fact fits the pattern of IGF2 expression during muscle development, which is highly expressed before E18, decreased quickly from P4 and ceased at P13 (Soares et al. 1986). Thus at early embryonic stages little expression of ZBED6 and a methylated QTN region ensures activation of IGF2 for fetal growth, while during late embryonic stages or early postnatal stages, both activated ZBED6 expression and an unmethylated QTN region leads to low expression of IGF2 in muscle, but much higher IGF2 expression in liver and circulation system to control postnatal growth.
Immunofluorescence analysis with an anti-ZBED6 antibody in C2C12 myoblast cells showed a nuclear localization of ZBED6 and the co-staining with an antibody for a nucleolus marker nucleophosmin revealed that ZBED6 is more enriched in the nucleolus. The mouse ZBED6 contains one nucleolar localization signal (residues 61-80), which targets ZBED6 protein into the nucleolus. The deletion of the signal peptide compromised the ex-pression of ZBED6 in the nucleolus. This lysine- and arginine-rich signal sequence is positively charged and extremely conserved among 26 placental mammals. This indicates that the nucleolar localization of ZBED6 is essen-tial for its function. The nucleolus is the site for rRNA synthesis, rRNA pro-cessing through small nucleolar ribonucleoproteins (snoRNPs) and ribosome assembly with ribosomal proteins (Boisvert et al. 2007). A number of tran-scriptional regulators including MyoD and Myogenin repress rDNA tran-scription in the nucleolus during myogenesis of C2C12 cells (Ali et al. 2008).
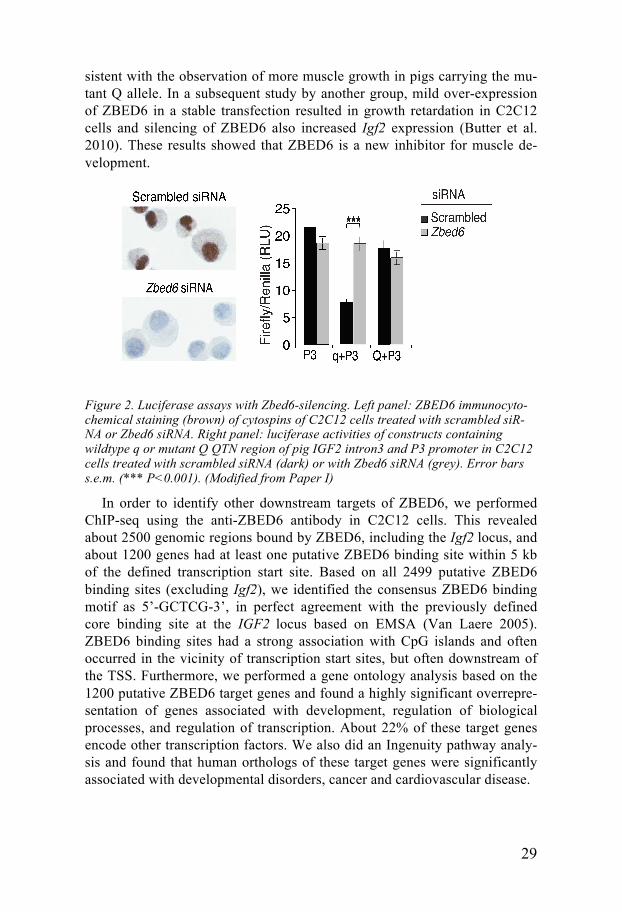
The function of ZBED6 was further investigated by RNAi-mediated si-lencing in mouse C2C12 myoblasts because transient over-expression of ZBED6 had no clear effects. The silencing of ZBED6 expression was effi-cient both at the mRNA and protein level, validated using quantitative PCR, western blot and immunochemistry analysis (for staining see Figure 2 left panel). We combined silencing experiments with a luciferase reporter assay with wildtype and mutant QTN regions and silencing of ZBED6 completely removed the transcriptional repression effects obtained using the wildtype QTN region (Figure 2 right panel). This confirmed that the binding of ZBED6 to the wildtype QTN region derived from the IGF2 intron 3 is able to repress the transcription from the endogenous pig IGF2 P3 promoter. The binding of ZBED6 to the QTN region was also confirmed by Chromatin immunoprecipitation (ChIP) followed by quantitative PCR. Furthermore, Zbed6-silencing significantly increased Igf2 mRNA expression six days post transfection of Zbed6 siRNA and resulted in increased proliferation and fast-er wound healing three days post transfection. This suggests that the latter two effects were caused by ZBED6 affecting downstream targets. Faster myotube formation was also observed after ZBED6 silencing, which is con-
29
sistent with the observation of more muscle growth in pigs carrying the mu-tant Q allele. In a subsequent study by another group, mild over-expression of ZBED6 in a stable transfection resulted in growth retardation in C2C12 cells and silencing of ZBED6 also increased Igf2 expression (Butter et al. 2010). These results showed that ZBED6 is a new inhibitor for muscle de-velopment.
Figure 2. Luciferase assays with Zbed6-silencing. Left panel: ZBED6 immunocyto-chemical staining (brown) of cytospins of C2C12 cells treated with scrambled siR-NA or Zbed6 siRNA. Right panel: luciferase activities of constructs containing wildtype q or mutant Q QTN region of pig IGF2 intron3 and P3 promoter in C2C12 cells treated with scrambled siRNA (dark) or with Zbed6 siRNA (grey). Error bars s.e.m. (*** P<0.001). (Modified from Paper I)
In order to identify other downstream targets of ZBED6, we performed ChIP-seq using the anti-ZBED6 antibody in C2C12 cells. This revealed about 2500 genomic regions bound by ZBED6, including the Igf2 locus, and about 1200 genes had at least one putative ZBED6 binding site within 5 kb of the defined transcription start site. Based on all 2499 putative ZBED6 binding sites (excluding Igf2), we identified the consensus ZBED6 binding motif as 5’-GCTCG-3’, in perfect agreement with the previously defined core binding site at the IGF2 locus based on EMSA (Van Laere 2005). ZBED6 binding sites had a strong association with CpG islands and often occurred in the vicinity of transcription start sites, but often downstream of the TSS. Furthermore, we performed a gene ontology analysis based on the 1200 putative ZBED6 target genes and found a highly significant overrepre-sentation of genes associated with development, regulation of biological processes, and regulation of transcription. About 22% of these target genes encode other transcription factors. We also did an Ingenuity pathway analy-sis and found that human orthologs of these target genes were significantly associated with developmental disorders, cancer and cardiovascular disease.
30
The role of ZBED6 in transcriptional regulation studied by transcriptome analysis after RNAi (Paper II)
Background The aim of this work was to further characterize the functional significance of ZBED6 based on transcriptome analysis of mouse myoblasts after silenc-ing ZBED6. The genome-wide ChIP-seq analysis of ZBED6 binding sites raised more questions concerning the biological function of ZBED6. First, more putative target genes of ZBED6 were enriched in neurogenesis even though the ChIP-seq was performed in muscle cells. A possible explanation is that these target genes associated with neurogenesis were repressed in muscle cells and the repression was probably mediated by ZBED6. Second, ZBED6 has been confirmed to act as a repressor of IGF2 transcription in Paper I, but little is known about the other putative target genes of ZBED6. Is it possible that ZBED6 can also play a role in transcriptional activation? Third, ZBED6 affected myoblast proliferation and differentiation in previous silencing experiments and stable overexpression assays. But the underlying mechanism or pathway leading to changes in myotube formation is still un-clear. Fourth, transcriptional repression in many cases involves histone deacetylation, trimethylation of H3K27 or DNA methylation. However, si-lencing of ZBED6, leading to an increase in IGF2 expression, did not change the level of trimethylation of H3K27 at the QTN site. It is still possible that ZBED6 acts as a transcriptional repressor by interacting with other core-pressor proteins like BAHD1, which in fact binds to the same intronic IGF2 region, recruiting histone deacetylases and H3K27me3 to promote hetero-chromatic gene silencing. Thus it is of considerable interest to find out the mechanism underlying transcriptional repression mediated by ZBED6.
Thus, further characterization of the function of ZBED6 is necessary to understand the above questions. For the first three questions, it is necessary to evaluate or compare the expression of putative target genes of ZBED6, ideally the expression of all myoblast transcripts, before and after silencing of ZBED6 to identify the differentially expressed genes or ZBED6 target genes that are responsible for the phenotype. By defining the proportion of up-regulation or down-regulation among the putative target genes of ZBED6, we can determine whether ZBED6 acts as a repressor or activator. Moreover, we can evaluate whether genes associated with neurogenesis are repressed or not. Thus, we took advantages of the RNA-seq technique, com-bined with RNAi and microarray analysis, to compare the transcriptome across ZBED6-silenced and control myoblast cells. To address the last ques-tion, we performed ChIP-seq analysis with six different histone modifica-tions and compared these modifications across all ZBED6 binding sites.
31
Results and discussion The silencing of ZBED6 in mouse myoblast cells at two different time points, two and four days post-transfection, was verified with quantitative PCR and western blot analysis. The level of silencing was sufficient to change the expression of the ZBED6 downstream target Igf2. We performed whole transcriptome analysis using four mRNA samples representing each siRNA treatment (ZBED6 vs. scrambled) and each time point (two and four days post transfection). We obtained approximately 50 million total reads for each sample from SOLiD sequencing platform and about 50% were uniquely mapped to the mouse genome. By comparing read counts for Zbed6 and Igf2 loci in the ZBED6-silenced samples with control samples, we could verify a 70% decreased expression of Zbed6 mRNA and at least a two-fold increased Igf2 expression at both time points, as a proof of principle. We used the RPKM, short for reads per kilobase of gene model per million mapped reads, to calculate the gene expression (Mortazavi et al. 2008) and detected more than 35.6% of the 37,515 annotated Ensembl genes, with most genes ex-pressed in 1-100 copies per cell and few genes expressed in more than 500 copies per cell. As expected, most of the neurogenesis associated genes were not expressed in the myoblast genome and the silencing of ZBED6 did not change the silent state of these genes. Microarray analysis with total RNA triplicates from each of the four samples were performed and 44.6% of 19100 unique genes were detected as being expressed in the myoblast tran-scriptome, which is about 60% less than the amount of expressed genes iden-tified by RNA-seq.
We identified more than 780 consistent differentially expressed (DE) genes after silencing of ZBED6 by using the criteria of at least 1.5 fold changes, FDR smaller than 0.1% at day 2 and the same trend of changes between day 2 and day 4. Among the 368 genes that were also expressed in the array analysis, the fold changes measured by RNA-seq and arrays were better correlated (r=0.56, P<0.001) compared to that of all genes (N=8.537, r=0.30, P<0.001). About one third of these DE genes showed significant differential expression in array data (P<0.05). qPCR validation further con-firmed the differential expression of 12 DE genes identified by RNA-seq. These results confirm that our RNA-seq experimental design has generated reliable data for inferring differential gene expression between Zbed6-silenced cells versus untreated control cells.
A gene ontology analysis showed that genes associated with muscle pro-tein and contractile fibers were significantly overrepresented, which is con-sistent with our previous observation that Zbed6 silencing increased the my-otube formation in C2C12 cells (Markljung et al. 2009). This category main-ly contained up-regulated genes encoding tropomodulin1, homer homolog1, myozenin 2, tropomyosin 2, skeletal troponins, actinins and actins, myome-sin1, and calsequestrin 1, which together constitute and implement the mus-
32
cle contractile properties necessary for mature muscle fiber function (Charge and Rudnicki 2004).
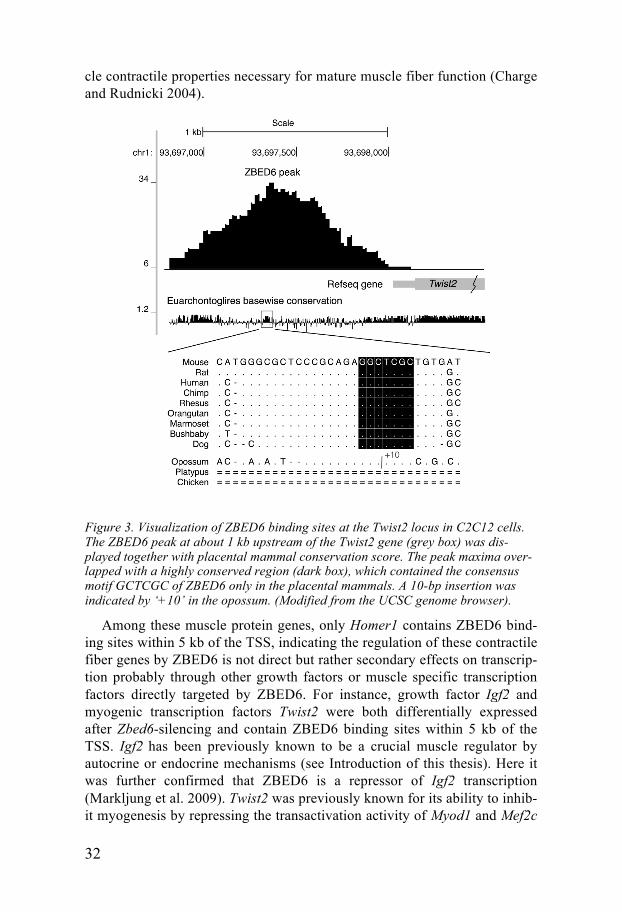
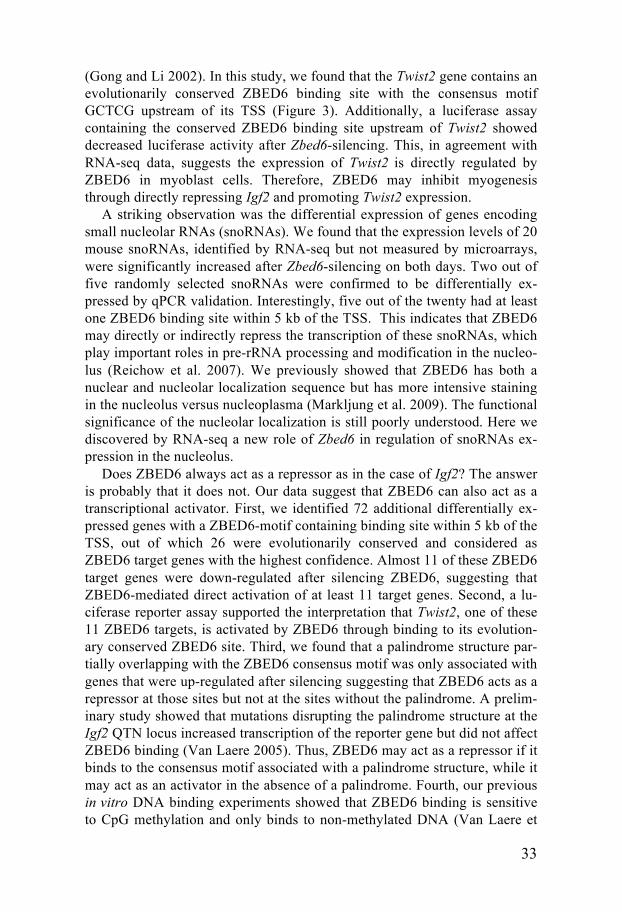
Figure 3. Visualization of ZBED6 binding sites at the Twist2 locus in C2C12 cells. The ZBED6 peak at about 1 kb upstream of the Twist2 gene (grey box) was dis-played together with placental mammal conservation score. The peak maxima over-lapped with a highly conserved region (dark box), which contained the consensus motif GCTCGC of ZBED6 only in the placental mammals. A 10-bp insertion was indicated by ‘+10’ in the opossum. (Modified from the UCSC genome browser).
Among these muscle protein genes, only Homer1 contains ZBED6 bind-ing sites within 5 kb of the TSS, indicating the regulation of these contractile fiber genes by ZBED6 is not direct but rather secondary effects on transcrip-tion probably through other growth factors or muscle specific transcription factors directly targeted by ZBED6. For instance, growth factor Igf2 and myogenic transcription factors Twist2 were both differentially expressed after Zbed6-silencing and contain ZBED6 binding sites within 5 kb of the TSS. Igf2 has been previously known to be a crucial muscle regulator by autocrine or endocrine mechanisms (see Introduction of this thesis). Here it was further confirmed that ZBED6 is a repressor of Igf2 transcription (Markljung et al. 2009). Twist2 was previously known for its ability to inhib-it myogenesis by repressing the transactivation activity of Myod1 and Mef2c
33
(Gong and Li 2002). In this study, we found that the Twist2 gene contains an evolutionarily conserved ZBED6 binding site with the consensus motif GCTCG upstream of its TSS (Figure 3). Additionally, a luciferase assay containing the conserved ZBED6 binding site upstream of Twist2 showed decreased luciferase activity after Zbed6-silencing. This, in agreement with RNA-seq data, suggests the expression of Twist2 is directly regulated by ZBED6 in myoblast cells. Therefore, ZBED6 may inhibit myogenesis through directly repressing Igf2 and promoting Twist2 expression.
A striking observation was the differential expression of genes encoding small nucleolar RNAs (snoRNAs). We found that the expression levels of 20 mouse snoRNAs, identified by RNA-seq but not measured by microarrays, were significantly increased after Zbed6-silencing on both days. Two out of five randomly selected snoRNAs were confirmed to be differentially ex-pressed by qPCR validation. Interestingly, five out of the twenty had at least one ZBED6 binding site within 5 kb of the TSS. This indicates that ZBED6 may directly or indirectly repress the transcription of these snoRNAs, which play important roles in pre-rRNA processing and modification in the nucleo-lus (Reichow et al. 2007). We previously showed that ZBED6 has both a nuclear and nucleolar localization sequence but has more intensive staining in the nucleolus versus nucleoplasma (Markljung et al. 2009). The functional significance of the nucleolar localization is still poorly understood. Here we discovered by RNA-seq a new role of Zbed6 in regulation of snoRNAs ex-pression in the nucleolus.
Does ZBED6 always act as a repressor as in the case of Igf2? The answer is probably that it does not. Our data suggest that ZBED6 can also act as a transcriptional activator. First, we identified 72 additional differentially ex-pressed genes with a ZBED6-motif containing binding site within 5 kb of the TSS, out of which 26 were evolutionarily conserved and considered as ZBED6 target genes with the highest confidence. Almost 11 of these ZBED6 target genes were down-regulated after silencing ZBED6, suggesting that ZBED6-mediated direct activation of at least 11 target genes. Second, a lu-ciferase reporter assay supported the interpretation that Twist2, one of these 11 ZBED6 targets, is activated by ZBED6 through binding to its evolution-ary conserved ZBED6 site. Third, we found that a palindrome structure par-tially overlapping with the ZBED6 consensus motif was only associated with genes that were up-regulated after silencing suggesting that ZBED6 acts as a repressor at those sites but not at the sites without the palindrome. A prelim-inary study showed that mutations disrupting the palindrome structure at the Igf2 QTN locus increased transcription of the reporter gene but did not affect ZBED6 binding (Van Laere 2005). Thus, ZBED6 may act as a repressor if it binds to the consensus motif associated with a palindrome structure, while it may act as an activator in the absence of a palindrome. Fourth, our previous in vitro DNA binding experiments showed that ZBED6 binding is sensitive to CpG methylation and only binds to non-methylated DNA (Van Laere et
34
al. 2003). The resulting chromatin structure obtained from CpG methylation and histone modifications, the presence or absence of the palindromic se-quence and the functional interactions with other transcription factors that need to be present together with ZBED6 may determine whether ZBED6 acts as a transcriptional repressor or activator.
Our ChIP-seq data before and after ZBED6 silencing reveal an emerging picture that ZBED6 tends to bind active promoters where it acts as a modula-tor of transcription rather than as a classical repressor or activator that acts via recruiting histone modifications. First, we found that ZBED6 sites are associated with high levels of H3K4me3, H3K4me2 and H3K27ac modifica-tions, which are usually found at active promoters (Santos-Rosa et al. 2002; Barski et al. 2007; Wang et al. 2008). There was no enrichment of the re-pressive histone mark H3K27me3 at ZBED6 sites, which is consistent with our previous finding that ChIP-PCR did not reveal any change in the level of H3K27me3 modification at the Igf2 locus after Zbed6-silencing. Interesting-ly, a similar and somewhat surprising association with active chromatin was recently detected for the SMRT corepressor (Raghav et al. 2012). Further-more, we showed that BAHD1, a silencing factor that promotes heterochro-matic gene silencing and in fact interacts with the same intronic region in Igf2 as ZBED6 (Bierne et al. 2009), did not influence ZBED6-mediated re-pression. Thus, ZBED6-mediated repression does not act by direct recruit-ment of H3K27me3 modifications or by recruiting H3K27me3-associated silencing factors such as BAHD1. This interpretation is fully consistent with the established role for ZBED6 in regulating IGF2 expression in pig skeletal muscle. IGF2 is expressed in wild-type pigs, which means that the promoter must be active, but IGF2 is three-fold upregulated in mutant pigs, in which the ZBED6 binding site in IGF2 intron 3 has been disrupted (Van Laere et al. 2003).
Stable silencing of ZBED6 affects the function of insulin producing ß cells (Paper III)
Background As described above, ZBED6 binds to intron 3 of the IGF2 gene and acts as an IGF2 repressor at this site in muscle cells (Markljung et al. 2009). Recent-ly, a bioinformatic analysis predicted the tissue specific cis-regulatory mod-ules in 57 human tissues and cell types (Girgis and Ovcharenko 2012). It found that genes with pairwise ZBED6-MESIS homeobox protein binding sites were highly enriched among those specifically expressed in human pancreatic islets. This suggests that ZBED6 has an important role in regulat-ing islet-specific genes. Northern blot and real-time PCR analysis revealed
35
that ZBED6 has a broad tissue distribution in mouse (Paper I), indicating that ZBED6 may also suppress IGF2 expression in other cells such as pan-creatic islet cells. It was previously reported that defective IGF2 production in embryonic pancreas preceded the subsequent beta-cell mass anomaly that develops in diabetic rat (Calderari et al. 2007).
The human insulin (INS) gene and its ortholog in mouse Ins2 are closely linked with the IGF2/Igf2 gene (Leighton et al. 1995). The IGF2 gene com-prises multiple transcripts originating from different promoters, including INSIGF read-through transcripts from the INS promoter (Monk et al. 2006). The human INSIGF transcript expression is limited to pancreas and not im-printed as IGF2 in pancreas. Interestingly, the putative mouse Insigf trancripts resulted in a protein similar to the human INSIGF. Thus it is pos-sible that the insulin gene is controlled by the same ZBED6 binding site in IGF2.
Furthermore, ChIP-seq data in myoblast cells revealed about 1200 genes including Igf2 that contained one or several putative ZBED6 binding sites within 5 kb of the defined TSS. Among the 1200 putative ZBED6 target genes were several genes encoding master transcription factors in the beta cells, such as Pdx1, Mafa, Neurog3, Neurod2 and Nkx6-1. They are crucial to the maturation of beta cells and affect insulin production. These are possi-ble downstream targets of ZBED6 implying that ZBED6 may have a signifi-cant role in regulating beta islet cell function.
Thus, ZBED6 may play a role in the function of pancreatic beta cells, and as a consequence, even to the pathogenesis of various types of Diabetes Mellitus. Therefore, it is worthy to investigate the role of ZBED6 further in cells and to evaluate the effects of ZBED6 silencing on basal functions such as morphology, differential gene expression, insulin content and release.
Results and discussion We generated stable beta cell lines with stable silencing of ZBED6 expres-sion using lentiviral vectors expressing a specific short hairpin RNA target-ing either Zbed6 mRNA or scrambled sequences. The beta cell line we used here is MIN6, a mouse insulinoma beta cell line, with high insulin expres-sion. Both qPCR and western blotting showed more than 50-60% reduction of Zbed6 expression at the mRNA and protein level in silenced cells. As expected, ZBED6 has strong nuclear and weak cytoplasmic staining and silencing dramatically reduced ZBED6 staining in the nuclei, according to immunofluorescence analysis. Interestingly, morphological changes were observed four days after seeding the same amount of cells and maintaining the cells at identical conditions. MIN6 cells with ZBED6 stable silencing formed islet-like clusters, with more aggregated in the centre of the islet-like structure and more pointed protrusions in the edge, compared to the non-silenced cells.
36
We extracted and submitted six mRNA samples representing ZBED6-silenced and non-silenced triplicates to the Illumina HiSeq2000 platform for whole transcriptome analysis. About 29-97 million 100-bp pair-end reads per sample were obtained and 78%-88% of these reads were uniquely mapped to the mouse genome by using Bowtie2 and TopHat software. RPKM values were calculated for all the RefSeq genes in each sample by using Cufflinks. All six samples showed a similar overall distribution of gene expression and the majority of genes were expressed at the range of 1-100 RPKM, which is comparable to the myoblast transcriptome. About 50% out of 24468 RefSeq genes were expressed by at least one copy and the highest expressed genes were four important secreted factors, insulin, islet amyloid polypeptide, Igf2, and secretogranin 2, in beta cells. All four had near or above 10000 RPKMs and about 6.8% of the reads were mapped to the four genes and this is quite different with the myoblast transcriptome, in which we did not detect any gene with higher than 10,000 RPKMs.
The test results including Log2 fold changes and FDR adjusted P-values were achieved from Cufflinks for changes of gene expression between the two treatments. We thereby found 728 genes with differential expression after Zbed6-silencing in MIN6 cells. All these genes were submitted for Gene Ontology analysis, resulting in several categories with significant en-richment including neuronal differentiation and projection, cell projection, regulation of neuron differentiation, generation of precursor metabolites, axon guidance, MAPK signaling and cell adhesion. We randomly selected 18 out of 70 genes associated with neuronal differentiation and cell adhesion for qPCR validation. 17 out of 18 genes showed the same direction of ex-pression changes in both RNA-seq and qPCR analysis and 9 of 18 genes had statistical significance also in qPCR analysis.
We also performed ChIP-seq analysis with ZBED6 antibody in MIN6 cells to identify the islet cell-specific binding sites. In total about 4000 peaks were found with a score of at least 30 and in agreement with our myoblast ChIP-seq data, the majority of peaks were close to the TSS. Motif analysis using ChIP-MEME on the highest peaks yielded a motif, which was found in almost all sequences, with a core GCTCG sequence consistent with the pre-viously established consensus motif for ZBED6 in myoblasts. When peaks without a match to GCTCG were analyzed, a longer motif containing two GCTC sequences was found to be overrepresented. These ChIP-seq derived 4000 binding sites of ZBED6 were overlapped with the 728 DE genes identi-fied by RNA-seq. As many as 293 (40.2%) of genes with differential expres-sion also had at least one ZBED6 site within 5 kb up- or downstream of the TSS, compared with only 26.9% of non-DE genes. The overrepresentation of ZBED6 binding sites among DE genes is statistically significant (P=3.8e-14, two sided Fisher’s exact test). Again, a new GO analysis was performed with 293 potential targets of ZBED6 and the significant enriched categories were regulation of neuronal differentiation/neurogenesis/nervous system devel-
37
opment and positive regulation of cell projection organization. This is con-sistent with significantly enriched GO categories among all 728 DE genes. Among the eleven genes associated with regulation of neuronal differentia-tion, nine genes including Isl1, Nkx6-1, Cdh4, Id4, Mapt, Nefl, Nelm, Rtn4 and Robo2 were up-regulated after stable Zbed6-silencing. The genes associ-ated with positive regulation of cell projection were all up-regulated, includ-ing Cdh4, Mtor, Mapt, Nefl, and Tgfbr1. These data suggest that ZBED6 acts as a repressor for these genes that regulate neuronal differentiation and cell projection and as a consequence, affects the morphology of MIN6 cells.
ChIP-seq in MIN6 cells found that three transcription factors, Mafa, Pdx1, and Nkx6-1, crucial for pancreatic beta cell maturation, each contained at least one ZBED6 binding site. Interestingly, RNA-seq analysis and qPCR validation showed significant up-regulation of all three genes after Zbed6- silencing. Immunostaining confirmed an increase of PDX1 protein in the nuclei. In fact, a similar gene expression pattern was observed in another beta cell line (Wang et al, in preparation). The up-regulation of these tran-scription factors is compatible with a more mature beta cell phenotype with higher insulin production. Indeed, we observed 1.3-fold increase of insulin content and significant increase of insulin release at low glucose level in ZBED6-silenced cells. These results supported our hypothesis that ZBED6 has an important role in regulating beta-cell maturation and insulin content by repressing three master regulators of beta-cell differentiation.
A melanocyte-specific regulatory element in the duplication causing greying and melanoma in horses (Paper IV)
Background Greying with age in horses is an autosomal dominant trait, associated with gradual loss of hair pigmentation, high incidence of melanoma and vitiligo-like depigmentation. Rosengren Pielberg et al. (2008) identified that the causative mutation for greying with age constitutes a 4.6 kb intronic duplica-tion in STX17. Interestingly, STX17 and its neighboring gene NR4A3 are clustered in all sequenced vertebrate genomes and are part of a genomic regulatory block (Kikuta et al. 2007). Within the block of conserved synteny, there are multiple conserved non-coding elements, including those in introns of STX17 as seen in the Ancora genome browser (Engstrom et al. 2008). The Grey mutation is a cis-regulatory mutation with long-range effects and ex-pression of both STX17 and NR4A3 is upregulated in horses containing the mutation. Indeed, NR4A3 and STX17 expression was from only the Grey
38
allele, revealed by sequence analysis with cDNA from two heterozygous Grey horses. Furthermore, a recent study by Sundstrom et al. (2012) showed that there is a copy number expansion of the duplicated sequence in mela-noma tissues compared to healthy tissues from the same individual. This implies that copy number expansion of the duplication affects melanoma progression. However, the molecular mechanism behind the cis-regulatory activity remains unknown.
Results and discussion In this study, the aim is to further dissect the intronic duplicated sequence causing hair greying and melanoma in horses to better understand the action of the cis-regulatory mutation behind the phenotype. Subsequently these potential regulatory regions in the duplication were tested for their regulato-ry activity with luciferase reporter assays and further combined with mutant analysis and ChIP analysis with one of these regions.
The transgenic zebrafish with the Grey duplication showed strong neural crest-specific expression of GFP reporter at 2 dpf (days post-fertilization) and melanophore-specific expression at 3 dpf. This is in agreement with the expression pattern in MITF-expressing cells that become melanoblasts (Lister et al. 1999). When MITF was knocked down in the transgenic zebrafish, GFP expression was inhibited completely, showing that MITF is necessary for transcriptional activation mediated by the duplication region. Injection of an expression vector containing MITF gene to the transgenic zebrafish reproduced the GFP expression. Thus we concluded that MITF expression is both necessary and sufficient for the transcriptional activation due to the duplicated sequence.
The human genomic region corresponding to the STX17 4.6 kb duplicated region was identified by a BLAST search against the human genome in the UCSC genome browser. From the track regPotential7X, only available in genome version hg18, seven well-defined potential regulatory regions (Reg1-7) were extracted within the duplicated region. All seven regions were found in the horse genome, and all were tested for their regulatory activity by luciferase reporter assays in both murine melanocytes and murine my-oblasts. Among seven elements, only one region, Reg3, had a strong mela-nocyte specific regulatory activity, including an 8-fold increase in melano-cytes versus 2-fold in myoblasts. When the element was duplicated to mimic the Grey mutation, the activation was doubled in melanocytes but no further activation in myoblasts was noted.
Bioinformatic analyses of the equine sequence at Reg3 for previously identified transcription factor binding sites revealed three interesting regula-tory regions. One was a near-consensus nerve growth factor IB (NGFI-B)-response element (NBRE), AAAGCTCA and NR4A3 has been shown to bind to this site (Paulsen et al., 1995). Our ChIP-PCR with the primers spe-
39
cific for the identified NBRE site showed reasonable enrichment compared to negative control regions (unpublished data). When removing the NBRE from the evolutionarily conserved Reg3, the activity was dramatically ele-vated, from 8-fold to more than 20-fold in melanocytes only. This indicates that this site binds a repressor present in melanocytes but not in myoblasts or that the mutant creates a binding site for an activator. To test the hypothesis, seven point mutations were generated at the NBRE site and no elevated lu-ciferase activity was observed in melanocytes, suggesting the elevated ex-pression after deletion is probably due to creation of new binding sites for an activator.
The other two sequences detected within the Reg3 region are potential MITF binding sites separated by 83 bp, containing the perfect core consen-sus motif CATGTG. Deleting the MITF binding sites resulted in a reduced activation, for site 1 from 8- to 2-fold, similar with the activity in the my-oblasts, and for site 2 the reduction in activity was from 8- to 5-fold. This suggests that both sites are of importance for the melanocyte-specific tran-scriptional regulation. The results are also in perfect agreement with the re-sults observed in the transgenic zebrafish.
40
Future prospects
Paper I to Paper III of this thesis present the progress from discovery of ZBED6 as a novel transcription factor that binds the QTN in pigs, to func-tional characterization of downstream targets and pathways in two distinct cell types. However, this is just the beginning of the functional characteriza-tion of ZBED6. The more we learn about ZBED6, the more it stands out as a unique placental mammalian regulator and appears to play a critical role in this lineage.
Overexpression of ZBED6 is important to find out whether ZBED6 is suf-ficient to inhibit myoblast differentiation. Silencing of ZBED6 in a mouse myoblast cell line has shown that ZBED6 is necessary for the inhibition of IGF2 expression and that of myoblast differentiation. Although mild ZBED6 overexpression in the same cell line suppressed IGF2 expression and cell proliferation (Butter et al. 2010), little is known about the effects of ZBED6 overexpression on myoblast differentiation. Since the transient transfection of ZBED6-overexpressing vector cannot sustain the overexpression longer than two to three days, a stable expression system is necessary to study the effects on the myoblast differentiation. However, stable overexpression of ZBED6 in a vector was not successful, probably indicating that high cellular levels of ZBED6 are not tolerated. A bacterial artificial chromosome (BAC)-based TransgeneOmics approach (Poser et al. 2008) is currently used to gen-erate myoblast cell lines with a stably integrated additional ZBED6 gene, together with its endogenous promoter and cis-regulatory elements. Confir-mation of the stable overexpression and testing the effects on migration, fusion, and myotube formation in the generated myoblast cells is already underway. Preliminary immunostaining data showed disrupted myoblast differentiation in ZBED6-overexpressed myoblast cells, compared to control cells. Further investigation is required to confirm the observation and wheth-er similar muscle protein genes or pathways that were identified in Paper II are involved in the cellular changes mediated by ZBED6-overexpression.
Identification of ZBED6 interacting proteins is a useful way to understand how ZBED6 acts as a transcriptional repressor or activator. Most repressors and activators cannot regulate transcription without recruiting other factors such as histone acetyl transferases or deacetylases, corepressors or coactiva-tors. Thus by identifiying its interacting partners, it is possible to reveal how ZBED6 acts as transcriptional regulator. From previous SILAC mass spec-trometry assay we have indications of two non-DNA binding proteins that
41
interact with ZBED6, as these proteins were also enriched using the wild-type oligonucleotide (unpublished). Co-staining of ZBED6 with nucleo-phosmin protein suggested possible interaction between the two. The inter-action may be related to the transcriptional repression mediated by ZBED6, but the functional relevance needs further evaluation. For instance, we have generated cell lines expressing episomal vectors containing either the wildtype or mutant QTN region and co-stained the episomal vector and nu-cleolus with fluorescence in situ hybridization (FISH) and immunofluores-cence. By comparing the different co-localization with the nucleolus be-tween wildtype and mutant constructs, we can investigate whether the inter-action between ZBED6 and the nucleolus is associated with transcriptional repression.
A two-step affinity purification of the tagged ZBED6 complex has been established in mouse myoblasts with BAC overexpression of ZBED6. The BAC TransgeneOmics system we generated for overexpressing ZBED6 also contains tandem affinity purification tags such as GFP and protein S, which can be used for two-step purification of ZBED6 complex. Silverstaining plus mass spectrometry of the affinity-purified proteins are used to identify the interacting partners of ZBED6. In addition, a yeast two-hybrid (Y2H) system using the human ZBED6 full-length protein as a bait is underway to screen a human normalized cDNA library for identification of the interacting partners of ZBED6. This is a good complement to the BAC system. First, the two systems can confirm the interactions identified from each other. Second, the BAC system is built on mouse proteomics and Y2H is based on expressing human proteins in yeast. It is possible to identify the common and specific interactions in the two species. Third, with Y2H it is easy to perform com-prehensive mutant analysis to dissect the key sites for a specific interaction. For instance, the dimerization domain in ZBED6 derived from its ancestral hATC DNA transposon may be important for ZBED6 to form dimers or multimers. Thus, it is interesting to either mutate the key amino acids based on the phylogenetic analysis or delete the complete domain in the Y2H sys-tem and evaluate the consequences on the interaction. These experiments are all ongoing and co-immunoprecipitation (Co-IP) will be applied to confirm positive outcomes.
The production of Zbed6 conditional knockout mice is obviously a critical resource to confirm the previous phenotypic traits in porcine skeletal muscle and murine myoblast cells and to investigate the role of ZBED6 in other tissues. It is possible that complete loss-of-function mutations for ZBED6 will be lethal. This is suggested by the high sequence conservation among placental mammals, the important biological functions of the many putative downstream targets of ZBED6, and the marked phenotypic effects observed in pigs lacking only one of the ZBED6 binding sites. Therefore, a condition-al knockout, where ZBED6 could be removed from any specific tissue, is the approach we are following. The construction work has been completed and
42
at present we already have founder mice with the two-loxP sites inserted flanking the Zbed6 gene. We plan to breed the mice first with cre-line mice to remove the Zbed6 gene in all tissues. Both heterozygous and homozygous knockout mice will be carefully characterized regarding phenotypic effects, haplo-insufficiency and changes in transcriptional regulation. If it turns out to be lethal, other tissue-specific cre line mice will be used to generate, for instance, muscle-specific or pancreatic beta cell-specific ZBED6 knockout mice. Subsequently, tissue-specific function will be examined, including muscle development, insulin production and islet cell maturation.
ZBED6 may regulate thousands of genes as indicated by the ChIP-seq analysis in myoblasts, in particular since transcription factors are highly enriched among putative ZBED6 targets. GO analyses with human orthologs showed that these genes are significantly associated with human diseases such as developmental disorders, cancer and cardiovascular diseases. Thus, mutations disrupting ZBED6 binding sites may lead to altered expression of target genes and cause dysfunction in vivo. A comparison between the ZBED6 binding sites established using mouse C2C12 cells and homologous sites in the human genome indicated that about 10% of these are conserved in the human genome. This suggested that there are differences in ZBED6 binding between human and mouse. Therefore, we need to perform ChIP-seq analysis in human cell lines or muscle tissues to identify the common targets in the two species and the specific targets of ZBED6 in human. This will allow us to better define the ZBED6 sites in human or in different tissues, which can be re-sequenced in, for instance, diabetes and healthy controls by using targeted NGS technique to identify the rare causative mutations. The identified mutations can be further confirmed in larger datasets with case and controls. These experiments are also underway and hopefully in the near future, we can identify the first causative mutation of the ZBED6 binding site in human diseases.
For Paper IV, we have conducted the functional dissection of the dupli-cated region affecting the Grey phenotype in horses. However, the mecha-nism by which the duplication causes hair greying and melanoma has not been entirely solved. Thus further elucidation of the mechanism is needed. First, the up-regulation of STX17 and NR4A3 both appear to be associated with the phenotype as well. Two melanoma cell lines have been established from Grey horses. Thus an obvious next step is to knock down the expres-sion of the two genes in these cell lines to evaluate the effects including cell proliferation, downstream signaling pathways, melanin production and mel-anoma formation. This can demonstrate whether the expression of both STX17 and NR4A3 is necessary to activate the melanoma. Second, overex-pression of the two genes in melanocytes can confirm whether both candi-date genes are sufficient to activate melanoma formation. At present we have generated the stable overexpression of either the STX17 or NR4A3 gene in human melanocytes. The preliminary data showed the overexpression of the

43
NR4A3 gene activates a crucial signaling pathway in human melanoma de-velopment and increases melanin production. Whether NR4A3 overexpres-sion can induce melanoma formation will be further tested with these cell lines in soft agar plates. Third, development of a ‘Grey’ mouse by knocking in the duplicated region is underway to mimic the Grey phenotype in horses. Further characterization of the Grey mice may help us to understand the mechanism of how the mutation caused the depigmentation and melanoma in a mouse model.
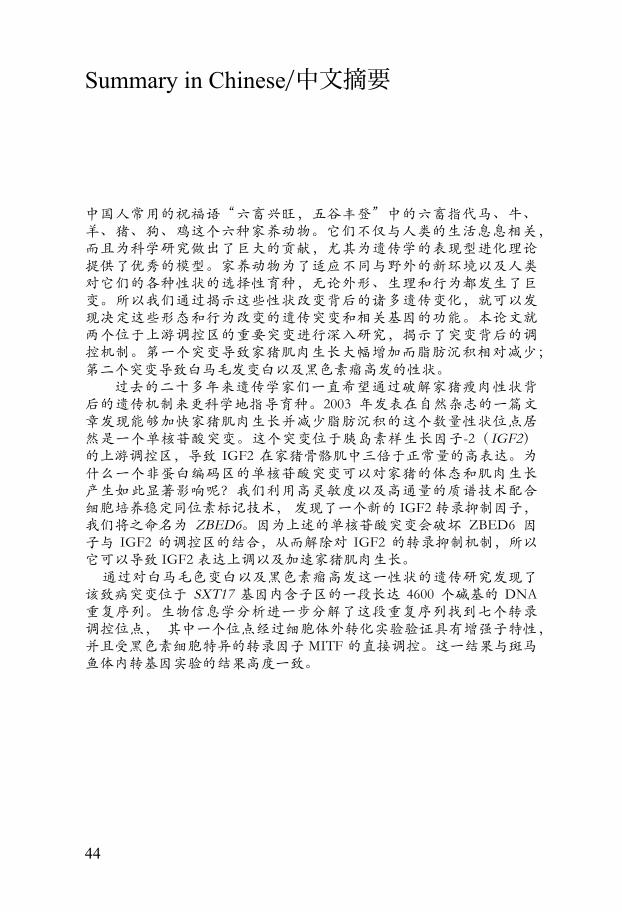
44
Summary in Chinese/中文摘要
中国人常用的祝福语“六畜兴旺,五谷丰登”中的六畜指代马、牛、羊、猪、狗、鸡这个六种家养动物。它们不仅与人类的生活息息相关,而且为科学研究做出了巨大的贡献,尤其为遗传学的表现型进化理论提供了优秀的模型。家养动物为了适应不同与野外的新环境以及人类对它们的各种性状的选择性育种,无论外形、生理和行为都发生了巨变。所以我们通过揭示这些性状改变背后的诸多遗传变化,就可以发现决定这些形态和行为改变的遗传突变和相关基因的功能。本论文就两个位于上游调控区的重要突变进行深入研究,揭示了突变背后的调控机制。第一个突变导致家猪肌肉生长大幅增加而脂肪沉积相对减少;第二个突变导致白马毛发变白以及黑色素瘤高发的性状。 过去的二十多年来遗传学家们一直希望通过破解家猪瘦肉性状背后的遗传机制来更科学地指导育种。2003 年发表在自然杂志的一篇文章发现能够加快家猪肌肉生长并减少脂肪沉积的这个数量性状位点居然是一个单核苷酸突变。这个突变位于胰岛素样生长因子-2(IGF2)的上游调控区,导致 IGF2 在家猪骨骼肌中三倍于正常量的高表达。为什么一个非蛋白编码区的单核苷酸突变可以对家猪的体态和肌肉生长产生如此显著影响呢?我们利用高灵敏度以及高通量的质谱技术配合细胞培养稳定同位素标记技术, 发现了一个新的 IGF2 转录抑制因子,我们将之命名为 ZBED6。因为上述的单核苷酸突变会破坏 ZBED6 因子与 IGF2 的调控区的结合,从而解除对 IGF2 的转录抑制机制,所以它可以导致 IGF2 表达上调以及加速家猪肌肉生长。 通过对白马毛色变白以及黑色素瘤高发这一性状的遗传研究发现了
该致病突变位于 SXT17 基因内含子区的一段长达 4600 个碱基的 DNA重复序列。生物信息学分析进一步分解了这段重复序列找到七个转录调控位点, 其中一个位点经过细胞体外转化实验验证具有增强子特性,并且受黑色素细胞特异的转录因子 MITF 的直接调控。这一结果与斑马鱼体内转基因实验的结果高度一致。

45
Acknowledgment
During the five years of my PhD studies, many people have been there for me and without them my life in Sweden will be significantly different. I would like to take this opportunity to thank all of them.
First of all, I want to express my very sincere appreciation to my main su-pervisor, Leif Andersson. Your expertise and optimism have created such an inspiring research environment and make you one of the best supervisors I have ever had. Thank you for giving me this great opportunity of being your student, for trusting me and for your support. I would also like to thank my co-supervisor, Kerstin Lindblad-Toh, for the helps of all sorts, useful tips with bioinfomatic analysis, insightful comments on drafts, and interesting talks. Great thanks to my co-supervisor, Gerli Pielberg, for being my first teacher in the lab, helping me familiar with the lab and introducing me to the functional studies of the Grey project. I will remember those days when I was your 'little tail' in the lab.
Second of all, I want to thank all former and present members in ZBED6 project chronologically. Göran Andersson, you have been a great support on this project, writing the papers and revising this thesis. Göran Hjälm, you have been guiding me to the protein world. Ellen Markljung, my predecessor on this project, you have introduced me to EMSA and luciferase asssays. Anders Lindroth, thanks for your expertise and knowledge in epigenetics. Elizabeth Gilbert, special thanks for revising my paper and for proofreading of this thesis. Ola Wallerman, thank you for teaching me the ChIP-seq tech-nique and inspiring discussions about research. Great thanks to all other people that has contributed to the project, Carl-John Rubin, Shady, Ghazal, Mi Zhou, Axel Klaesson, Elisabeth Sundström, Rajesh Gupta. I would also like to offer my deep thanks to the Broad group, Uppsala Protein Atlas group, Nils Welsh’s group at CMB for the great collaborations on this pro-ject.
My special thanks to the committee members, prof. Hans Ronne, prof. Gunnar Westin, associate prof. Lena Åslund for inspiring comments about my project during my half-time seminar and for being my evaluation com-mittee for my disertation.
So many people in the lab have made my time much more enjoyable. Ulla, without you, our lab cannot be such an organized and convenient place to work with. You are always a great support for the lab. Freyja, my fantastic roommate and my great friend, the time we spent together during these

46
years, good food you served, and discussions on horses, food and life will remain very pleasant memories. Hilarious conversations with Abhi are often fantastic breaks during a busy lab day or teaching day. Doreen, I will re-member the interesting Skansen trip and canoeing we had together. Thanks also go to my office-mates, Anja, Jennifer, Jeanette, Elisabeth and Mia for all the lovely talks and jokes cheering me up. I would like to extent my deep thanks to all the past and present colleagues in the lab for creating such a great working environment and all the IMBIM staff for all the helps.
There are many Chinese friends that have made my life in Sweden much more convenient and entertaining. I want to thank my card game friends and badminton friends for all wonderful weekends. A big thank-you goes to the people from IMBIM lunchroom for all the interesting talks. Special thanks go to all my teachers and classmates from master program in molecular bio-technology and bioinformatics in the year of 2005 for all the helps.
Finally, I want to thank my family who has always been there for me with all their support and love no matter what happens. 非常感谢爸爸妈妈对我的养育之恩,也非常感谢公公婆婆姐姐姐夫对小艾的无微不至的照顾,使我没有后顾之忧,可以专注于博士论文的研究,谢谢你们一直以来对我关爱和支持!To Terry, thank you for all your trusts and unlimited support. Without you I wouldn’t have approached so far. To Iris, thank you for your lovely accompany.
47
References
Ali SA, Zaidi SK, Dacwag CS, Salma N, Young DW, Shakoori AR, Montecino MA, Lian JB, van Wijnen AJ, Imbalzano AN et al. 2008. Phenotypic transcription factors epigenetically mediate cell growth control. Proc Natl Acad Sci U S A 105(18): 6632-6637.
Andersson L. 2001. Genetic dissection of phenotypic diversity in farm animals. Nat Rev Genet 2(2): 130-138.
Aravind L. 2000. The BED finger, a novel DNA-binding domain in chromatin-boundary-element-binding proteins and transposases. Trends Biochem Sci 25(9): 421-423.
Barski A, Cuddapah S, Cui K, Roh TY, Schones DE, Wang Z, Wei G, Chepelev I, Zhao K. 2007. High-resolution profiling of histone methylations in the human genome. Cell 129: 823-837.
Bierne H, Tham TN, Batsche E, Dumay A, Leguillou M, Kerneis-Golsteyn S, Regnault B, Seeler JS, Muchardt C, Feunteun J et al. 2009. Human BAHD1 promotes heterochromatic gene silencing. Proc Natl Acad Sci U S A 106: 13826-13831.
Boisvert FM, van Koningsbruggen S, Navascues J, Lamond AI. 2007. The multifunctional nucleolus. Nat Rev Mol Cell Biol 8(7): 574-585.
Bondy CA, Werner H, Roberts CT, Jr., LeRoith D. 1990. Cellular pattern of insulin-like growth factor-I (IGF-I) and type I IGF receptor gene expression in early organogenesis: comparison with IGF-II gene expression. Mol Endocrinol 4(9): 1386-1398.
Braunschweig MH, Van Laere AS, Buys N, Andersson L, Andersson G. 2004. IGF2 antisense transcript expression in porcine postnatal muscle is affected by a quantitative trait nucleotide in intron 3. Genomics 84(6): 1021-1029.
Buckingham M, Bajard L, Chang T, Daubas P, Hadchouel J, Meilhac S, Montarras D, Rocancourt D, Relaix F. 2003. The formation of skeletal muscle: from somite to limb. J Anat 202(1): 59-68.
Butter F, Kappei D, Buchholz F, Vermeulen M, Mann M. 2010. A domesticated transposon mediates the effects of a single-nucleotide polymorphism responsible for enhanced muscle growth. EMBO Rep 11(4): 305-311.
Calderari S, Gangnerau MN, Thibault M, Meile MJ, Kassis N, Alvarez C, Portha B, Serradas P. 2007. Defective IGF2 and IGF1R protein production in embryonic pancreas precedes beta cell mass anomaly in the Goto-Kakizaki rat model of type 2 diabetes. Diabetologia 50(7): 1463-1471.
Calvi BR, Hong TJ, Findley SD, Gelbart WM. 1991. Evidence for a common evolutionary origin of inverted repeat transposons in Drosophila and plants: hobo, Activator, and Tam3. Cell 66: 465-471.
Carey M, Peterson CL, Smale ST. 2009. Transcriptional regulation in eukaryotes : concepts, strategies, and techniques. Cold Spring Harbor Laboratory Press, Cold Spring Harbor, N.Y.
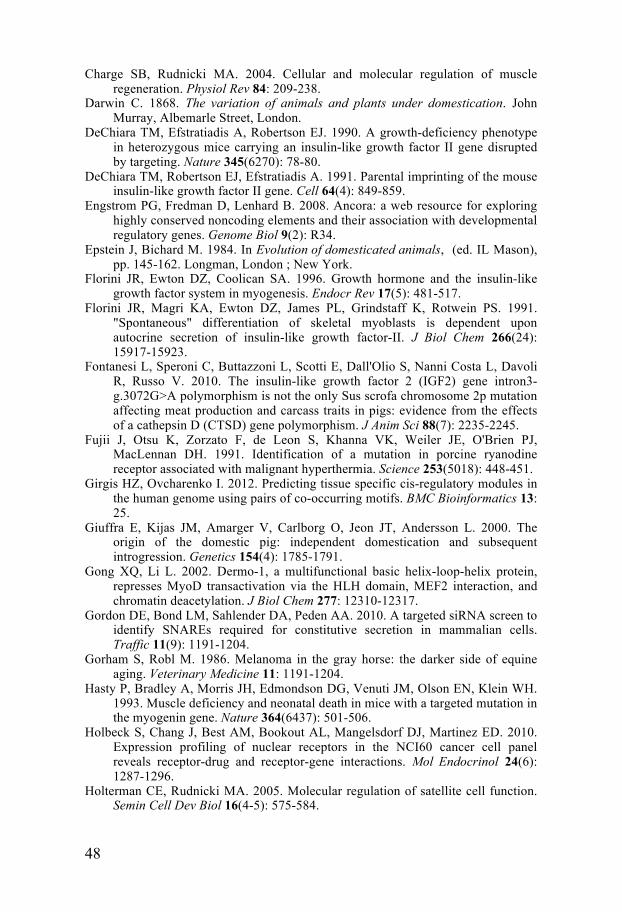
48
Charge SB, Rudnicki MA. 2004. Cellular and molecular regulation of muscle regeneration. Physiol Rev 84: 209-238.
Darwin C. 1868. The variation of animals and plants under domestication. John Murray, Albemarle Street, London.
DeChiara TM, Efstratiadis A, Robertson EJ. 1990. A growth-deficiency phenotype in heterozygous mice carrying an insulin-like growth factor II gene disrupted by targeting. Nature 345(6270): 78-80.
DeChiara TM, Robertson EJ, Efstratiadis A. 1991. Parental imprinting of the mouse insulin-like growth factor II gene. Cell 64(4): 849-859.
Engstrom PG, Fredman D, Lenhard B. 2008. Ancora: a web resource for exploring highly conserved noncoding elements and their association with developmental regulatory genes. Genome Biol 9(2): R34.
Epstein J, Bichard M. 1984. In Evolution of domesticated animals, (ed. IL Mason), pp. 145-162. Longman, London ; New York.
Florini JR, Ewton DZ, Coolican SA. 1996. Growth hormone and the insulin-like growth factor system in myogenesis. Endocr Rev 17(5): 481-517.
Florini JR, Magri KA, Ewton DZ, James PL, Grindstaff K, Rotwein PS. 1991. "Spontaneous" differentiation of skeletal myoblasts is dependent upon autocrine secretion of insulin-like growth factor-II. J Biol Chem 266(24): 15917-15923.
Fontanesi L, Speroni C, Buttazzoni L, Scotti E, Dall'Olio S, Nanni Costa L, Davoli R, Russo V. 2010. The insulin-like growth factor 2 (IGF2) gene intron3-g.3072G>A polymorphism is not the only Sus scrofa chromosome 2p mutation affecting meat production and carcass traits in pigs: evidence from the effects of a cathepsin D (CTSD) gene polymorphism. J Anim Sci 88(7): 2235-2245.
Fujii J, Otsu K, Zorzato F, de Leon S, Khanna VK, Weiler JE, O'Brien PJ, MacLennan DH. 1991. Identification of a mutation in porcine ryanodine receptor associated with malignant hyperthermia. Science 253(5018): 448-451.
Girgis HZ, Ovcharenko I. 2012. Predicting tissue specific cis-regulatory modules in the human genome using pairs of co-occurring motifs. BMC Bioinformatics 13: 25.
Giuffra E, Kijas JM, Amarger V, Carlborg O, Jeon JT, Andersson L. 2000. The origin of the domestic pig: independent domestication and subsequent introgression. Genetics 154(4): 1785-1791.
Gong XQ, Li L. 2002. Dermo-1, a multifunctional basic helix-loop-helix protein, represses MyoD transactivation via the HLH domain, MEF2 interaction, and chromatin deacetylation. J Biol Chem 277: 12310-12317.
Gordon DE, Bond LM, Sahlender DA, Peden AA. 2010. A targeted siRNA screen to identify SNAREs required for constitutive secretion in mammalian cells. Traffic 11(9): 1191-1204.
Gorham S, Robl M. 1986. Melanoma in the gray horse: the darker side of equine aging. Veterinary Medicine 11: 1191-1204.
Hasty P, Bradley A, Morris JH, Edmondson DG, Venuti JM, Olson EN, Klein WH. 1993. Muscle deficiency and neonatal death in mice with a targeted mutation in the myogenin gene. Nature 364(6437): 501-506.
Holbeck S, Chang J, Best AM, Bookout AL, Mangelsdorf DJ, Martinez ED. 2010. Expression profiling of nuclear receptors in the NCI60 cancer cell panel reveals receptor-drug and receptor-gene interactions. Mol Endocrinol 24(6): 1287-1296.
Holterman CE, Rudnicki MA. 2005. Molecular regulation of satellite cell function. Semin Cell Dev Biol 16(4-5): 575-584.
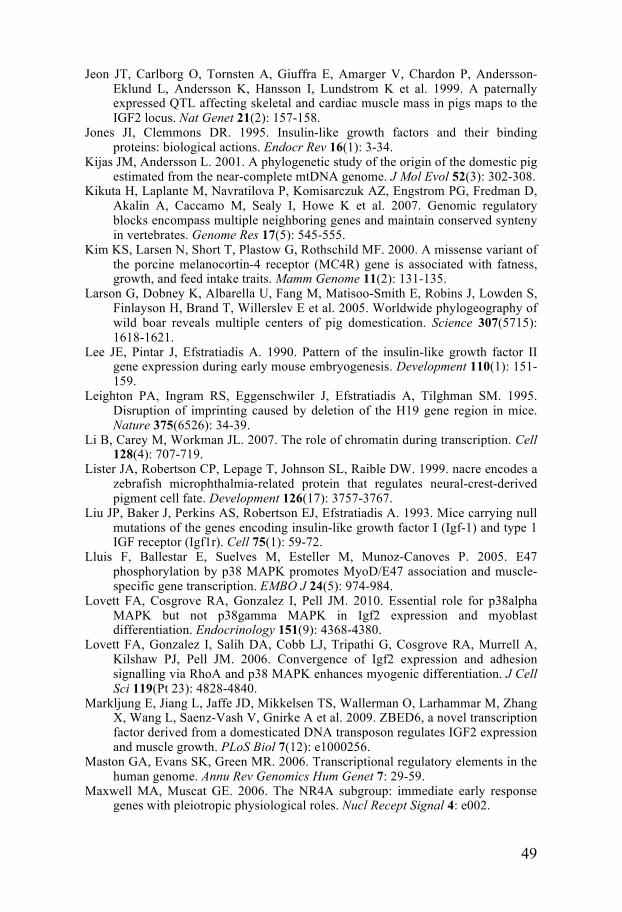
49
Jeon JT, Carlborg O, Tornsten A, Giuffra E, Amarger V, Chardon P, Andersson-Eklund L, Andersson K, Hansson I, Lundstrom K et al. 1999. A paternally expressed QTL affecting skeletal and cardiac muscle mass in pigs maps to the IGF2 locus. Nat Genet 21(2): 157-158.
Jones JI, Clemmons DR. 1995. Insulin-like growth factors and their binding proteins: biological actions. Endocr Rev 16(1): 3-34.
Kijas JM, Andersson L. 2001. A phylogenetic study of the origin of the domestic pig estimated from the near-complete mtDNA genome. J Mol Evol 52(3): 302-308.
Kikuta H, Laplante M, Navratilova P, Komisarczuk AZ, Engstrom PG, Fredman D, Akalin A, Caccamo M, Sealy I, Howe K et al. 2007. Genomic regulatory blocks encompass multiple neighboring genes and maintain conserved synteny in vertebrates. Genome Res 17(5): 545-555.
Kim KS, Larsen N, Short T, Plastow G, Rothschild MF. 2000. A missense variant of the porcine melanocortin-4 receptor (MC4R) gene is associated with fatness, growth, and feed intake traits. Mamm Genome 11(2): 131-135.
Larson G, Dobney K, Albarella U, Fang M, Matisoo-Smith E, Robins J, Lowden S, Finlayson H, Brand T, Willerslev E et al. 2005. Worldwide phylogeography of wild boar reveals multiple centers of pig domestication. Science 307(5715): 1618-1621.
Lee JE, Pintar J, Efstratiadis A. 1990. Pattern of the insulin-like growth factor II gene expression during early mouse embryogenesis. Development 110(1): 151-159.
Leighton PA, Ingram RS, Eggenschwiler J, Efstratiadis A, Tilghman SM. 1995. Disruption of imprinting caused by deletion of the H19 gene region in mice. Nature 375(6526): 34-39.
Li B, Carey M, Workman JL. 2007. The role of chromatin during transcription. Cell 128(4): 707-719.
Lister JA, Robertson CP, Lepage T, Johnson SL, Raible DW. 1999. nacre encodes a zebrafish microphthalmia-related protein that regulates neural-crest-derived pigment cell fate. Development 126(17): 3757-3767.
Liu JP, Baker J, Perkins AS, Robertson EJ, Efstratiadis A. 1993. Mice carrying null mutations of the genes encoding insulin-like growth factor I (Igf-1) and type 1 IGF receptor (Igf1r). Cell 75(1): 59-72.
Lluis F, Ballestar E, Suelves M, Esteller M, Munoz-Canoves P. 2005. E47 phosphorylation by p38 MAPK promotes MyoD/E47 association and muscle-specific gene transcription. EMBO J 24(5): 974-984.
Lovett FA, Cosgrove RA, Gonzalez I, Pell JM. 2010. Essential role for p38alpha MAPK but not p38gamma MAPK in Igf2 expression and myoblast differentiation. Endocrinology 151(9): 4368-4380.
Lovett FA, Gonzalez I, Salih DA, Cobb LJ, Tripathi G, Cosgrove RA, Murrell A, Kilshaw PJ, Pell JM. 2006. Convergence of Igf2 expression and adhesion signalling via RhoA and p38 MAPK enhances myogenic differentiation. J Cell Sci 119(Pt 23): 4828-4840.
Markljung E, Jiang L, Jaffe JD, Mikkelsen TS, Wallerman O, Larhammar M, Zhang X, Wang L, Saenz-Vash V, Gnirke A et al. 2009. ZBED6, a novel transcription factor derived from a domesticated DNA transposon regulates IGF2 expression and muscle growth. PLoS Biol 7(12): e1000256.
Maston GA, Evans SK, Green MR. 2006. Transcriptional regulatory elements in the human genome. Annu Rev Genomics Hum Genet 7: 29-59.
Maxwell MA, Muscat GE. 2006. The NR4A subgroup: immediate early response genes with pleiotropic physiological roles. Nucl Recept Signal 4: e002.
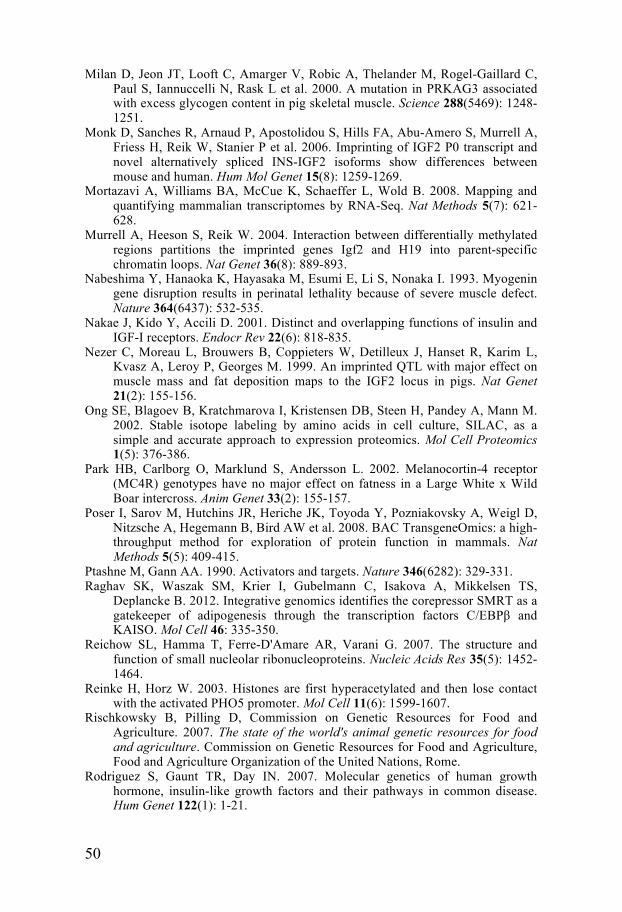
50
Milan D, Jeon JT, Looft C, Amarger V, Robic A, Thelander M, Rogel-Gaillard C, Paul S, Iannuccelli N, Rask L et al. 2000. A mutation in PRKAG3 associated with excess glycogen content in pig skeletal muscle. Science 288(5469): 1248-1251.
Monk D, Sanches R, Arnaud P, Apostolidou S, Hills FA, Abu-Amero S, Murrell A, Friess H, Reik W, Stanier P et al. 2006. Imprinting of IGF2 P0 transcript and novel alternatively spliced INS-IGF2 isoforms show differences between mouse and human. Hum Mol Genet 15(8): 1259-1269.
Mortazavi A, Williams BA, McCue K, Schaeffer L, Wold B. 2008. Mapping and quantifying mammalian transcriptomes by RNA-Seq. Nat Methods 5(7): 621-628.
Murrell A, Heeson S, Reik W. 2004. Interaction between differentially methylated regions partitions the imprinted genes Igf2 and H19 into parent-specific chromatin loops. Nat Genet 36(8): 889-893.
Nabeshima Y, Hanaoka K, Hayasaka M, Esumi E, Li S, Nonaka I. 1993. Myogenin gene disruption results in perinatal lethality because of severe muscle defect. Nature 364(6437): 532-535.
Nakae J, Kido Y, Accili D. 2001. Distinct and overlapping functions of insulin and IGF-I receptors. Endocr Rev 22(6): 818-835.
Nezer C, Moreau L, Brouwers B, Coppieters W, Detilleux J, Hanset R, Karim L, Kvasz A, Leroy P, Georges M. 1999. An imprinted QTL with major effect on muscle mass and fat deposition maps to the IGF2 locus in pigs. Nat Genet 21(2): 155-156.
Ong SE, Blagoev B, Kratchmarova I, Kristensen DB, Steen H, Pandey A, Mann M. 2002. Stable isotope labeling by amino acids in cell culture, SILAC, as a simple and accurate approach to expression proteomics. Mol Cell Proteomics 1(5): 376-386.
Park HB, Carlborg O, Marklund S, Andersson L. 2002. Melanocortin-4 receptor (MC4R) genotypes have no major effect on fatness in a Large White x Wild Boar intercross. Anim Genet 33(2): 155-157.
Poser I, Sarov M, Hutchins JR, Heriche JK, Toyoda Y, Pozniakovsky A, Weigl D, Nitzsche A, Hegemann B, Bird AW et al. 2008. BAC TransgeneOmics: a high-throughput method for exploration of protein function in mammals. Nat Methods 5(5): 409-415.
Ptashne M, Gann AA. 1990. Activators and targets. Nature 346(6282): 329-331. Raghav SK, Waszak SM, Krier I, Gubelmann C, Isakova A, Mikkelsen TS,
Deplancke B. 2012. Integrative genomics identifies the corepressor SMRT as a gatekeeper of adipogenesis through the transcription factors C/EBPβ and KAISO. Mol Cell 46: 335-350.
Reichow SL, Hamma T, Ferre-D'Amare AR, Varani G. 2007. The structure and function of small nucleolar ribonucleoproteins. Nucleic Acids Res 35(5): 1452-1464.
Reinke H, Horz W. 2003. Histones are first hyperacetylated and then lose contact with the activated PHO5 promoter. Mol Cell 11(6): 1599-1607.
Rischkowsky B, Pilling D, Commission on Genetic Resources for Food and Agriculture. 2007. The state of the world's animal genetic resources for food and agriculture. Commission on Genetic Resources for Food and Agriculture, Food and Agriculture Organization of the United Nations, Rome.
Rodriguez S, Gaunt TR, Day IN. 2007. Molecular genetics of human growth hormone, insulin-like growth factors and their pathways in common disease. Hum Genet 122(1): 1-21.
51
Rosengren Pielberg G, Golovko A, Sundstrom E, Curik I, Lennartsson J, Seltenhammer MH, Druml T, Binns M, Fitzsimmons C, Lindgren G et al. 2008. A cis-acting regulatory mutation causes premature hair graying and susceptibility to melanoma in the horse. Nat Genet 40(8): 1004-1009.
Rudnicki MA, Schnegelsberg PN, Stead RH, Braun T, Arnold HH, Jaenisch R. 1993. MyoD or Myf-5 is required for the formation of skeletal muscle. Cell 75(7): 1351-1359.
Santos-Rosa H, Schneider R, Bannister AJ, Sherriff J, Bernstein BE, Emre NC, Schreiber SL, Mellor J, Kouzarides T. 2002. Active genes are tri-methylated at K4 of histone H3. Nature 419: 407-411.
Schmidt D, Stark R, Wilson MD, Brown GD, Odom DT. 2008. Genome-scale validation of deep-sequencing libraries. PLoS One 3(11): e3713.
Seltenhammer MH, Heere-Ress E, Brandt S, Druml T, Jansen B, Pehamberger H, Niebauer GW. 2004. Comparative histopathology of grey-horse-melanoma and human malignant melanoma. Pigment Cell Res 17(6): 674-681.
Simone C, Forcales SV, Hill DA, Imbalzano AN, Latella L, Puri PL. 2004. p38 pathway targets SWI-SNF chromatin-remodeling complex to muscle-specific loci. Nat Genet 36(7): 738-743.
Smith AG, Luk N, Newton RA, Roberts DW, Sturm RA, Muscat GE. 2008. Melanocortin-1 receptor signaling markedly induces the expression of the NR4A nuclear receptor subgroup in melanocytic cells. J Biol Chem 283(18): 12564-12570.
Smith SH, Goldschmidt MH, McManus PM. 2002. A comparative review of melanocytic neoplasms. Vet Pathol 39(6): 651-678.
Soares MB, Turken A, Ishii D, Mills L, Episkopou V, Cotter S, Zeitlin S, Efstratiadis A. 1986. Rat insulin-like growth factor II gene. A single gene with two promoters expressing a multitranscript family. J Mol Biol 192(4): 737-752.
Stachowiak M, Szydlowski M, Obarzanek-Fojt M, Switonski M. 2006. An effect of a missense mutation in the porcine melanocortin-4 receptor (MC4R) gene on production traits in Polish pig breeds is doubtful. Anim Genet 37(1): 55-57.
Steegmaier M, Yang B, Yoo JS, Huang B, Shen M, Yu S, Luo Y, Scheller RH. 1998. Three novel proteins of the syntaxin/SNAP-25 family. J Biol Chem 273(51): 34171-34179.
Stinckens A, Luyten T, Bijttebier J, Van den Maagdenberg K, Dieltiens D, Janssens S, De Smet S, Georges M, Buys N. 2008. Characterization of the complete porcine MSTN gene and expression levels in pig breeds differing in muscularity. Anim Genet 39(6): 586-596.
Stylianopoulou F, Efstratiadis A, Herbert J, Pintar J. 1988. Pattern of the insulin-like growth factor II gene expression during rat embryogenesis. Development 103(3): 497-506.
Sun FL, Dean WL, Kelsey G, Allen ND, Reik W. 1997. Transactivation of Igf2 in a mouse model of Beckwith-Wiedemann syndrome. Nature 389(6653): 809-815.
Sutton RH, Coleman GT. 1997. Melanoma and the Graying Horse. Barton, Australia.
Van Laere AS. 2005. From QTL to QTN - Identification of a Quantitative Trait Nucleotide Influencing Muscle Development and Fat Deposition in Pig. In Doctorate thesis, Swedish University of Agricultural Sciences.
Van Laere AS, Nguyen M, Braunschweig M, Nezer C, Collette C, Moreau L, Archibald AL, Haley CS, Buys N, Tally M et al. 2003. A regulatory mutation in IGF2 causes a major QTL effect on muscle growth in the pig. Nature 425(6960): 832-836.
52
Wang Z, Zang C, Rosenfeld JA, Schones DE, Barski A, Cuddapah S, Cui K, Roh TY, Peng W, Zhang MQ et al. 2008. Combinatorial patterns of histone acetylations and methylations in the human genome. Nat Genet 40: 897-903.
Weintraub H, Tapscott SJ, Davis RL, Thayer MJ, Adam MA, Lassar AB, Miller AD. 1989. Activation of muscle-specific genes in pigment, nerve, fat, liver, and fibroblast cell lines by forced expression of MyoD. Proc Natl Acad Sci U S A 86(14): 5434-5438.
Whittemore C. 2006. Development and Improvement of Pigs by Genetic Selection In Whittemore’s Science and Practice of Pig Production, (ed. I Kyriazakis, C Whittemore), pp. 184-205. Blackwell Publishing Ltd.
Wilson EM, Rotwein P. 2006. Control of MyoD function during initiation of muscle differentiation by an autocrine signaling pathway activated by insulin-like growth factor-II. J Biol Chem 281(40): 29962-29971.
Workman JL. 2006. Nucleosome displacement in transcription. Genes Dev 20(15): 2009-2017.
Wu Z, Woodring PJ, Bhakta KS, Tamura K, Wen F, Feramisco JR, Karin M, Wang JY, Puri PL. 2000. p38 and extracellular signal-regulated kinases regulate the myogenic program at multiple steps. Mol Cell Biol 20(11): 3951-3964.
Yaffe D, Saxel O. 1977. Serial passaging and differentiation of myogenic cells isolated from dystrophic mouse muscle. Nature 270(5639): 725-727.
Yang C, Bolotin E, Jiang T, Sladek FM, Martinez E. 2007. Prevalence of the initiator over the TATA box in human and yeast genes and identification of DNA motifs enriched in human TATA-less core promoters. Gene 389(1): 52-65.
Zhang Q, Li J, Deavers M, Abbruzzese JL, Ho L. 2005. The subcellular localization of syntaxin 17 varies among different cell types and is altered in some malignant cells. J Histochem Cytochem 53(11): 1371-1382.
Zhao M, New L, Kravchenko VV, Kato Y, Gram H, di Padova F, Olson EN, Ulevitch RJ, Han J. 1999. Regulation of the MEF2 family of transcription factors by p38. Mol Cell Biol 19(1): 21-30.

Acta Universitatis UpsaliensisDigital Comprehensive Summaries of Uppsala Dissertationsfrom the Faculty of Medicine 836
Editor: The Dean of the Faculty of Medicine
A doctoral dissertation from the Faculty of Medicine, UppsalaUniversity, is usually a summary of a number of papers. A fewcopies of the complete dissertation are kept at major Swedishresearch libraries, while the summary alone is distributedinternationally through the series Digital ComprehensiveSummaries of Uppsala Dissertations from the Faculty ofMedicine.
Distribution: publications.uu.seurn:nbn:se:uu:diva-183715
ACTAUNIVERSITATIS
UPSALIENSISUPPSALA
2012