functions - linda green
TRANSCRIPT

FUNCTIONS
Functions
After completing this section, students should be able to:
• Decide whether a relationship between input and output values is a function ornot, based on an equation, a graph, or a table of values.
• Find the corresponding output value for a given input value for a function givenin equation, graphical, or tabular form.
• Find the corresponding input value(s) for a given output value for a function givenin equation, graphical, or tabular form.
• Find the domain and range of a function or relation based on a graph or table ofvalues.
• Find the domains of functions given in equation form involving square roots anddenominators. .
2

FUNCTIONS
Definition. A function is correspondence between input numbers (x-values) and out-put numbers (y-value) that sends each input number (x-value) to exactly one outputnumber (y-value).
Sometimes, a function is described with an equation.
Example. y = x2 + 1, which can also be written as f (x) = x2 + 1
What is f (2)? f (5)?
What is f (a + 3)?
3

FUNCTIONS
Sometimes, a function is described with a graph.
Example. The graph of y = g(x) is shown below
What is g(2)? g(5)?
4

FUNCTIONS
Definition. The domain of a function is all possible x-values. The range is the y-values.
Example. What is the domain and range of the function g(x) graphed below?
5

FUNCTIONS
Example. What are the domains of these functions?
A. g(x) =x
x2 � 4x + 3
B. f (x) =p
3 � 2x
6

FUNCTIONS
C. h(x) =p
3 � 2xx2 � 4x + 3
END OF VIDEO
7

FUNCTIONS
Definition. A relation is ...
Example. Which of these relations represent functions?
1. {(4, 4), (6, 4), (�4, 6), (7, 4)}
2.
3. y =12
x2
4. y2 = 3x
5.
8

FUNCTIONS
Example. Find the domain of h(x) =2
x � 9+p
6x + 5
9

FUNCTIONS
Example. Find the domain of g(x) =p
2 � xx + 3
A. (�1, 2)
B. (�1, 2]
C. (�3, 2]
D. (�1,�3) [ (�3, 2)
E. (�1,�3) [ (�3, 2]
10

INCREASING AND DECREASING FUNCTIONS, MAXIMUMS AND MINIMUMS
Increasing and Decreasing Functions, Maximums and Minimums
After completing this sections, students should be able to:
• Identify the intervals on which a function is increasing and decreasing based on agraph.
• Define absolute maximum and minimum values and points and local minimumvalues and points.
• Identify absolute and local max and min values and points based on a graph.
11

INCREASING AND DECREASING FUNCTIONS, MAXIMUMS AND MINIMUMS
Example. Which function is increasing? Which is decreasing?
.
Example. On what intervals is the function graphed below increasing? Decreasing?
12
INCREASING AND DECREASING FUNCTIONS, MAXIMUMS AND MINIMUMS
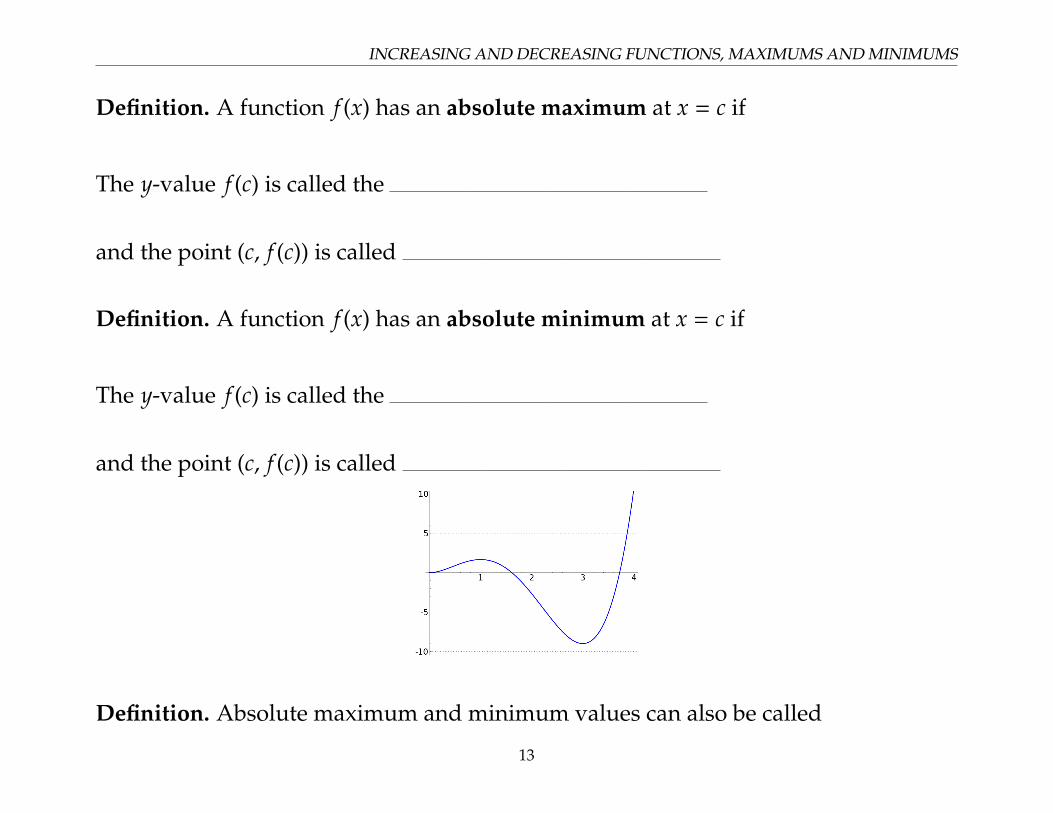
Definition. A function f (x) has an absolute maximum at x = c if
The y-value f (c) is called the
and the point (c, f (c)) is called
Definition. A function f (x) has an absolute minimum at x = c if
The y-value f (c) is called the
and the point (c, f (c)) is called
Definition. Absolute maximum and minimum values can also be called
13

INCREASING AND DECREASING FUNCTIONS, MAXIMUMS AND MINIMUMS
Definition. A function f (x) has an local maximum at x = c if
The y-value f (c) is called the
and the point (c, f (c)) is called
Definition. A function f (x) has an local minimum at x = c if
The y-value f (c) is called the
and the point (c, f (c)) is called
Definition. Local maximum and minimum values can also be called
14

INCREASING AND DECREASING FUNCTIONS, MAXIMUMS AND MINIMUMS
Example. .
1. Mark all local maximum and minimum points.
2. Mark all absolut maximum and and minimum points.
3. What are the local maximum and minimum values of the function?
4. What are the absolute maximum and minimum values of the function?
END OF VIDEOS
15

INCREASING AND DECREASING FUNCTIONS, MAXIMUMS AND MINIMUMS
Question. What is the di↵erence between a maximum point and a maximum value?
Question. What is di↵erence between an absolute maximum value and a local maximumvalue?
Question. Is it possible to have more than one absolute maximum value? More thanone absolute maximum point?
16

INCREASING AND DECREASING FUNCTIONS, MAXIMUMS AND MINIMUMS
Example. Find the local maximum points, the local minimum points, the absolutemaximum points, and the absolute minimum points.
What are the absolute maximum and minimum values?
17

INCREASING AND DECREASING FUNCTIONS, MAXIMUMS AND MINIMUMS
Example. On what intervals is the function graphed below increasing? Decreasing?
What are its absolute max and min points? Absolute max and min values?
18

SYMMETRY AND EVEN AND ODD FUNCTIONS
Symmetry and Even and Odd Functions
After completing this sections, students should be able to:
• Identify whether a graph is symmetric with respect to the x-axis, symmetric withrespect to the y-axis, symmetric with respect to the origin, or none of these.
• Determine whether a function is even or odd or neither, based in its graph or itsequation.
• Explain the relationship between even and odd functions and the symmetry oftheir graphs.
19

SYMMETRY AND EVEN AND ODD FUNCTIONS
Definition. A graph is sym-metric with respect to the x-axis if ...
Whenever a point (x, y) is onthe graph, the point
is also on the graph.
Definition. A graph is sym-metric with respect to the y-axis if ...
Whenever a point (x, y) is onthe graph, the point
is also on the graph.
Definition. A graph is sym-metric with respect to the ori-gin if ...
Whenever a point (x, y) is onthe graph, the point
is also on the graph.
20

SYMMETRY AND EVEN AND ODD FUNCTIONS
Example. Which graphs are symmetric with respect to the x-axis, the y-axis, the origin,or neither?
21

SYMMETRY AND EVEN AND ODD FUNCTIONS
Definition. A function f (x) is even if ...
Example. f (x) = x2 + 3 is even because ...
Definition. A function f (x) is odd if ...
Example. f (x) = 5x � 1x
is odd because ...
22

SYMMETRY AND EVEN AND ODD FUNCTIONS
Question. There is no word like even or odd for when a function’s graph is symmetricwith respect to the x-axis. Why not?
END OF VIDEO
23

SYMMETRY AND EVEN AND ODD FUNCTIONS
Example. Are these graphs symmetric with respect to the x-axis, the y-axis, the origin,or neither?
y2 = x3 � x
y = x3 � y2x
y3 = x2
y2 = |x|
24
SYMMETRY AND EVEN AND ODD FUNCTIONS
Example. Do these equations have graphs that are symmetric with respect to the x-axis,the y-axis, the origin, or neither?
y =2x3 + x x2 + 2y4 = 6 y = |x| + x y = |x| + x2
Which equations represent even functions? Odd functions?
25

SYMMETRY AND EVEN AND ODD FUNCTIONS
Example. Determine whether the functions are even, odd, or neither.
1. f (x) = 4x3 + 2x
2. g(x) = 5x4 � 3x2 + 1
3. h(x) = 2x3 + 7x2
26

TRANSFORMING FUNCTIONS
Transforming Functions
After completing this section, students should be able to
• Identify the motions corresponding to adding or multiplying numbers or intro-ducing a negative sign on the inside or the outside of a function.
• Draw the transformed graph, given an original graph of y = f (x) and an equationlike y = �3 f (x + 2), using a point by point analysis or a wholistic approach.
• Identify the equation for transformed graphs of toolkit functions like y = |x| andy = x2
• Identify a point on a transformed graph, given a point on the original graph andthe equation of the transformed graph.
27

TRANSFORMING FUNCTIONS
Review of Function NotationExample. Rewrite the following, if g(x) =
px.
a) g(x) � 2 =
b) g(x � 2) =
c) g(3x) =
d) 3g(x) =
e) g(�x) =
Example. Rewrite the following in terms of g(x), if g(x) =p
x.
f)p
x + 17 =
g)p
x + 12 =
h) �36 · px =
i)q
14x =
28

TRANSFORMING FUNCTIONS
Example. Graph
• y =p
x
• y =p
x � 2
• y =p
x � 2
29
TRANSFORMING FUNCTIONS
Rules for transformations:
• Numbers on the outside of the function a↵ect the y-values and result in verticalmotions. These motions are in the direction you expect.
• Numbers on the inside of the function a↵ect the x-values and result in horizontalmotions. These motions go in the opposite direction from what you expect.
• Adding results in a shift (translations)
• Multiplying results in a stretch or shrink
• A negative sign results in a reflection
30

TRANSFORMING FUNCTIONS
Example. Consider g(x) =p
x. How do the graphs of the following functions compareto the graph of y =
px?
a) y =p
x � 4
b) y =p
x + 12
c) y = �3 · px
d) y =q
14x
END OF VIDEO
31

TRANSFORMING FUNCTIONS
Rules of Function Transformations (see graph animations involving y = sin(x))
• A number added on the OUTSIDE of a function ...
• A number added on the INSIDE of a function ....
• A number multiplied on the OUTSIDE of a function ....
• A number mulitplied on the INSIDE of a function ....
• A negative sign on the OUTSIDE of a function ....
• A negative sign on the INSIDE of a function ....
32

TRANSFORMING FUNCTIONS
Example. Consider h(x) = x3. How do the graphs of the following functions compareto the graph of y = x3?
a) y = �(x + 1)3
b) y = (2x)3
c) y =x3
2� 5
d) y = (�x)3 + 3
33

TRANSFORMING FUNCTIONS
Note. There are two approaches to graphing transformed functions:
34
TRANSFORMING FUNCTIONS
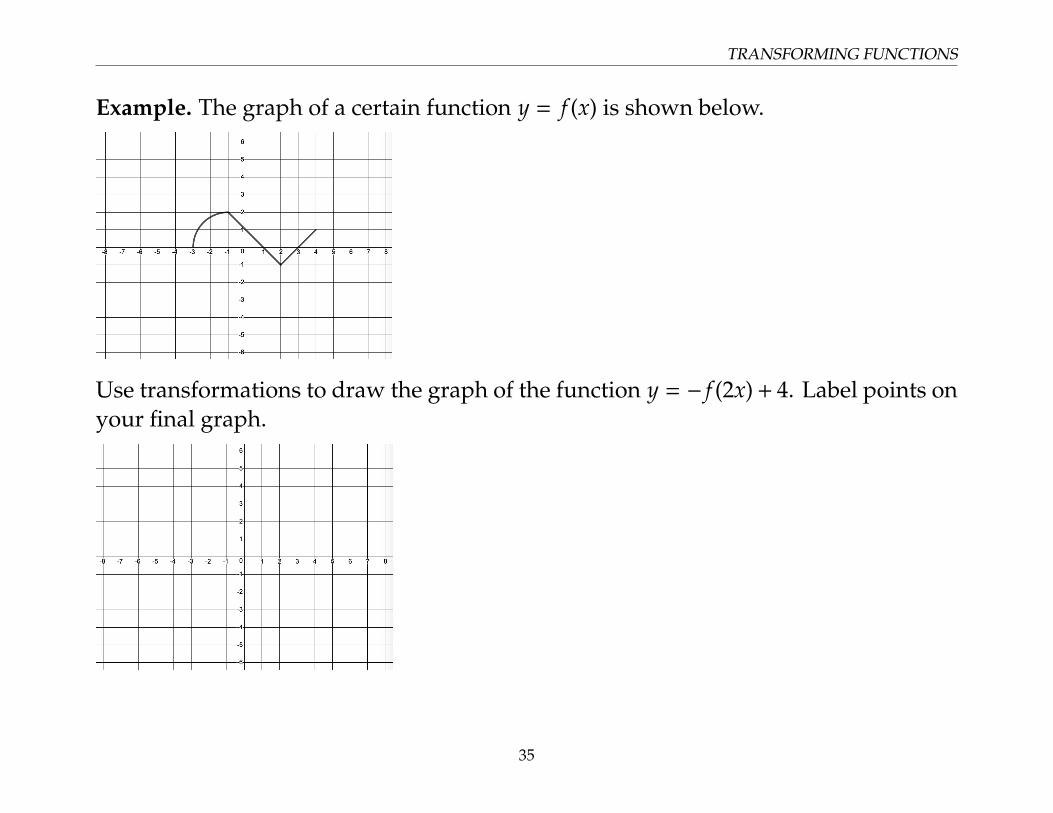
Example. The graph of a certain function y = f (x) is shown below.
Use transformations to draw the graph of the function y = � f (2x)+ 4. Label points onyour final graph.
35

TRANSFORMING FUNCTIONS
Example. The graph of a certain function y = f (x) is shown below.
Use transformations to draw the graph of the function y = 3 f (�x)� 1. Label points onyour final graph.
36

TRANSFORMING FUNCTIONS
Example. Given the original graph if y = f (x)
Find the graph of y = 3 f (�x) + 1, and write down the equations of the other graphs.
37

TRANSFORMING FUNCTIONS
Extra Example. Suppose the graph of y = f (x) contains the point (3,�1). Identify apoint that must be on the graph of y = 2 f (x � 1).
A. (2,�1)
B. (2,�1)
C. (4,�1)
D. (4,�2)
38

PIECEWISE FUNCTIONS
Piecewise Functions
After completing this sections, students should be able to:
• Evaluate piecewise functions at a given x-value.
• Graph piecewise functions.
39

PIECEWISE FUNCTIONS
Example. The function f is defined as follows:
f (x) =
8>><>>:�x2 if x < 1�2x + 3 if x � 1
1. What is f (�2)? What is f (1) What is f (3)?
2. Graph y = f (x).
3. Is f (x) continuous?
END OF VIDEO
40

PIECEWISE FUNCTIONS
Example. The function g(x) is defined by:
g(x) =
8>>>>>><>>>>>>:
(x + 2)2 if �4 x �212
x + 1 if �2 < x < 2
3 if 2 x 4
1. What is g(�2)? What is g(1) What is g(3.5)?
2. Graph y = g(x).
3. What are the domain and range of g(x)?
41

PIECEWISE FUNCTIONS
Extra Example. The function h(x) is defined by:
h(x) =
8>>>>><>>>>>:
2|x| if �2 x < 1�px � 1 if 1 x < 41 � x if 4 x 6
1. What is h(1)? What is h(5)?
2. Graph y = h(x).
3. What are the domain and range of h(x)?
42

INVERSE FUNCTIONS
Inverse functions
After completing this section, students should be able to:
• Based on the graph of a function, determine if the function has an inverse that is afunction.
• Draw the graph of an inverse function, given the graph of the original.
• Use a table of values for a function to write a table of values for its inverse.
• Determine if two given functions are inverses of each other by computing theircompositions.
• Use a formula for a function to find a formula for its inverse.
• Find the range of the inverse function from the domain of the original function.
• Find the domain of the inverse function from the range of the original function.
43

INVERSE FUNCTIONS
Example. Suppose f (x) is the function defined by the chart below:
x 2 3 4 5f (x) 3 5 6 1
In other words,
• f (2) = 3
• f (3) = 5
• f (4) = 6
• f (5) = 1
Definition. The inverse function for f , written f�1(x), undoes what f does.
����
���������
• f�1( 3 ) = 2
• f�1( ) =
• f�1( ) =
• f�1( ) =
x 3f�1(x) 2
Key Fact 1. Inverse functions reverse the roles of y and x.
44

INVERSE FUNCTIONS
Graph y = f (x) and y = f�1(x) on the same axes below. What do you notice about thepoints on the graph of y = f (x) and the points on the graph of y = f�1?
Key Fact 2. The graph of y = f�1(x) is obtained from the graph of y = f (x) by reflectingover the line .
45

INVERSE FUNCTIONS
In our same example, compute:
f�1 � f (2) = f � f�1(3) =f�1 � f (3) = f � f�1(5) =f�1 � f (4) = f � f�1(6) =f�1 � f (5) = f � f�1(1) =
Key Fact 3. f�1 � f (x) = and f � f�1(x) = . This is the mathematicalway of saying that f and f�1 undo each other.
Example. f (x) = x3. Guess what the inverse of f should be. Remember, f�1 undoesthe work that f does.
46

INVERSE FUNCTIONS
Example. Find the inverse of the function:
f (x) =5 � x
3x
Note. f�1(x) means the inverse function for f (x). Note that f�1(x) , 1f (x).
47

INVERSE FUNCTIONS
Question. Do all functions have inverse functions? That is, for any function that youmight encounter, is there always a function that is its inverse?
Try to find an example of a function that does not have an inverse function.
48

INVERSE FUNCTIONS
Key Fact 4. A function f has an inverse function if and only if the graph of f satisfiesthe horizontal line test (i.e. every horizontal line intersects the graph of y = f (x) in atmost one point.)
Definition. A function is one-to-one if it passes the horizontal line test. Equivalently,a function is one-to-one if for any two di↵erent x-values x1 and x2, f (x1) and f (x2) aredi↵erent numbers. Sometimes, this is said: f is one-to-one if, whenever f (x1) = f (x2),then x1 = x2.
49

INVERSE FUNCTIONS
Example. (Tricky) Find p�1(x), where p(x) =p
x � 2 drawn above. Graph p�1(x) on thesame axes as p(x).
For the function p(x) =p
x � 2, what is:
• the domain of p?
• the range of p?
• the domain of p�1?
• the range of p�1 ?
Key Fact 5. For any invertible function f , the domain of f�1(x) is andthe range of f�1(x) is .
50

INVERSE FUNCTIONS
END OF VIDEO
What are some facts about inverse functions?
51
INVERSE FUNCTIONS
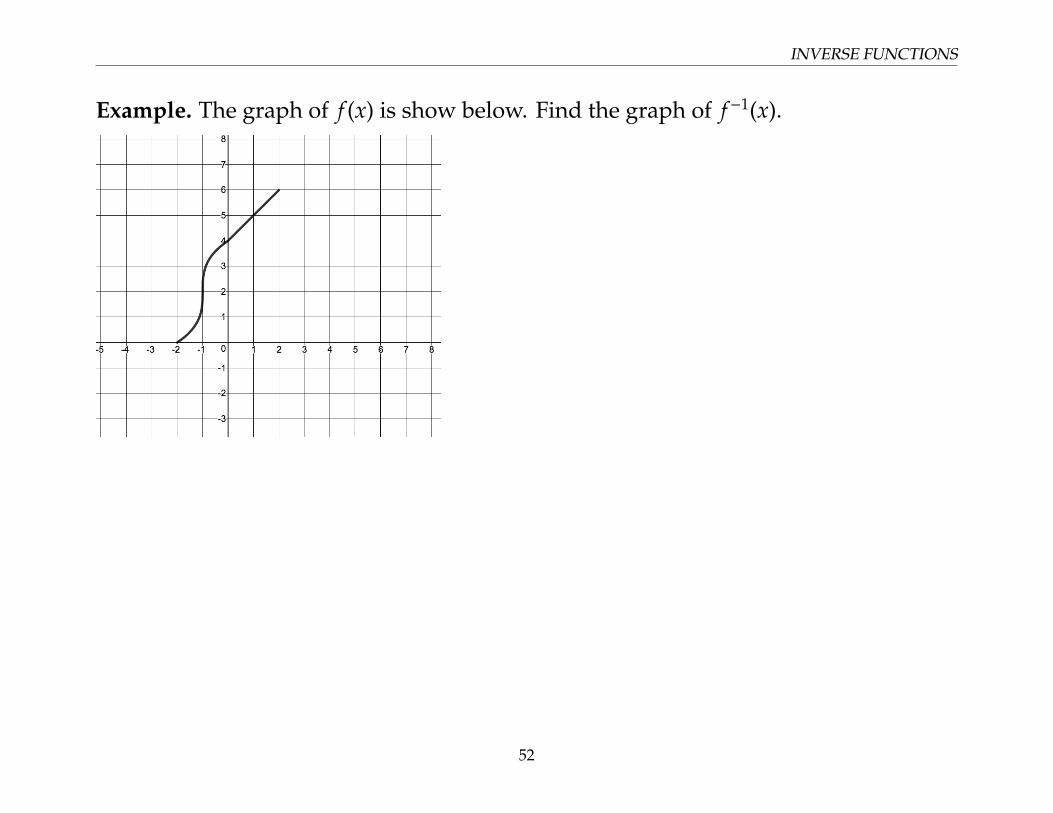
Example. The graph of f (x) is show below. Find the graph of f�1(x).
52

INVERSE FUNCTIONS
Example. For each function graph, determine whether it has an inverse function.
A. B.
C. D.
53

INVERSE FUNCTIONS
Example. h(x) = x3 � 7. Find h�1(x).
A) p(x) =1
x3 � 7
B) q(x) = 3px + 7
C) r(x) = 3px + 7
D) v(x) = 3px � 7
Check your answer by ...
54

INVERSE FUNCTIONS
Example. Find the inverse of the function:
f (x) =3x + 1x � 6
55
INVERSE FUNCTIONS
Extra Example. Find the inverse of the function: f (x) =7 � x
2x + 3Find the domain and range of f (x) and f�1(x).
56

INVERSE FUNCTIONS
Example. Consider the function f (x) = x2 + 4.
1. f (x) does not have an inverse that is a function. Why not?
2. Restrict the domain of f (x) so that it has an inverse that is a function. Call therestricted f (x) by the name f̂ (x).
3. Find f̂�1(x).
4. What are the domain and range of f̂ (x) and f̂�1(x)
5. Draw f̂ (x) and f̂�1(x) on the same axes.
57

INVERSE FUNCTIONS
Extra Example. Find f�1(x), where f (x) =p
x + 1. Graph f�1(x) on the same axes asf (x).
58

INVERSE FUNCTIONS
For the function f (x) =p
x + 1, what is:
• the domain of f ?
• the range of f ?
• the domain of f�1?
• the range of f�1 ?
59

INVERSE FUNCTIONS
Extra Example. According to math lore, if you are age x, the oldest person that it isokay for you to date is given by the formula d(x) = 2x � 14. Plug in your own age for
x and see how old a person you can date.
Suppose you want to date a younger person instead of an older person. Invert theformula to find out how young a person someone of a given age can date.
Plug in your own age for x into d�1(x) and see how young a person you can date.
60