fund nature, fund the future
TRANSCRIPT

Fund Nature, Fund the Future
EU Recovery Plans miss the triple win opportunity for nature, climate and the economy
June 2021

Fund Nature, Fund the Future
2
About this report This report provides quantitative analysis of ten EU National Resilience and Recovery Plans. It forms a key analytical perspective of the Green & Nature Positive Recovery Partnership, which is coordinated by Climate & Sustainability and comprised of Vivid Economics, Nature4Climate, the Club of Rome, Bankwatch, Euronatur, the ZOE-Institute and the New Economics Foundation, with the funding support of the MAVA Foundation.
This anaylsis by Vivid Economics complements the Recovery Index for Transformative Change,1 jointly developed by the ZOE-Institute and New Economics Foundation, as well as the assessment of the NRRPs of ten Central and Eastern European countries by Bankwatch and Euronatur.2
This report was authored by Jeffrey Beyer with analysis and country profiles led by Daniel Waring and supported by Alice Vandermosten. Errors and omissions remain those of the authors.
Vivid Economics is a leading strategic economics consultancy with global reach. We strive to create lasting value for our clients, both in government and the private sector, and for society at large.
We are a premier consultant in the policy-commerce interface and resource- and environment-intensive sectors, where we advise on the most critical and complex policy and commercial questions facing clients around the world. The success we bring to our clients reflects a strong partnership culture, solid foundation of skills and analytical assets, and close cooperation with a large network of contacts across key organisations.
Comments and queries are welcomed and can be directed towards Jeffrey Beyer at [email protected].
1 ZOE-institut. (2021). Recovery Index for Transformative Change. https://zoe-institut.de/en/project/a-green-economic-recovery-in-europe/ 2 Bankwatch& EuroNatur. (2021). Building back better: How EU Member States fail to spend the recovery fund for nature.
Acknowledgements The authors thank Climate & Sustainability for their support, especially Mathieu Logeais for his review and coding of the NRRPs, and Elise Buckle for her coordination of the Green & Nature Positive Recovery Partnership.
Climate & Sustainability is based in Switzerland and has been facilitating, growing and coordinating a platform of collaboration for change-makers. Its vision is focused on partnership building through "radical collaboration", connecting people and organisations that share the same sense of urgency. Partners are leveraging positive impacts by working together as One team for One Planet, going beyond institutional boundaries to accelerate action and achieve a greater positive impact for people and the planet.3
The authors thank MAVA for funding this work. The
MAVA Foundation for Nature aims to conserve
biodiversity for the benefit of people and nature by
funding, mobilising and strengthening our partners
and the conservation community. MAVA envisage
a future where biodiversity flourishes, especially in
the Mediterranean, coastal West Africa and
Switzerland; the global economy supports human
prosperity and a healthy planet; and the
conservation community is thriving.
https://bankwatch.org/wp-content/uploads/2021/05/2021-05-19_Building_Back_Biodiversity_final.pdf 3 Climate and Sustainability. www.climate-sustainability.org

Fund Nature, Fund the Future
3
Executive Summary
The EU National Resilience and Recovery Plans (NRRPs) miss a major opportunity to invest in a nature-positive recovery. The NRRPs aim to mitigate the economic and social impact of the COVID-19 pandemic and build a more sustainable and cohesive Europe-wide economy. They outline how the €672.5 billion4 Resilience and Recovery Facility (RRF) will be invested to advance the EU’s green transition among other priorities like digital transformation and competitiveness. While the NRRPs largely deliver on the climate agenda, they do not form a coherent response to the multiple crises of climate change, biodiversity loss and the economic ramifications of COVID-19. Furthermore, the EU has no adequate mechanism to assess their impact upon nature. Vivid Economics analysis of the nature impact of ten NRRP’s is striking: only 8% of spending enhances nature, which misses a major opportunity to invest in a nature-positive recovery, while 10% of spending harms nature, showing an outsized neglect of nature considerations, while no sufficient conditions ensure that the rest of the spending is nature-positive.
Nature-based solutions (NBS) outperform some of the most common investments seen in the NRRPs on several fronts: immediate employment and economic stimulus, speed of implementation, and broad geographic applicability. In their first year of implementation, NBS produce an average of 60% of both their lifetime jobs and economic impact (gross value-added, or GVA), compared to less than 40% of lifetime jobs and GVA in the first year of a set of typical NRRP investments.5 They therefore support the economy at its most critical time of need, and ensure public spending competes less with the private sector in later years when the economy has recovered and approaches full employment. The training needs for NBS are often lower than for other measures, meaning they can rapidly employ displaced workers with lower upskilling demands. The broad geographic applicability of NBS like agroforestry and reforestation also means that they can be targeted at particularly hard-hit areas, including rural places where new employment opportunities can be harder to identify.
Despite these benefits, investment in NBS comprise only 1% of the NRRPs analysed, taking insufficient advantage of NBS’s strong potential to unlock a triple win for climate, nature and the economy, and barely addressing the need to strengthen the EU’s natural capital. NBS provide habitats, support biodiversity, build natural resilience and bring health benefits. They also deliver outsized returns in terms of job creation, gross value-added to the economy, and carbon sequestration. Detailed analysis shows the four NBS of reforestation, agroforestry, wetland restoration and urban greening produce an average of 29 jobs, EUR 1.8 million GVA and 1,700 tCO2e of emission reductions per €1 million invested over their lifetime. This compares to 33 jobs, €1.7 million GVA and an increase in emissions of 1,200 tCO2e created by the set of typical NRRP investments. This demonstrates NBS are competitive stimulus measures, even before accounting for their support to nature. With these competitive potential benefits and millions of hectares of land available for nature-based solutions, the NRRPs miss an opportunity to score a triple win for climate, nature and the economy.
When assessed using the Greenness of Stimulus Index (GSI) methodology, the NRRPs perform well on their climate impact with an average score of 75, but relatively poorly for their nature impact, with an average score of just 5. The ten NRRPs assessed all have positive GSI scores for their impact upon the climate, scoring an average of 75 on a scale from -100 to +100. By contrast, four of the ten NRRPs have a
4€672.5 billion in 2018 prices. This breaks down into €312.5 billion in grants and €360 billion in loans. 5The reference set of investments was modelled as a proxy for other measures in the NRRPs and includes housing, green roofing retrofits, green window retrofits, rooftop solar, electric cars, electric buses, electric vehicle infrastructure, mining, roads, and rail.

Fund Nature, Fund the Future
4
negative GSI score for their impact upon nature, and the average score for nature is just 5. This means that, despite hundreds of billions of euros being invested through the NRRPs, nature will see only marginal benefits, and in some cases, it will be damaged.
Climate-positive investments outweigh nature-positive investments by a factor of 6, while nature-negative investments outweigh climate-negative investments by a factor of 9. From the investments across ten NRRPs affecting the energy, transport, industry, waste and agriculture sectors, 98% of climate-relevant spending (€240 billion) will reduce emissions, while only 46% of nature-relevant spending (€40 billion) will strengthen nature. This means that the majority of nature-relevant spending – €47 billion – is likely to damage nature and biodiversity, showing a disproportionate neglect of nature and highlighting the need for a careful appraisal of nature impacts in public spending decisions.
Unbalanced spending between climate- and nature-relevant investments shows a lack of holistic coherence in the NRRPs and reduce the final GSI scores of all NRRPs studied, resulting in an average final GSI score of -7. Investments that benefit nature and climate are both crucial since they are mutually reinforcing. Investments in circular economy, resource efficiency, forest resilience and coastline protection all deliver climate and nature gains. We considered the balance of spending between investments that impact upon climate and those that impact upon nature using a 50:50 split as the optimal allocation to determine a final GSI score, and found that all NRRPs heavily disfavour nature-relevant spending.
To improve the impact of public finance in the future, a rigorous appraisal of its impact upon both nature and climate must be carried out using a robust and consistent framework that brings transparency to spending decisions and helps governments make the most of public spending. Methodologies that carefully assess the impact of spending on nature should be developed and adopted to facilitate robust decision-making. While NRRP spending is governed by the Do No Significant Harm principal, which calls for spending to have no negative environmental impact, this minimum condition has not been applied robustly enough to prevent harm to nature and does not go far enough to catalyse a green transition. Requirements on public finance should go further to actively improve nature and climate. Such actions will help to ensure that public finance not only protects but also enhances nature, biodiversity and the climate, and in doing so, actively builds the long-term health, sustainability and resilience of society.

Fund Nature, Fund the Future
5
Contents
1 METHODOLOGY ............................................................................................................................................................. 9
1.1 INDEXING ANALYSIS ..................................................................................................................................................... 9 1.2 ECONOMIC IMPACT ANALYSIS ...................................................................................................................................... 11
2 SUMMARY OF COUNTRY PERFORMANCE ................................................................................................................... 13
2.1 NATURE-BASED SOLUTIONS ......................................................................................................................................... 16
3 INDIVIDUAL COUNTRY ANALYSES THROUGH THE GSI ................................................................................................ 20
3.1 BULGARIA ................................................................................................................................................................ 20 3.2 FRANCE ................................................................................................................................................................... 22 3.3 GERMANY ................................................................................................................................................................ 24 3.4 GREECE ................................................................................................................................................................... 26 3.5 ITALY ....................................................................................................................................................................... 28 3.6 POLAND .................................................................................................................................................................. 30 3.7 PORTUGAL ............................................................................................................................................................... 32 3.8 SLOVAKIA ................................................................................................................................................................. 34 3.9 SLOVENIA ................................................................................................................................................................ 36 3.10 SPAIN ...................................................................................................................................................................... 38
4 INDIVIDUAL COUNTRY ANALYSES THROUGH THE I3M ............................................................................................... 40
4.1 BULGARIA ................................................................................................................................................................ 40 4.2 FRANCE ................................................................................................................................................................... 44 4.3 GERMANY ................................................................................................................................................................ 48 4.4 ITALY ....................................................................................................................................................................... 52 4.5 POLAND .................................................................................................................................................................. 56
APPENDIX 1: GSI METHODOLOGY ........................................................................................................................................ 60
APPENDIX2: INTERVENTION CODES ..................................................................................................................................... 67
APPENDIX 3: EXAMPLE DATASHEET ..................................................................................................................................... 70
List of tables
Table 1 Summary of positive policy archetypes .............................................................................................. 61 Table 2: Summary of negative policy archetypes ............................................................................................ 62 Table 3 Spending profiles for reforestation in France .................................................................................... 75
List of figures
Figure 1: Investment targeting the five most environmentally intensive sectors ............................................. 13 Figure 2: Average allocation of investments that impact upon nature, climate or both .................................. 14 Figure 3: Breakdown of NRRPs by investment into measures positively and negatively affecting climate,
nature or both ..................................................................................................................................... 14 Figure 4: Assessment of the NRRP's climate component ................................................................................... 15

Fund Nature, Fund the Future
6
Figure 5: Assessment of the NRRP's nature component .................................................................................... 15 Figure 6: NRRP impact on climate and nature outcomes ................................................................................... 16 Figure 7: Jobs created per million Euros by intervention, by year ..................................................................... 17 Figure 8: Value added over time per Euro by intervention ................................................................................ 17 Figure 9: Net emissions over the project lifetime ............................................................................................... 18 Figure 10: Nature and climate impact, split by sector ........................................................................................ 20 Figure 11: Bulgaria - Index scores ....................................................................................................................... 20 Figure 12: Spending split affecting climate and nature ...................................................................................... 20 Figure 13: Spending relative to GDP ................................................................................................................... 21 Figure 14: France - Index Scores ......................................................................................................................... 22 Figure 15: Spending split affecting climate and nature ...................................................................................... 22 Figure 16: Nature and climate impact split by sector ......................................................................................... 22 Figure 17: Spending relative to GDP ................................................................................................................... 23 Figure 18: Germany - Index Scores ..................................................................................................................... 24 Figure 19: Spending split affecting climate and nature ...................................................................................... 24 Figure 20: Nature and climate impact split by sector ......................................................................................... 24 Figure 21: Spending relative to GDP ................................................................................................................... 25 Figure 23: Greece – Index scores ........................................................................................................................ 26 Figure 22: Spending split affecting climate and nature ...................................................................................... 26 Figure 24: Nature and climate impact split by sector ......................................................................................... 26 Figure 25: Spending relative to GDP ................................................................................................................... 27 Figure 27: Italy - Index Scores .............................................................................................................................. 28 Figure 26: Spending split affecting climate and nature ...................................................................................... 28 Figure 28: Index Scores ........................................................................................................................................ 28 Figure 29: Nature and climate impact split by sector ......................................................................................... 28 Figure 30: Spending relative to GDP ................................................................................................................... 29 Figure 31: Spending split affecting climate and nature ...................................................................................... 30 Figure 32: Poland - Index scores ......................................................................................................................... 30 Figure 33: Nature and climate impact split by sector ......................................................................................... 30 Figure 34: Spending relative to GDP ................................................................................................................... 31 Figure 35: Spending split affecting climate and nature ...................................................................................... 32 Figure 36: Portugal - Index scores ....................................................................................................................... 32 Figure 37: Nature and climate impact split by sector ......................................................................................... 32 Figure 38: Spending relative to GDP ................................................................................................................... 33 Figure 39: Spending split affecting climate and nature ...................................................................................... 34 Figure 40: Slovakia - Index scores ........................................................................................................................ 34 Figure 41: Nature and climate impact split by sector ......................................................................................... 34 Figure 42: Spending relative to GDP ................................................................................................................... 35 Figure 43: Spending split affecting climate and nature ...................................................................................... 36 Figure 44: Index scores ........................................................................................................................................ 36 Figure 45: Nature and climate impact split by sector ......................................................................................... 36 Figure 46: Spending relative to GDP ................................................................................................................... 37 Figure 47: Spending split affecting climate and nature ...................................................................................... 38 Figure 48: Index scores ........................................................................................................................................ 38 Figure 49: Nature and climate impact split by sector ......................................................................................... 38 Figure 50: Spending relative to GDP ................................................................................................................... 39 Figure 51: Value added over time by Bulgaria’s NBS .......................................................................................... 40 Figure 52: Jobs created across the value chain by Bulgaria’s NBS ..................................................................... 40 Figure 53: Net jobs gain – high-jobs scenario ..................................................................................................... 41

Fund Nature, Fund the Future
7
Figure 54: Emissions differential – high-jobs scenario ....................................................................................... 41 Figure 55: Net value gain – high-jobs scenario ................................................................................................... 42 Figure 56: Net jobs gain – proportional to opportunity scenario ....................................................................... 42 Figure 57: Emissions differential – proportional to opportunity scenario ......................................................... 43 Figure 58: Net value added – proportional to opportunity scenario ................................................................. 43 Figure 59: Value added over time by France’s NBS ............................................................................................ 44 Figure 60: Jobs created across the value chain by France’s NBS ....................................................................... 44 Figure 61: Net jobs gain – high-jobs scenario ..................................................................................................... 45 Figure 62: Emissions differential – high-jobs scenario ....................................................................................... 45 Figure 63: Net value gain – high-jobs scenario ................................................................................................... 46 Figure 64: Net jobs gain – proportional to opportunity scenario ....................................................................... 46 Figure 65: Emissions differential – proportional to opportunity scenario ......................................................... 47 Figure 66: Net value gain – proportional to opportunity scenario ..................................................................... 47 Figure 67: Net jobs gain – high jobs scenario ..................................................................................................... 48 Figure 68: Emissions differential – high jobs scenario ........................................................................................ 49 Figure 69: Net value gain – high jobs scenario ................................................................................................... 49 Figure 70: Net jobs gain – proportional to opportunity scenario ....................................................................... 50 Figure 71: Emissions differential – proportional to opportunity scenario ......................................................... 50 Figure 72: Net value addition – proportional to opportunity scenario .............................................................. 51 Figure 73: Value added over time by Italy’s NBS ................................................................................................ 52 Figure 74: Jobs created across the value chain by Italy’s NBS ............................................................................ 52 Figure 75: Net jobs gain – high jobs scenario ..................................................................................................... 53 Figure 76: Emissions differential – high jobs scenario ........................................................................................ 53 Figure 77: Net value gain – high jobs scenario ................................................................................................... 54 Figure 78: Net jobs gain – proportional to opportunity scenario ....................................................................... 54 Figure 79: Emissions differential – proportional to opportunity scenario ......................................................... 55 Figure 80: Net value addition – proportional to opportunity scenario .............................................................. 55 Figure 81: Value added over time by Poland’s NBS ............................................................................................ 56 Figure 82: Jobs created across the value chain by NBS in Poland ...................................................................... 56 Figure 83: Net jobs gain – high jobs scenario ..................................................................................................... 57 Figure 84: Emissions differential – high jobs scenario ........................................................................................ 57 Figure 85: Net value gain – high jobs scenario ................................................................................................... 58 Figure 86: Net jobs gain – proportional to opportunity scenario ....................................................................... 58 Figure 87: Emissions differential – proportional to opportunity scenario ......................................................... 59 Figure 88: Net value addition – proportional to opportunity scenario .............................................................. 59 Figure 89 Overall methodology .......................................................................................................................... 72 Figure 90 Simplified representation of the Eora MRIO ...................................................................................... 73 Figure 91 Representation of the I3M system ..................................................................................................... 74

Fund Nature, Fund the Future
8
List of boxes
Box 1: How RRF funding is allocated to Member States ............................................................................... 19 Box 2 Supporting job creation by channelling investments towards nature-based solutions .................... 41 Box 3 Investing in nature-based solutions in proportion to the size of the opportunity ............................ 42 Box 4 Supporting job creation by channelling investments towards nature-based solutions .................... 45 Box 5 Investing in nature-based solutions proportional to opportunity ..................................................... 46 Box 6 Supporting job creation by channelling investments towards nature-based solutions .................... 48 Box 7 Investing in nature-based solutions proportional to opportunity ..................................................... 49 Box 8 Supporting job creation by channelling investments towards nature-based solutions .................... 53 Box 9 Investing in nature-based solutions proportional to opportunity ..................................................... 54 Box 10 Supporting job creation by channelling investments towards nature-based solutions .................... 57 Box 11 Investing in nature-based solutions proportional to opportunity ..................................................... 58

Fund Nature, Fund the Future
9
1 Methodology
Vivid Economics studied ten NRRPs to determine their environmental and economic impact using two
respected modelling methodologies, the Greenness of Stimulus Index (GSI) and the I3M. We extracted 504
spending measures contained in the NRRPs of Bulgaria, France, Germany, Greece, Italy, Poland, Portugal,
Spain, Slovenia, and Slovakia. Of the 275 measures that were deemed environmentally relevant, we analysed
their potential to have either a positive or negative impact upon nature and upon the climate. For five of the
countries (Bulgaria, France, Germany, Italy and Poland), we assessed the impact of nature-based solutions
(NBS) in terms of jobs, economic activity and greenhouse gas emissions, and developed scenarios to
determine the net effect of reallocating NRRP spending towards NBS. An overview of the adapted GSI
methodology used to produce the NRRP’s index scores is set out below, along with the method used to
assess the economic and emissions impacts of nature-based solutions. More detailed methodological
information on the GSI and I3M is found in Appendix 1 and 4 respectively.
1.1 Indexing analysis
The NRRPs were analysed using an adapted GSI methodology, which assesses the effectiveness of countries’
stimulus efforts in advancing a green economic recovery from COVID-19. The GSI provides a method to
gauge the likely impact of economic stimulus measures, to track countries’ progress over time, and to
identify and recommend measures for improving the effectiveness of those responses. It evaluates the
greenness of stimulus packages by focusing on the impact of policies in five sectors, namely agriculture,
energy, industry, waste and transport, which have a particularly intensive effect on climate and environment.
Every spending measure in the NRRPs was reviewed and classified with a policy archetype to determine the
nature of the intervention. The GSI contains a toolkit of measures that governments can use to shape the
environmental impact of their economic stimulus, based on analysis of actual measures announced to date.
Environmentally positive measures include, for example, investment in nature-based solutions or loans and
grants for low carbon investments. Environmentally harmful measures may include bailouts without any
environmental conditionality, or subsidies and tax reductions for environmentally harmful products.
Measures in the NRRP were classified according to the archetypes developed for the GSI, which are outlined
in Appendix 2 and coded in a datasheet like the one in Appendix 3.
Each measure was assessed both in terms of the likely intensity of its impact on nature and climate, and for
its likely degree of coverage. The intensity of a measure depends on three components: the irreversibility of
environmental damage or gain, the concentration or diffusion of impact on environmental and natural
systems, and the level of lock-in to either positive or negative development resulting from the policy. In
terms of coverage, most of the measures in the NRRPs are direct fiscal spending rather than unquantified
policy changes, so their coverage score is determined by the monetary size of the policy.
The policy evaluation exercise enables the production of an index score that indicates the extent to which
the NRRPs contribute positively or negatively to the environment. This index is constructed using the GSI
methodology by combining the flow of stimulus into five key sectors with an indicator of each sector’s
environmental impact, the latter accounting for both historical trends and specific measures taken under the
country’s stimulus. The impact indicator assigns a greenness value (positive or negative) to each sector for
every country based on the methodology discussed below. The overall sign is an indicator of the total fiscal

Fund Nature, Fund the Future
10
spending categorised as having either a positive or negative impact on the environment. The final index for
each country is an average of sectoral impact, normalised to a scale of -100 to +100.
To form a more nuanced appraisal of the NRRPs, the impact of measures on climate and nature were
considered separately rather than as a composite score. The standard GSI model considers the aggregate
environmental impact of each measure, meaning that spending is classified as environmentally helpful or
harmful, despite potentially disparate impacts between nature and climate. When analysing the NRRPs,
another layer of granularity was added to differentiate between spending that impacts upon nature,
spending that impacts upon climate, or both. For example, investments in liquid biofuels are assessed as
positive for the climate because they tend to reduce emissions compared to petrol or diesel, but as negative
for nature because they use land, irrigation and fertilisers that are likely to harm biodiversity and water
resources.
A baseline score that reflects the underlying environmental performance of each country’s economy is also
assigned to determine impact of certain stimulus measures. The baseline is composed of nature and climate
indicators, both weighted in equal measure, from Yale’s Environmental Performance Index, GermanWatch’s
Climate Change Performance Index, and the Climate Action Tracker. Nature indicators relate to Life Below
Water and Life Above Land (UN Sustainable Development Goals 14 and 15). Climate indicators relate to
greenhouse gas emission metrics and a country’s performance on its climate commitments. The baseline
assigns weight to measures not sufficiently captured under the 5-sector categorisation and it serves a
balancing mathematical function in the index equation to constrain minimum and maximum index scores to
between -100 and +100. The baseline is why some countries that have a positive or negative index
component in excess of 100 invariably achieve an index score within the range.
The disproportionate allocation of spending between nature and climate in the NRRPs inspired an
adjustment to the method to highlight imbalances between investments that impact upon nature and
climate. While the disaggregation of nature and climate impacts in the policy assessment phase enables
disparate policies like biofuels or hydropower to be differentially modelled, it does not illustrate any
imbalance in funding allocation between nature and climate. Climate and nature are both vital, mutually
beneficial and intricately linked. As such, a 50:50 optimal funding allocation between the two was used to
assess how holistically the plans consider both environmental dimensions. Viewed side-by-side with the
‘classic’ index score, this allocation adjusted index allows the reader to identify when funding
disproportionately flows to either climate- or nature-relevant investments, with imbalanced plans penalised
in their final index score.
To accurately determine their GSI score, the NRRP’s stimulus measures were downscaled to reflect the
estimated first-year spend. The GSI model is calibrated to the annual size of a country’s economy, so
measuring the impact of stimulus measures requires them to be scaled to the same timeframe. The EU’s
disbursement schedule for NRRPs allows for an upfront disbursal of 13% of their total value followed by bi-
annual disbursals of funding over the 5-year implementation period. The modelling therefore assumed that
13% of the NRRP’s total value would be released on day 1, and the remaining 87% would be disbursed in
equal payments ten times over five years, i.e. in 8.7% tranches every six months. The assumed first-year
spend for each NRRP was therefore 30.4% of the total value.6 Specific investments values quoted in this
6This equals 13% + 8.7% + 8.7%, accounting for the disbursal made on day 1, day 183 and day 365

Fund Nature, Fund the Future
11
document therefore tend to be quoted as an assumed first-year spend, representing 30.4% of their total
value.
1.2 Economic impact analysis
Five NRRPs were further analysed using an economic impact model called I3M to determine the likely jobs,
economic activity and emissions impacts from nature-based based solutions. Bulgaria, France, Germany, Italy
and Poland were selected for further analysis because they represent a geographic spread across Europe and
are among the largest recipients of RRF funding. NBS were isolated because this analysis is particularly
interested in their economic and environmental potential. The entire NRRP was not analysed using the I3M
model because it is beyond the scope of the report. Instead, ten alternative interventions7 were modelled as
a reference basket that served as a proxy to the whole NRRP to enable net changes in economic activity to
be estimated through scenarios.
Impact modelling was used to determine direct and indirect impacts from investment in different
interventions per €1 million invested. I3M works by modelling the impacts of investments and other
interventions as shocks to final demand in specific sectors. Multiplying a shock vector (a change in final
demand for every sector) by a matrix of impacts produces the increase in sectoral output needed to satisfy
the increase in final demand. Relationships between sectoral output and variables such as employment,
gross value-added (GVA) and GHG emissions, determined from a database called Eora, are used to calculate
the impacts of the shock. The shock vector itself determines the ‘direct’ impacts, while the additional
impacts on sectoral output are used to calculate the ‘indirect’ impacts.
The time period during which the impact from an intervention occurred was also modelled. The ‘short-term’
impacts of interventions are defined as those that result from capital expenditure (CAPEX) associated with
the intervention. The ‘long-term’ impacts result from the operation phase of the intervention i.e. the
operating expenditure (OPEX). In this case, the long-term impacts are calculated on an annual basis.
To characterise the shocks to final demand and the emissions impact of interventions, a set of CAPEX and
OPEX profiles were developed alongside emissions and sequestration estimates drawn from the literature
and based on typical investments in each of the target sectors and for NBS. This involves an allocation of
investment (CAPEX) to sectors such as construction and the manufacturing of transport equipment. An
annual OPEX/CAPEX ratio is calculated, which determines the amount of OPEX associated with an investment
amount. The OPEX is spent in the target sector itself (Agriculture, Transport etc.). For NBS, the per hectare
spending profiles for NBS interventions were determined based on a range of data sources, including a
previous Vivid project with The Nature Conservancy (TNC). These sources provide data from a range of
countries, and extrapolations to other countries (depending on the intervention), are based on income level,
region, or biome (temperate/tropical). The carbon sequestration values for each intervention were
determined by taking per hectare sequestration values from the literature.
Using this input data, two scenarios were developed to illustrate the impact of reallocating a sum of NRRP
spending away from a proxy basket of alternative investments and towards NBS. In both scenarios, the
modelled monetary sum reallocated equalled 7.5% of the total value of the NRRP, which reflects the EU’s
ambition of dedicating 7.5% of the 2021-2027 Multiannual Financial Framework to biodiversity objectives as
7The alternative interventions include electric buses, electric cars, electric vehicle infrastructure, housing, green roofing retrofits, green windows retrofits, residential rooftop solar, rail, roads and mining

Fund Nature, Fund the Future
12
of 2024.8 That sum was reallocated in each scenario by removing funding from among the ten modelled
alternative investments and dedicating it to the four NBS.
The two scenarios modelled were dubbed the ‘high jobs’ scenario and the ‘proportional to opportunity’
scenario. Under the high jobs scenario, 20% of the sum was removed from each of the 3 alternative
investments with the worst-performing jobs figures (totalling 60% of the sum), and 40% of the sum was
equally removed from the remaining 7 alternatives. Then 60% of the sum was dedicated to best-performing
NBS in terms of job creation, 30% to the NBS with the second-best jobs numbers, with 5% dedicated to each
of the last two NBS. Under the proportional to opportunity scenario, 10% of the sum was drawn from each
of the 10 alternative investments (totalling 100% of the sum). Then it was dedicated to the NBS
proportionally to the number of available hectares of land that could support each NBS in each country. For
example, if a country had 50 hectares of available land for agroforestry, 30 hectares for reforestation, 15
hectares for wetland restoration and 5 hectares for urban greening (totalling 100 hectares), the sum would
be split 50%, 30%, 15% and 5% into those NBS respectively.
Finally, the jobs, GVA and emissions impacts per €1 million invested were multiplied by the reallocations in
each scenario to determine the net effect. This quotient illustrates the economic and climate impact of
different investment choices that could have been made in the NRRPs. These figures provide quantitative
evidence to policymakers and civil society about the relative merits of NBS compared to alternative
investments.
8European Commission. (2021). Biodiversity financing. https://ec.europa.eu/environment/nature/biodiversity/financing_en.htm

Fund Nature, Fund the Future
13
2 Summary of country performance
The NRRPs demonstrate a widespread effort to support a green transition, but they largely ignore nature-
positive investments and fail to capture the jobs, greater economic activity and climate co-benefits afforded
by nature-based solutions. Despite generally strong performance on tackling climate change, the ten NRRPs
studied show that nature has not been systematically considered throughout the plans. Nature-positive
investments comprise only 8% of total spending, and are less than one-sixth of the value of climate-positive
investments. Direct spending on nature-based solutions comprises 1% of total investment. The near-absence
of spending on nature-based solutions comes at the cost of thousands of jobs and millions of euros of
forfeited economic activity in each of the countries analysed.
Fifty-one percent of investments flow directly towards environmentally relevant sectors, meaning that the
NRRPs have a large potential to affect climate and nature, and therefore countries’ Greenness of Stimulus
Index (GSI) score. This is a significantly larger proportion than for global stimulus as assessed by the fifth
edition of the global GSI,9 where just 31% has flowed towards the five environmentally relevant sectors of
energy, industry, agriculture, transport and waste since the start of the pandemic. Figure 1 shows the NRRP’s
breakdown of spending into those sectors, with the balance of investment going towards measures like
digital transition, education and training, health and social measures.
Figure 1: Investment targeting the five most environmentally intensive sectors
Of the environmentally relevant component, the NRRPs largely fail to consider the environment holistically,
with investments that impact upon nature hugely outweighed by those that affect climate, and often
benefiting climate at nature’s expense. Figure 2 shows that nearly three-quarters of the direct
environmentally relevant spending affects only the climate, with less than 2% exclusively affecting nature.
Where investments impact upon both climate and nature, such as for low carbon infrastructure investment
or energy generation like dams, nature is seldom protected or enhanced.
9 Vivid Economics. (2021). Greenness of Stimulus Index. https://www.vivideconomics.com/wp-content/uploads/2021/02/Greennes-of-Stimulus-Index-5th-Edition-FINAL-VERSION-09.02.21.pdf
51%49%
Direct envrionmentally relevant spending Other spending

Fund Nature, Fund the Future
14
Figure 2: Average allocation of investments that impact upon nature, climate or both
While most environmentally relevant investments in the NRRPs are good for the environment, those with a
negative impact disproportionately affect nature. Of the 275 environmentally relevant spending policies
reviewed, 213 were deemed to have a positive impact on both climate and nature, while 29 had a negative
impact on both, and 33 had mixed impact on nature and climate (i.e. good for one and bad for the other).
Figure 3 shows the proportion of spending that has a positive or negative impact on climate and nature and
highlights the disproportionately negative impact upon nature. Coupling this mixed quality of the
investments with the uneven volumes shown in Figure 2 demonstrates both a missed opportunity to invest
in nature, and an outsized neglect of nature considerations in negative spending.
Figure 3: Breakdown of NRRPs by investment into measures positively and negatively affecting climate, nature or both
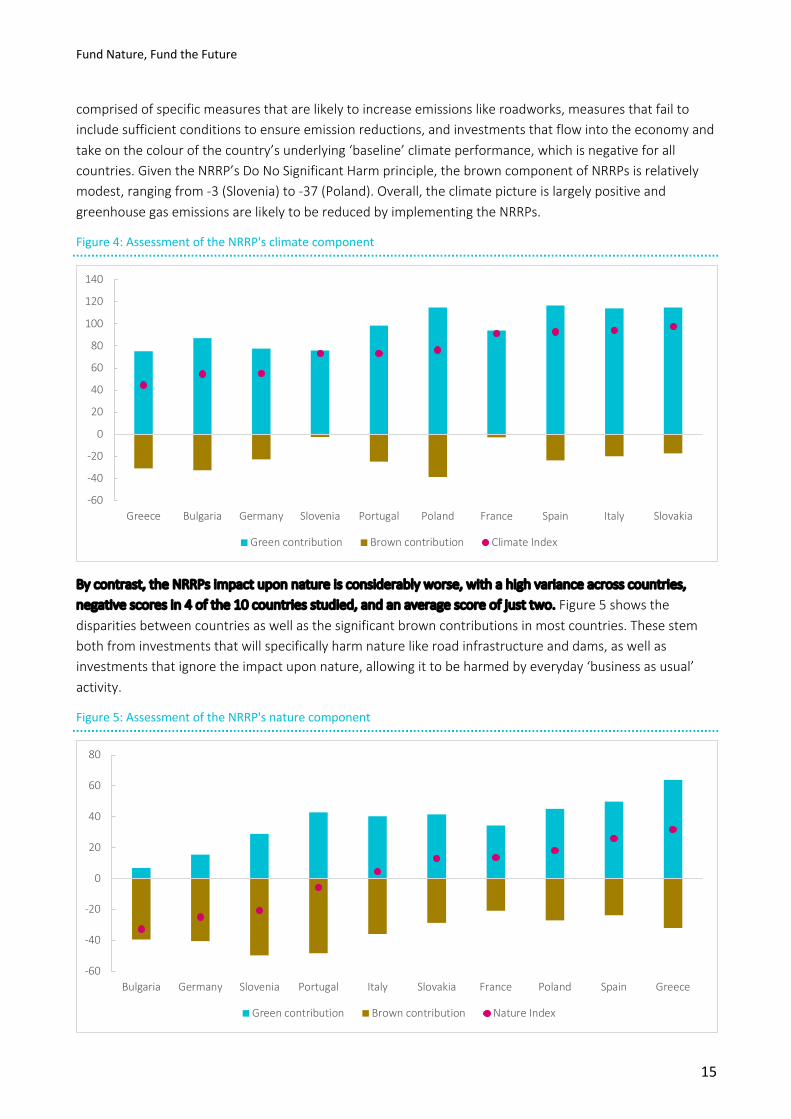
Studying the NRRPs using an adapted Greenness of Stimulus index methodology shows their climate
component to be strong, with positive climate scores across the board and an average score of 74. The
European Commission’s requirement to invest at least 37% of the NRRP into climate investments and
reforms has delivered plans with significant investments in areas like renewables, energy efficiency retrofits,
low carbon transport and industrial decarbonisation. These climate-friendly investments have resulted in
very large green contributions in the index assessment shown in Figure 4. The brown contribution is
2%
68%
30%
Nature Climate Both
Nature Climate
Positive Negative Mixed
Both
Fund Nature, Fund the Future
15
comprised of specific measures that are likely to increase emissions like roadworks, measures that fail to
include sufficient conditions to ensure emission reductions, and investments that flow into the economy and
take on the colour of the country’s underlying ‘baseline’ climate performance, which is negative for all
countries. Given the NRRP’s Do No Significant Harm principle, the brown component of NRRPs is relatively
modest, ranging from -3 (Slovenia) to -37 (Poland). Overall, the climate picture is largely positive and
greenhouse gas emissions are likely to be reduced by implementing the NRRPs.
Figure 4: Assessment of the NRRP's climate component
By contrast, the NRRPs impact upon nature is considerably worse, with a high variance across countries,
negative scores in 4 of the 10 countries studied, and an average score of just two. Figure 5 shows the
disparities between countries as well as the significant brown contributions in most countries. These stem
both from investments that will specifically harm nature like road infrastructure and dams, as well as
investments that ignore the impact upon nature, allowing it to be harmed by everyday ‘business as usual’
activity.
Figure 5: Assessment of the NRRP's nature component
-60
-40
-20
0
20
40
60
80
100
120
140
Greece Bulgaria Germany Slovenia Portugal Poland France Spain Italy Slovakia
Green contribution Brown contribution Climate Index
-60
-40
-20
0
20
40
60
80
Bulgaria Germany Slovenia Portugal Italy Slovakia France Poland Spain Greece
Green contribution Brown contribution Nature Index

Fund Nature, Fund the Future
16
By combining the amount of spending and the quality of the NRRP’s measures in terms of impact upon both
climate and nature, strong spending on climate-positive measures outweighs the weak or negative impact
on nature, resulting in an average composite index score of 55. This relatively strong performance rewards
the NRRP’s climate-positive spending, but hides the disparities between investments that impact upon
climate and nature and gives the NRRPs a green-tinted sheen. These strong scores do not reflect the fact
that the NRRPs largely fail to holistically consider the overall environmental impact of stimulus spending and
miss an opportunity to create systemic change that mutually benefits both climate and nature.
Recognising the importance of both climate and nature by considering the quality of the NRRP’s stimulus
spending in equal measure to their distributional fairness results in an average final allocation-adjusted index
score of -7.5. Since climate and nature are both vital, mutually beneficial and intricately linked, a 50:50
optimal funding allocation between the two was used to assess how holistically the plans consider both
environmental dimensions. Figure 6 shows the composite index score (red dot) and final allocation-adjusted
score (green dot). In all cases, the NRRP’s heavily lopsided spending profile that disfavours nature-positive
investments means that the final scores are low, and in most cases, net negative.
2.1 Nature-based solutions
Nature-based solutions comprise only 1% of spending in the NRRPs assessed, with large variation between
countries. Nature-based solutions (NBS) differ from investments that impact upon nature in that NBS are
direct investments into the natural world like forests and wetlands, whereas the latter represent
investments that impact upon the natural world, like irrigation systems and wastewater treatment plants.
The NBS included in the NRRPs of Bulgaria, France, Germany, Italy and Poland show a variety of choices,
ranging from sizeable investments in reforestation in France, to no NBS spending at all in Germany. The NBS
measures in the plans of Bulgaria, France, Italy and Poland include coastline resilience, ecological restoration,
protected areas infrastructure, forest resilience and fire prevention, urban greening and urban forestry. To
allow for the impacts of these measures to be modelled, they were classified into four types of NBS, namely
reforestation, agroforestry, wetland restoration and urban parks and gardens.
The relatively modest investment value of €3.7 billion into NBS across the four countries assessed will create
140,000 jobs and €7 billion of economic activity over fifteen years. The jobs, gross value added (GVA) and
-60
-40
-20
0
20
40
60
80
100
120
Bulgaria Germany Slovenia Greece Portugal Italy Slovakia Poland France Spain
Green contribution Brown contribution Index Allocation Adjusted
Figure 6: NRRP impact on climate and nature outcomes

Fund Nature, Fund the Future
17
emissions profiles of each NBS differ between countries, but agroforestry consistently outperforms the other
NBS in terms of jobs and GVA, while reforestation yields the strongest emissions benefits in all cases.
Compared to alternative investments, NBS deliver an outsized number of jobs early, when the stimulus
effect of investments is most needed, but deliver fewer jobs over their lifetime. By their nature, NBS tend to
involve larger first-year capital and labour investments as forests and wetlands are restored and require less
ongoing maintenance. Agroforestry involves ongoing use and cultivation of land, so maintains strong job
numbers over the long term. Figure 7 shows the particularly strong near-term employment benefits of NBS,
which support European economies when employment is needed most, rather than creating jobs that may
compete with the private sector in the longer term.
Figure 7: Jobs created per million Euros by intervention, by year
The economic activity generated from NBS outperforms a basket of alternatives, especially when compared
to environmentally damaging measures like mining and roads, and even when compared to investments
with well-known returns on investment like green building retrofits. Figure 8 shows the particularly strong
benefits of NBS in year one, when stimulus measures are most needed to boost battered economies.
Figure 8: Value added over time per Euro by intervention
0 20 40 60 80
EV InfrastructureGreen Retrofitting…
Green Retrofitting RoofingElectric BusesAgroforestryElectric Cars
HousingParks and Gardens
RoadsRail
Residential Rooftop SolarWetland Restoration
ReforestationMining
0 - 1 1 - 2 2 - 3 3 - 5 5 - 10 10 - 15 15 - 20
0 1 2 3
AgroforestryEV Infrastructure
Green Retrofitting WindowsElectric Buses
Green Retrofitting RoofingParks and Gardens
HousingElectric Cars
Wetland RestorationReforestation
MiningResidential Rooftop Solar
RoadsRail
GVA per Euro investment
0 - 1 1 - 2 2 - 3 3 - 5 5 - 10 10 - 15 15 - 20
Average Jobs Year 1 Total
NBS Basket 22 36
Alternative Basket 16 41
Average GVA Year 1 Total
NBS Basket 1.02 1.76
Alternative Basket 0.62 1.65
Year
Year
Fund Nature, Fund the Future
18
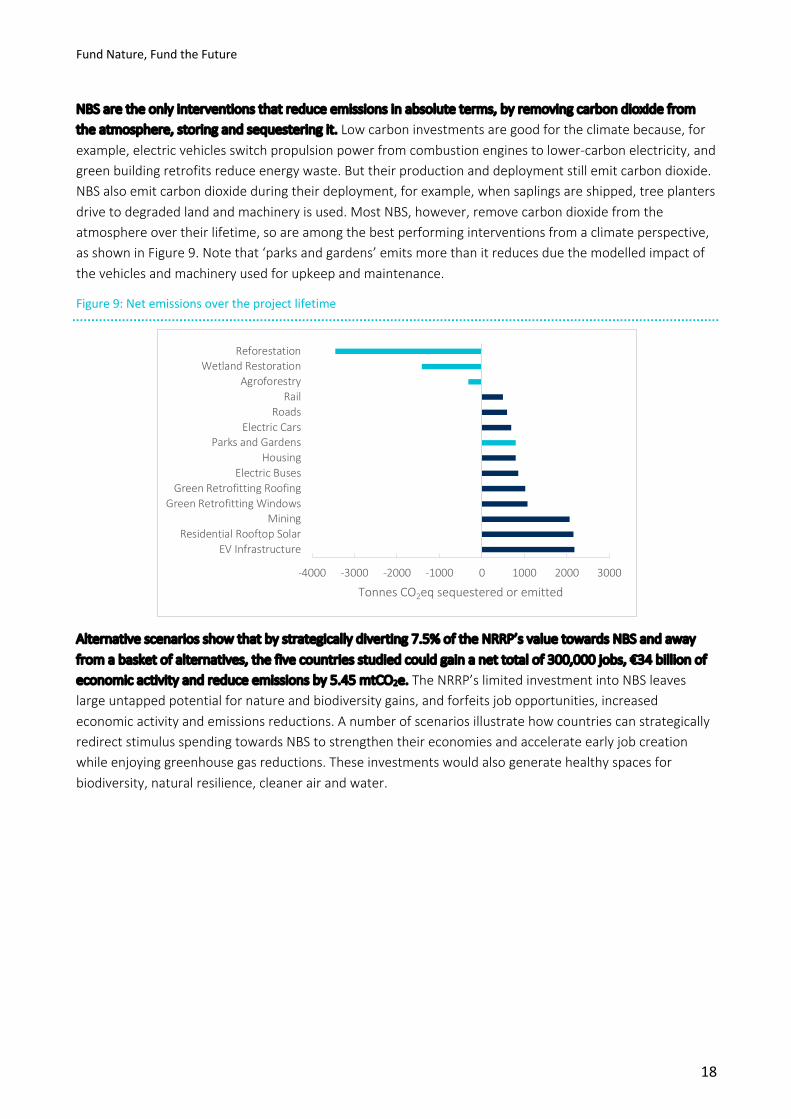
NBS are the only interventions that reduce emissions in absolute terms, by removing carbon dioxide from
the atmosphere, storing and sequestering it. Low carbon investments are good for the climate because, for
example, electric vehicles switch propulsion power from combustion engines to lower-carbon electricity, and
green building retrofits reduce energy waste. But their production and deployment still emit carbon dioxide.
NBS also emit carbon dioxide during their deployment, for example, when saplings are shipped, tree planters
drive to degraded land and machinery is used. Most NBS, however, remove carbon dioxide from the
atmosphere over their lifetime, so are among the best performing interventions from a climate perspective,
as shown in Figure 9. Note that ‘parks and gardens’ emits more than it reduces due the modelled impact of
the vehicles and machinery used for upkeep and maintenance.
Figure 9: Net emissions over the project lifetime
Alternative scenarios show that by strategically diverting 7.5% of the NRRP’s value towards NBS and away
from a basket of alternatives, the five countries studied could gain a net total of 300,000 jobs, €34 billion of
economic activity and reduce emissions by 5.45 mtCO2e. The NRRP’s limited investment into NBS leaves
large untapped potential for nature and biodiversity gains, and forfeits job opportunities, increased
economic activity and emissions reductions. A number of scenarios illustrate how countries can strategically
redirect stimulus spending towards NBS to strengthen their economies and accelerate early job creation
while enjoying greenhouse gas reductions. These investments would also generate healthy spaces for
biodiversity, natural resilience, cleaner air and water.
-4000 -3000 -2000 -1000 0 1000 2000 3000
EV InfrastructureResidential Rooftop Solar
MiningGreen Retrofitting Windows
Green Retrofitting RoofingElectric Buses
HousingParks and Gardens
Electric CarsRoads
RailAgroforestry
Wetland RestorationReforestation
Tonnes CO2eq sequestered or emitted

Fund Nature, Fund the Future
19
Each country is allocated a different amount of the total RRF pot depending on their circumstances. A formula determines the amount of RRF funding to which each Member State is entitled. €312.5 billion is available as grants. 70% of this grant funding is allocated according to the following criteria (increasing with each indicator):
• the Member State's population
• the inverse of its GDP per capita
• its average unemployment rate over the past 5 years (2015-2019) compared to the EU average.
For the remaining 30%, instead of the unemployment rate, the observed loss in real GDP over 2020 and the observed cumulative loss in real GDP over the period 2020-2021 is considered.
Member States can combine RRF and other funding sources in their NRRP. Some Member States like Portugal, Italy and Germany have chosen to include additional funding in the NRRP from national budgets or other sources. The NRRPs analysed here reflect both the RRF component and any additional top-ups.
Box 1: How RRF funding is allocated to Member States

Fund Nature, Fund the Future
20
3 Individual country analyses through the GSI
3.1 Bulgaria
Bulgaria’s NRRP is large and relatively climate-friendly, but investments that impact upon nature do more harm than good and its overall performance is the lowest amongst the countries studied. Figure 10 shows that environmentally relevant investments disproportionately flow towards measures that will affect the climate rather than nature. Figure 11 shows that most of Bulgaria’s climate-relevant spending is green, meaning it will reduce emissions, while the large majority of the spending affecting nature is brown and will damage it. Given the larger volume of climate-friendly spending, Bulgaria’s composite index score of 30 means the NRRP’s aggregate environmental impact is mildly positive, but its heavily uneven split between climate and nature investments reduces its final allocation-adjusted score to -30, making it the worst performer of the 10 countries analysed.
Bulgaria’s investments are diverse and polarising, with industry and transport spending set to yield climate gains at the expense of nature. Figure 12 shows the green component of Bulgaria’s climate score is driven by industrial interventions that have the potential to improve energy efficiency and abate power sector emissions. But many of these interventions ignore the importance of a nature-positive recovery. The nature impact of dams, irrigation developments, dependence on natural gas and scaling-up of industrial activity without sufficient green conditions risk sacrificing nature for economic and climate recovery.
30.04
-30.16-60.00
-20.00
20.00
60.00
100.00
Climate Nature Mixed
Green contribution Brown contribution
Index Allocation adjustedNature Climate Both
Figure 10: Spending split affecting climate and nature Figure 11: Bulgaria - Index scores
Figure 12: Nature and climate impact, split by sector
Fund Nature, Fund the Future
21
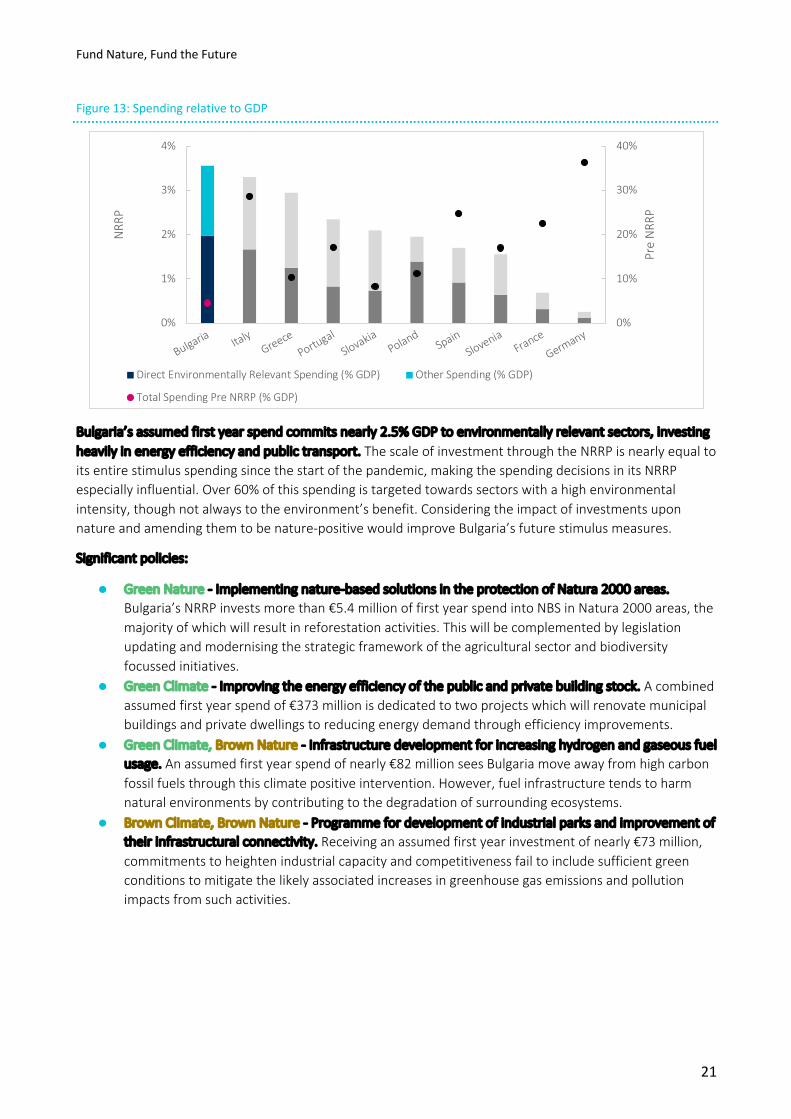
Figure 13: Spending relative to GDP
Bulgaria’s assumed first year spend commits nearly 2.5% GDP to environmentally relevant sectors, investing heavily in energy efficiency and public transport. The scale of investment through the NRRP is nearly equal to its entire stimulus spending since the start of the pandemic, making the spending decisions in its NRRP especially influential. Over 60% of this spending is targeted towards sectors with a high environmental intensity, though not always to the environment’s benefit. Considering the impact of investments upon nature and amending them to be nature-positive would improve Bulgaria’s future stimulus measures.
Significant policies:
• Green Nature - Implementing nature-based solutions in the protection of Natura 2000 areas. Bulgaria’s NRRP invests more than €5.4 million of first year spend into NBS in Natura 2000 areas, the majority of which will result in reforestation activities. This will be complemented by legislation updating and modernising the strategic framework of the agricultural sector and biodiversity focussed initiatives.
• Green Climate - Improving the energy efficiency of the public and private building stock. A combined assumed first year spend of €373 million is dedicated to two projects which will renovate municipal buildings and private dwellings to reducing energy demand through efficiency improvements.
• Green Climate, Brown Nature - Infrastructure development for increasing hydrogen and gaseous fuel usage. An assumed first year spend of nearly €82 million sees Bulgaria move away from high carbon fossil fuels through this climate positive intervention. However, fuel infrastructure tends to harm natural environments by contributing to the degradation of surrounding ecosystems.
• Brown Climate, Brown Nature - Programme for development of industrial parks and improvement of their infrastructural connectivity. Receiving an assumed first year investment of nearly €73 million, commitments to heighten industrial capacity and competitiveness fail to include sufficient green conditions to mitigate the likely associated increases in greenhouse gas emissions and pollution impacts from such activities.
0%
10%
20%
30%
40%
0%
1%
2%
3%
4%
Bulgaria ItalyGreece
PortugalSlovakia
PolandSpain
SloveniaFrance
Germany
Pre
NR
RP
NR
RP
Direct Environmentally Relevant Spending (% GDP) Other Spending (% GDP)
Total Spending Pre NRRP (% GDP)
Fund Nature, Fund the Future
22
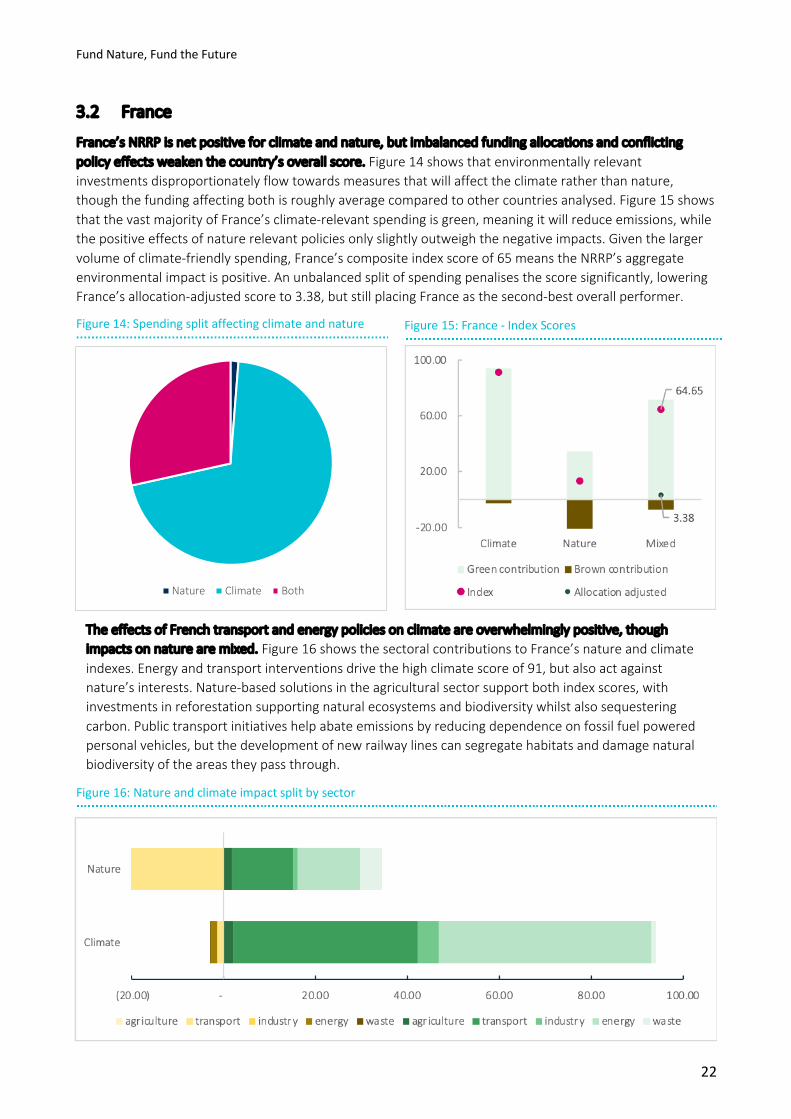
3.2 France
France’s NRRP is net positive for climate and nature, but imbalanced funding allocations and conflicting policy effects weaken the country’s overall score. Figure 14 shows that environmentally relevant investments disproportionately flow towards measures that will affect the climate rather than nature, though the funding affecting both is roughly average compared to other countries analysed. Figure 15 shows that the vast majority of France’s climate-relevant spending is green, meaning it will reduce emissions, while the positive effects of nature relevant policies only slightly outweigh the negative impacts. Given the larger volume of climate-friendly spending, France’s composite index score of 65 means the NRRP’s aggregate environmental impact is positive. An unbalanced split of spending penalises the score significantly, lowering France’s allocation-adjusted score to 3.38, but still placing France as the second-best overall performer.
The effects of French transport and energy policies on climate are overwhelmingly positive, though impacts on nature are mixed. Figure 16 shows the sectoral contributions to France’s nature and climate indexes. Energy and transport interventions drive the high climate score of 91, but also act against nature’s interests. Nature-based solutions in the agricultural sector support both index scores, with investments in reforestation supporting natural ecosystems and biodiversity whilst also sequestering carbon. Public transport initiatives help abate emissions by reducing dependence on fossil fuel powered personal vehicles, but the development of new railway lines can segregate habitats and damage natural biodiversity of the areas they pass through.
Figure 15: France - Index Scores
Figure 16: Nature and climate impact split by sector
Figure 14: Spending split affecting climate and nature
Nature Climate Both

Fund Nature, Fund the Future
23
Figure 17: Spending relative to GDP
Although France’s NRRP contains some innovative environmental policies, nature is underfunded and will struggle to recover at scale without further resources. Dedicating roughly 1% GDP to environmentally relevant causes through their recovery plan, the NRRP is very small compared to funds disbursed since the onset of the pandemic in France. Investments affecting nature receive less than 50% of the funding directed towards climate intensive initiatives.
Significant policies:
• Green Nature - Modernisation of sanitation networks and sewerage treatment. An assumed first year spend of €92 million will be directed towards improving sanitation and sewerage treatment, which could yield substantial benefits for ecosystems local to treatment plants, preventing run-off of waste materials into natural habitats.
• Green Nature, Green Climate - Investments in forest resilience and adaptation towards climate change. Over €136 million will be spent on nature-based solutions interpreted to involve agroforestry and reforestation activities. Not only can nature-based solutions support biodiversity and ecosystem recovery, but the sequestration potential of tree cover makes these interventions net-negative emitters.
• Green Climate, Brown Nature - Investments in national railroad network modernisation. An assumed first year spend of €1.36 billion will contribute positively to France’s climate ambitions as public reliance on personal vehicles is reduced. However, laying extensive lengths of railway can interfere with natural habitats, segregating ecosystems and reducing areas accessible to many species.
0%
10%
20%
30%
40%
0%
1%
2%
3%
4%
Bulgaria ItalyGreece
PortugalSlovakia
PolandSpain
SloveniaFrance
Germany
Pre
NR
RP
NR
RP
Direct Environmentally Relevant Spending (% GDP) Other Spending (% GDP)
Total Spending Pre NRRP (% GDP)

Fund Nature, Fund the Future
24
3.3 Germany
Germany’s NRRP is climate positive, but nature is almost totally absent from the country’s proposed recovery plans. Figure 18 shows that environmentally relevant investments all affect the climate, with nature only influenced by some jointly relevant policies. Figure 19 shows that the majority of Germany’s climate-relevant spending is green, meaning it will reduce emissions, while the effects of nature relevant policies are entirely negative, implying positive nature focussed interventions are wholly omitted from the German recovery plans. The mixed effects on both climate and nature yield a joint score which is well below that of peer countries such as Portugal, Spain, and Italy. This climate heavy balance of investments sees Germany’s position penalised to an allocation-adjusted index score of -25, making it second-worst overall performer.
Though significant investments in the energy, industry and transport sectors bolster Germany’s green climate contribution, nature-based solutions are completely missing. Financial support for low carbon transport and building green hydrogen capacity are typical climate positive policies. As beneficial as these interventions are for Germany’s environment, the NRRP makes no explicit nature positive investments. Failing to actively support nature allows business-as-usual behaviour to continue harming it, while also leading Germany to miss out on the economic and environmental benefits of nature-based solutions.
Figure 18: Spending split affecting climate and nature Figure 19: Germany - Index Scores
Figure 20: Nature and climate impact split by sector

Fund Nature, Fund the Future
25
Figure 21: Spending relative to GDP
Germany’s environmentally relevant NRRP spending represents a significant portion of overall investment, but the climate-nature split is far from optimal. Less than €227million of assumed first year spend in Germany promotes initiatives with a direct effect on nature, and the impact of this investment is largely brown. This is far from an optimal allocation of spending, failing to reap any of the benefits associated with nature positive spending.
Significant policies:
• Green Climate - Investments in the National Hydrogen Strategy totalling an assumed US$ 1.18 billion in the first year. Germany is investing in hydrogen across a number of sectors, with research and innovation support (€213 million), cross border hydrogen infrastructure development with France (€453 million), and industrial hydrogen deployment incentives (€168 million), dominating the total allocation. These measures signal a significant push towards the clean energy transition in a comprehensive manner, addressing all points of fuel consumption, from heavy industry to personal vehicles. Significantly, these measures focus on the development of hydrogen generated from renewable energy sources (green hydrogen).
• Brown Climate - Innovation premium to fund the replacement of vehicle fleets. Despite there being climate gains associated with high efficiency modern internal combustion engines, this assumed first year spend of €760 million fails to impose sufficient green conditions on financial support.
• Green Climate, Brown Nature - Investments to develop climate friendly timber construction. This initiative, worth an assumed €6.3 million in the first year, encourages the development of timber-based construction processes. For the climate, building with timber is friendlier than concrete and steel – traditionally carbon heavy materials. However, this policy fails to provide sufficient assurances that deforestation will not be encouraged as a result of increased timber construction, meaning the intervention has a negative impact on nature.
0%
10%
20%
30%
40%
0%
1%
2%
3%
4%
Bulgaria ItalyGreece
PortugalSlovakia
PolandSpain
SloveniaFrance
Germany
Pre
NR
RP
NR
RP
Direct Environmentally Relevant Spending (% GDP) Other Spending (% GDP)
Total Spending Pre NRRP (% GDP)

Fund Nature, Fund the Future
26
3.4 Greece
Greece’s NRRP is the worst for climate but the best for nature among the countries analysed, resulting in a middling mixed and allocation adjusted score. Figure 22 shows nearly that 11% of environmentally relevant investments impact upon only nature, with two-thirds affecting only the climate, and the balance affecting both. Figure 23 shows a climate score of 44 – the worst among countries – next to the highest nature score of 32. The joint effects of environmentally relevant policies yield a middling mixed index score, though this falls to -12 in the allocation adjusted score due to suboptimal allocation of funding between climate and nature, placing it fourth from the bottom.
Greece’s plan is well balanced in addressing climate issues, but nature positive interventions are dominated by spending in the agricultural sector. Transport, industry, energy and agriculture all contribute to Greece’s strong positive climate score. However, nature is omitted from significant portions of the NRRP, with funding for sustainability improvements in agriculture and aquaculture driving the country’s green nature index score. While energy sector investments in natural gas infrastructure are good for abating emissions, there are negative consequences of these investments for nature.
Figure 24: Nature and climate impact split by sector
(40.00) (20.00) - 20.00 40.00 60.00 80.00
Climate
Nature
agriculture transport industry energy waste agriculture transport industry energy waste
Figure 22: Spending split affecting climate and nature Figure 23: Greece – Index scores

Fund Nature, Fund the Future
27
Figure 25: Spending relative to GDP
An assumed first year spend of 2.5 % GDP represents a significant increase on total pandemic related expenditures thus far. Until now, the Greek economy has benefited from injections of roughly 10% GDP in stimulus measures – a sum set to rise by a quarter following first year spending patterns of the country’s NRRP. The recovery plan returns the best mixed index score of any country analysed; conflicting nature-climate effects of environmentally relevant policies are an issue here, as with all other NRRP’s.
Significant policies:
• Green Climate - Upgrade electricity infrastructure to allow a higher renewable energy share. Benefitting from an assumed first year spend of €118 million, investments in the RES share of the Greek energy mix represent commitments to a successful post-Covid clean energy transition. This intervention should serve to reduce the climate intensity of the power sector – a key component of the shift towards net zero emissions.
• Green Climate, Green Nature - Climate impact reduction and improved diversification of aquaculture. An assumed first year spend of €34 million intends to promote sustainable development through modernising production processes in aquaculture. Specific ambition to reduce climate impact through this initiative means the policy bolsters Greece’s climate index score. Notably, attention is also paid to increasing diversification of aquaculture production. This is not only beneficial for food resource resilience, but also supports biodiversity and biomass increases, meaning this policy is positive for nature.
• Green Climate, Brown Nature - Substitute fossil fuel products in energy consumption by expanding natural gas grids. While fuel switching from coal and oil to natural gas can bring significant emissions reductions, this €118 million assumed first year investment is likely to be bad for nature. Traditional extraction and processing of natural gas results in physical and noise pollution, while the effects of alternative recovery techniques can have serious negative effects on water and soil quality.
0%
10%
20%
30%
40%
0%
1%
2%
3%
4%
Bulgaria ItalyGreece
PortugalSlovakia
PolandSpain
SloveniaFrance
Germany
Pre
NR
RP
NR
RP
Direct Environmentally Relevant Spending (% GDP) Other Spending (% GDP)
Total Spending Pre NRRP (% GDP)

Fund Nature, Fund the Future
28
3.5 Italy
Italy’s NRRP is beneficial for climate, but conflicting policies and imbalanced spending return a negative allocation adjusted index score. Figure 27 shows that environmentally relevant investments through Italy’s recovery plan are largely climate relevant, accompanied by some jointly relevant policies, and a small amount of uniquely nature relevant spending. Figure 26 shows that the vast majority of Italy’s climate-relevant spending is green, meaning it will reduce emissions. Nature positive interventions in Italy’s plan are largely offset by conflicting measures, resulting in a near-zero nature score. The joint effects of environmentally relevant policies yield the second-highest mixed index score, which drops dramatically to a middling score of -2 due to a lopsided allocation of funds.
The NRRP includes successful climate and nature positive policies across multiple sectors, but conflicting effects threaten much of its good work. Climate positive interventions in energy, transport, and industry drive a strong climate score for the Italian NRRP. Waste sector investments in developing the circular economy support both climate and nature, though many measures fail to consider both dimensions. Energy sector investments and climate friendly construction initiatives make efforts to reduce emissions, but insufficient nature positive conditions mean these policies are likely to have a negative impact on local ecosystems, driving down Italy’s nature index score.
Figure 28: Index Scores
Figure 29: Nature and climate impact split by sector
Figure 27: Spending split affecting climate and nature
(60.00) (40.00) (20.00) - 20.00 40.00 60.00 80.00 100.00 120.00
Climate
Nature
agriculture transport industry energy waste agriculture transport industry energy waste
Figure 26: Italy - Index Scores
79.45
-2.31-40.00
0.00
40.00
80.00
120.00
Climate Nature Mixed
Green contribution Brown contribution
Index Allocation adjusted

Fund Nature, Fund the Future
29
Figure 30: Spending relative to GDP
Italy’s NRRP spending is the second largest of the countries analysed as a percentage of GDP, totalling more than 4% GDP, with environmentally relevant investment worth nearly two thirds of the plan. An assumed first year spend of nearly €36 billion directed to environmentally intensive sectors contains a number of national co-financing measures to complement the funding secured through the recovery and resilience facility. Progress towards environmental objectives through renewable energy and green transport initiatives will likely also yield economic benefits, though more significant and explicit investment in nature should not be ignored as a channel for driving social and environmental benefits.
Significant policies:
• Green Climate, Green Nature - Circular economy flagship projects. Over five years, Italy plans to invest €544 million in reducing the use of raw materials and improving the sustainability of production processes. This significant investment is not only nature positive, in reducing the throughput of natural resources in manufacturing, but will enhance climate ambition if sustainable land use, promoted by the policy, leads to greater sequestration from vegetation across Italy.
• Green Climate, Brown Nature - Agri-solar parks. An innovative climate positive investment in the agriculture sector encourages the construction of solar panels on grazing land. While aiding the energy transition by generating renewable electricity, the two policies - worth a combined €816 million in assumed first year spend – threaten to disrupt wildlife in these sites, obscuring habitats that may otherwise be left at the hands of nature.
• Green Climate, Brown Nature - Infrastructure development of national railways. Climate positive investments in public transport infrastructure are deemed to threaten nature if the construction of new lines has the potential to segregate ecosystems. By laying new track, the €480 million assumed first year spend in improving connections of Italian rail infrastructure may dissect habitats, limiting the capacity of native species to roam for food and breeding.
0%
10%
20%
30%
40%
0%
1%
2%
3%
4%
Bulgaria ItalyGreece
PortugalSlovakia
PolandSpain
SloveniaFrance
Germany
Pre
NR
RP
NR
RP
Direct Environmentally Relevant Spending (% GDP) Other Spending (% GDP) Total Spending Pre NRRP (% GDP)

Fund Nature, Fund the Future
30
3.6 Poland
Poland’s NRRP is beneficial for climate, while policies impacting nature have a mixed effect on the country’s index score. Figure 31 shows that environmentally relevant investments through the Polish recovery plan are equally relevant to climate and nature – a split that sets Poland apart from the other countries analysed. Figure 32 shows that the majority of Poland’s climate-relevant spending is green, meaning it will reduce emissions. Nature relevant interventions give Poland the third-highest nature score of 18. The joint effects of environmentally relevant policies yield a roughly average mixed index score of 55, which drops to an allocation adjusted score of 2. While the drop is significant, it is still the third-best final score amongst the comparison countries thanks to Poland’s more equitable split of investments between those that impact upon climate and nature.
`
Poland’s NRRP has a broadly positive impact on climate and nature, with investments in the waste and agriculture sectors particularly beneficial for the environment. Climate positive interventions in waste, agriculture, and energy drive an impressive climate score for the Polish NRRP. Waste reduction initiatives, investment in the circular economy, and renewable energy programs are typical positive investments in these sectors. Construction activities with insufficient green strings attached contribute to Poland’s brown nature score, while investments in the energy sector are responsible for the largest negative components of both the climate and nature indexes.
Figure 33: Nature and climate impact split by sector
Figure 31: Spending split affecting climate and nature Figure 32: Poland - Index scores
Nature Climate Both
(40.00) (20.00) - 20.00 40.00 60.00 80.00 100.00 120.00
Climate
Nature
agriculture transport industry energy waste agriculture transport industry energy waste

Fund Nature, Fund the Future
31
Figure 34: Spending relative to GDP
Poland’s modest spending through the RRF facility is highly environmentally relevant, though a number of policies have conflicting effects. Comparable to the top performers in Europe, more than half of Poland’s recovery investment through the NRRP is environmentally relevant. Unfortunately, the plan suffers from similar drawbacks to its peers, with a number of pro-climate policies failing to consider potential negative nature effects.
• Green Climate, Green Nature - Investments in environmental technologies and the circular economy. Poland’s assumed first year investment of €49 million in implementing innovative environmental technologies is likely to have positive effects on both climate and nature. While this spending will lead to emissions reductions that benefit the climate, explicit reference to the country’s circularity ambitions suggests this spending will also improve waste reduction, physical pollution, and raw materials throughput.
• Green Climate, Brown Nature - Construction of offshore windfarms and terminal infrastructure. The development of renewable energy infrastructure in Poland is greatly beneficial for the climate. Investments of over €0.9 billion expected within the first year may lead to significant emissions reductions of the power sector. However, constructing windfarms can cause habitat disruption to marine life, and turbines pose a well-documented collision threat to birds.
• Brown Climate, Brown Nature - Investments in housing development. Poland dedicates an assumed first year spend of €363 million to the construction of housing. Insufficient information on the materials, processes, and locations of these activities means the potential consequences of this spending on both the climate and nature are negative. Complementing this spending with measures encouraging sustainable construction and land use could abate this negative effect.
0%
10%
20%
30%
40%
0%
1%
2%
3%
4%
Bulgaria ItalyGreece
PortugalSlovakia
PolandSpain
SloveniaFrance
Germany
Pre
NR
RP
NR
RP
Direct Environmentally Relevant Spending (% GDP) Other Spending (% GDP) Total Spending Pre NRRP (% GDP)

Fund Nature, Fund the Future
32
3.7 Portugal
Portugal’s NRRP is climate positive, but nature damaging policies and suboptimal distribution of investment drive a net-negative index score. Figure 35 shows that Portugal’s environmentally relevant investments are diverse and have the second-most relevance to nature of the plans studied. Figure 36 shows that the majority of Portugal’s climate-relevant spending is green, meaning it will reduce emissions. But nature relevant interventions in Portugal’s plan have a negative effect on average, with the sizeable brown contribution that reduces the score below zero. The joint effects of environmentally relevant policies yield a positive mixed index score of 42, though this is penalised due to a suboptimal allocation of funding to nature positive interventions, returning a final score of -3 and placing it in the middle of the pack in both cases.
42.17
-3.25-100.00
-50.00
0.00
50.00
100.00
150.00
Climate Nature Mixed
Portugal
Green contribution Brown contribution
Index Allocation adjusted
The effects of Portugal’s environmentally relevant investments are evenly distributed across sectors, but brown nature spending harms the plan’s environmental performance. Figure 37 shows that interventions in agriculture, transport, industry and energy all contribute to a strong climate score. Unfortunately, policies with conflicting effects on climate and nature counteract much of the good work achieved by Portugal’s environmentally relevant investments. Industrial policies are particularly detrimental to the country’s nature index score, which is bolstered only by some positive investments in the agricultural and industrial sectors.
42.17
-3.25-50.00
-10.00
30.00
70.00
110.00
Climate Nature Mixed
Green contribution Brown contribution
Index Allocation adjustedNature Climate Both
Figure 37: Nature and climate impact split by sector
Figure 35: Spending split affecting climate and nature Figure 36: Portugal - Index scores

Fund Nature, Fund the Future
33
Figure 38: Spending relative to GDP
Portugal injects roughly a tenth of its historic recovery expenditure with its assumed first year spend, though a smaller amount of investment is environmentally relevant than elsewhere in Europe. Out of Portugal’s €17 billion plan, around €11 billion is dedicated to improving the country’s resilience, against €3 billion allocated to the climate transition. Certain projects in building resilience such as infrastructure development and forest conservation are strongly environmentally relevant. However, the plan overall dedicates less to the agriculture, energy, transport, industry, and waste sectors than most of its European counterparts.
Significant policies:
• Green Climate, Green Nature - Green agendas for business innovation. The assumed first year investment of this project amounts to €113 million and is likely to have a beneficial effect on both nature and climate. Indeed, through this investment, Portugal supports collaborative projects for the development of new products, services and solutions which make a transition towards environmental sustainability possible.
• Green Climate; Green Nature - Investments in the sea and forests. Portugal is assumed to have a first-year investment of €67 million dedicated to the blue economy and the protection of the marine environment. It will also dedicate an expected first-year investment of €187 million to the protection and fight against rural fires.
• Green Climate, Brown Nature - Investments in renewables and irrigation systems. The development of renewable energy infrastructure in Portugal is greatly beneficial for the climate. Investments in hydrogen and renewables of about €112million expected within the first year may lead to significant emissions reductions of the power sector. However, constructing windfarms and hydroelectric plants can pose well-documented threats to birds as well as marine life.
• Brown Climate, Brown Nature - Investments in road networks. Portugal will dedicate an assumed €177 million first-year investment to increase road capacity and improve accessibility and connections between networks. While promoting an adequate road network capacity may, to an extent, reduce congestion and polluting gases, the construction of additional roads is expected to have an overall net negative impact on the environment.
0%
10%
20%
30%
40%
0%
1%
2%
3%
4%
Bulgaria ItalyGreece
PortugalSlovakia
PolandSpain
SloveniaFrance
Germany
Pre
NR
RP
NR
RP
Direct Environmentally Relevant Spending (% GDP) Other Spending (% GDP) Total Spending Pre NRRP (% GDP)

Fund Nature, Fund the Future
34
3.8 Slovakia
Slovakia’s climate score is the highest among the countries studied, and despite an average nature score it achieves the highest mixed index score but is penalised for a highly uneven allocation and scores a middling allocation adjusted score of -1.4. Figure 39 shows that environmentally relevant investments through the Slovakian recovery plan are dramatically weighted towards climate, with nature severely underrepresented. Figure 40 shows that a strong majority of Slovakia’s climate-relevant spending is green, meaning it will reduce emissions. Nature relevant interventions in Slovakia’s plan have a positive effect on average, though the disparity in investment quantity leads to significant reduction in score for the allocation adjusted index.
Slovakia’s environmentally relevant policies are generally positive, indicating how successful the plans could be if nature received a greater share of investment. Interventions in transport and energy dominate the country’s climate impact, with agriculture and forestry contributing most to the nature score. A small amount of investment is expected to negatively affect climate ambition, leading to increased emissions in the energy, transport, and industrial sectors. The positive baseline performance of Slovakia means that no business-as-usual spending is considered to harm nature, but the lack of direct funding it receives reflects poorly on a plan which is otherwise beneficial to the environment.
Figure 41: Nature and climate impact split by sector
Nature Climate Both
84.28
-1.40
-50.00
-10.00
30.00
70.00
110.00
Climate Nature Mixed
Green contribution Brown contribution
Index Allocation adjusted
Figure 39: Spending split affecting climate and nature Figure 40: Slovakia - Index scores
(40.00) (20.00) - 20.00 40.00 60.00 80.00 100.00
Climate
Nature
agriculture transport industry energy waste agriculture transport industry energy waste
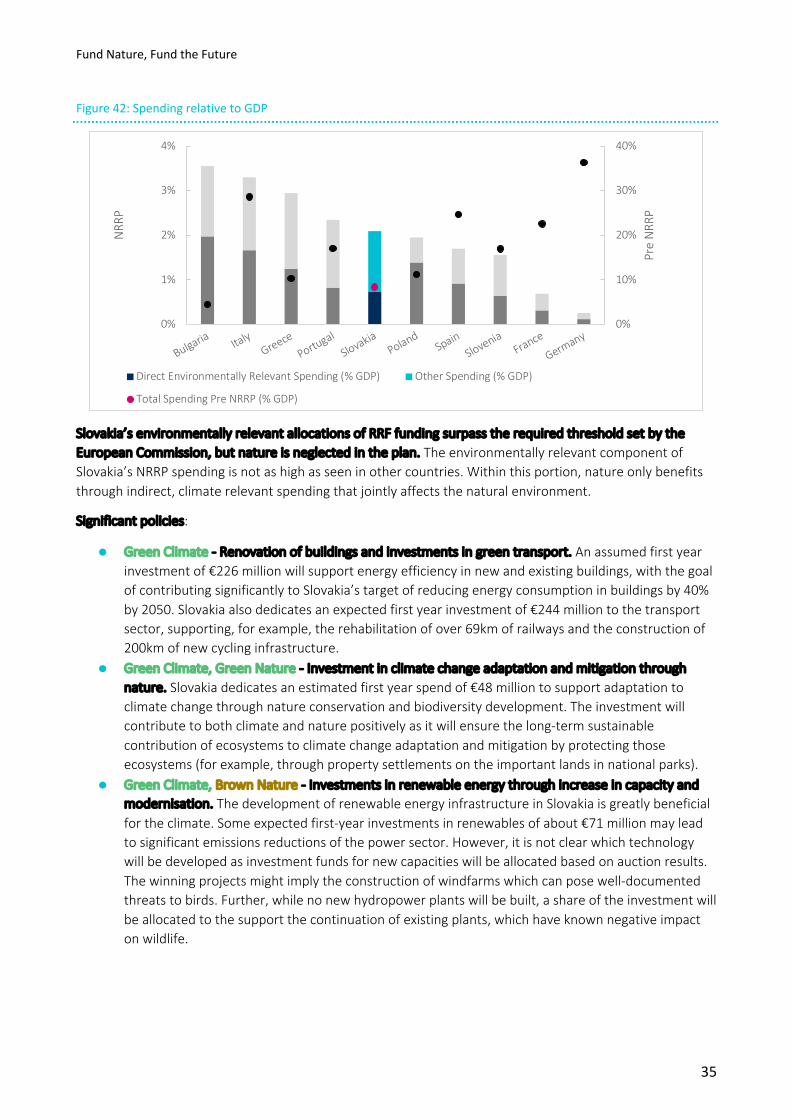
Fund Nature, Fund the Future
35
Figure 42: Spending relative to GDP
Slovakia’s environmentally relevant allocations of RRF funding surpass the required threshold set by the European Commission, but nature is neglected in the plan. The environmentally relevant component of Slovakia’s NRRP spending is not as high as seen in other countries. Within this portion, nature only benefits through indirect, climate relevant spending that jointly affects the natural environment.
Significant policies:
• Green Climate - Renovation of buildings and investments in green transport. An assumed first year investment of €226 million will support energy efficiency in new and existing buildings, with the goal of contributing significantly to Slovakia’s target of reducing energy consumption in buildings by 40% by 2050. Slovakia also dedicates an expected first year investment of €244 million to the transport sector, supporting, for example, the rehabilitation of over 69km of railways and the construction of 200km of new cycling infrastructure.
• Green Climate, Green Nature - Investment in climate change adaptation and mitigation through nature. Slovakia dedicates an estimated first year spend of €48 million to support adaptation to climate change through nature conservation and biodiversity development. The investment will contribute to both climate and nature positively as it will ensure the long-term sustainable contribution of ecosystems to climate change adaptation and mitigation by protecting those ecosystems (for example, through property settlements on the important lands in national parks).
• Green Climate, Brown Nature - Investments in renewable energy through increase in capacity and modernisation. The development of renewable energy infrastructure in Slovakia is greatly beneficial for the climate. Some expected first-year investments in renewables of about €71 million may lead to significant emissions reductions of the power sector. However, it is not clear which technology will be developed as investment funds for new capacities will be allocated based on auction results. The winning projects might imply the construction of windfarms which can pose well-documented threats to birds. Further, while no new hydropower plants will be built, a share of the investment will be allocated to the support the continuation of existing plants, which have known negative impact on wildlife.
0%
10%
20%
30%
40%
0%
1%
2%
3%
4%
Bulgaria ItalyGreece
PortugalSlovakia
PolandSpain
SloveniaFrance
Germany
Pre
NR
RP
NR
RP
Direct Environmentally Relevant Spending (% GDP) Other Spending (% GDP)
Total Spending Pre NRRP (% GDP)

Fund Nature, Fund the Future
36
3.9 Slovenia
Slovenia’s NRRP is climate positive, and while it has the largest mixture of investments that impact upon nature, a sizeable portion of them will be negative, harming the country’s overall index scores. Figure 43 shows that environmentally relevant investments through the Slovakian recovery plan are very equitably distributed between climate and nature. Unfortunately, Figure 44 shows that the majority of Slovakia’s nature relevant spending is actually detrimental to the environment. The country’s green climate relevant policies support the overall index score, which is penalised far less than those of peer countries, meaning spending is closer to an optimal allocation, though in this case, to negative effect.
Slovenia’s successful climate relevant interventions are counteracted by the negative effects of its policies on nature. Interventions in the transport and waste sectors contribute to a successful balance of effective green climate policies. While a number of policies concerning waste management and industry yield positive nature outcomes, conflicting policy effects from energy investments and construction projects mean the country’s nature score is net-negative.
28.13
-14.47
-60.00
-20.00
20.00
60.00
100.00
Climate Nature Mixed
Green contribution Brown contribution
Index Allocation adjusted
Figure 45: Nature and climate impact split by sector
Nature Climate Both
Figure 43: Spending split affecting climate and nature Figure 44: Index scores
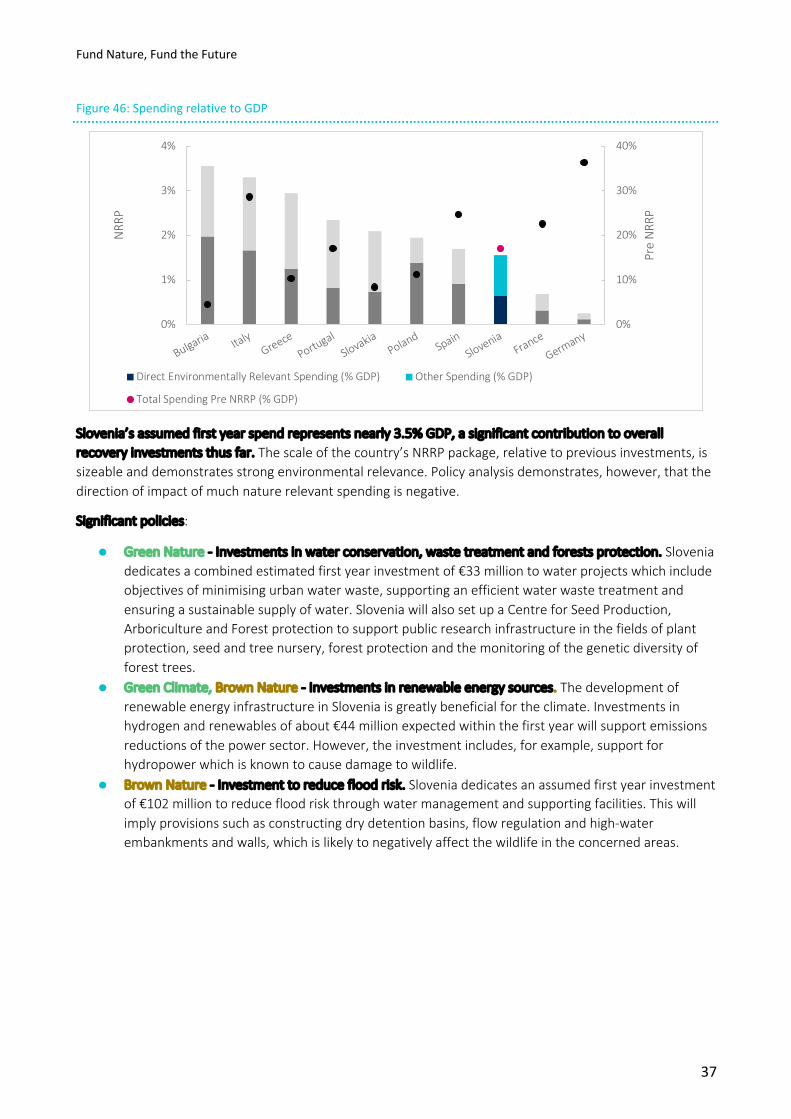
Fund Nature, Fund the Future
37
Figure 46: Spending relative to GDP
Slovenia’s assumed first year spend represents nearly 3.5% GDP, a significant contribution to overall recovery investments thus far. The scale of the country’s NRRP package, relative to previous investments, is sizeable and demonstrates strong environmental relevance. Policy analysis demonstrates, however, that the direction of impact of much nature relevant spending is negative.
Significant policies:
• Green Nature - Investments in water conservation, waste treatment and forests protection. Slovenia dedicates a combined estimated first year investment of €33 million to water projects which include objectives of minimising urban water waste, supporting an efficient water waste treatment and ensuring a sustainable supply of water. Slovenia will also set up a Centre for Seed Production, Arboriculture and Forest protection to support public research infrastructure in the fields of plant protection, seed and tree nursery, forest protection and the monitoring of the genetic diversity of forest trees.
• Green Climate, Brown Nature - Investments in renewable energy sources. The development of renewable energy infrastructure in Slovenia is greatly beneficial for the climate. Investments in hydrogen and renewables of about €44 million expected within the first year will support emissions reductions of the power sector. However, the investment includes, for example, support for hydropower which is known to cause damage to wildlife.
• Brown Nature - Investment to reduce flood risk. Slovenia dedicates an assumed first year investment of €102 million to reduce flood risk through water management and supporting facilities. This will imply provisions such as constructing dry detention basins, flow regulation and high-water embankments and walls, which is likely to negatively affect the wildlife in the concerned areas.
0%
10%
20%
30%
40%
0%
1%
2%
3%
4%
Bulgaria ItalyGreece
PortugalSlovakia
PolandSpain
SloveniaFrance
Germany
Pre
NR
RP
NR
RP
Direct Environmentally Relevant Spending (% GDP) Other Spending (% GDP)
Total Spending Pre NRRP (% GDP)

Fund Nature, Fund the Future
38
3.10 Spain
Spain’s NRRP receives the third-highest climate score and second-highest nature score, and with a more balanced split between spending that affects nature and climate, it achieves the highest allocation-adjusted score. Figure 47 shows that environmentally relevant investments through the Spanish recovery plan are very equitably distributed between climate and nature. Figure 48 shows that the majority of Spain’s climate and nature relevant spending is also beneficial for the environment, with comparatively high scores for both indices. While the spending split of the Spanish recovery is more equitable than many of the country’s European peers, the mixed index score is till penalised from 68.5 to 8.16, which is the highest amongst all countries studied, but shows that nature positive spending is still too low.
The effects of Spain’s environmentally relevant policies are evenly distributed between sectors. Interventions across all five environmentally intensive sectors contribute to a successful balance of effective green climate policies. Green investments in agriculture and waste support the country’s positive nature index score, though negative effects of spending in industry and energy weaken the country’s position slightly. The plan is ultimately beneficial for Spain’s environment, but proportionally greater investment in nature would prevent the score being penalised so heavily for a suboptimal spending allocation.
Figure 47: Spending split affecting climate and nature Figure 48: Index scores
Figure 49: Nature and climate impact split by sector

Fund Nature, Fund the Future
39
Figure 50: Spending relative to GDP
Environmentally relevant spending represents roughly half of Spain’s investments through the NRRP, with a significant proportion influencing nature. Most of the policies in the Spanish plan are green over both the climate and nature dimensions. However, as elsewhere in Europe, conflicting policies are also present, weakening an otherwise impressive portfolio of environmentally relevant interventions.
Significant policies:
• Green Climate, Green Nature - Conservation and restoration of ecosystems and their biodiversity. An assumed first year spend of €500 million is directed towards restoring the natural biodiversity of Spanish regions. This policy is inherently nature-positive, improving the health and resilience of ecosystems throughout the country. The intervention is also climate positive, as increased vegetation cover leads to higher levels of carbon sequestration, with the potential for the policy to leave a net negative emissions footprint.
• Green Climate, Green Nature - Preservation of coastal space and water resources. The nature benefit of this policy – worth an assumed €635 million in the first year alone – is likely to be substantial, with coastal waters host to highly diverse ecosystems that require protection and conservation efforts to maintain. Preserving inland water resources also serves to sequester atmospheric carbon, leading to indirect climate benefit of this resource-focused policy.
• Green Climate, Brown Nature - Deployment and integration of renewable energies. Although benefitting the climate by reducing power sector emissions, the deployment of renewable energy sources is often detrimental to nature. The assumed first year spend of this Spanish recovery policy is over €900 million, so it is likely that large areas of habitat will be affected by the project activities.
0%
10%
20%
30%
40%
0%
1%
2%
3%
4%
Bulgaria ItalyGreece
PortugalSlovakia
PolandSpain
SloveniaFrance
Germany
Pre
NR
RP
NR
RP
Direct Environmentally Relevant Spending (% GDP) Other Spending (% GDP)
Total Spending Pre NRRP (% GDP)

Fund Nature, Fund the Future
40
4 Individual country analyses through the I3M 4.1 Bulgaria
Bulgaria’s NRRP includes just one NBS – a reforestation initiative worth €18 million – though this investment demonstrates the economic and environmental recovery potential of nature-based solutions. Bulgaria’s plan commits to protecting Natura 2000 areas within its borders through nature-based solutions but would benefit from increasing the scale of its ambition. The economic and environmental effects of the intervention are resoundingly positive, providing strong evidence for increasing the scale of NBS investment in future.
The value added to the Bulgarian economy through its investment in reforestation is heavily frontloaded to the first five years of the project lifespan. The project stands to generate nearly €22 million in economic value over fifteen years, with nearly 90% realised in the first five. Realising value early is of great benefit to stimulus measures, as governments seek to catalyse economic activity following the coronavirus crisis. A similar story emerges for job creation potential of the initiative, where nearly 900 of the 1000 jobs created by the investment appear in the first half-decade. This reflects the near-term economic benefits required to implement reforestation projects, with site creation involving significant labour efforts, but maintenance needs limited across the project lifetime. As with value addition, this is of benefit to immediate economic recovery.
Value added by Bulgaria’s reforestation project is largely indirect, benefiting wider society beyond those involved in the project itself. Nearly 60% of the €22 million generated in the Bulgarian economy through this project emerge indirectly of the project itself. Direct project activities are responsible for approximately €4.5 million of value added to the economy, with a similar contribution generated through induced channels. This story is mimicked by patterns of job creation potential, where nearly 800 permanent roles stand to be created indirectly of the project itself. These roles emerge in supporting industries to reforestation activity as a result of the programme spending.
Figure 51: Value added over time by Bulgaria’s NBS
Figure 52: Jobs created across the value chain by Bulgaria’s NBS

Fund Nature, Fund the Future
41
Box 2 Supporting job creation by channelling investments towards nature-based solutions
Redirecting €545 million, or 7.5% of Bulgaria’s NRRP spending, towards nature-based solutions could create a net gain of 3,900 permanent jobs compared to the current plan. A hypothetical “high-jobs scenario” reallocates 7.5% of Bulgaria’s NRRP spending to four nature-based solutions, namely agroforestry, reforestation, wetland restoration and urban greening. This scenario draws €545 million away from a basket of measures with lower job creation potential in Bulgaria and invests it in NBS, favouring the solutions with the highest job potential. Agroforestry in Bulgaria has the potential to create one new permanent role for every €9,500 invested, so receives 60% of the reallocated funding. Urban greening projects, reforestation, and wetland restoration initiatives receive 30%, 5%, and 5%, respectively.
Figure 53: Net jobs gain – high-jobs scenario
The same reallocation of resources would reduce the net emissions impact of Bulgaria’s NRRP by 2.4 million tonnes CO2eq. The economic activity involved in deploying any policy creates greenhouse gas emissions. While traditional green investments, such as residential energy efficiency upgrades and development of electric vehicle infrastructure encourage climate friendly behaviour, the economic activities involved in the interventions themselves still produce emissions. Even deploying NBS generates emissions, but the natural assets they create have the potential to sequester more carbon than is released throughout the process, in some cases leaving a net-negative emissions footprint. The high-jobs scenario would be responsible for nearly 2.5 million tonnes CO2eq less than were the same money to be spent on traditional investments.
Figure 54: Emissions differential – high-jobs scenario
-60000 -40000 -20000 0 20000 40000 60000
Jobs Lost
Jobs Gained
Jobs Created
EV Investments Housing and Retrofitting Mining Traditional TransportAgroforestry Parks and Gardens Wetland Restoration Reforestation
-500 0 500 1000 1500 2000 2500
Reference Emissions
NBS Emissions
ktCO2eq
Clean Transport Housing and Retrofitting Mining Traditional TransportAgroforestry Parks and Gardens Wetland Restoration Reforestation
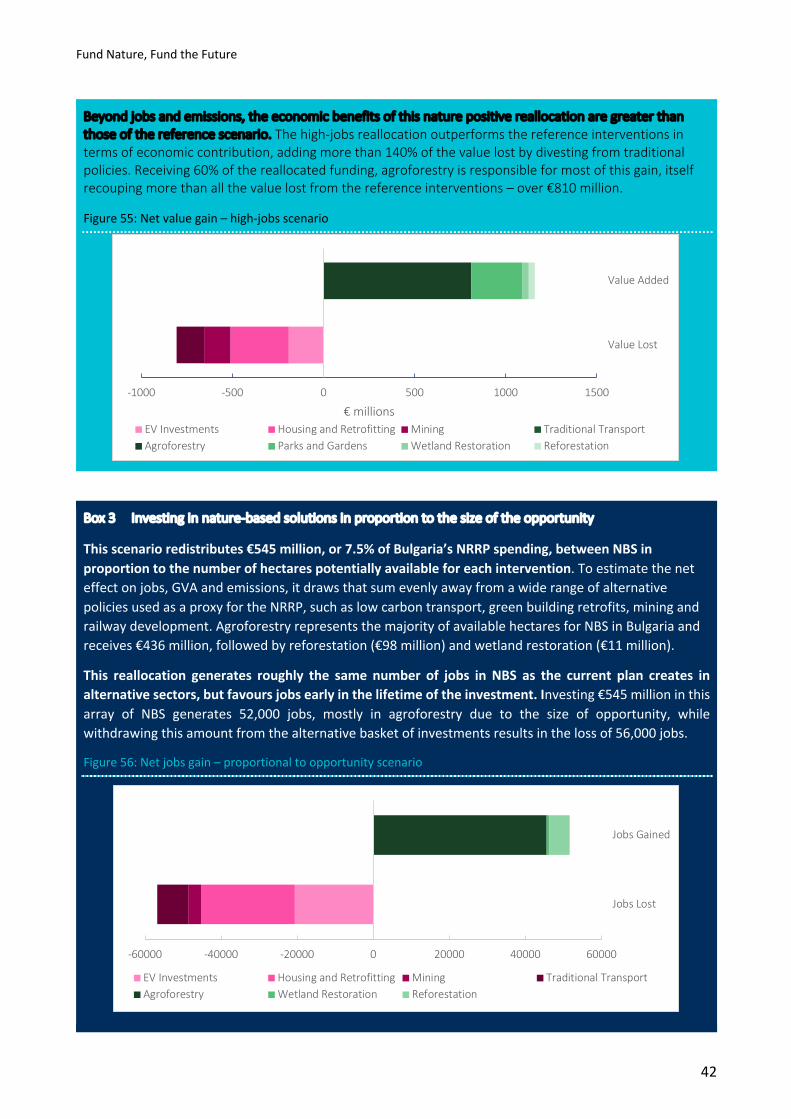
Fund Nature, Fund the Future
42
Beyond jobs and emissions, the economic benefits of this nature positive reallocation are greater than those of the reference scenario. The high-jobs reallocation outperforms the reference interventions in terms of economic contribution, adding more than 140% of the value lost by divesting from traditional policies. Receiving 60% of the reallocated funding, agroforestry is responsible for most of this gain, itself recouping more than all the value lost from the reference interventions – over €810 million.
Figure 55: Net value gain – high-jobs scenario
Box 3 Investing in nature-based solutions in proportion to the size of the opportunity
This scenario redistributes €545 million, or 7.5% of Bulgaria’s NRRP spending, between NBS in proportion to the number of hectares potentially available for each intervention. To estimate the net effect on jobs, GVA and emissions, it draws that sum evenly away from a wide range of alternative policies used as a proxy for the NRRP, such as low carbon transport, green building retrofits, mining and railway development. Agroforestry represents the majority of available hectares for NBS in Bulgaria and receives €436 million, followed by reforestation (€98 million) and wetland restoration (€11 million).
This reallocation generates roughly the same number of jobs in NBS as the current plan creates in alternative sectors, but favours jobs early in the lifetime of the investment. Investing €545 million in this array of NBS generates 52,000 jobs, mostly in agroforestry due to the size of opportunity, while withdrawing this amount from the alternative basket of investments results in the loss of 56,000 jobs.
Figure 56: Net jobs gain – proportional to opportunity scenario
-60000 -40000 -20000 0 20000 40000 60000
Jobs Lost
Jobs Gained
EV Investments Housing and Retrofitting Mining Traditional TransportAgroforestry Wetland Restoration Reforestation
-1000 -500 0 500 1000 1500
Value Lost
Value Added
€ millions
EV Investments Housing and Retrofitting Mining Traditional TransportAgroforestry Parks and Gardens Wetland Restoration Reforestation

Fund Nature, Fund the Future
43
Reallocating funding towards NBS results in 2 million fewer tonnes of greenhouse gas emissions compared to the alternative basket of investments, which demonstrates a strong climate rationale for NBS. Divesting from the basket of traditional interventions reduces the carbon footprint of the NRRP by 2,200 ktCO2eq. By contrast, reinvesting the same sum in NBS under this scenario generates only 1,300 ktCO2eq, and sequesters the same amount, meaning the NBS policy basket had a net zero carbon footprint.
Figure 57: Emissions differential – proportional to opportunity scenario
The nature-based solutions generate over € 1.2 billion in GVA – nearly € 300 million more than is lost by divesting from traditional interventions, illustrating the strong economic case for NBS. The €436 million investment in agroforestry is responsible for generating over €1 billion in GVA alone, with reforestation generating €118 million and wetland restoration generating €14 million. This scenario demonstrates the economic potential of nature-based solutions in Bulgaria, with a significant net gain in GVA achieved by reallocating funding towards nature-positive policies.
Figure 58: Net value added – proportional to opportunity scenario
-500 0 500 1000 1500 2000 2500
Reference Emissions
NBS Emissions
ktCO2eq
EV Investments Housing and Retrofitting Mining Traditional Transport
Agroforestry Wetland Restoration Reforestation
-1000 -500 0 500 1000 1500
Value Lost
Value Added
€ millions
EV Investments Housing and Retrofitting Mining Traditional TransportAgroforestry Wetland Restoration Reforestation
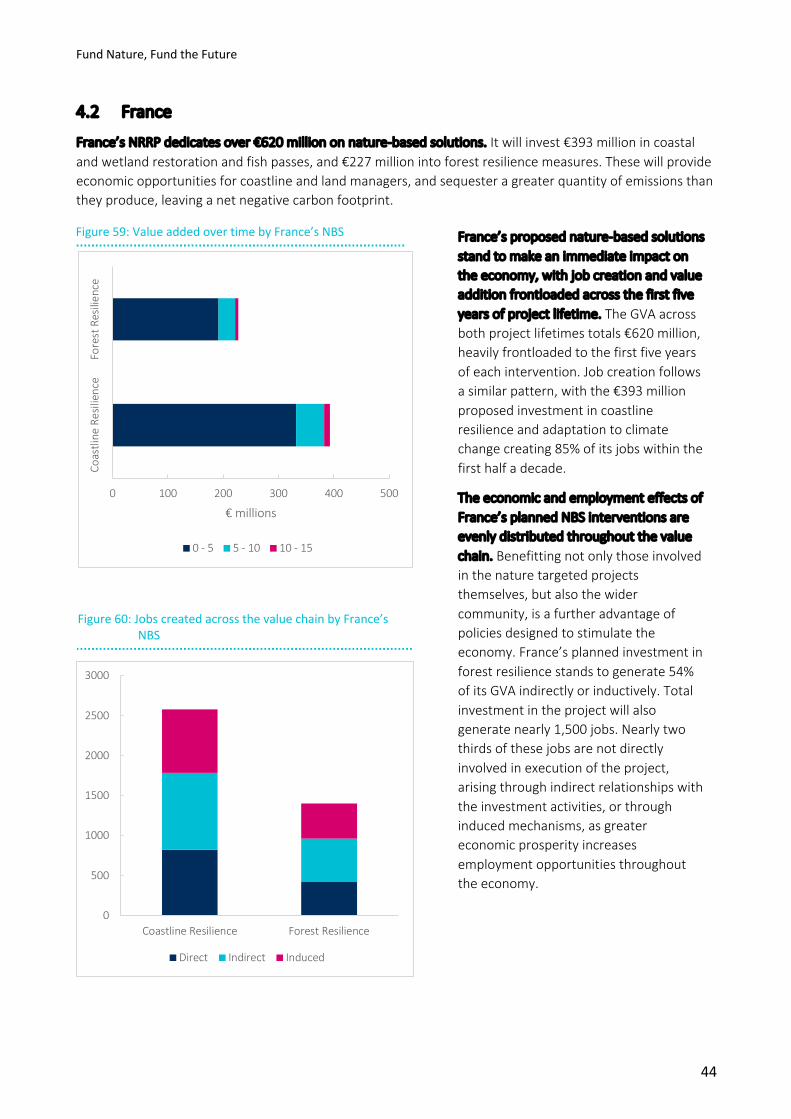
Fund Nature, Fund the Future
44
4.2 France
France’s NRRP dedicates over €620 million on nature-based solutions. It will invest €393 million in coastal and wetland restoration and fish passes, and €227 million into forest resilience measures. These will provide economic opportunities for coastline and land managers, and sequester a greater quantity of emissions than they produce, leaving a net negative carbon footprint.
France’s proposed nature-based solutions stand to make an immediate impact on the economy, with job creation and value addition frontloaded across the first five years of project lifetime. The GVA across both project lifetimes totals €620 million, heavily frontloaded to the first five years of each intervention. Job creation follows a similar pattern, with the €393 million proposed investment in coastline resilience and adaptation to climate change creating 85% of its jobs within the first half a decade.
The economic and employment effects of France’s planned NBS interventions are evenly distributed throughout the value chain. Benefitting not only those involved in the nature targeted projects themselves, but also the wider community, is a further advantage of policies designed to stimulate the economy. France’s planned investment in forest resilience stands to generate 54% of its GVA indirectly or inductively. Total investment in the project will also generate nearly 1,500 jobs. Nearly two thirds of these jobs are not directly involved in execution of the project, arising through indirect relationships with the investment activities, or through induced mechanisms, as greater economic prosperity increases employment opportunities throughout the economy.
Figure 59: Value added over time by France’s NBS
Figure 60: Jobs created across the value chain by France’s NBS
0 100 200 300 400 500
Coas
tline
Res
ilien
ceFo
rest
Res
ilien
ce
€ millions
0 - 5 5 - 10 10 - 15
0
500
1000
1500
2000
2500
3000
Coastline Resilience Forest Resilience
Direct Indirect Induced

Fund Nature, Fund the Future
45
Box 4 Supporting job creation by channelling investments towards nature-based solutions
Redirecting €7.5 billion, or 7.5% of France’s NRRP spending, towards nature-based solutions could create a net gain of 30,000 permanent jobs compared to the current plan. A hypothetical “high-jobs scenario” reallocates 7.5% of France’s NRRP spending to underfunded (or absent) nature-based solutions, namely agroforestry, reforestation, wetland restoration, and urban greening. The scenario draws €7.5 billion away from a basket of interventions with worse job creation potential in France than NBS, such as railways development, road network expansion, and housing/green retrofitting. Agroforestry in France has the potential to create one new permanent role for every €43,500 invested, so receives 60% of the reallocated funding. Urban greening projects, reforestation, and wetland restoration initiatives receive 30%, 5%, and 5%, respectively.
Figure 61: Net jobs gain – high-jobs scenario
The same reallocation of resources would reduce the net emissions impact of France’s NRRP by 10 million tonnes CO2eq. The economic activity involved in deploying any policy creates greenhouse gas emissions. While traditional green investments, such as residential energy efficiency upgrades and development of electric vehicle infrastructure encourage climate friendly behaviour, the economic activities involved in the interventions themselves still produce emissions. Even deploying NBS generates emissions, but the natural assets they create have the potential to sequester more carbon than is released throughout the process, in some cases leaving a net-negative emissions footprint. The high-jobs scenario would be responsible for nearly 10 million tonnes CO2eq less than were the same money to be spent on traditional investments.
Figure 62: Emissions differential – high-jobs scenario
-130000 -80000 -30000 20000 70000 120000
Jobs Lost
Jobs Gained
Clean Transport Housing and Retrofitting Mining Traditional TransportAgroforestry Parks and Gardens Wetland Restoration Reforestation
-10000 -8000 -6000 -4000 -2000 0 2000 4000
Reference Emissions
NBS Emissions
ktCO2eq
Clean Transport Housing and Retrofitting Mining Traditional TransportAgroforestry Parks and Gardens Wetland Restoration Reforestation

Fund Nature, Fund the Future
46
Beyond jobs and emissions, the economic benefits of this nature positive reallocation are greater than those of the reference scenario. The high-jobs reallocation outperforms the reference interventions in terms of economic contribution, adding nearly 170% of the value lost by divesting from traditional policies. Receiving 60% of the reallocated funding, agroforestry is responsible for most of this gain, itself recouping more than all the value lost from the reference interventions – over €15 billion.
Figure 63: Net value gain – high-jobs scenario
Box 5 Investing in nature-based solutions proportional to opportunity
This scenario redistributes €7.5 billion, or 7.5% of France’s NRRP spending, between NBS in proportion to the number of hectares potentially available for each intervention. To estimate the net effect on jobs, GVA and emissions, it draws that sum evenly away from a wide range of alternative policies used as a proxy for the NRRP, such as low carbon transport, green building retrofits, mining and railway development. Agroforestry represents the vast majority of available hectares for NBS in France and so receives nearly €6 billion, followed by reforestation (€1.1billion) and wetland restoration (€373 million).
This reallocation generates more jobs in NBS than the current plan creates in alternative sectors, while also favouring jobs early in the lifetime of the investment. Investing €7.5 billion in this array of NBS generates over 150,000 jobs, mostly in agroforestry due to the size of opportunity, while withdrawing this amount from the alternative basket of investments results in the loss of 138,000.
Figure 64: Net jobs gain – proportional to opportunity scenario
-15000 -10000 -5000 0 5000 10000 15000 20000 25000
Value Lost
Value Added
€ millions
Clean Transport Housing and Retrofitting Mining Traditional TransportAgroforestry Parks and Gardens Wetland Restoration Reforestation
-140000 -90000 -40000 10000 60000 110000 160000
Jobs Lost
Jobs Gained
Clean Transport Housing and Retrofitting Mining Traditional TransportAgroforestry Wetland Restoration Reforestation

Fund Nature, Fund the Future
47
Reallocating funding towards NBS results in 17 million tonnes less atmospheric pollution than generated by the reference interventions – clearly demonstrating a strong climate rationale for NBS. Divesting from the basket of traditional interventions reduces the carbon footprint of the NRRP by 3,200 ktCO2eq. While reinvesting the same sum in NBS under this scenario generates nearly 4,500 ktCO2eq, the ability of natural assets to capture atmospheric carbon means the lifetime net emissions of the NBS interventions total -13,800 ktCO2eq.
Figure 65: Emissions differential – proportional to opportunity scenario
The nature-based solutions generate €22.4 billion in GVA – nearly €7.5 billion more than is lost by divesting from traditional interventions, illustrating the strong economic case for NBS. The €6 billion investment in agroforestry is responsible for generating over €20 billion in GVA alone, with reforestation generating €1.7 billion and wetland restoration generating €586 million. This scenario demonstrates the economic potential of nature-based solutions in France, with a significant net gain in GVA achieved by reallocating funding towards nature-positive policies.
Figure 66: Net value gain – proportional to opportunity scenario
-15000 -13000 -11000 -9000 -7000 -5000 -3000 -1000 1000 3000
Reference Emissions
NBS Emissions
ktCO2eq
Clean Transport Housing and Retrofitting Mining Traditional TransportAgroforestry Wetland Restoration Reforestation
-15000 -10000 -5000 0 5000 10000 15000 20000 25000
Value Lost
Value Added
€ millions
Clean Transport Housing and Retrofitting Mining Traditional TransportAgroforestry Wetland Restoration Reforestation

Fund Nature, Fund the Future
48
4.3 Germany
By failing to invest in any nature-based solutions through its NRRP, Germany misses out on the benefits for jobs, the economy and the climate that are delivered through enhancing natural assets. Nature-based solutions are absent from the German recovery plans, meaning the climate-nature co-benefits they entail are also missing. Reallocating even a modest percentage of the total NRRP value towards nature positive interventions would not only be better for the ecosystems and biodiversity but could also improve social and economic recovery.
There is significant potential for Germany to enhance economic and environmental recovery with investment in nature. Modelling the effects of two redistributive scenarios in Germany suggests that there would be major economic and environmental opportunities offered by NBS. The “high-jobs” scenario is shown to improve on reference performance across three key assessment criteria of jobs, emissions, and GVA, while also enhancing nature and biodiversity. The “proportional to opportunity” scenario also outperforms reference interventions across the three indicators, whilst recognising feasibility constraints imposed by geographical characteristics of the country.
Box 6 Supporting job creation by channelling investments towards nature-based solutions
Redirecting €2.3 billion, or 7.5% of Germany’s NRRP spending, towards nature-based solutions could create a net gain of nearly 14,000 permanent jobs compared to the current plan. A hypothetical “high-jobs scenario” reallocates 7.5% of Germany’s NRRP spending to currently absent nature-based solutions, namely agroforestry, reforestation, wetland restoration, and urban greening. The scenario draws roughly €2.3 billion away from a basket of 10 alternative interventions, especially targeting those with the worst job creation potential in Germany, such as roads, railways and residential rooftop solar. Agroforestry in Germany has the potential to create one new permanent role for every €38,000 invested, so receives 60% of the reallocated funding. Urban greening projects, reforestation, and wetland restoration initiatives receive 30%, 5%, and 5%, respectively.
Figure 67: Net jobs gain – high jobs scenario
The same reallocation of resources would reduce the net emissions impact of Germany’s NRRP by 2.7 million tonnes CO2e. The economic activity involved in deploying any policy creates greenhouse gas emissions. While traditional green investments, such as residential energy efficiency upgrades and development of electric vehicle infrastructure encourage climate friendly behaviour, the economic activities involved in the interventions themselves still produce emissions. Even deploying NBS generates emissions, but the natural assets they create have the potential to sequester more carbon than is released throughout the process, in some cases leaving a net-negative emissions footprint. The high-jobs scenario
-40000 -30000 -20000 -10000 0 10000 20000 30000 40000 50000 60000
Jobs Lost
Jobs Gained
Clean Transport Housing and Retrofitting Mining Traditional Transport
Agroforestry Parks and Gardens Wetland Restoration Reforestation

Fund Nature, Fund the Future
49
would be responsible for nearly 3 million fewer tonnes CO2eq than were the same money to be spent on a set of alternative investments that serve as a proxy for the NRRP.
Figure 68: Emissions differential – high jobs scenario
Beyond jobs and emissions, the economic benefits of this nature positive reallocation are greater than those of the reference scenario. The high-jobs reallocation outperforms the reference interventions in terms of economic contribution, adding nearly 150% of the value lost by divesting from traditional policies. Receiving 60% of the reallocated funding, agroforestry is responsible for most of this gain, itself recouping more than all the value lost from the reference interventions – nearly €4 billion.
Figure 69: Net value gain – high jobs scenario
Box 7 Investing in nature-based solutions proportional to opportunity
This scenario redistributes €2.3 billion, or 7.5% of Germany’s NRRP spending, between NBS in proportion to the number of hectares potentially available for each intervention. To estimate the net effect on jobs, GVA and emissions, it draws that sum evenly away from a wide range of alternative policies used as a proxy for the NRRP, such as low carbon transport, green building retrofits, housing, roads and railway development. Agroforestry represents the vast majority of available hectares for NBS in Germany and so receives nearly €2 billion, followed by reforestation (€253million) and wetland restoration (€46million).
-6000 -4000 -2000 0 2000 4000 6000 8000
Value Lost
Value Added
€ millions
Clean Transport Housing and Retrofitting Mining Traditional Transport
Agroforestry Parks and Gardens Wetland Restoration Reforestation
-2500 -2000 -1500 -1000 -500 0 500 1000 1500
Reference Emissions
NBS Emissions
ktCO2eq
Clean Transport Housing and Retrofitting Mining Traditional TransportAgroforestry Parks and Gardens Wetland Restoration Reforestation

Fund Nature, Fund the Future
50
This reallocation generates more jobs in NBS than the current plan creates in alternative sectors, while also favouring jobs early in the lifetime of the investment. Investing €2.3 billion in this array of NBS generates over 56,000 jobs, mostly in agroforestry due to the size of opportunity, while withdrawing this amount from the alternative basket of investments results in the loss of 43,000.
Figure 70: Net jobs gain – proportional to opportunity scenario
Reallocating funding towards NBS results in 4.4 million fewer tonnes of CO2eq than are generated by the reference interventions, clearly demonstrating a strong climate rationale for NBS. Divesting from the basket of alternative interventions reduces the carbon footprint of the NRRP by 1,400 ktCO2eq, while reinvesting the same sum in NBS under this scenario generates nearly 1,800 kt CO2eq. The ability of natural assets to capture atmospheric carbon means the lifetime net emissions of the NBS interventions are net negative at -3,000 ktCO2eq.
Figure 71: Emissions differential – proportional to opportunity scenario
The nature-based solutions generate €6.2 billion in GVA – nearly €2 billion more than is lost by divesting from a basket of alternative interventions, illustrating the strong economic case for NBS. The €2 billion investment in agroforestry is responsible for generating over €5.8 billion in GVA alone, with reforestation generating €362 million and wetland restoration generating €67 million. This scenario demonstrates the economic potential of nature-based solutions in Germany, with a significant net gain in GVA achieved by reallocating funding towards nature-positive policies.
-50000 -30000 -10000 10000 30000 50000 70000
Jobs Lost
Jobs Gained
Clean Transport Housing and Retrofitting Mining Traditional Transport
Agroforestry Wetland Restoration Reforestation
-3500 -3000 -2500 -2000 -1500 -1000 -500 0 500 1000 1500 2000
Reference Emissions
NBS Emissions
Clean Transport Housing and Retrofitting Mining Traditional TransportAgroforestry Wetland Restoration Reforestation

Fund Nature, Fund the Future
51
Figure 72: Net value addition – proportional to opportunity scenario
-6000 -4000 -2000 0 2000 4000 6000 8000
Value Lost
Value Added
€ millions
Clean Transport Housing and Retrofitting Mining Traditional TransportAgroforestry Wetland Restoration Reforestation

Fund Nature, Fund the Future
52
4.4 Italy
Italy’s planned investments in agroforestry and urban greening demonstrate the potential role of nature-based solutions in economic recovery. The investments are sizeable, with €330 million allocated to urban forestry initiatives and €140 million to support green communities in rural areas, modelled as agroforestry.
Italy’s proposed nature based-solutions stand to make an immediate impact on the economy, with job creation and value addition frontloaded across the first five years of project lifetime. The combined value added in the first five years across both initiatives totals €800 million, an attractive property of investments designed to stimulate the economy following the downturn of the COVID-19 crisis. Job creation follows a similar pattern, with the €326 million proposed investment in urban forestry set to create 75% of its jobs within the first half a decade.
The economic and employment effects of Italy’s planned NBS interventions are evenly distributed throughout the value chain. Benefitting not only those involved in the NBS projects themselves, but also the wider community, is a further advantage of policies designed to stimulate wide ranging economic prosperity. For example, Italy’s €135 million investment in rural agroforestry projects generates nearly 50% of its added value indirectly or inductively. Total investment across both projects of over €450 million will generate 12,400 jobs. More than 50% of these jobs are not directly involved in execution of the project, arising through indirect relationships with the investment activities, or through induced mechanisms, as greater economic prosperity increases employment opportunities throughout the country.
Figure 73: Value added over time by Italy’s NBS
Figure 74: Jobs created across the value chain by Italy’s NBS

Fund Nature, Fund the Future
53
Box 8 Supporting job creation by channelling investments towards nature-based solutions
Redirecting €14.8 billion, or 7.5% of Italy’s NRRP spending, towards nature-based solutions could create a net gain of nearly 235,000permanent jobs compared to the current plan. A hypothetical “high-jobs scenario” reallocates 7.5% of Italy’s large NRRP spending to underfunded (or absent) nature-based solutions, namely agroforestry, reforestation, wetland restoration, and urban greening. The scenario draws nearly €15 billion away from a basket of 10 alternative interventions, especially targeting those with the worst job creation potential in Italy, such as roads, railways and residential rooftop solar. Agroforestry in Italy has the potential to create one new permanent role for every €28,000 invested, so receives 60% of the reallocated funding. Urban greening projects, reforestation, and wetland restoration initiatives receive 30%, 5%, and 5%, respectively.
Figure 75: Net jobs gain – high jobs scenario
The same reallocation of resources would reduce the net emissions impact of Italy’s NRRP by 24 million tonnes CO2eq. The economic activity involved in deploying any policy creates greenhouse gas emissions. While traditional green investments, such as residential energy efficiency upgrades and development of renewable energy infrastructure encourage climate friendly behaviour, the economic activities involved in the interventions themselves still produce emissions. Even deploying NBS generates emissions, but the natural assets they create have the potential to sequester more carbon than is released throughout the process, in some cases leaving a net-negative emissions footprint. The high-jobs scenario would be responsible for 24 million fewer tonnes CO2eq than were the same money to be spent on a set of alternative investments that serve as a proxy for the NRRP.
Figure 76: Emissions differential – high jobs scenario
-300000 -200000 -100000 0 100000 200000 300000 400000 500000
Jobs Lost
Jobs Gained
Clean Transport Housing and Retrofitting Mining Traditional Transport
Agroforestry Parks and Gardens Wetland Restoration Reforestation
-20000 -15000 -10000 -5000 0 5000 10000
Reference Emissions
NBS Emissions
ktCO2eq
Clean Transport Housing and Retrofitting Mining Traditional TransportAgroforestry Parks and Gardens Wetland Restoration Reforestation

Fund Nature, Fund the Future
54
Beyond jobs and emissions, the economic benefits of this nature positive reallocation are greater than those of the reference scenario. The high-jobs reallocation outperforms the reference interventions in terms of economic contribution, adding over 170% of the value lost by divesting from alternative policies. Receiving 60% of the reallocated funding, agroforestry is responsible for most of this gain, itself recouping more than all the value lost from the reference interventions – over €29 billion across the project lifetime.
Figure 77: Net value gain – high jobs scenario
Box 9 Investing in nature-based solutions proportional to opportunity
This scenario redistributes €14.8 billion, or 7.5% of Italy’s NRRP spending, between NBS in proportion to the number of hectares potentially available for each intervention. To estimate the net effect on jobs, GVA and emissions, it draws that sum evenly away from a wide range of alternative policies used as a proxy for the NRRP, such as low carbon transport, green building retrofits, mining and housing. Agroforestry represents the vast majority of available hectares for NBS in Italy and so receives nearly € 13.3 billion, followed by reforestation (€1.2billion) and wetland restoration (€296 million).
This reallocation generates more jobs in NBS than the current plan creates in alternative sectors, while also favouring jobs early in the lifetime of the investment. Investing €14.8 billion in this array of NBS generates nearly half a million jobs, mostly in agroforestry due to the size of opportunity, while withdrawing this amount from the alternative basket of investments results in the loss of 300,000 jobs.
Figure 78: Net jobs gain – proportional to opportunity scenario
-30000 -20000 -10000 0 10000 20000 30000 40000 50000
Value Lost
Value Added
€ millions
Clean Transport Housing and Retrofitting Mining Traditional TransportAgroforestry Parks and Gardens Wetland Restoration Reforestation
-300000 -200000 -100000 0 100000 200000 300000 400000 500000
Jobs Lost
Jobs Gained
Clean Transport Housing and Retrofitting Mining Traditional TransportAgroforestry Wetland Restoration Reforestation

Fund Nature, Fund the Future
55
Reallocating funding towards NBS results in 29 million fewer tonnes of CO2eq than generated by the reference interventions,clearly demonstrating a strong climate rationale for NBS. Divesting from the basket of traditional interventions reduces the carbon footprint of the NRRP by 6,800 ktCO2eq. While reinvesting the same sum in NBS under this scenario generates 7,700 kt CO2eq, the ability of natural assets to capture atmospheric carbon means the lifetime emissions of the NBS interventions total net negative value of -22,000 ktCO2eq.
Figure 79: Emissions differential – proportional to opportunity scenario
The nature-based solutions generate €46 billion in GVA – over € 18 billion more than is lost by divesting from traditional interventions, illustrating the strong economic case for NBS. The €13.3 billion investment in agroforestry is responsible for generating nearly €44 billion in GVA alone, with reforestation generating nearly €2 billion and wetland restoration generating €481 million. This scenario demonstrates the economic potential of nature-based solutions in Italy, with a significant net gain in GVA achieved by reallocating funding towards nature-positive policies.
Figure 80: Net value addition – proportional to opportunity scenario
-25000 -20000 -15000 -10000 -5000 0 5000
Reference Emissions
NBS Emissions
Clean Transport Housing and Retrofitting Mining Traditional TransportAgroforestry Wetland Restoration Reforestation
-30000 -20000 -10000 0 10000 20000 30000 40000 50000
Value Lost
Value Added
€ millions
Clean Transport Housing and Retrofitting Mining Traditional TransportAgroforestry Wetland Restoration Reforestation

Fund Nature, Fund the Future
56
4.5 Poland
Through its NRRP, Poland makes a sizeable investment in urban greening, encouraging economic and environmental recovery in densely populated spaces. The investment in city parks, gardens, and revitalisation, worth €2.8 billion over the project lifetime, is a good example of how economic outcomes can be achieved through investment in nature. The remainder of the NRRP, however, lacks other nature-based solutions, despite the strong potential to support economic recovery demonstrated by this single policy.
aa
Poland’s proposed nature based-solution stands to make an immediate impact on the economy, with job creation and value addition frontloaded across the first five years of project lifetime. Poland’s NBS amounts to over €4.8 billion of gross value added to the economy, a desirable property of a policy designed to stimulate the economy following the downturn of the COVID-19 crisis. Job creation follows a similar pattern, with the €2.8 billion proposed investment in urban forestry set to create nearly 100,000 jobs within the first half a decade.
The economic and employment effects of Poland’s planned NBS interventions are evenly distributed throughout the value chain. Benefitting not only those involved in the nature targeted projects themselves, but also the wider community, is a further advantage of policies designed to stimulate economic prosperity. Poland’s significant spending on urban greening is set to generate nearly 60% of its added value indirectly or inductively. In total, 122,00 jobs could be generated by this project, over its assumed 15 year operating lifespan. More than 60% of these jobs are not directly involved in execution of the project, arising through indirect relationships with the investment activities, or through induced mechanisms, as greater economic prosperity increases employment opportunities throughout the country.
Figure 81: Value added over time by Poland’s NBS
Figure 82: Jobs created across the value chain by NBS in Poland
0 1000 2000 3000 4000 5000 6000
City
Gre
enin
g &
Rev
italis
atio
n
€ millions
0-5 5-10 10-15
0
20000
40000
60000
80000
100000
120000
140000
City Greening & Revitalisation
Induced
Indirect
Direct
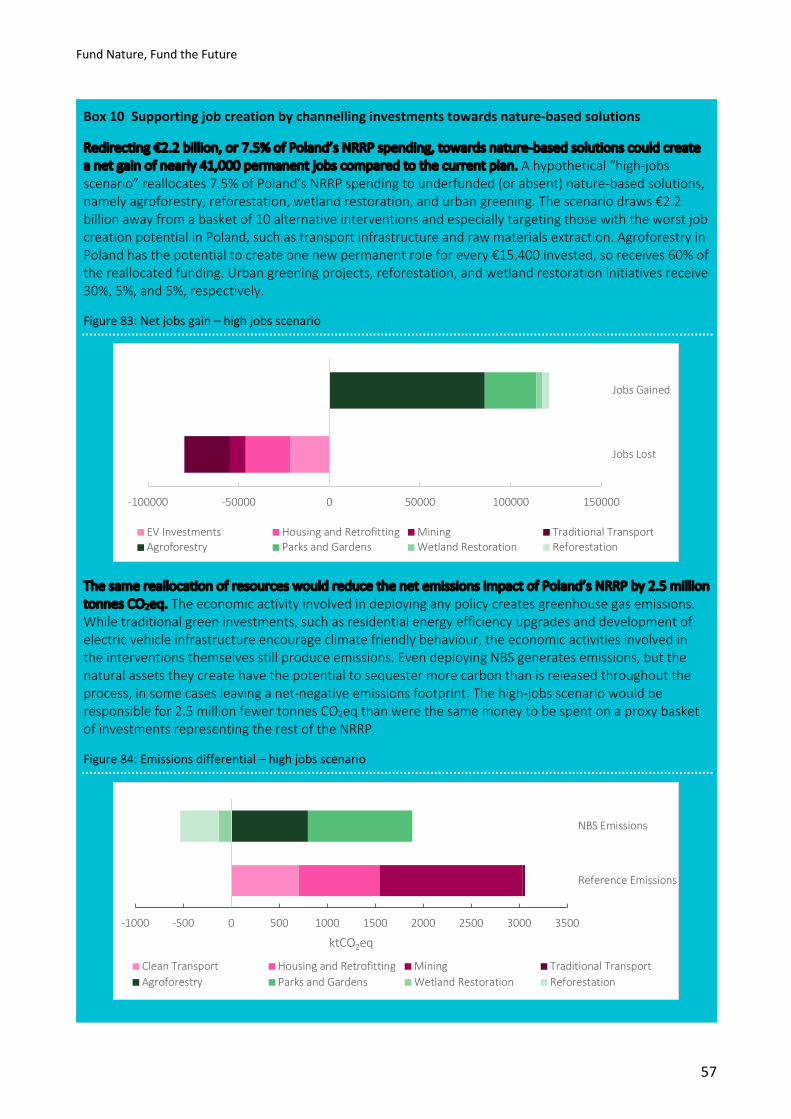
Fund Nature, Fund the Future
57
Box 10 Supporting job creation by channelling investments towards nature-based solutions
Redirecting €2.2 billion, or 7.5% of Poland’s NRRP spending, towards nature-based solutions could create a net gain of nearly 41,000 permanent jobs compared to the current plan. A hypothetical “high-jobs scenario” reallocates 7.5% of Poland’s NRRP spending to underfunded (or absent) nature-based solutions, namely agroforestry, reforestation, wetland restoration, and urban greening. The scenario draws €2.2 billion away from a basket of 10 alternative interventions and especially targeting those with the worst job creation potential in Poland, such as transport infrastructure and raw materials extraction. Agroforestry in Poland has the potential to create one new permanent role for every €15,400 invested, so receives 60% of the reallocated funding. Urban greening projects, reforestation, and wetland restoration initiatives receive 30%, 5%, and 5%, respectively.
Figure 83: Net jobs gain – high jobs scenario
The same reallocation of resources would reduce the net emissions impact of Poland’s NRRP by 2.5 million tonnes CO2eq. The economic activity involved in deploying any policy creates greenhouse gas emissions. While traditional green investments, such as residential energy efficiency upgrades and development of electric vehicle infrastructure encourage climate friendly behaviour, the economic activities involved in the interventions themselves still produce emissions. Even deploying NBS generates emissions, but the natural assets they create have the potential to sequester more carbon than is released throughout the process, in some cases leaving a net-negative emissions footprint. The high-jobs scenario would be responsible for 2.5 million fewer tonnes CO2eq than were the same money to be spent on a proxy basket of investments representing the rest of the NRRP.
Figure 84: Emissions differential – high jobs scenario
-100000 -50000 0 50000 100000 150000
Jobs Lost
Jobs Gained
EV Investments Housing and Retrofitting Mining Traditional TransportAgroforestry Parks and Gardens Wetland Restoration Reforestation
-1000 -500 0 500 1000 1500 2000 2500 3000 3500
Reference Emissions
NBS Emissions
ktCO2eq
Clean Transport Housing and Retrofitting Mining Traditional TransportAgroforestry Parks and Gardens Wetland Restoration Reforestation

Fund Nature, Fund the Future
58
Beyond jobs and emissions, the economic benefits of this nature positive reallocation are greater than those of the reference scenario. The high-jobs reallocation outperforms the reference interventions in terms of economic contribution, adding over 180% of the value lost by divesting from alternative policies. Receiving 60% of the reallocated funding, agroforestry is responsible for most of this gain, itself recouping more than all the value lost from the reference interventions – over € 3.6 billion across the project lifetime.
Figure 85: Net value gain – high jobs scenario
Box 11 Investing in nature-based solutions proportional to opportunity
This scenario redistributes €2.2 billion, or 7.5% of Poland’s NRRP spending, between NBS in proportion to the number of hectares potentially available for each intervention. To estimate the net effect on jobs, GVA and emissions, it draws that sum evenly away from a wide range of alternative policies used as a proxy for the NRRP, such as low carbon transport, green building retrofits, mining and railway development. Agroforestry represents the majority of available hectares for NBS in Poland and so receives €1 billion, though reforestation is also sizeable, receiving €717million, followed by wetland restoration (€391million).
This reallocation generates more jobs in NBS than the current plan creates in alternative sectors, while also favouring jobs early in the lifetime of the investment. Investing €2.2 billion in this array of NBS generates over 100,000 jobs, mostly in agroforestry due to the size of opportunity, while withdrawing this amount from the alternative basket of investments results in the loss of 98,000.
Figure 86: Net jobs gain – proportional to opportunity scenario
-4000 -3000 -2000 -1000 0 1000 2000 3000 4000 5000 6000
Value Lost
Value Added
€ millions
EV Investments Housing and Retrofitting Mining Traditional TransportAgroforestry Parks and Gardens Wetland Restoration Reforestation
-100000 -50000 0 50000 100000
Jobs Lost
Jobs Gained
EV Investments Housing and Retrofitting Mining Traditional TransportAgroforestry Wetland Restoration Reforestation

Fund Nature, Fund the Future
59
Reallocating funding towards NBS results in 6.4 million fewer tonnes of CO2 emissions than are generated by the reference interventions, clearly demonstrating a strong climate rationale for NBS. Divesting from the basket of traditional interventions reduces the carbon footprint of the NRRP by 3,900 ktCO2eq, while reinvesting the same sum in NBS under this scenario generates 3,800 kt CO2eq. The ability of natural assets to capture atmospheric carbon means the lifetime emissions of the NBS interventions are a net negative of –2,500 ktCO2eq.
Figure 87: Emissions differential – proportional to opportunity scenario
The nature-based solutions generate €4.5 billion in GVA – nearly € 1 billion more than is lost by divesting from traditional interventions, illustrating the strong economic case for NBS. The € 1 billion investment in agroforestry is responsible for generating nearly €3 billion in GVA alone, with reforestation generating nearly €1 billion and wetland restoration generating €515 million. This scenario demonstrates the economic potential of nature-based solutions in Poland, with a significant net gain in GVA achieved by reallocating funding towards nature-positive policies.
Figure 88: Net value addition – proportional to opportunity scenario
-4000 -3000 -2000 -1000 0 1000 2000 3000 4000
Reference Emissions
NBS Emissions
Clean Transport Housing and Retrofitting Mining Traditional TransportAgroforestry Wetland Restoration Reforestation
-4000 -3000 -2000 -1000 0 1000 2000 3000 4000 5000
Value Lost
Value Added
€ millions
EV Investments Housing and Retrofitting Mining Traditional TransportAgroforestry Parks and Gardens Wetland Restoration Reforestation

Fund Nature, Fund the Future
60
Appendix 1: GSI methodology
The index is constructed by combining the flow of stimulus into five key sectors with an indicator of each sector’s environmental impact, the latter accounting for both historical trends and specific measures taken under the country’s stimulus. The impact indicator assigns a greenness value (positive or negative) to each sector for every country based on the methodology discussed below. The overall GSI is an indicator of the total fiscal spending in response to COVID-19 categorised as either a positive or negative impact on the environment. The final index for each country is an average of sectoral impact, normalised to a scale of -1 to 1. The five sectors are chosen for their historical impact on climate and environment: agriculture, energy, industry, waste and transport.
An estimated 51% of NRRP funding will flow through the sectors of energy, industry, transport, waste and agriculture. Despite some targeted stimulus measures to support environmental improvements, overall flows into these sectors of interest remain harmful because of their historical performance. To date, a relatively small number of stimulus measures contain clear pro-environmental conditions. A majority of fiscal stimulus measures currently passed and likely to flow to environmentally-intensive sectors do not have an explicit focus on climate change and environmental goals.
Two components of the stimulus were analysed: the size of the fiscal flow (F value) to each environmentally-intensive sector, and the overall impact of that stimulus on climate and environment (B value).
- B is a scaled indicator from -1 to 1 which rates sectors by level of overall greenness from most pro-environmental at 1 to least environmental at -1. The B value differentiates between underlying sector context (b1) and specific environmental measures (b2).
- b1 refers to our baseline evaluation of each country using ‘off the shelf’ environmental indicators.10 This captures the country’s underlying environmental performance. This includes an evaluation of its rating on multiple environmental performance indicators, and the overall country’s climate target progression.
- b2 is a consideration of any COVID-19 response-specific data we have found that either supports or undermines the baseline value. It takes a negative value if stimulus support boosts harmful activities without regard to environmental targets or deregulates to roll back environmental conditions. It takes a positive value if stimulus support advances pro-environmental programmes or includes conditions on environmental performance (for more information on composition of b2, see further on in this Annex). Both quantified stimulus measures (e.g. an amount of funding designated for a certain project) and unquantified stimulus measures (e.g. rollbacks of environmental regulations that would theoretically reduce compliance costs for firms) can contribute to b2 values (see specific b2 section below for more detail).
- In this NRRPs analysis, the indicators have each been split between a climate and a nature component. Therefore, for each country, a climate-only score is calculated based on the size of the fiscal flow for climate spending (value), a climate baseline and a climate impact indicator. Likewise, a nature-only score is calculated using the size of the fiscal spending flowing to nature, a nature baseline, and a nature impact indicator. Finally, a mixed index, which gives equal consideration to both nature and climate impact, combines the nature and climate indicators and fiscal flows to provide a more comprehensive understanding of the environmental impact of the NRRPs.
10 Key indicators used for the construction of baseline performance are the Climate Action Tracker (https://climateactiontracker.org/countries/), Environmental Performance Index (https://epi.yale.edu/), and GermanWatch Climate Change Performance Index (https://germanwatch.org/en/CCPI).

Fund Nature, Fund the Future
61
Each environment-specific stimulus measure is categorised against positive and negative archetype interventions. Table 1 and Table 2 describe these policy archetypes respectively.
Table 1 Summary of positive policy archetypes
Sector Archetype Description
Agriculture
Bailouts with green
strings attached Requiring limits to emissions or waste in return for direct funding.
Nature-based
solutions
Afforestation and reforestation programmes, restoration of wetlands, or
forest management investments.
Loans and grants for
green investments
Direct loans or tax rebates and subsidies, e.g. for high-efficiency water
irrigation systems.
Conservation and
wildlife protection
programmes
Making the sale of endangered animals illegal.
Energy
Bailouts with green
strings attached
Direct loans and guarantees for oil, gas and coal with commitments for
improvement on emissions or energy efficiency.
Loan and grants for
green investments
Direct investment in the form of loans or grants towards renewable energy
including solar, wind, biofuels and hydrogen.
Green R&D subsidies Grants for research institutes, academic institutes, and private firms to
develop new renewable energy technologies and systems.
Subsidies or tax
reductions for green
products
Extending tax rebates to households for rooftop solar, or making green energy
products including utility tariffs with renewable targets available at a
subsidised cost.
Industry
Bailouts with green
strings attached
Conditions on firms relating to emissions, pollution, supply chain
requirements, or compliance with voluntary agreements or reporting
standards.
Loan and grants for
green investments
Low carbon or low emissions public infrastructure including CCS projects for
industry, energy efficiency programmes for existing buildings, investment in
the hydrogen economy and electrification of industry.
Green R&D subsidies
Direct grants or loans available to research institutions, academic institutions,
and private firms to develop low-carbon industrial technologies such as CCS,
hydrogen, and electrification.
Subsidies or tax
reductions for green
products
Taxes for the use of primary materials in supply chain, subsidies offered to
firms that ensure compliance in their supply chains.

Fund Nature, Fund the Future
62
Sector Archetype Description
Transport
Bailouts with green
strings attached
Conditional bailouts to air carriers, car manufacturers, or shipping for
emissions reduction pledges or commitment to use biofuel or renewable fuel
standards in exchange for loans.
Loan and grants for
green investments
Building public infrastructure projects including cycleways, low-carbon rail or
other mass transit, public walkways, and railroads with consideration towards
climate mitigation and adaptation.
Green R&D subsidies
Loans or research grants available to academic institutions, research centres,
think tanks and private firms to develop electric vehicles, hydrogen vehicles,
and low-carbon fuel alternatives for shipping, aviation and vehicle transport.
Subsidies or tax
reductions for green
products
Tax rebates available to consumers for EVs, subsidies for low carbon
transportation including light rail, developing HOV lanes or low-emission
zones fees.
Waste
Bailouts with green
strings attached
Tying bailouts to commitments to shift from waste incineration to more
sustainable waste management strategies.
Loan and grants for
green investments
Direct investment in recycling, Municipal Solid Waste, waste-to-energy, or
methane recapture on existing facilities or new waste management facilities.
Green R&D subsidies
Loans or grants for academic institutions, research centres, think tanks, or
private firms for the development of advanced waste management include
waste-to-energy and methane recapture technologies.
Subsidies or tax
reductions for green
products
Tax reductions or rebates for recycling, composting including buy-back
programmes or subsidisation of environmental producer responsibility (EPR)
programmes.
Note: Definition includes examples but may include additional and alternative programmes. Source: Vivid Economics
Table 2: Summary of negative policy archetypes
Sector Archetype Description
Agriculture
Subsidies or waived
fees for
environmentally
harmful activities
Waiving, reducing, or directly subsidising fees for point and non-point source
pollution in agriculture, logging, and timber. Removal of conservation or
preservation laws around forest management and access.
Deregulation of
environmental
standards
Removing, repealing, increasing the quantity of pollutants allowed or
extending the compliance period for pollution, emissions, or land use change
in agriculture and forestry sectors.

Fund Nature, Fund the Future
63
Sector Archetype Description
Environmentally
related bailout
without green
strings
Loans, guarantees or grants provided to agricultural producers including
farmers, fishers and cattle ranchers that do not require improvement in
sustainable practices.
Subsidies or tax
reductions for
environmentally
harmful products
Introducing subsidies for high emissions agricultural products including cattle
and sheep, reducing existing carbon taxes or environmental taxes on high-
impact agriculture and harvested wood products.
Energy
Subsidies or waived
fees for
environmentally
harmful activities
Subsidising utilities, producers, or developers of oil and gas or coal production
plants, covering the cost of pollution taxes including carbon taxes, delaying
the development or deployment of emissions taxes for energy producers.
Environmentally
harmful
infrastructure
investments
Direct investment in coal or oil and gas sector, or loans, grants and guarantees
made available to private firms exclusively to build oil and gas or coal
production plants.
Deregulation of
environmental
standards
Removal or elimination of carbon trading schemes, increasing the cap on
emissions or pollution trading schemes, decreasing the number of firms
required to participate in emissions trading schemes, removing mandates for
environmental reporting or disclosure, suspending enforcement of
environmental regulation.
Environmentally
related bailout
without green
strings
Extending loans, grants, guarantees, or other financing to oil and gas or coal
producers without conditions on emissions intensity, emissions output, or
energy mix.
Subsidies or tax
reductions for
environmentally
harmful products
Subsidies for consumers or producers of oil and gas and coal including diesel,
home electricity, and utilities and reducing existing fuel taxes or carbon taxes.
Industry
Subsidies or waived
fees for
environmentally
harmful activities
Waiving permitting and environmentally-related fees for mining, construction
or other heavy industrial sectors.
Environmentally
harmful
infrastructure
investments
Direct government investment in high emissions public infrastructure
including factories, data centres, and non-energy efficient building stock or
heating systems
Deregulation of
environmental
standards
Removal of reporting or mandatory disclosure of environmental impacts by
industrial firms, suspension of enforcement of environmental laws and
regulations, removal of permit or use requirements for industry, fast-tracking

Fund Nature, Fund the Future
64
Sector Archetype Description
of environmentally intensive industrial project development by removing
environmental assessments.
Environmentally
related bailout
without green
strings
Direct unconditional support through grants, loans, guarantees, or other
financial mechanisms to high-emissions industrial sectors without
requirements for efficiency, energy use, or reporting improvements.
Subsidies or tax
reductions for
environmentally
harmful products
Reducing taxes on environmentally intensive products including
manufactured goods and chemicals which have a high environmental impact.
Transport
Subsidies or waived
fees for
environmentally
harmful activities
Direct subsidisation of combustion engines made available to consumers or
producers, removal or reduction of the fees related to tailpipe emissions or
fuel taxes.
Environmentally
harmful
infrastructure
investments
Direct government investment into infrastructure supporting polluting
transport, such as airports or roads.
Deregulation of
environmental
standards
Removal of regulations governing the transport sector, such as for ships and
aviation and largely relating to emissions.
Environmentally
related bailout
without green
strings
Direct unconditional support through grants, loans, guarantees, or other
financial mechanisms to high emissions transport providers, such as airlines.
Subsidies or tax
reductions for
environmentally
harmful products
Reducing taxes on the sale of high-polluting products such as automobiles,
with no preferential treatment of ‘green’ alternatives such as electric vehicles.
Waste
Subsidies or waived
fees for
environmentally
harmful activities
The removal of fees relating to the environmentally harmful disposal or
treatment of waste.
Environmentally
harmful
infrastructure
investments
Investments into waste infrastructure that do not improve the environmental
impact of waste disposal or treatment.

Fund Nature, Fund the Future
65
Sector Archetype Description
Deregulation of
environmental
standards
Removal of regulations governing the disposal and/or treatment of waste.
Environmentally
related bailout
without green
strings
Extending bailouts to waste industries which openly incinerate or do not use
methane recapture, or other advanced waste management systems without
requirements for meeting environmental reporting standards.
Note: Definition includes examples but may include additional and alternative programmes. Source: Vivid Economics
The b2 score is calculated based on the environmental impact of the policy archetype and a specific assessment of the stimulus measure, based on its intensity and coverage:
• Intensity: Each measure is rated on intensity from 1 to 5, with one as the least intense and five as the most intense. The impacts on the environment may be intense in either positive or negative trajectories. Intensity depends on three components: the irreversibility of environmental damage or gain, the concentration or diffusion of impact on environmental and natural systems, and the level of lock-in to either positive or negative development resulting from the policy.
An example of an intense negative policy (5) is direct investment in new coal or oil/gas technologies. These projects directly emit carbon into the atmosphere, causing irreversible damage. Pollution from these projects disperses into the air becoming a global externality. Coal and oil and gas assets lock in countries to environmentally harmful trajectories and risk becoming stranded assets.
An example of a somewhat intense green policy (3) is a subsidy for electric vehicles. The avoided emissions by using EV reduce the amount of irreversible emissions in the atmosphere. Using electricity instead of oil avoids direct air pollution. EV uptake encourages increased adoption through positive externalities associated with a network of ownership, encouraging more uptake and subsequently a green lock-in effect.
An example of a less intense negative policy (1) is a temporary fee suspension for environmentally harmful activities, but subsequently resuming fee collection.
• Coverage: The coverage of a quantified stimulus measure is determined by the monetary size of the policy, on a scale from 1 to 5, with 1 as the least amount of coverage and 5 the highest. For instance, if a country passed two policies with the same intensity score (for example one policy allocating funds to solar energy, and another to wind energy), then the policy with a larger budget would have a larger impact on the sector score and thus on the final index score. The coverage of an unquantified measure is rated by level of directness, the number of subsectors or individual firms in a sector that will be impacted, and the temporal coverage (how far into the future will this positive or negative policy exist).
An example of a high coverage negative policy (5) is the suspension of all environmental regulations on industry. Removing the monitoring, enforcement and compliance of environmental standards would extend coverage to all firms in the sector, having both direct effects and indirect effects.
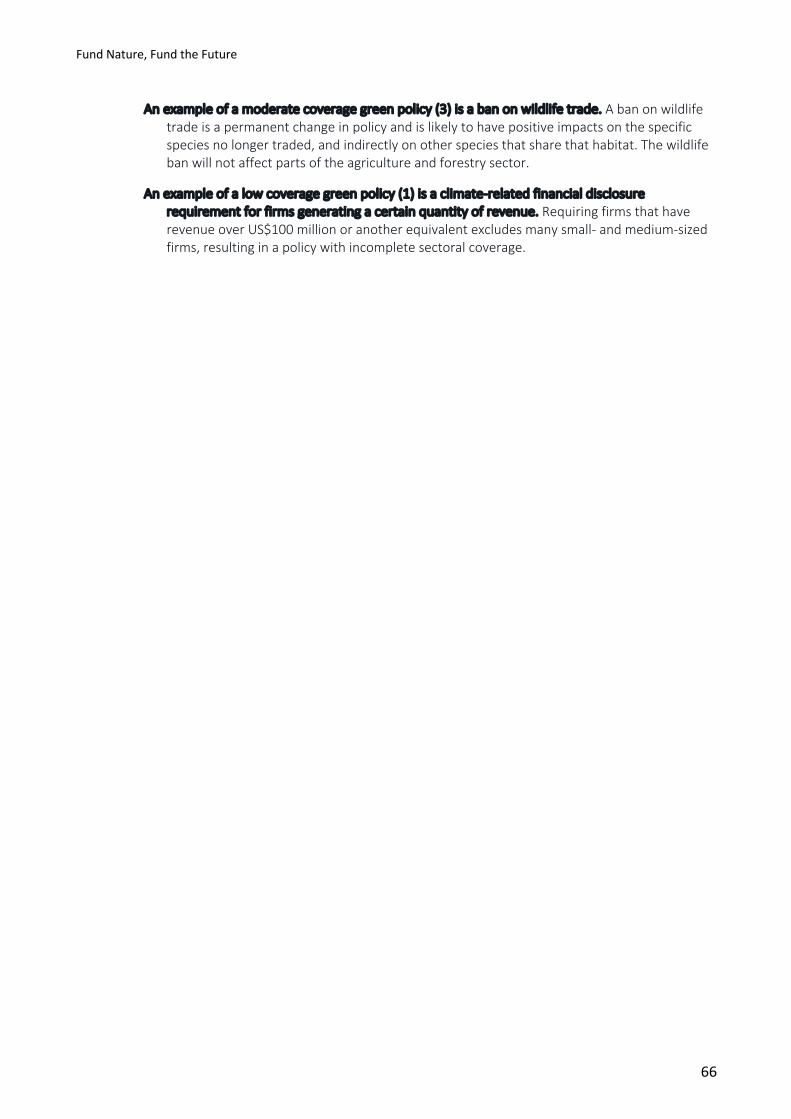
Fund Nature, Fund the Future
66
An example of a moderate coverage green policy (3) is a ban on wildlife trade. A ban on wildlife trade is a permanent change in policy and is likely to have positive impacts on the specific species no longer traded, and indirectly on other species that share that habitat. The wildlife ban will not affect parts of the agriculture and forestry sector.
An example of a low coverage green policy (1) is a climate-related financial disclosure requirement for firms generating a certain quantity of revenue. Requiring firms that have revenue over US$100 million or another equivalent excludes many small- and medium-sized firms, resulting in a policy with incomplete sectoral coverage.
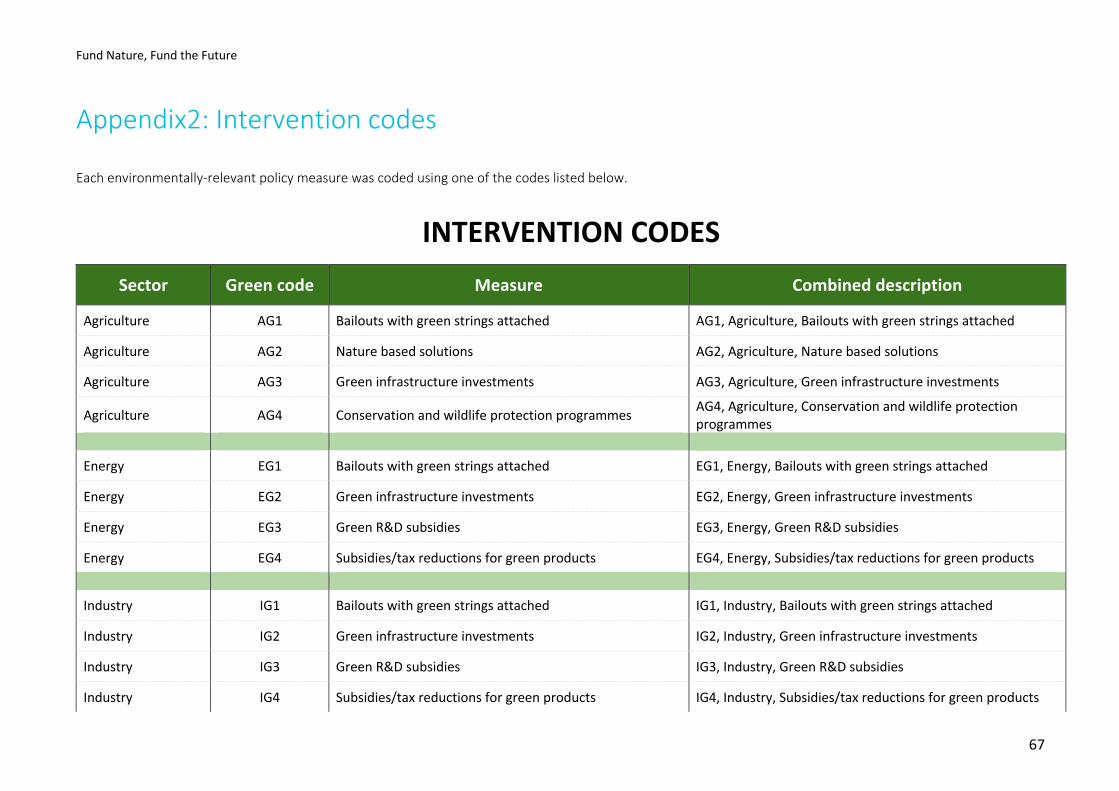
Fund Nature, Fund the Future
67
Appendix2: Intervention codes
Each environmentally-relevant policy measure was coded using one of the codes listed below.
INTERVENTION CODES Sector Green code Measure Combined description
Agriculture AG1 Bailouts with green strings attached AG1, Agriculture, Bailouts with green strings attached
Agriculture AG2 Nature based solutions AG2, Agriculture, Nature based solutions
Agriculture AG3 Green infrastructure investments AG3, Agriculture, Green infrastructure investments
Agriculture AG4 Conservation and wildlife protection programmes AG4, Agriculture, Conservation and wildlife protection programmes
Energy EG1 Bailouts with green strings attached EG1, Energy, Bailouts with green strings attached
Energy EG2 Green infrastructure investments EG2, Energy, Green infrastructure investments
Energy EG3 Green R&D subsidies EG3, Energy, Green R&D subsidies
Energy EG4 Subsidies/tax reductions for green products EG4, Energy, Subsidies/tax reductions for green products
Industry IG1 Bailouts with green strings attached IG1, Industry, Bailouts with green strings attached
Industry IG2 Green infrastructure investments IG2, Industry, Green infrastructure investments
Industry IG3 Green R&D subsidies IG3, Industry, Green R&D subsidies
Industry IG4 Subsidies/tax reductions for green products IG4, Industry, Subsidies/tax reductions for green products

Fund Nature, Fund the Future
68
Transport TG1 Bailouts with green strings attached TG1, Transport, Bailouts with green strings attached
Transport TG2 Green infrastructure investments TG2, Transport, Green infrastructure investments
Transport TG3 Green R&D subsidies TG3, Transport, Green R&D subsidies
Transport TG4 Subsidies/tax reductions for green products TG4, Transport, Subsidies/tax reductions for green products
Waste WG1 Bailouts with green strings attached WG1, Waste, Bailouts with green strings attached
Waste WG2 Green infrastructure investments WG2, Waste, Green infrastructure investments
Waste WG3 Green R&D subsidies WG3, Waste, Green R&D subsidies
Waste WG4 Subsidies/tax reductions for green products WG4, Waste, Subsidies/tax reductions for green products
Sector Brown code Measure Combined description
Agriculture AB1 Fees waived/subsidies for environmentally harmful activities
AB1, Agriculture, Fees waived/subsidies for environmentally harmful activities
Agriculture AB2 Deregulation of environmental standards AB2, Agriculture, Deregulation of environmental standards
Agriculture AB3 Environmentally related bailout without green strings AB3, Agriculture, Environmentally related bailout without green strings
Agriculture AB4 Subsidies/tax reductions for brown products AB4, Agriculture, Subsidies/tax reductions for brown products
Energy EB1 Fees waived/subsidies for environmentally harmful activities
EB1, Energy, Fees waived/subsidies for environmentally harmful activities
Energy EB2 Brown infrastructure investments EB2, Energy, Brown infrastructure investments
Energy EB3 Deregulation of environmental standards EB3, Energy, Deregulation of environmental standards
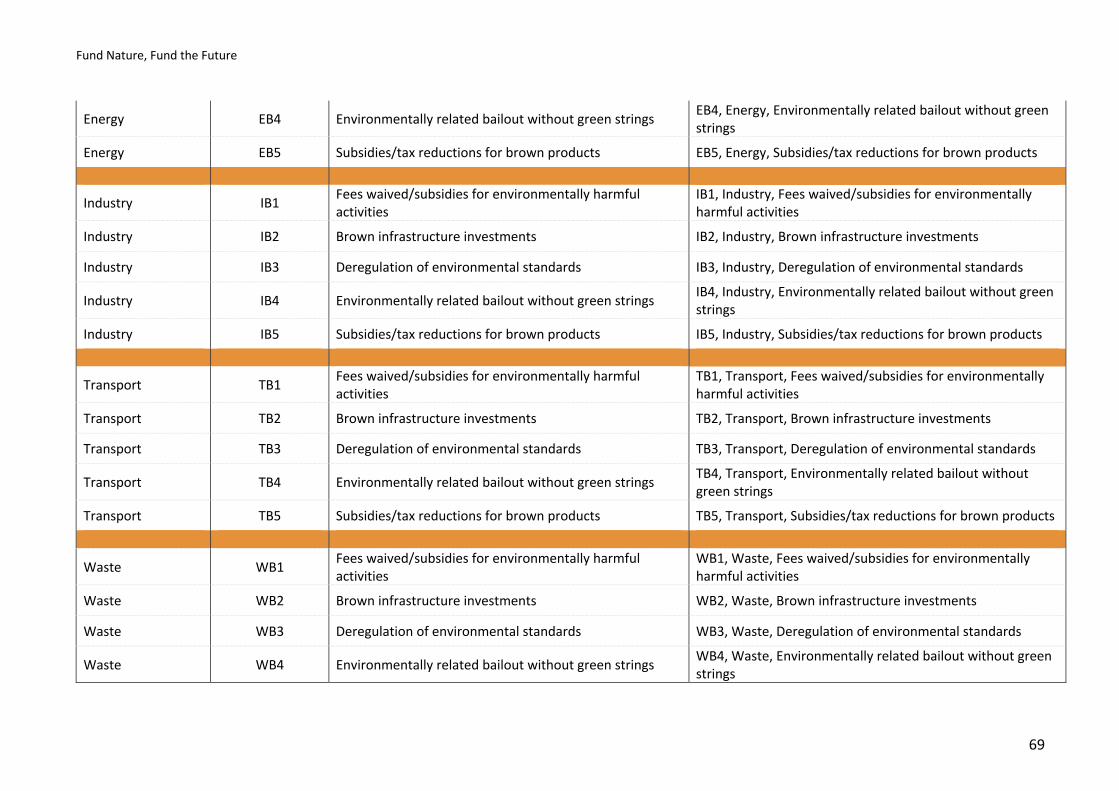
Fund Nature, Fund the Future
69
Energy EB4 Environmentally related bailout without green strings EB4, Energy, Environmentally related bailout without green strings
Energy EB5 Subsidies/tax reductions for brown products EB5, Energy, Subsidies/tax reductions for brown products
Industry IB1 Fees waived/subsidies for environmentally harmful activities
IB1, Industry, Fees waived/subsidies for environmentally harmful activities
Industry IB2 Brown infrastructure investments IB2, Industry, Brown infrastructure investments
Industry IB3 Deregulation of environmental standards IB3, Industry, Deregulation of environmental standards
Industry IB4 Environmentally related bailout without green strings IB4, Industry, Environmentally related bailout without green strings
Industry IB5 Subsidies/tax reductions for brown products IB5, Industry, Subsidies/tax reductions for brown products
Transport TB1 Fees waived/subsidies for environmentally harmful activities
TB1, Transport, Fees waived/subsidies for environmentally harmful activities
Transport TB2 Brown infrastructure investments TB2, Transport, Brown infrastructure investments
Transport TB3 Deregulation of environmental standards TB3, Transport, Deregulation of environmental standards
Transport TB4 Environmentally related bailout without green strings TB4, Transport, Environmentally related bailout without green strings
Transport TB5 Subsidies/tax reductions for brown products TB5, Transport, Subsidies/tax reductions for brown products
Waste WB1 Fees waived/subsidies for environmentally harmful activities
WB1, Waste, Fees waived/subsidies for environmentally harmful activities
Waste WB2 Brown infrastructure investments WB2, Waste, Brown infrastructure investments
Waste WB3 Deregulation of environmental standards WB3, Waste, Deregulation of environmental standards
Waste WB4 Environmentally related bailout without green strings WB4, Waste, Environmentally related bailout without green strings

Fund Nature, Fund the Future
70
Appendix 3: Example datasheet
The table below showsan extract of Portugal’s classified NRRP datasheet:
How can the measure be described in less than 20 words
What is the cost / value of the
policy, if one is given?
What is the cost in USD
Does the policy have a
monetary value
associated with it?
Does it affect agriculture, energy, industry, transport or waste, and what is the kind of
the effect? (choose the best match, it likely
won't be perfect)
Does the measure impact upon
Nature (e.g. land, biodiversity),
Climate (e.g. GHG emissions) or
both?
Does the measure have a negative or positive impact?
Name of policy or measure Value in local currency (in
millions) Value in USD yes=1, no=0 Intervention code nature=1,
climate=2, both=3 negative=1, positive=2
Subsidies to a selection of business areas to improve their infrastructure to meet new approaches to innovation, technologies
110 133 1 EG3, Energy, Green R&D subsidies 2 2
Subsidies to a selection of business areas to improve their infrastructure to meet new approaches to innovation, technologies ...
110 133 1 EG3, Energy, Green R&D subsidies 2 2
Cross-border connections. Investments to modernise the cross-border transport network 110 133 1 TB2, Transport, Brown
infrastructure investments 3 1
Increase the resilience of vulnerable territories in the face of risks associated with climate change by setting-up 20 territorial programs of restoration and landscape management, creating 90 programs of integrated landscape management and support 800 villages with the management of forest fire
270 328 1 AG4, Agriculture, Conservation and wildlife protection programmes
1 2
Expansion of the Lisbon Metro Network (+3.7km, 4 new stations) 304 369 1 TG2, Transport, Green
infrastructure investments 2 2
Promote bioeconomy through the incorporation of bio-based materials. The investment will support 30 R&D&I (innovation) projects, promote 40 intellectual property registration
150 182 1 IG3, Industry, Green R&D subsidies 3 2

Fund Nature, Fund the Future
71
requests and provide financial support to the improvement of 8,000 ha of maritime pine stands
Energy efficiency in central government buildings 250 303 1 EG2, Energy, Green infrastructure investments 2 2
Investments to cope with forest fire risk management 167 203 1
AG4, Agriculture, Conservation and wildlife protection programmes
1 2
R&D for the sustainability of agriculture, food and agribusiness, Innovation Agenda for Agriculture 20 | 30. Boost 100 research and innovation programs and projects and 5 structuring projects centred on the 15 emblematic initiatives advocated by this Agenda
93 113 1 AG1, Agriculture, Bailouts with green strings attached 3 2
Modernisation of the education offer, in school and professional training institutes. 710 862 1
Integrated operations in disadvantaged communities in the Metropolitan Areas of Lisbon and the Porto.
250 303 1

Fund Nature, Fund the Future
72
Appendix 4: I3M methodology
The overall goal of the modelling is to determine the impacts of a stimulus package employing nature-based solutions (the ‘NBS stimulus’), as compared to a business-as-usual scenario (the ‘reference stimulus’). The principal task is to define the inputs to the I3M modelling system, which uses an input-output modelling framework to estimate the short- and long-term impacts of investments and other interventions. To do this, the interventions (both NBS and reference) need to be characterised in terms of changes to the final demand for the output of specific sectors within the Eora26 classification scheme. This can be decomposed into defining the ‘per unit’ profiles of each intervention and multiplying the impacts by the total investment allocated to the intervention. This technical note explains the steps involved in both processes, as well as the ‘off-model’ calculations of carbon sequestration and resilience impacts.
Figure 89 Overall methodology
I3M is an input-output modelling framework based on the Eora multi-region input-output table (MRIO). The MRIO is a square matrix that represents the intermediate transactions between all sectors in all countries. In addition, the final demand of households, government purchases and other agents within each country for the output of all sectors is represented in the Final Demand block. Correspondingly, the primary inputs to sectoral production (labour, capital etc.) are represented in the Primary Inputs block. A simplified version of the table is represented in Figure 90.

Fund Nature, Fund the Future
73
Figure 90 Simplified representation of the Eora MRIO
Source: Vivid Economics
I3M works by modelling the impacts of investments and other interventions as shocks to final demand in specific sectors. The flowchart in Figure 91 shows how the MRIO is used to calculate the matrix of Leontief multipliers. Multiplying a shock vector (a change in final demand for every sector) by the Leontief matrix produces the increase in sectoral output needed to satisfy the increase in final demand. Relationships between sectoral output and variables such as GVA, employment and GHG emissions, determined from the satellite accounts of the Eora database, are used to calculate the impacts of the shock. The shock vector itself determines the ‘direct’ impacts, while the additional impacts on sectoral output are used to calculate the ‘indirect’ impacts.
Measures are modelled in the short term and the long term. The ‘short-term’ impacts of interventions are defined as those that result from capital expenditure (CAPEX) associated with the intervention. The ‘long-term’ impacts result from the operation phase of the intervention i.e. the operating expenditure (OPEX). In this case, the long-term impacts are calculated on an annual basis.

Fund Nature, Fund the Future
74
Figure 91 Representation of the I3M system
Source: Vivid Economics
The objective in sizing the reference stimulus is to provide a signpost for sizing the NBS stimulus. Since the objective is to produce comparable figures, only the fiscal (as opposed to monetary) component of stimulus is relevant. Within this fiscal component, it is necessary to isolate the component representing investment rather than other measures such as bailouts and direct income support.
The process for defining the shocks to I3M associated with the NBS stimulus is similar to the reference stimulus, except the components of the stimulus are now NBS interventions rather than sectors. In addition, the allocation of the NBS portfolio to interventions should depend in part on the economic benefits they are expected to achieve. Since the I3M system is fundamentally linear, the per USD benefits can be calculated before knowing the final allocation. This means that steps were taken in the following order:
1. Determine the CAPEX and OPEX spending profiles associated with each NBS intervention
2. Estimate the per USD impacts on GDP within each country
3. Determine the allocation of each country’s NBS portfolio to each intervention
4. Multiply the allocation by the per USD impacts for each intervention within each country
The per hectare spending profiles for NBS interventions were determined based on a range of data sources, including a previous Vivid project with The Nature Conservancy (TNC). These sources provide data from a range of countries, and extrapolations to other countries (depending on the intervention), are based on income level, region, or biome (temperate/tropical). A key step is assigning the spending on each project component to a sector in the Eora26 classification. An example for reforestation in France is shown in Table 3. These spending profiles are incorporated into I3M and divided by the total CAPEX to obtain the per USD impacts.

Fund Nature, Fund the Future
75
Table 3 Spending profiles for reforestation in France
Project component Expenditure type
Associated Eora sector £ 2019 per
hectare
Boundary Location CAPEX Construction 141
Initial land management plan
CAPEX Financial Intermediation and Business Activities 36
Site preparation - chop CAPEX Agriculture 633
Site preparation - herbicide
CAPEX Petroleum, Chemical and Non-Metallic Mineral Products
598
Hand planting - labour CAPEX Agriculture 316
Seedlings - 8 x 10 CAPEX Agriculture 190
Boundary maintenance
OPEX (annual) Agriculture 1
Update management plan
OPEX (annual) Financial Intermediation and Business Activities 7
Burning OPEX (annual) Agriculture 28
Source: Vivid Economics based on https://openknowledge.worldbank.org/bitstream/handle/10986/28588/AUS19554-WP-P159184-PUBLIC-Brazils-INDC-Restoration-and-Reforestation-Target.pdf?sequence=1&isAllowed=y; https://cordis.europa.eu/project/id/730497/reporting; Vivid Economics project with TNC

Fund Nature, Fund the Future
Contact us
Vivid Economics Limited 163 Eversholt Street London NW1 1BU United Kingdom
T: +44 (0)844 8000 254 [email protected]
Company profile
Vivid Economics is a leading strategic economics consultancy with global reach. We strive to create lasting value for our clients, both in government and the private sector, and for society at large.
We are a premier consultant in the policy-commerce interface and resource- and environment-intensive sectors, where we advise on the most critical and complex policy and commercial questions facing clients around the world. The success we bring to our clients reflects a strong partnership culture, solid foundation of skills and analytical assets, and close cooperation with a large network of contacts across key organisations.