fundamentals of commodities spot and forward / futures … · fundamentals of commodities spot and...
TRANSCRIPT
Fundamentals of Commodities Spot and Forward / Futures Markets
Hélyette GemanProfessor of Finance
Birkbeck University of London & ESCP- EAP
60
80
100
120
140
160
180
mai-91
oct-9
1mars
-92ao
ût-92
janv-9
3jui
n-93
nov-9
3av
r-94
sept-
94fév
r-95
juil-9
5dé
c-95
mai-96
oct-9
6mars
-97ao
ût-97
janv-9
8jui
n-98
nov-9
8av
r-99
sept-
99
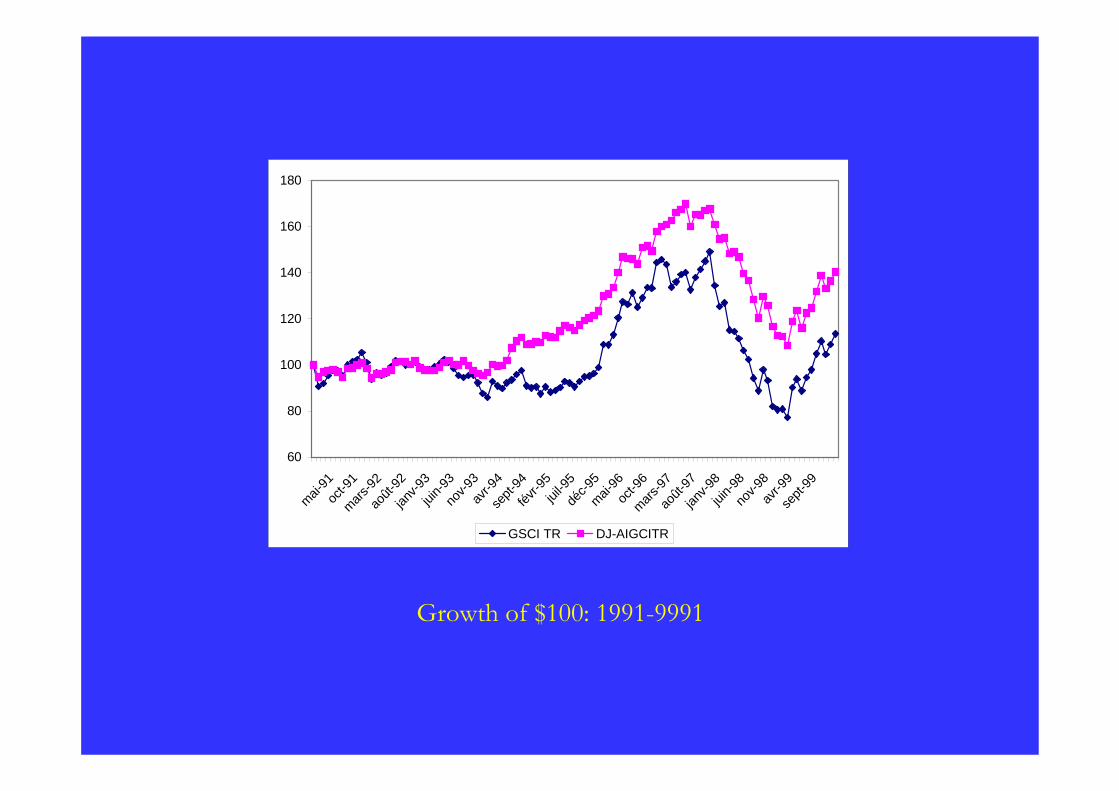
GSCI TR DJ-AIGCITR
Growth of $100: 1991-9991
90
110
130
150
170
190
mars-00
juin-0
0se
pt-00
déc-0
0mars
-01jui
n-01
sept-
01dé
c-01
mars-02
juin-0
2se
pt-02
déc-0
2mars
-03jui
n-03
sept-
03dé
c-03
mars-04
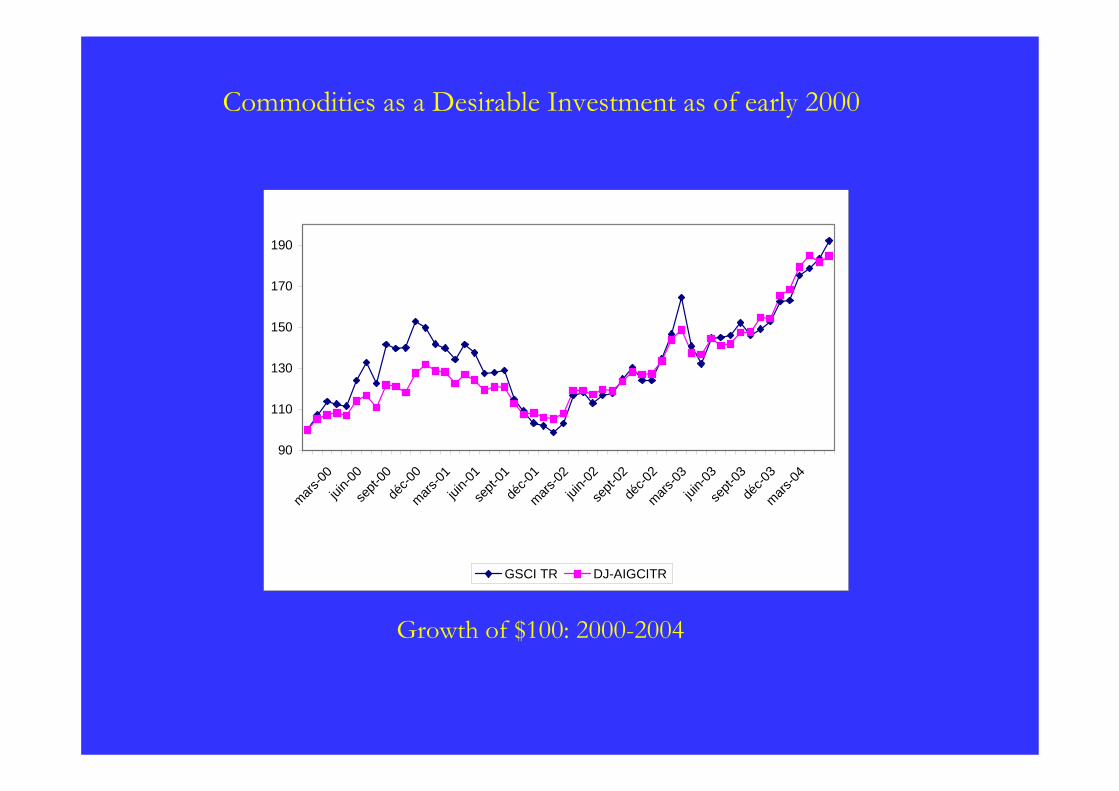
GSCI TR DJ-AIGCITR
Growth of $100: 2000-2004
Commodities as a Desirable Investment as of early 2000
50
100
150
200
250
300
350
400
450
1 3 5 7 9 11 13 15 17 19 21 23 25 27 29 31 33 35 37 39 41 43 45 47 49 51 53 55 57
DJ-AIG Energy Sub-index
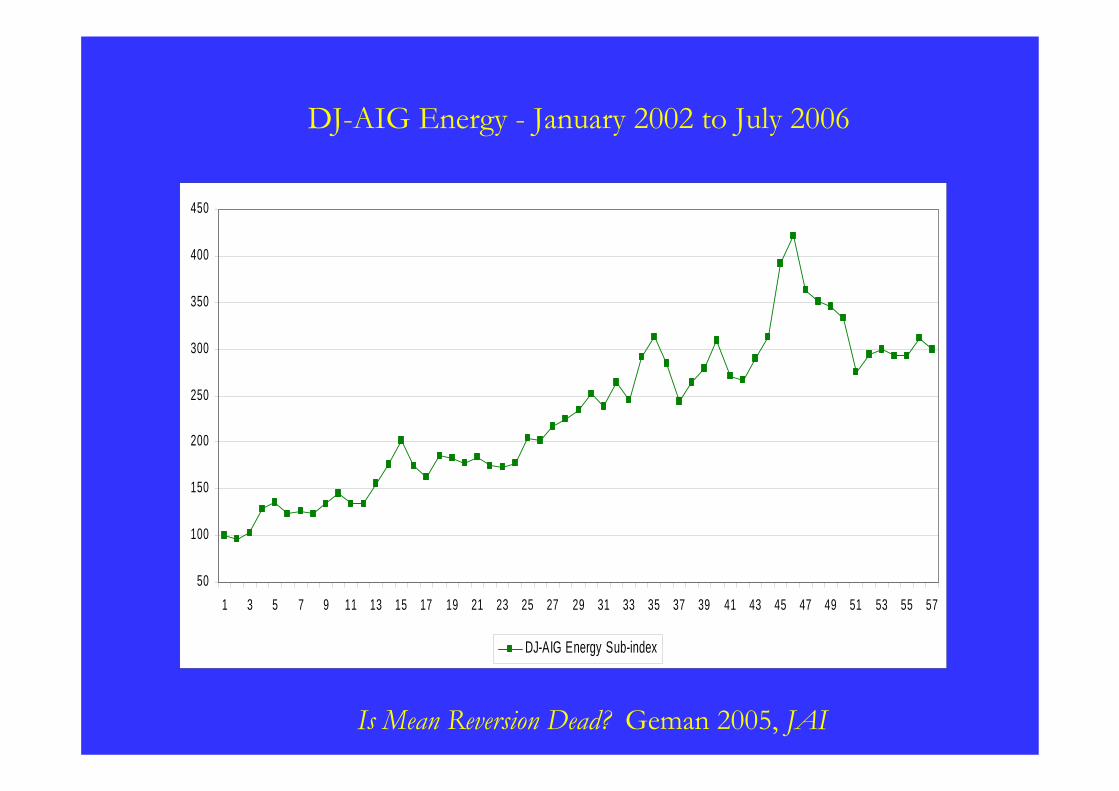
Is Mean Reversion Dead? Geman 2005, JAI
DJ-AIG Energy - January 2002 to July 2006
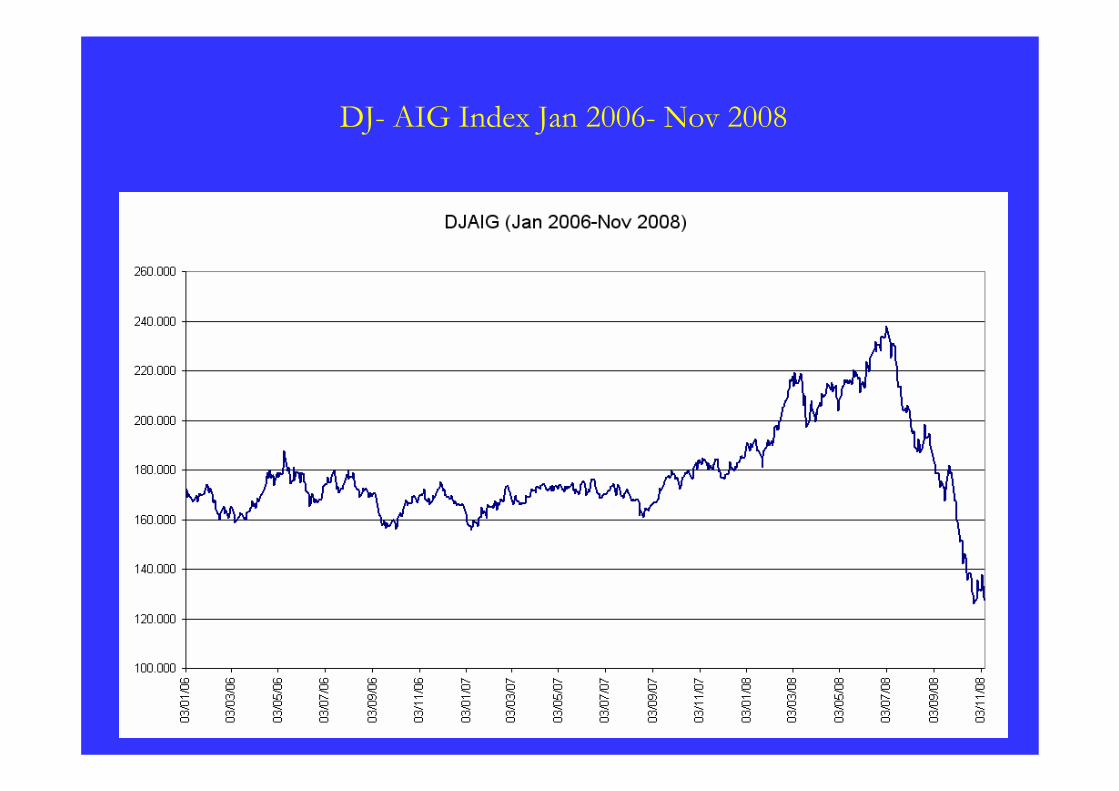
DJ- AIG Index Jan 2006- Nov 2008

CRB Index Jan 2006 – Nov 2008
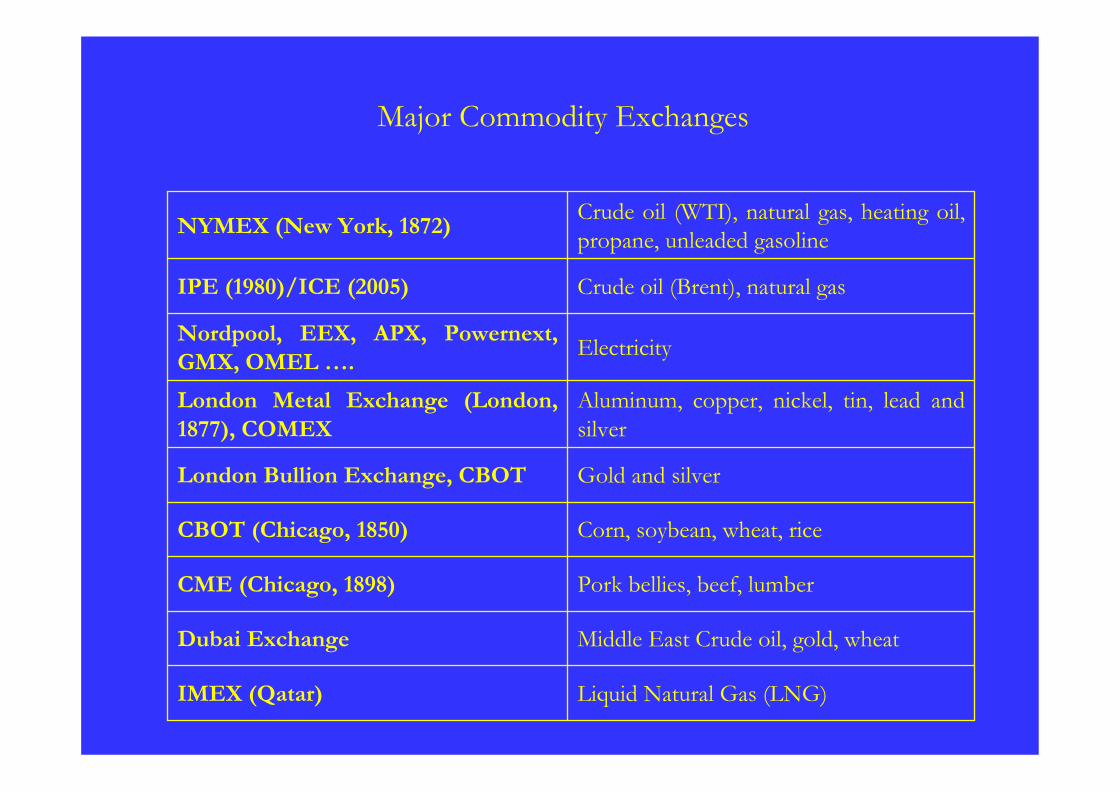
Major Commodity Exchanges
Liquid Natural Gas (LNG)IMEX (Qatar)
Middle East Crude oil, gold, wheatDubai Exchange
Pork bellies, beef, lumberCME (Chicago, 1898)
Corn, soybean, wheat, riceCBOT (Chicago, 1850)
Gold and silverLondon Bullion Exchange, CBOT
Aluminum, copper, nickel, tin, lead and silver
London Metal Exchange (London, 1877), COMEX
ElectricityNordpool, EEX, APX, Powernext, GMX, OMEL ….
Crude oil (Brent), natural gasIPE (1980)/ICE (2005)
Crude oil (WTI), natural gas, heating oil, propane, unleaded gasolineNYMEX (New York, 1872)
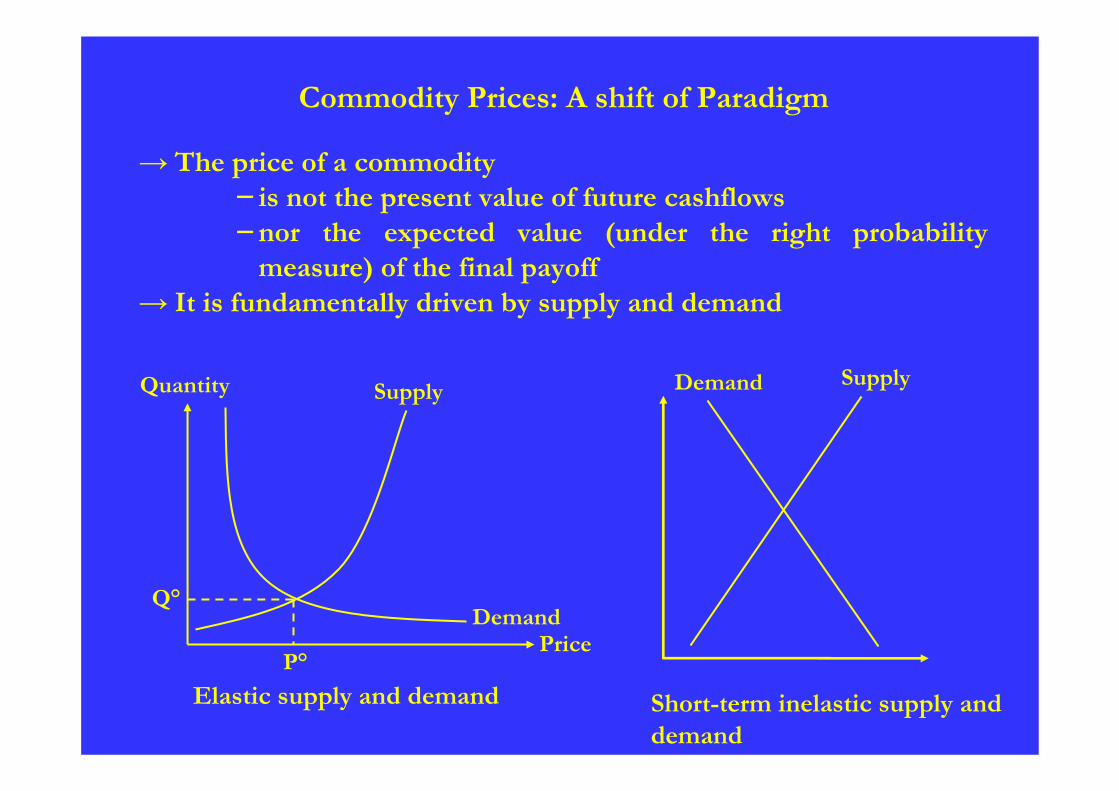
Commodity Prices: A shift of Paradigm
→ The price of a commodity− is not the present value of future cashflows−nor the expected value (under the right probability
measure) of the final payoff→ It is fundamentally driven by supply and demand
Short-term inelastic supply and demand
Elastic supply and demandP°
Quantity
Price
Supply
DemandQ°
Demand Supply
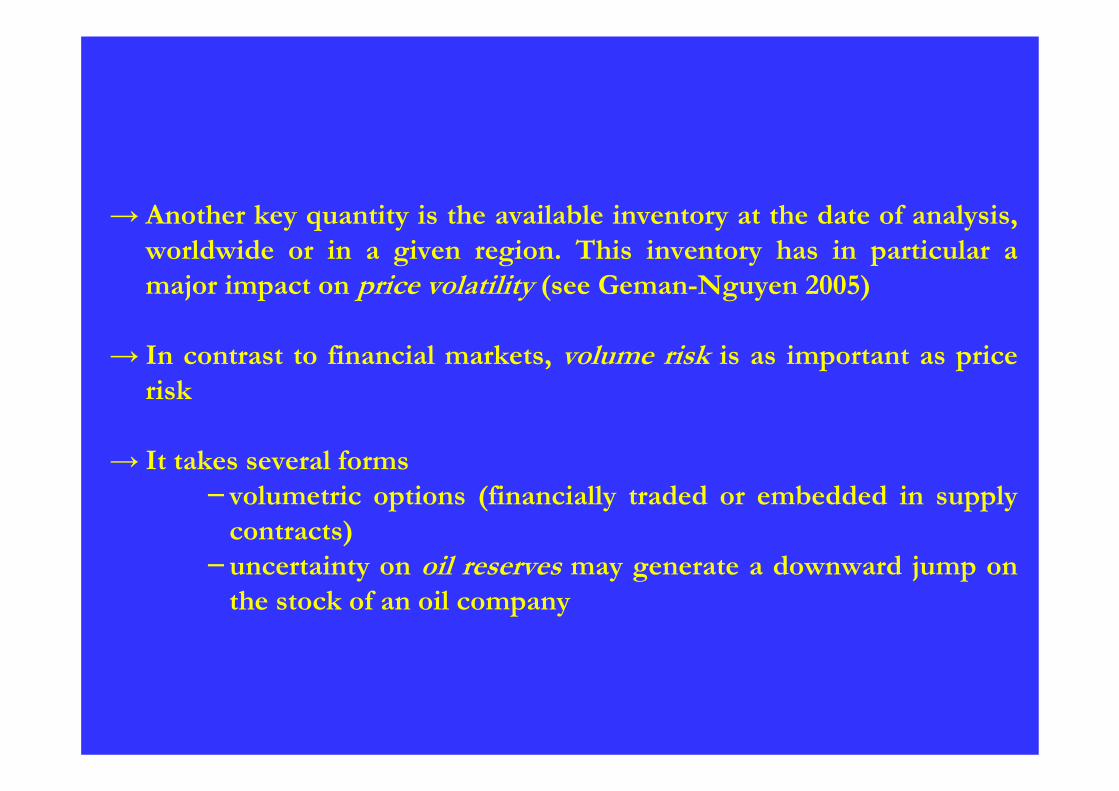
→ Another key quantity is the available inventory at the date of analysis, worldwide or in a given region. This inventory has in particular a major impact on price volatility (see Geman-Nguyen 2005)
→ In contrast to financial markets, volume risk is as important as price risk
→ It takes several forms−volumetric options (financially traded or embedded in supply
contracts)−uncertainty on oil reserves may generate a downward jump on
the stock of an oil company
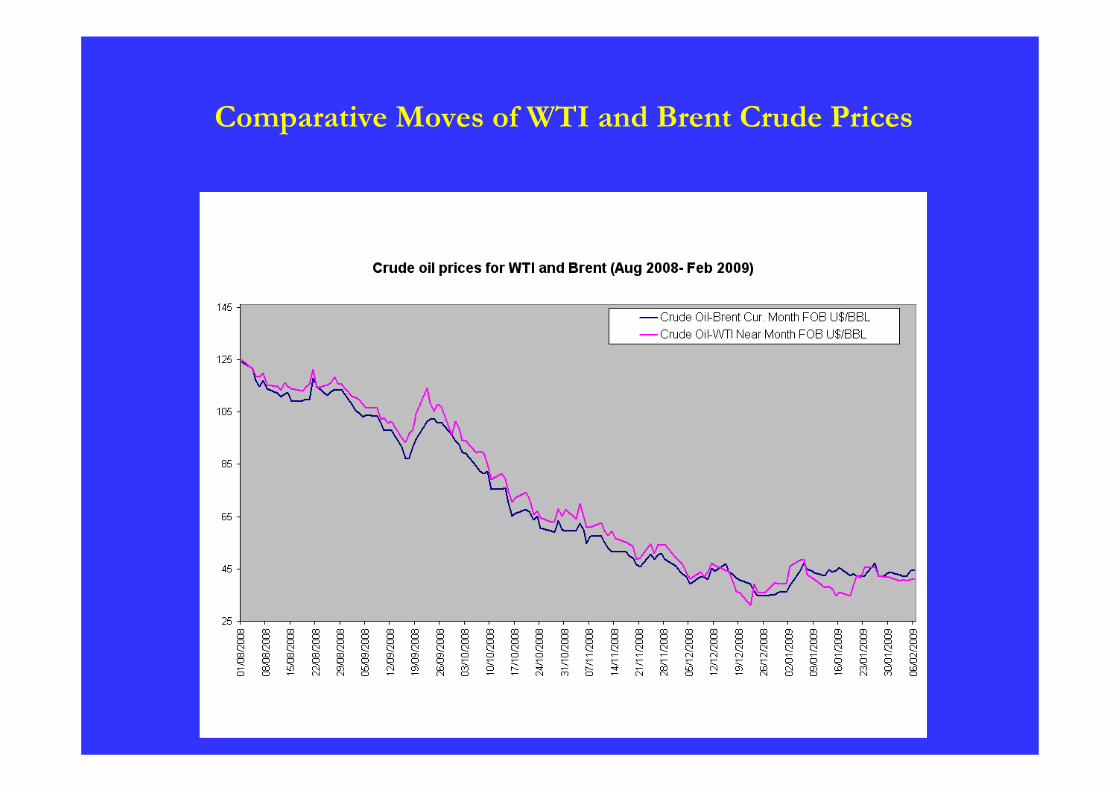
Comparative Moves of WTI and Brent Crude Prices
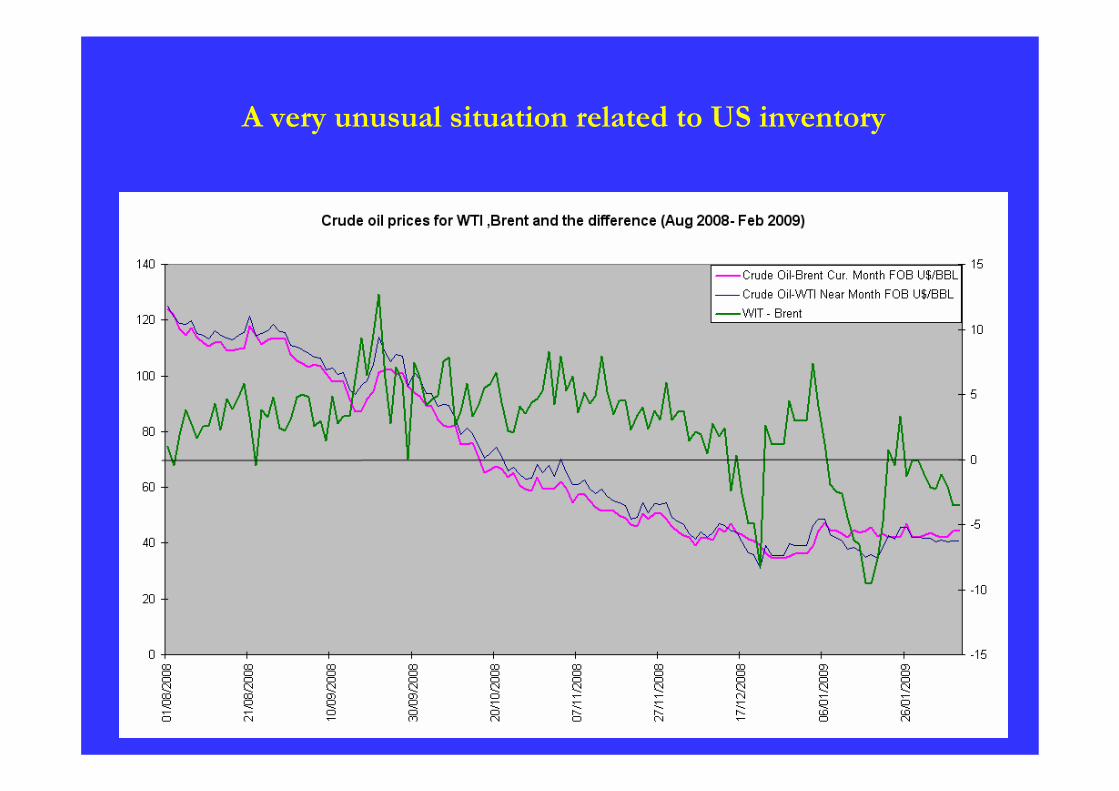
A very unusual situation related to US inventory
Commodities and Numéraire
→Most commodities are denominated in US dollars
→During the recent decline of the dollar, some OPEC members considered the possibility of using as a "numéraire" the arithmetic average of the dollar and the euro
→Maybe the right way of thinking is to use the commodity (e.g., abarrel of oil) as the numéraire when managing an energy derivatives portfolio!
→ Gold has partly been playing this rule for decades
Shipping and Freight
→ Two types of freightDry bulk: Capesize, Panamax, HandymaxTankers: Suez-Aframax
→Major actors in the spot and forward markets: Cargill, Louis Dreyfus, Total, Shell, Deutsche Bank, Morgan Stanley
→ Trading activityBaltic Exchange (London), used to offer Futures contracts, now only forwardsImarex (Oslo), provides daily quotes on maritime shippingLCH-Clearnet (London)Nymex (New York), very active for dry bulk
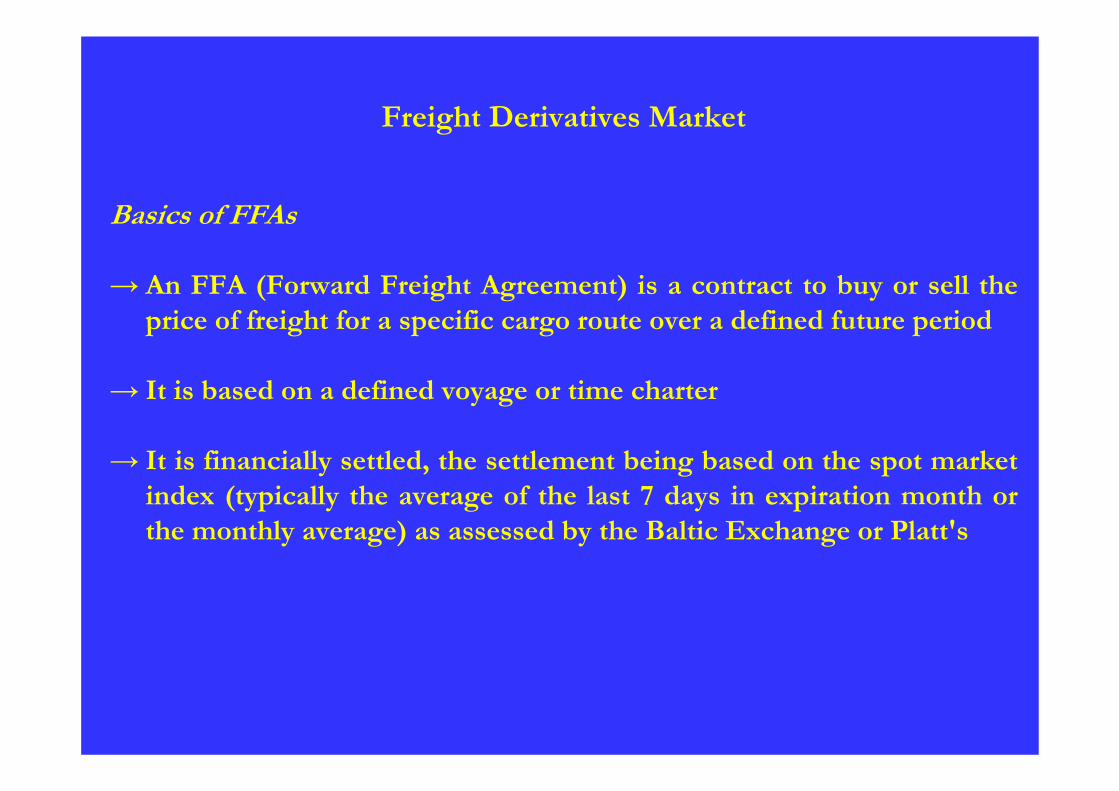
Freight Derivatives Market
Basics of FFAs
→ An FFA (Forward Freight Agreement) is a contract to buy or sell the price of freight for a specific cargo route over a defined future period
→ It is based on a defined voyage or time charter
→ It is financially settled, the settlement being based on the spot market index (typically the average of the last 7 days in expiration month or the monthly average) as assessed by the Baltic Exchange or Platt's
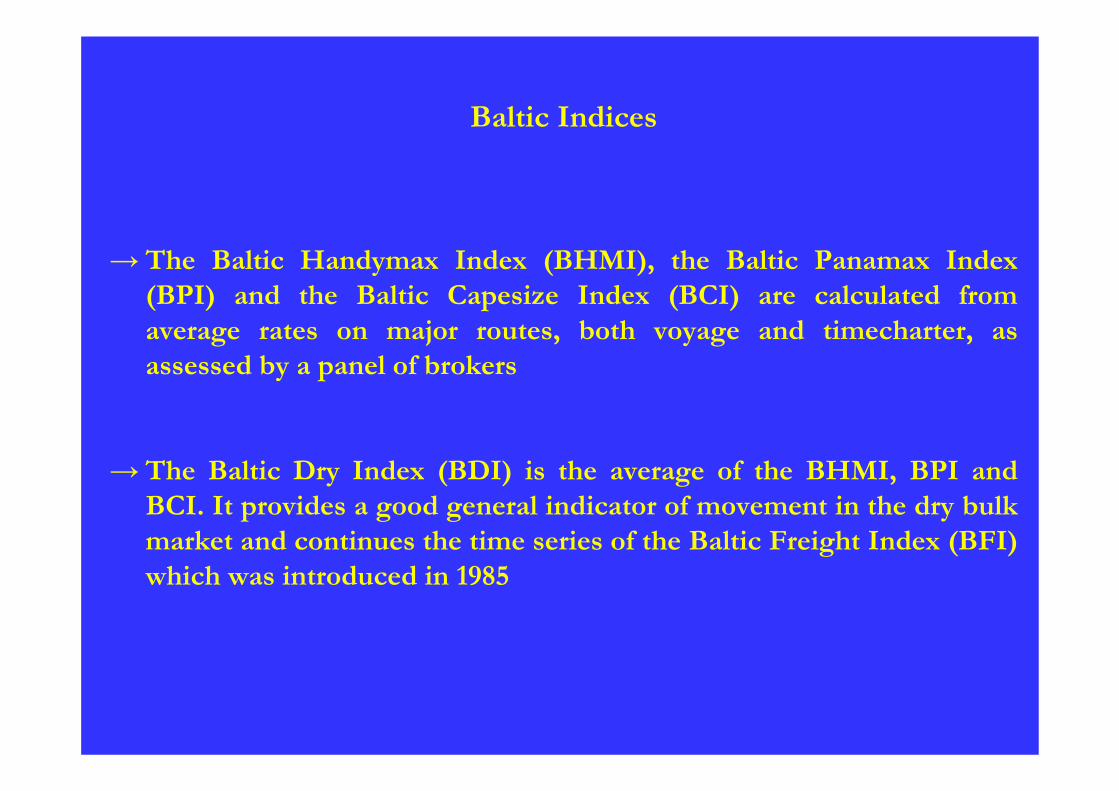
Baltic Indices
→ The Baltic Handymax Index (BHMI), the Baltic Panamax Index (BPI) and the Baltic Capesize Index (BCI) are calculated from average rates on major routes, both voyage and timecharter, as assessed by a panel of brokers
→ The Baltic Dry Index (BDI) is the average of the BHMI, BPI and BCI. It provides a good general indicator of movement in the dry bulk market and continues the time series of the Baltic Freight Index (BFI) which was introduced in 1985
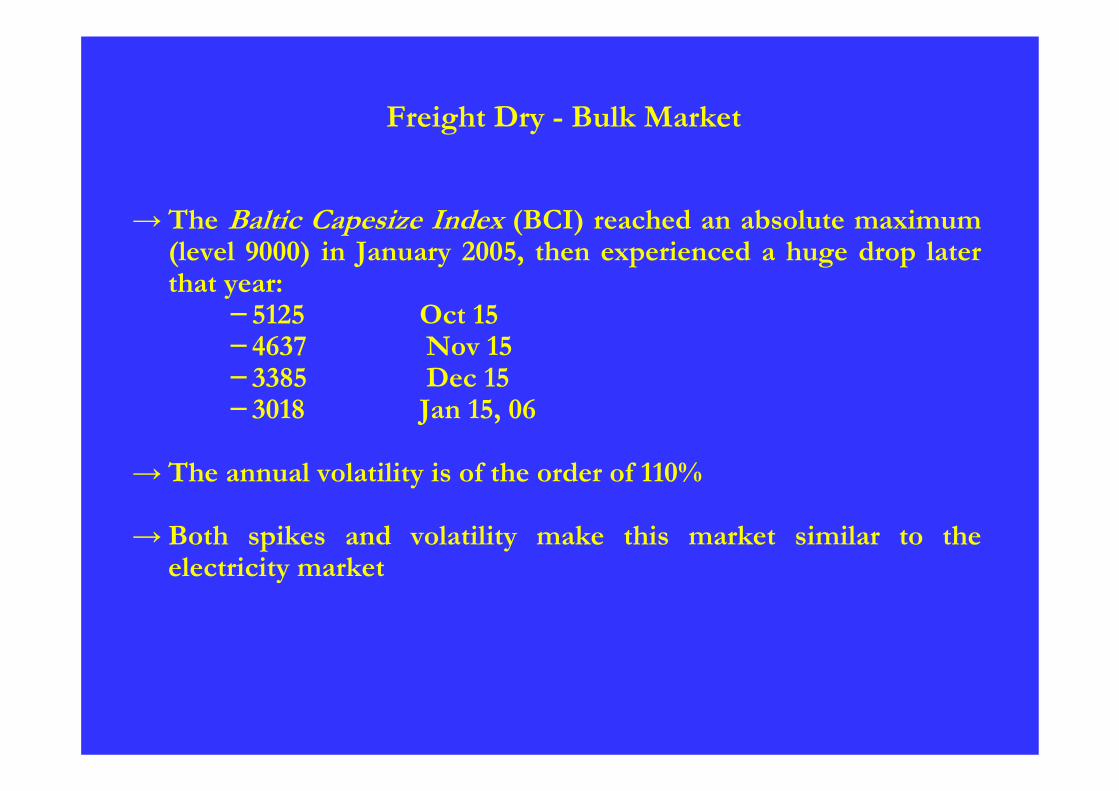
Freight Dry - Bulk Market
→ The Baltic Capesize Index (BCI) reached an absolute maximum (level 9000) in January 2005, then experienced a huge drop laterthat year:
−5125 Oct 15−4637 Nov 15−3385 Dec 15−3018 Jan 15, 06
→ The annual volatility is of the order of 110%
→ Both spikes and volatility make this market similar to the electricity market
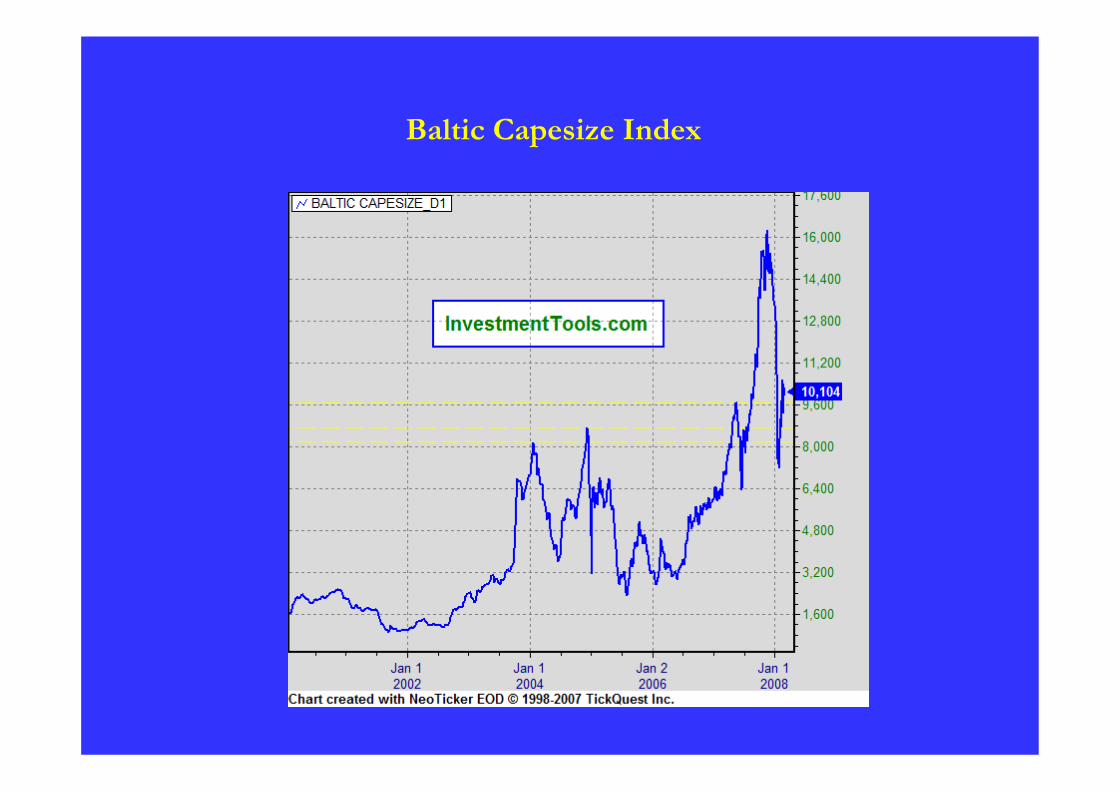
Baltic Capesize Index
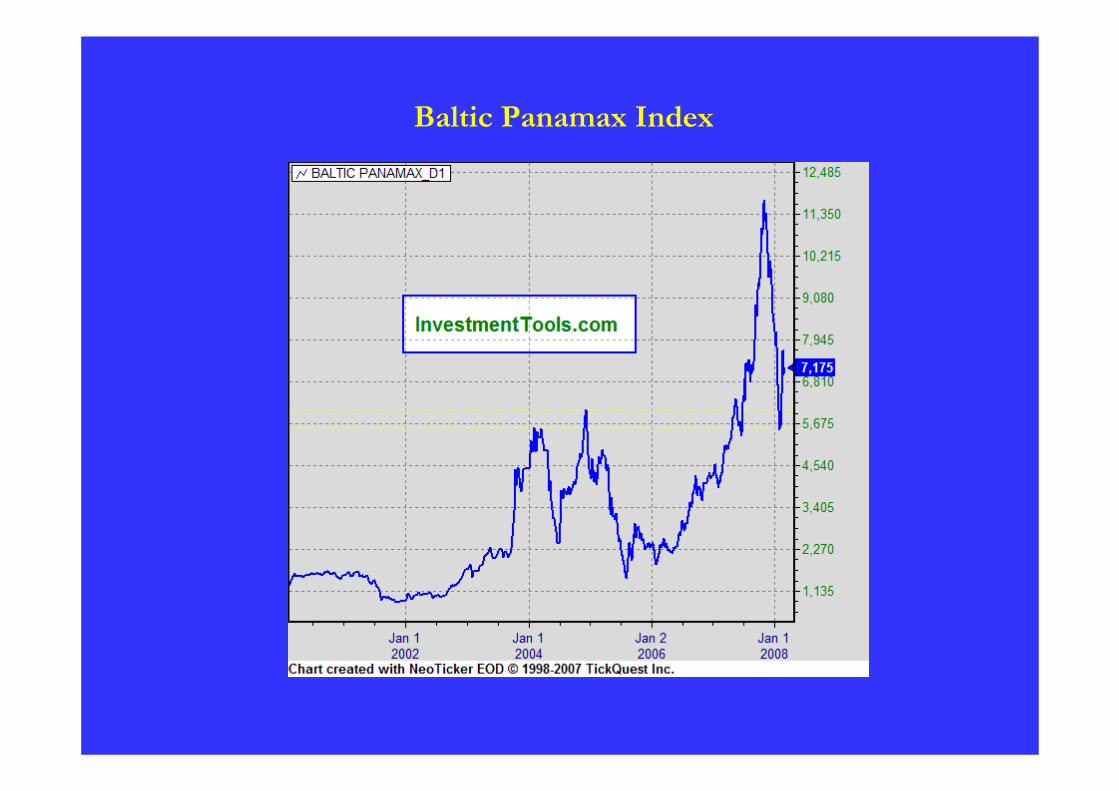
Baltic Panamax Index
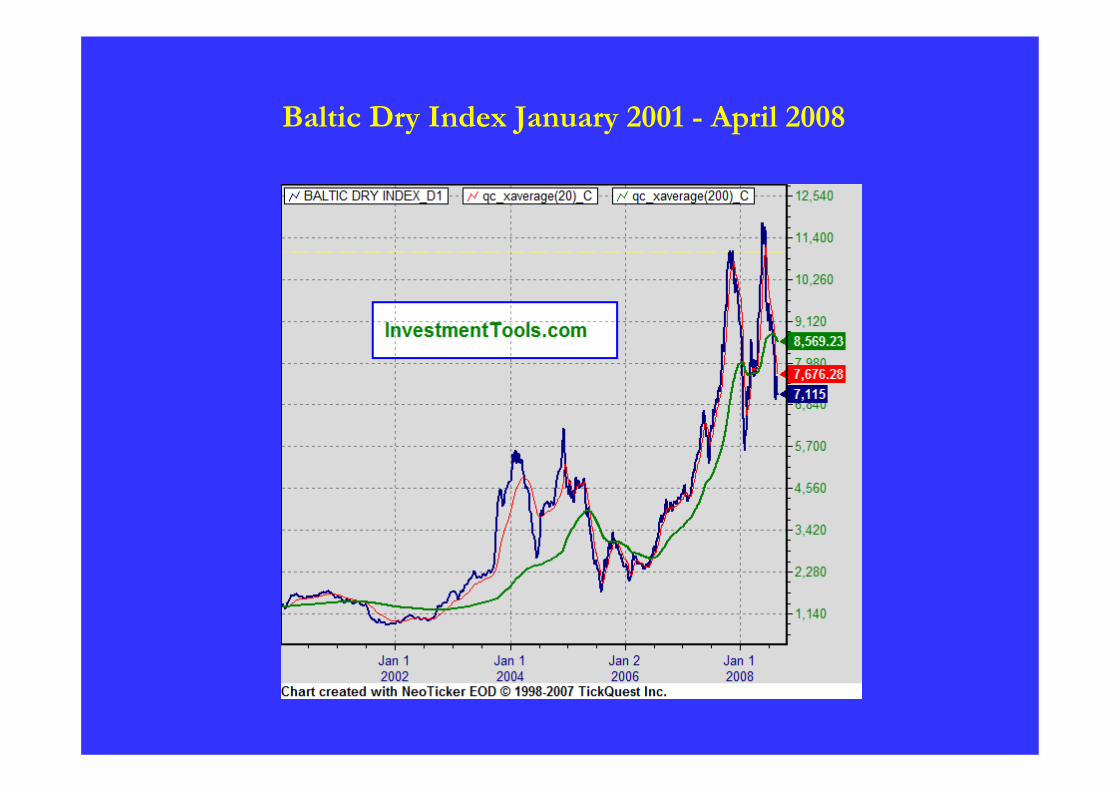
Baltic Dry Index January 2001 - April 2008

Theory of StorageKaldor (1939), Working (1949), Brennan (1958)
Three fundamentals results:
→ The convenience yield accounts for the benefit that accrues to the holder of the physical commodity but not to the holder of the futures contract. It is represented as an implicit dividend
→ The volatility of the commodity spot price is high when inventory is low
→ The volatility of Futures contracts decreases with the maturity:"Samuelson effect"
The Convenience Yield (continued)
→ It is the "comfort" provided by holding the spot commodity
→Owning the commodity allowsto reduce costs and delays in delivery (Kaldor)to satisfy an unexpected rise in demand (Brennan)to secure the continuity of production (Kaldor)
→ The convenience yield is all the higher as inventory is low
→ It is positively correlated to the spot price of the commodity
→ It accrues to the holder of the physical commodity but not to the holder of a derivative contract
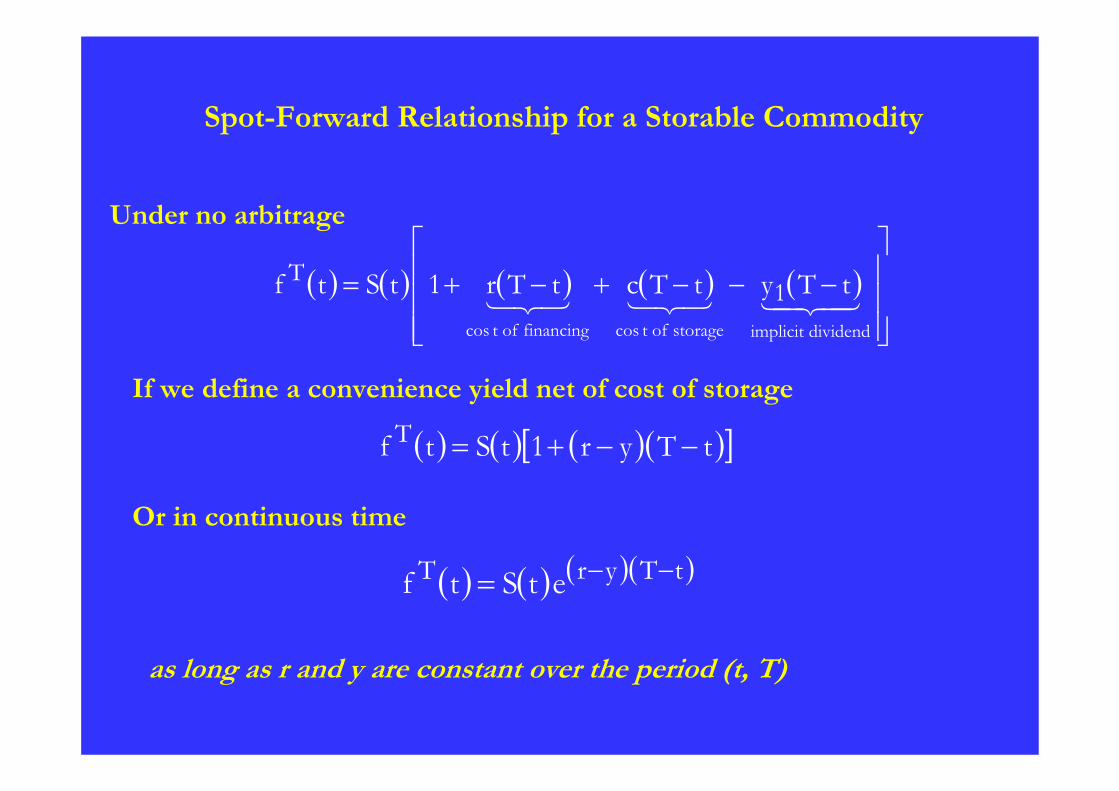
Spot-Forward Relationship for a Storable Commodity
Under no arbitrage
( ) ( ) ( ) ( ) ( )⎥⎥⎥
⎦
⎤
⎢⎢⎢
⎣
⎡−−−+−+=43421321321
dividendimplicitstorageoftcosfinancingoftcos
tTytTctTr1tStf 1T
If we define a convenience yield net of cost of storage
( ) ( ) ( )( )[ ]tTyr1tStf T −−+=
Or in continuous time
( ) ( ) ( )( )tTyrT etStf −−=
as long as r and y are constant over the period (t, T)
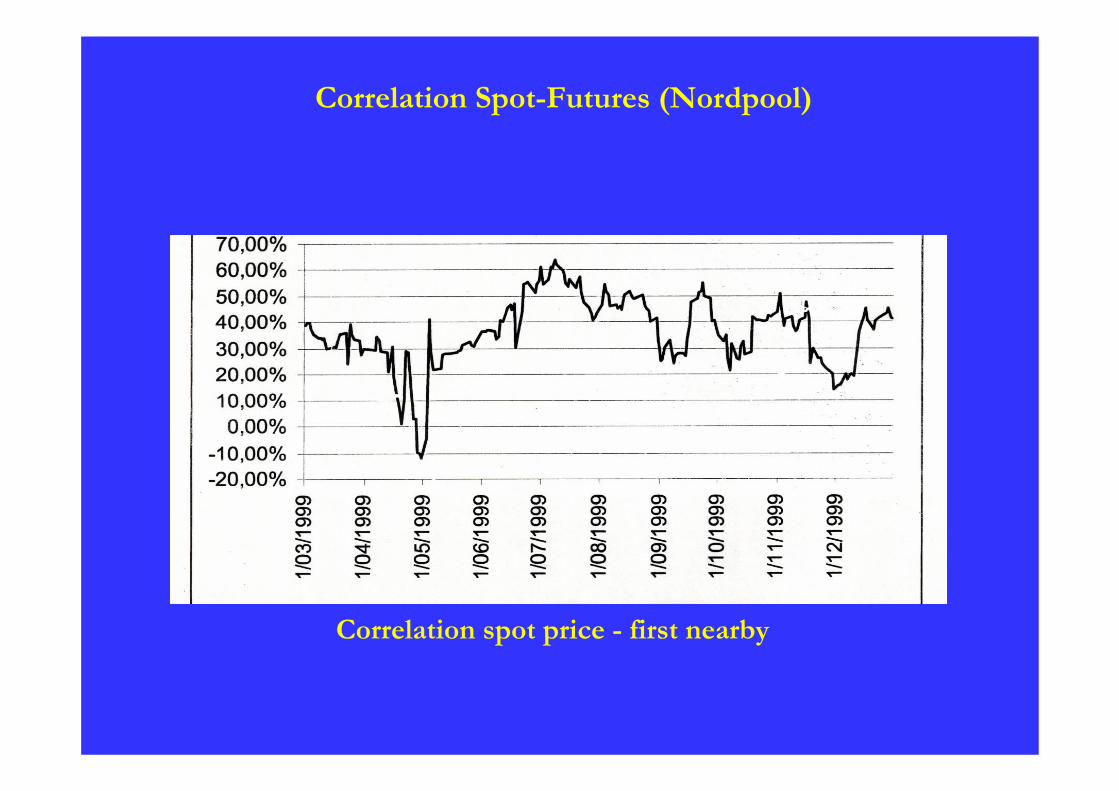
Correlation Spot-Futures (Nordpool)
Correlation spot price - first nearby
Crude Oil
Matthew Simmons, Twilight in the Desert→ "Sooner or later, the worldwide use of oil must peak because oil, like
the other two fossils - coal and natural gas - is non renewable"→Over the past 30 years, daily oil consumption has risen by
approximately 33 million barrels, Asia accounting for more than half of this growth in demand
→ Current consumption levels suggest that the world's oil supply should last until around 2045
→ The world's largest producers are Saudi Arabia (13% of world production), Russia (12%), the United States (7%), Iran (6%) andChina (5%)
→ The Gulf of Mexico region provides about 29% of the US oil production, hence the disruption created by the long shutdown ofmany oil rigs after hurricanes Katrina and Rita in summer 2005
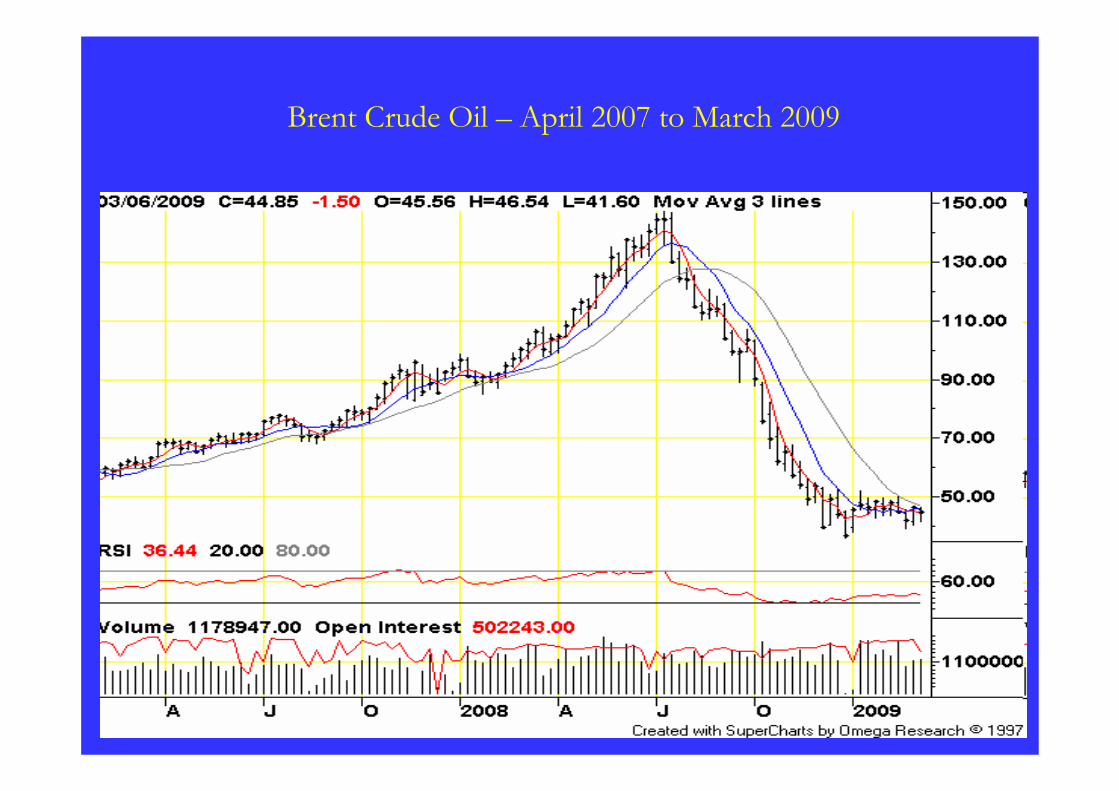
Brent Crude Oil – April 2007 to March 2009
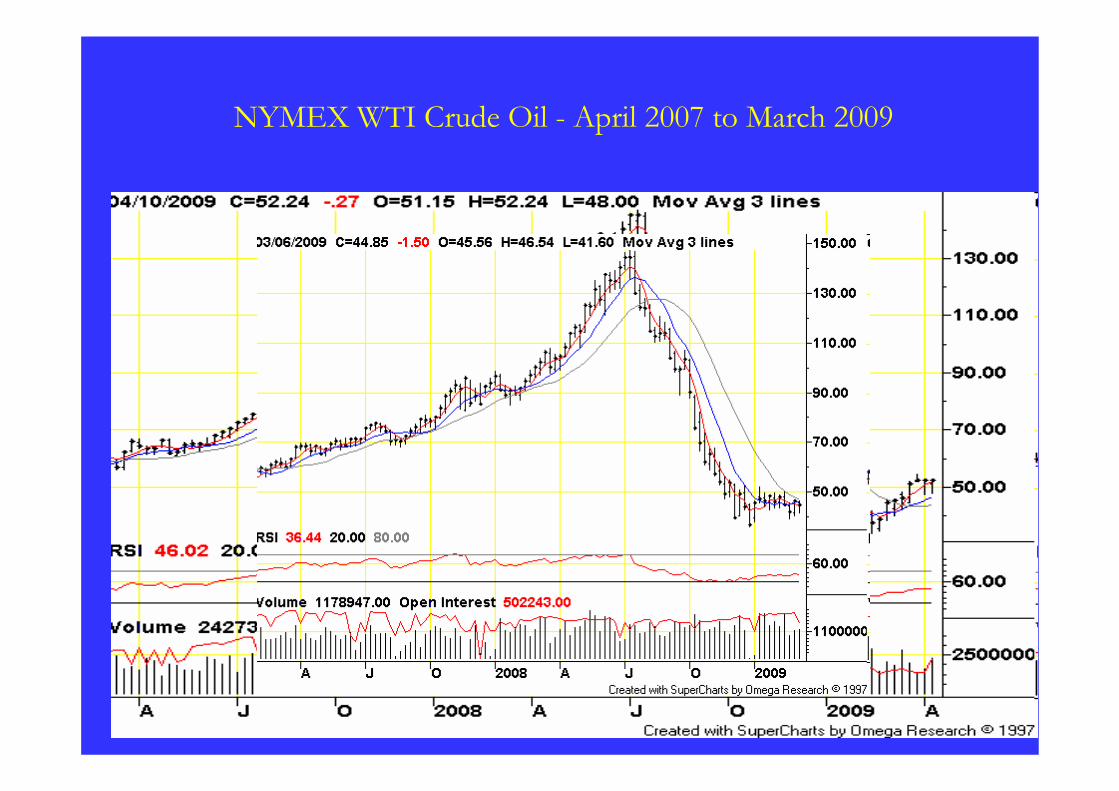
NYMEX WTI Crude Oil - April 2007 to March 2009
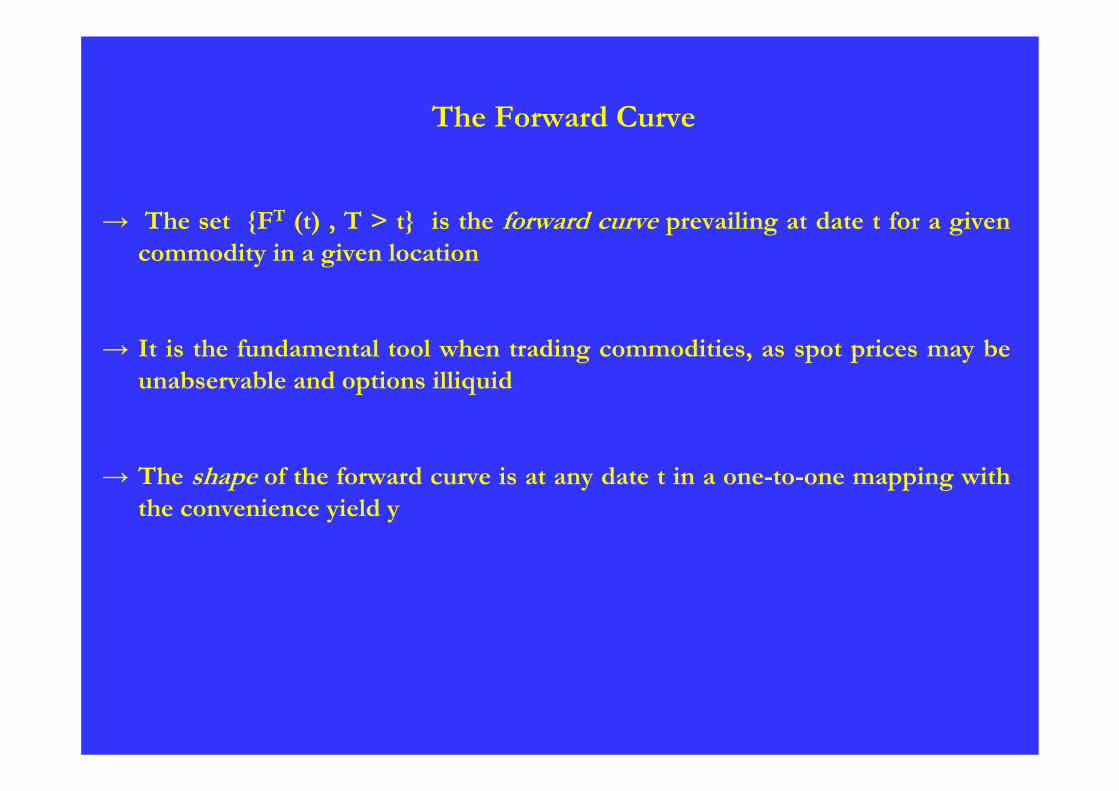
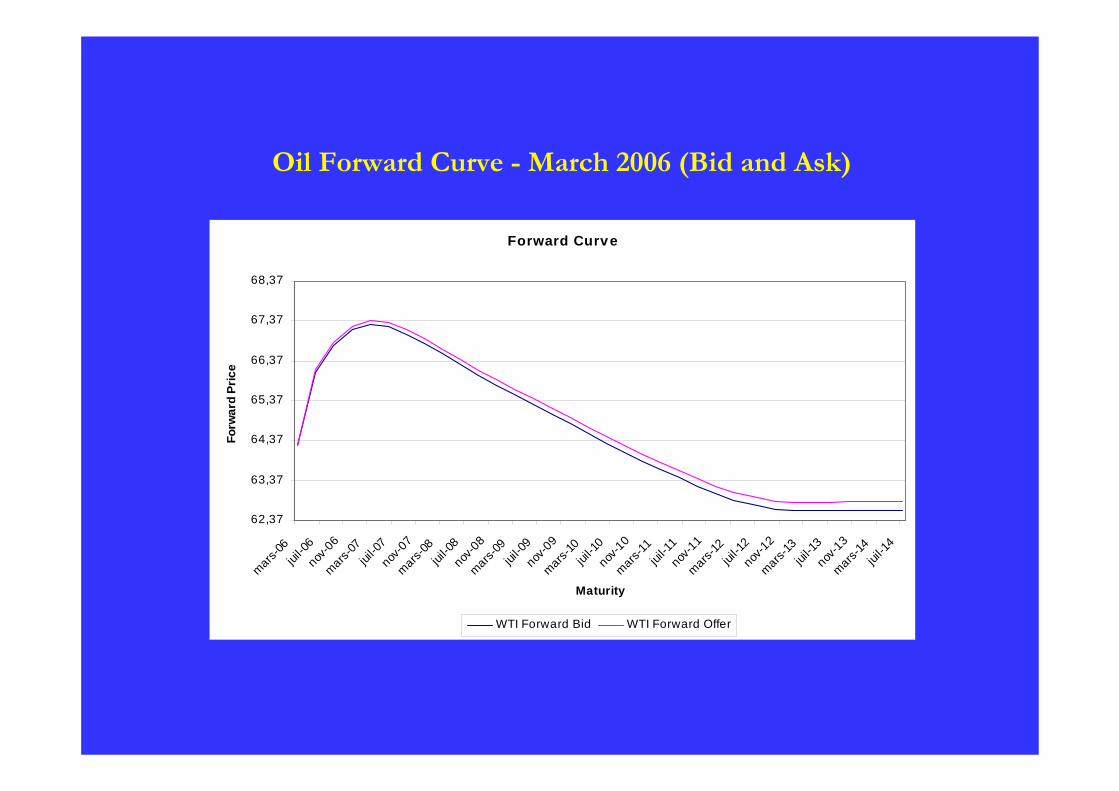
The Forward Curve
→ The set {FT (t) , T > t} is the forward curve prevailing at date t for a givencommodity in a given location
→ It is the fundamental tool when trading commodities, as spot prices may beunabservable and options illiquid
→ The shape of the forward curve is at any date t in a one-to-one mapping withthe convenience yield y
The oil market as a World Market
→ Seasonality is not significant since tankers are rerouted to satisfy a surge of demand in a given region
→ The representation of the spot price as a geometric Brownian motion is less questionable since it has indeed been increasing in average
→ It is in the context of this crucial commodity that Brennan and Schwartz (1985), Gibson and Schwartz (1990) remarkably introduced in the valuation of derivative contracts the economic concept ofconvenience yield
→ Gabillon (1991) shows the role of the convenience yield in explaining the role of oil forward curves
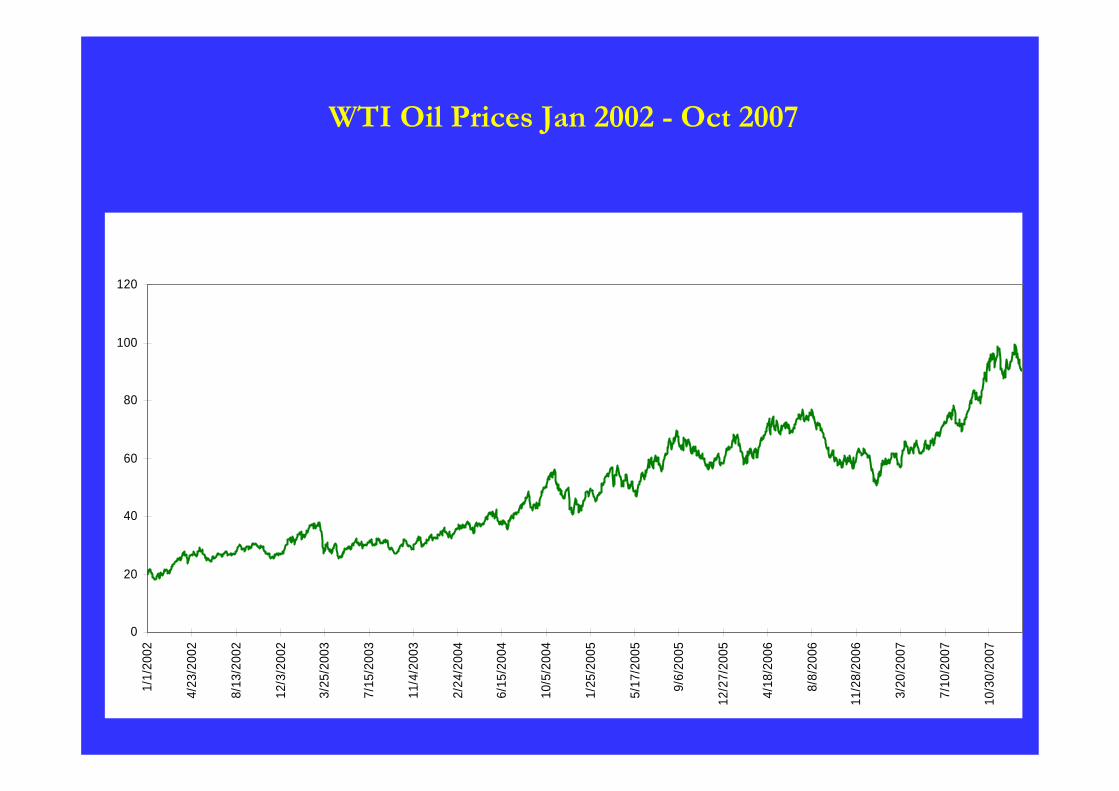
WTI Oil Prices Jan 2002 - Oct 2007
0
20
40
60
80
100
120
1/1/
2002
4/23
/200
2
8/13
/200
2
12/3
/200
2
3/25
/200
3
7/15
/200
3
11/4
/200
3
2/24
/200
4
6/15
/200
4
10/5
/200
4
1/25
/200
5
5/17
/200
5
9/6/
2005
12/2
7/20
05
4/18
/200
6
8/8/
2006
11/2
8/20
06
3/20
/200
7
7/10
/200
7
10/3
0/20
07
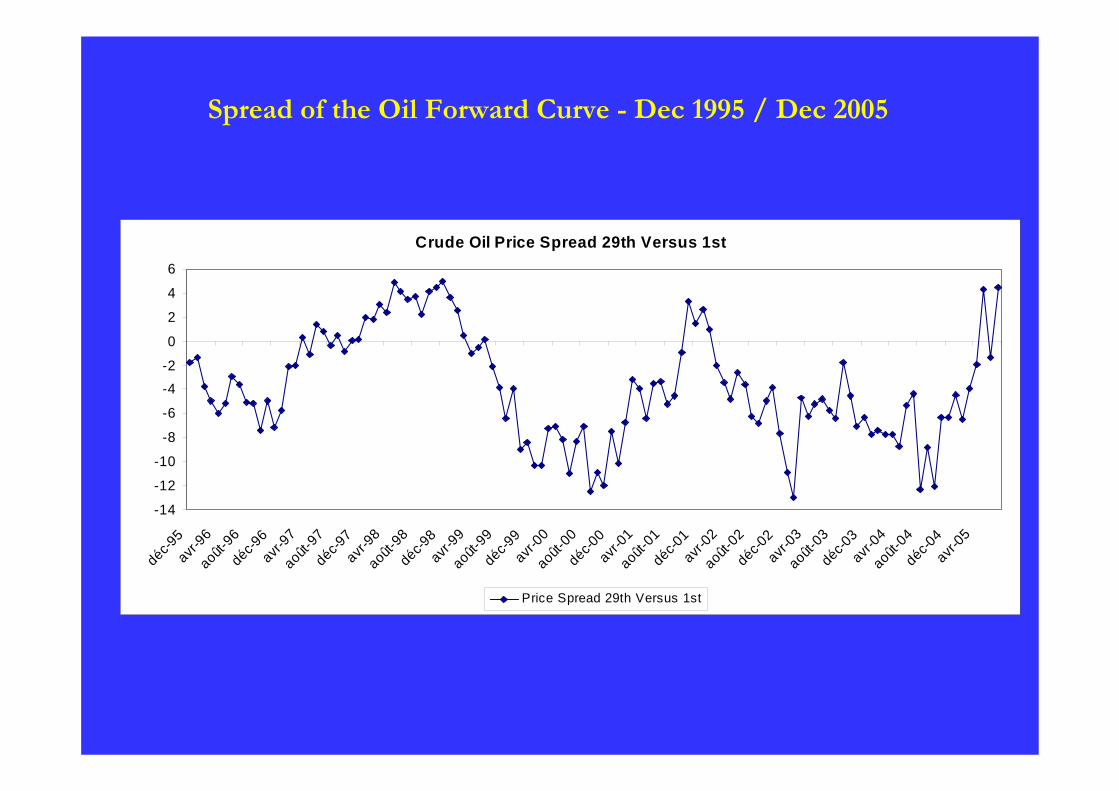
Crude Oil Price Spread 29th Versus 1st
-14
-12
-10
-8
-6
-4-2
0
2
4
6
déc-95
avr-96
août-96
déc-96
avr-97
août-97
déc-97
avr-98
août-98
déc-98
avr-99
août-99
déc-99
avr-00
août-00
déc-00
avr-01
août-01
déc-01
avr-02
août-02
déc-02
avr-03
août-03
déc-03
avr-04
août-04
déc-04
avr-05
Price Spread 29th Versus 1st
Spread of the Oil Forward Curve - Dec 1995 / Dec 2005
Forward Curve
62,37
63,37
64,37
65,37
66,37
67,37
68,37
mars-06
juil-0
6nov
-06
mars-07
juil-0
7nov
-07
mars-08
juil-0
8nov
-08
mars-09
juil-0
9nov
-09
mars-10
juil-1
0nov
-10
mars-11
juil-1
1nov
-11
mars-12
juil-1
2nov
-12
mars-13
juil-1
3nov
-13
mars-14
juil-1
4
Maturity
Forw
ard
Pric
e
WTI Forward Bid WTI Forward Offer
Oil Forward Curve - March 2006 (Bid and Ask)

Back to Backwardation in September 2007
68
70
72
74
76
78
80
M1 M5 M9 M13 M17 M21 M25 M29 M33 M37 M41 M45 M49 M53 M57 M61
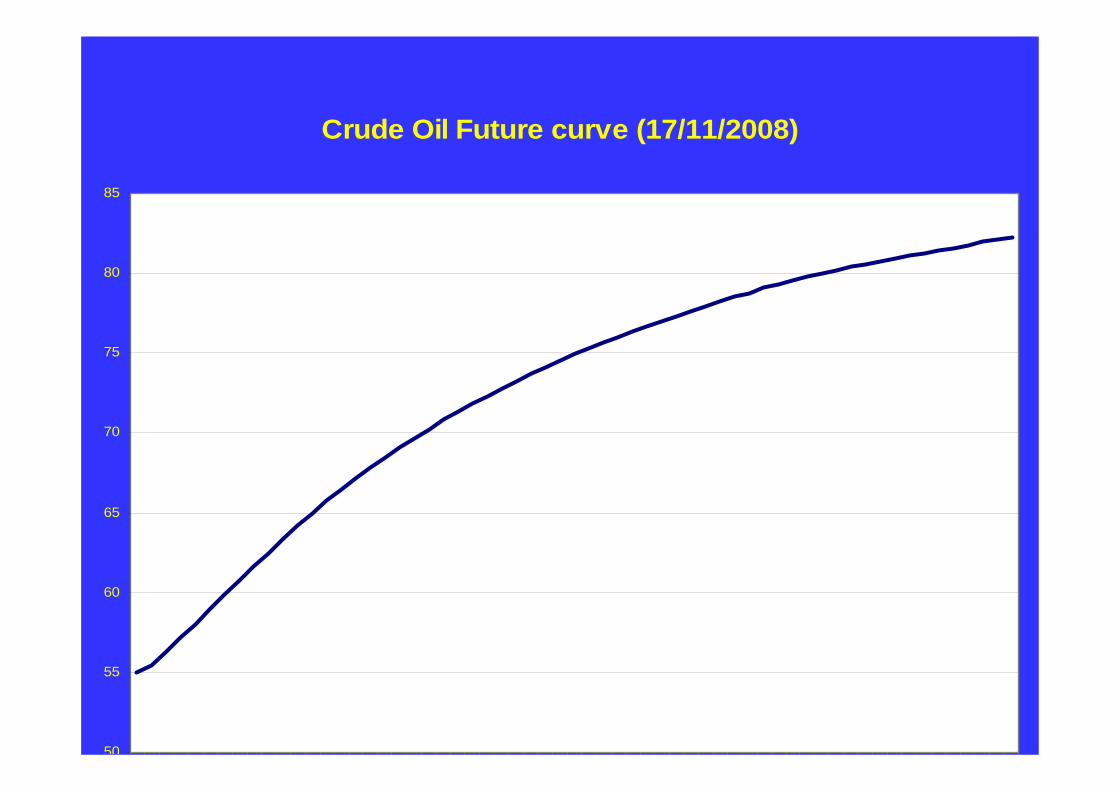
Crude Oil Future curve (17/11/2008)
50
55
60
65
70
75
80
85
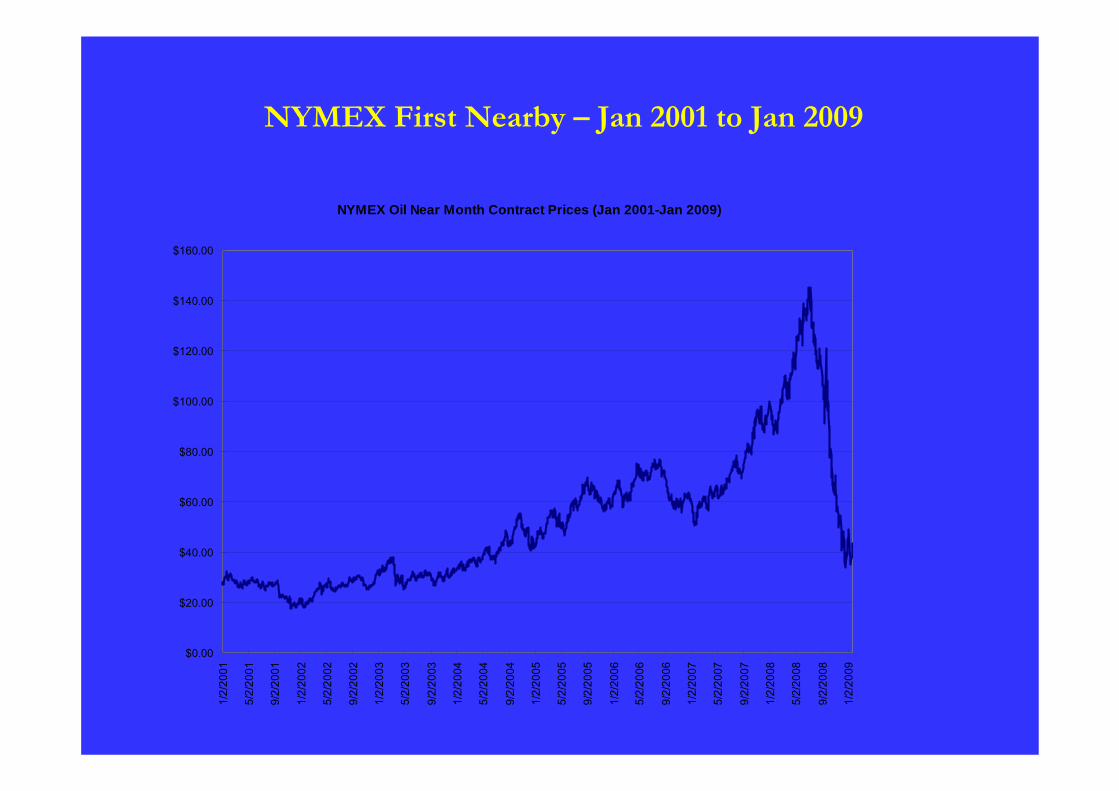
NYMEX First Nearby – Jan 2001 to Jan 2009
NYMEX Oil Near Month Contract Prices (Jan 2001-Jan 2009)
$0.00
$20.00
$40.00
$60.00
$80.00
$100.00
$120.00
$140.00
$160.00
1/2/2001
5/2/2001
9/2/2001
1/2/2002
5/2/2002
9/2/2002
1/2/2003
5/2/2003
9/2/2003
1/2/2004
5/2/2004
9/2/2004
1/2/2005
5/2/2005
9/2/2005
1/2/2006
5/2/2006
9/2/2006
1/2/2007
5/2/2007
9/2/2007
1/2/2008
5/2/2008
9/2/2008
1/2/2009
References
H. Geman and S. Kourouvakalis (2008) "A Lattice-Based Method for Pricing Electricity Derivatives under the
Geman-Roncoroni Model", Applied Mathematical FinanceS. Borovkova and H. Geman (2007) "Seasonal and Stochastic Effects in Commodity Forward Curves", Review of Derivatives ResearchH. Geman and A. Roncoroni (2006) "Understanding the Fine Structure of Electricity Prices", Journal of BusinessH. Geman (2005) "Energy Commodity Prices: Is Mean Reversion Dead", Journal of Alternative InvestmentsH. Geman and S. Ohana (2006) "Inventory, Reserves and Price volatility in Oil and Natural Gas
Markets“,Energy EconomicsH. Geman (2005) "Commodities and Commodity Prices: Pricing and Modelling for Agriculturals, Metals and
Energy", Wiley FinanceH. Geman and V. Nguyen (2005) "Soybean inventory and forward curves dynamics", 2005, Management ScienceH. Geman and M. Yor (1993) "An Exact Valuation for Asian Option", Mathematical FinanceA. Eydeland and H. Geman (1999) "Fundamentals of Electricity options" in Energy Price Modelling, Risk
Books
H. Geman and O. Vasicek (2001) "Forwards and Futures on Non Storable Commodities", RISKH. Geman (2002) "Pure Jump Lévy Processes for Asset Price Modelling", Journal of Banking and FinanceH. Geman (2003) "DCF versus Real Option for Pricing Energy Physical Assets" Conference of the
International Energy Agency - Paris - March 2003