fundamentals of grit removal and grit system evaluation_part 2_color very good
TRANSCRIPT

4/15/2013
1
This Webcast Is Brought To You By:
Smith & Loveless Inc.
The Fundamentals of Grit Removal and Grit System
Evaluation – Part 2
April 18th, 2012

4/15/2013
2
What: Grit Properties, Settling Principles & Characterization
Steven P. Gress, P.E.
October 15, 2011
Presentation Outline
1. Physical Properties of Grit
2. Traditional Assumptions vs. Recent Suggested Grit Understanding
3. Sand Equivalent Size (SES) Parameter
4. Settling Principles
5. Grit Characterization
Grit Book –Eutek Systems, Inc. 2007
4/15/2013
3
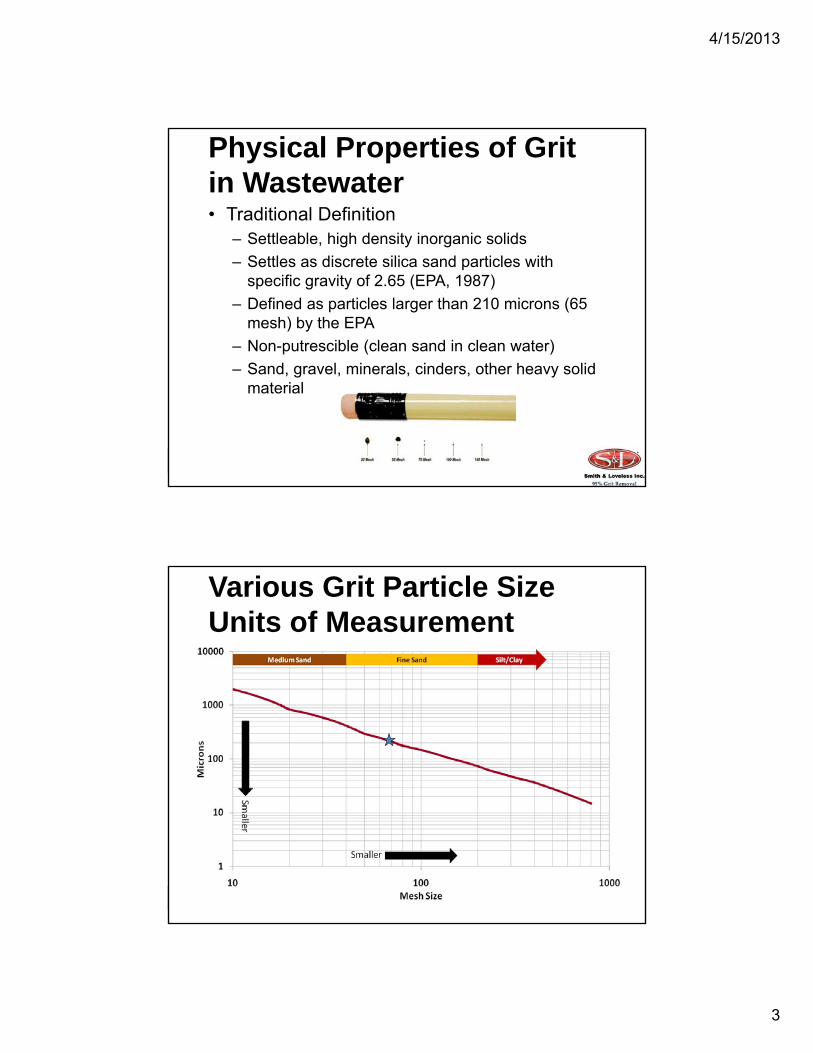
Physical Properties of Grit in Wastewater• Traditional Definition
– Settleable, high density inorganic solids
– Settles as discrete silica sand particles with specific gravity of 2.65 (EPA, 1987)
– Defined as particles larger than 210 microns (65 mesh) by the EPA
– Non-putrescible (clean sand in clean water)
– Sand, gravel, minerals, cinders, other heavy solid material
Various Grit Particle Size Units of Measurement

4/15/2013
4
Traditional Assumptions vs. More Recent Suggested Grit Understanding
Grit Happens - INWEA 2010
Traditional Assumptions More Recent Understanding
All silica sand Variety of material types
2.65 specific gravity Range of specific gravity
Particles larger than 210 microns (μm) (65 mesh)
Particles range in size from 50 to 1000 μm
Perfect spheres Variety of shapes
Clean sand in clean water Fats, oils, greases, soap & scum in collection system
Quiescent basin for discrete particle settling
Basins not quiescent
Specific Gravity Values of Various Grit Materials
Grit Happens - INWEA 2010
Specific Gravity of Various Materials
Quartz Sand 1.2 Earth 1.4
Limestone 1.55 Granite 1.65
Clay 1.8 Red Brick 1.9
Sand, wet 1.92 Gravel 2.0
Asphalt 2.2 Concrete 2.4

4/15/2013
5
Distribution of Grit at WWTPs
Fine Grit Removal Challenges in WWTPs - WEFTEC 2004
Suggested Sand Equivalent Size (SES) Parameter
• Wastewater becomes coated with lower-density FOG– Reduces specific gravity
– Reduces particle settling velocity
• SES Definition– Clean sand particle size with the
same settling velocity as the more buoyant grit particle
– Determined by using a wet sieve analysis
Grit Book –Eutek Systems, Inc. 2007

4/15/2013
6
Grit Size vs. SES Size Comparison
Grit Book - Eutek Systems, Inc. 2007
Other Recent Grit Opinions
• No peer reviewed, industry accepted procedure or Standard Method for SES
• Some argue that the FOG coating is thin and effective SG is affected very little (Rippon, Higgins, and Mrkvicka, 2010)
• Others argue that blackened grit particles contain a thin iron oxide or iron sulfide coating that does not radically alter SG

4/15/2013
7
Settling Principles• Discrete particle settling theory
– Newton’s Lawvp(t) = [(4g/3Cd)((ρp – ρw)/ρw)dp]0.5 or
vp(t) ≈ [(4g/3Cd)(sgp – 1)dp]0.5
Where:
• vp(t) = terminal velocity of particle (m/s)
• g = gravity acceleration (9.81 m/s2)
• ρp = density of particle (kg/m3)
• ρw = density of water (kg/m3)
• Cd = drag coefficient (unitless)
• sgp = specific gravity of particle
• dp = diameter of particle (m)
Wastewater Engr. - Trt. & Reuse, 4th Edition
Particle Settling Theory Cont.• Coefficient of Drag Cd takes on different
values depending if flow is laminar or turbulent:– Laminar (NR < 1)
– Transitional (NR = 1 to 2000)
– Turbulent (NR > 2000)
Cd = 24/NR + 3/(NR)0.5 + 0.34
– Reynolds number is defined as:
NR = vpdpρw/μ = vpdp/(kv)
Where: μ = dynamic viscosity (N*s/m2)
kv = kinematic viscosity (m2/s)
Wastewater Engr. - Trt. & Reuse, 4th Edition

4/15/2013
8
Cd As a Function of NR
Wastewater Engr. - Trt. & Reuse, 4th Edition
Particle Settling Theory Cont.
• Newton’s law with proposed modification for non spherical particles:
vp(t) = [(4g/3CdΦ)((ρp – ρw )/ρw)dp]0.5
or
vp(t) ≈ [(4g/3CdΦ)(sgp – 1)dp]0.5
Where:
Φ = shape factor (unitless)
and
• Φ = 1.0 for spheres
• Φ = 2.0 for sand grains
Wastewater Engr. - Trt. & Reuse, 4th Edition

4/15/2013
9
Particle Settling Theory Cont.
• Settling in Laminar Region (NR < 1)– For NR < 1, viscosity is the predominant force
governing the settling process and the first term in the Cd equation predominates
– Assuming spherical particles, substitution of the first term in the Cd equation into Newton’s law yields Stokes’ law where:vp = g(ρp – ρw)/dp
2/18μ ≈ g(sgp – 1)/dp2/18kv
Wastewater Engr. - Trt. & Reuse, 4th Edition
Particle Settling Theory Cont.
• Settling in Transition Region (NR = 1 to 2000)
– The complete form of the Cd equation must be used to determine settling velocity
– Because of the nature of the Cd equation, finding the settling velocity is an interactive process
– Utilize NR definition with shape factor to check NR for an assumed Cd value
NR = Φvpdpρw/μ = Φvpdp/(kv)
Wastewater Engr. - Trt. & Reuse, 4th Edition

4/15/2013
10
Settling Velocities in Laminar & Transition Regions at 20°C
Wastewater Engr. - Trt. & Reuse, 4th Edition
Particle Settling Theory Cont.• Settling in Turbulent Region (NR > 2000)
– Inertial forces are predominant and the effect of the first two terms in the Cd
equation is reduced
– Use Cd =0.4
– Resulting settling velocity equation:
vp = [3.33g((ρp – ρw)/ρw)dp]0.5
or
vp = [3.33g(sgp – 1)dp]0.5
Wastewater Engr. - Trt. & Reuse, 4th Edition

4/15/2013
11
Discrete Particle Settling• Usual design procedure is to select a
particle with a terminal velocity vc
– All particles that have a terminal velocity greater than vc will be removed
– For continuous-flow sedimentation• vc = basin depth/detention time
• In actual practice, design factors must be adjusted to allow for effects of inlet and outlet turbulence, short circuiting, solids storage, and velocity gradients due to operation of solids-removal equipment
Wastewater Engr. - Trt. & Reuse, 4th Edition
Definition Sketch for Ideal Discrete Particle Settling
Wastewater Engr. - Trt. & Reuse, 4th Edition

4/15/2013
12
Discrete Particle Settling Cont.• Rate at which clarified water is produced:
Q= Avc or vc = Q/A
Where:– Q = flow rate (m3/s or ft3/s)
– A = surface area of basin (m2 or ft2)
– vc = terminal particle settling velocity (m/s or ft/s)
• Particles with a settling velocity < vc will be removed in the ratio:Xr = vp/vc, where Xr = fraction of particles with settling
velocity vp that are removed
Wastewater Engr. - Trt. & Reuse, 4th Edition
Discrete Particle Settling Cont.
• The total fraction of particles removed: Fraction removed = [∑n
i=1 (vni /vc)(ni)]/∑ni=1 ni
Where:
– vni = average velocity of particles in ith velocity range
– ni = number of particles in the ith velocity range
– When vni /vc is greater than 1.0, use a value of 1.0 because all particles in ith velocity range are removed
Wastewater Engr. - Trt. & Reuse, 4th Edition

4/15/2013
13
Gravity Separation In An Accelerated Flow Field
• Because the top of the separator is enclosed, the rotating flow creates a free vortex within the separator
• The most important characteristic is:
Vr = CWhere:
– V = tangential velocity (m/s or ft/s)
– r = radius (m or ft)
– C = moment constant
Wastewater Engr. - Trt. & Reuse, 4th Edition
Gravity Separation In An Accelerated Flow Field Cont.• As the radius is reduced, the tangential
velocity inversely increases
• Centrifugal force on a particle in this flow field is equal to the square of the velocity divided by the radius– A fivefold decrease in the radius results in a 125-
fold increase in centrifugal force
– Centrifugal acceleration is often expressed in terms of number of “gravities” = G = V2/gr
• g = 32.2 ft/s2
Wastewater Engr. - Trt. & Reuse, 4th Edition

4/15/2013
14
Induced Vortex
Grit Happens - INWEA 2010
Wall velocity is greater than at the centerIncreasing performance as flows decrease (lower SLR)Headloss typically 6-12” for hydraulic induced vortex
Gravity Separation In An Accelerated Flow Field Cont.• Induced vortex type separator typically is a large
diameter cylinder with a conical bottom– Typically has a higher headloss than mechanical vortex type
systems
• Because of high centrifugal forces near the discharge port, grit particles are retained while organic particles are discharged
• Large organic particles typically have a higher drag forces than smaller grit particles and tend to move with the fluid and are transported out of the separator– Organic particles that may settle usually consist of oil and
grease attached to grit particles
Wastewater Engr. - Trt. & Reuse, 4th Edition

4/15/2013
15
Grit Characterization• Methods of grit sampling and analysis
– Sand Equivalent Size (SES) determination of collected influent grit sample
– Dry sieve analysis of collected influent grit sample
– Sampling and characterization of primary sludge
– Sampling and characterization of grit that has accumulated in aeration tanks
• Two inherent difficulties with grit testing (MOP-8)– Uneven distribution of grit in both the influent and
effluent
– Erratic loading patterns associated with grit only being carried into a plant during high flow
Sand Equivalent Size Determination • Sampling Procedures
– Utilizes a circular grit settling device with a conical bottom
– Utilizes a vertically integrated slot sampler (VISS) to sample equally over the entire channel depth
– Utilizes a high volume trash pump placed inside VISS centrally in a vertical upward flow
• Pumps to the settling device
• Trash pump velocity is set to match the velocity across the slot in the VISS
• Care must be taken to avoid pumping from the channel bottom where deposited gravel will be sampled
Grit Book - Eutek Systems, Inc. 2007

4/15/2013
16
Sand Equivalent Size Determination Sampling Equipment
Grit Book - Eutek Systems, Inc. 2007
Sand Equivalent Size Determination Grit Analysis
• Wet sieve grit sample immediately following collection (time consuming process)– Sieve from ¼” to 50 μm in 10 size intervals in 45 min.
• Measure the settling velocity distribution of each sieve size fraction in a modified Imhoff cone
• Calculate grit SES values
• Plot the SES distribution for each size fraction– Most of the entering grit will have settling velocities <
225 μm sand
• Measure the ash weight for each size interval
Grit Book - Eutek Systems, Inc. 2007

4/15/2013
17
Sand Equivalent Size Determination Grit Analysis Cont.• From SES distributions for each size range
and weight distribution, calculate SES weight distribution of influent grit
• Summarize results on companion plots
Grit Book - Eutek Systems, Inc. 2007
Dry Sieve Analysis of Collected Influent Grit Sample
• Obtain grit samples from multiple points across channel (cross-channel sampling)– Utilize narrow or slender sampling equipment to
limit disruption of flow velocity
– Label all collected samples by the time of day, collection location, and channel velocity
• Dry–sieving grit samples entails burning samples in a muffle furnace to remove organic material particles prior to sieving– Historically practiced method
– Avoids capillary action between wet fine screens
2008 Smith & Loveless, Bulletin 9503-14

4/15/2013
18
Dry Sieve Analysis Concerns• Potential problems
– The attached surface active agents (FOG & soap) are removed and their buoyant effect on grit is destroyed
Grit Book –Eutek Systems, Inc. 2007
– Size distributions of grit before and after ashing in a muffle furnace may vary due to fracturing of some inorganic materials such as limestone
Sampling & Characterization of Primary Sludge
• For Plants with primary clarifiers it is recommended in WEF MOP-8 to sample and classify grit quantities in Primary Sludge– Considered to be a reliable method in MOP-8
– Dry sieve analysis performed
– Analysis may not accurately reflect influent grit• When grit is combined with sludge there is a significant
settling velocity reduction for fine grit
• Actual grit quantities may be larger and grit sizes smaller than analysis results indicate

4/15/2013
19
Sampling & Characterization of Grit Accumulated in Aeration Basins
• Sample and characterize grit (particle size & density) that has accumulated in aeration basins– Accumulated grit is from an extended period &
overcomes problems with a brief sampling program
– Avoids problem with getting a representative sample in a channel due to:
• Improper sampling location
• Turbulence caused by sampling equipment
– Analyzed sample represents a wide range of influent flow and weather conditions
– Provides information on desirable design particle size to avoid grit deposition
Summary & Conclusions• Design based on traditional grit assumptions may result
in low removal efficiency
• Specific gravity of particles and size distribution of grit can vary widely
• FOG coating of grit particles may impact grit settling vel.– Design conservatively
• Grit settling is based on discrete particle settling theory or gravity separation in an accelerated flow field– Avoid turbulent region for discrete particle settling
• Confidence in short term grit characterization studies should be tempered (need to sample during high flows)– May want to sample grit where it accumulates in a WWTP
• Standard sampling and analysis methods are desirable

4/15/2013
20
Questions & Comments
For more information…
Steven P. Gress, P.E.
Technical Associate(317) 500-4221
Case Studies for Analyzing Aerated Grit Basins Using CFD
Marie Burbano, Ph.D., P.E., BCEE, Carrie Knatz, P.E.

4/15/2013
21
Agenda• Introduction
• Strategy For Analyzing Aerated Grit Tanks Using CFD (Computational Fluid Dynamics)
• Case Studies and Results– Greater Augusta Utilities District (GAUD), Augusta, Maine
– Onondaga County, Metropolitan Syracuse Wastewater Treatment Plant (WWTP), Syracuse, New York
– Water Pollution Control Facility (WPCF), City of Gloucester, Massachusetts
• Lessons Learned
• Closing
Introduction
• Computational Fluid Dynamics (CFD)
• CFD predicts hydraulic performance inside a structure using principles of fluid flow known – Reynolds-averaged Navier-Stokes (RANS) equations
– Conservation of mass, momentum and energy
• RANS equations solved to predict hydraulic information– Velocity and pressure
– At a finite number of discrete points within the fluid domain
• Model represents the real-scale geometry
• Analysis can include simulations of different flow conditions
• Results can be extracted from anywhere within the fluid domain

4/15/2013
22
Strategy for Analyzing Aerated Grit Tanks Using CFD
1. Perform physical evaluation of structure– In person
– Photos
– As-builts
2. Compare facility to MOP-8 parameters
3. Identify boundaries of model
4. Establish potential modifications up front
Strategy For CFD Analysis (continued)
5. Input data from as-built drawings, flow rate, and water surface elevation to build model geometry
6. Select size of mesh– Tighter mesh used in areas of concerns
– Larger mesh size used in other areas to speed up simulations
7. Run baseline conditions
8. Run simulations of modifications
9. Review output results (graphics) identify flow patterns and potential disruptions in roll pattern to make recommendations

4/15/2013
23
Greater Augusta Utilities District (GAUD)
• Combined collection system– Average DWF = 5 mgd
– Peak WWF to the plant = 43-44 mgd
– CSO control improvements under design
• WWTF improvements part the program– Wet weather treatment issues
– Low-cost improvements sought –“no new tanks”
Secondary Clarifiers
AerationTanks
PrimaryClarifiers Grit Tanks
© 2009 Google
Grit Chambers
• 2 aerated grit chambers
• Significant, problematic grit carryover– Noticed when flow reaches 5-6
mgd per grit chamber
– Peaks reach 22 mgd per grit chamber
– Collection system improvements to result in peak flow of 18 mgd per grit chamber
2 Grit Tanks
Large baffleat end ofeach tank
Grit collector

4/15/2013
24
GAUD Grit Chambers
Traditional Design Criteria
(Previous MOP 8)
Recent Design Criteria
(New MOP 8)
Width:Depth Ratio 1.25:1 1:1 to 5:1 0.8:1 to 1:1
Length:Width Ratio 1.7:1 3.5:1 to 5:1 3:1 to 8:1
Aeration Rate 2.5 to 6.5 cfm/ft1.5 to 4 cfm/1000 cf
3 to 8 cfm/ft10 to 20 cfm/1000 cf
HRT at peak flow 3 min (@43 mgd) 2 to 5 min 3 to 10 min
Side Water Depth 12.75 ft 12 to 16 ft
Floor slope 25 percent >30 percent
Aerated Grit Chamber Design Criteria
Conclusions of Preliminary Evaluation• Grit chamber design criteria confirm observed
performance
• Total volume of grit chambers limits likely improvement at peak flow
• Improvement should be possible at some intermediate lower flow
• CFD would be useful in identifying and optimizing low-cost improvements

4/15/2013
25
CFD Scenarios
1. Existing grit chamber
2. Existing baffle removed
3. New “lateral” baffles
4. New “longitudinal” baffle
5. Re-sloped floor
3 flows: 6 (low), 12 (avg), 22 (peak) mgd
(1) Proposednew
“lateral”baffles
Proposedfloor
resloping
Proposed“longitudinal”
baffle
CFD Geometry and Model Setup• Gambit (version 2.4.6)
preprocessor– Mesh generated
– Nearly 1,000,000 cells
• Fluent version 6.3– Steady-state analysis
– Reynolds-averaged, Navier-Stokes equations describing flux of mass and momentum
– Standard k-epsilon turbulence model
• Aeration– Discrete phase model (DPM)
– DPM injects air particles to affect primary flow pattern

4/15/2013
26
Existing baffle causes upward
velocity in area where grit
has been collected and
conveyed.
Pathlines colored by velocity
Existing BafflePeak flow – 22mgd
No upward velocity at
effluent end; spiral pattern
continues.
Pathlines colored by velocity
Remove Existing BafflePeak flow – 22mgd

4/15/2013
27
Core of very low V
Higher V around the core
Higher V above collection screw upstream of weir
Existing baffle
Core less pronounced
Lower V above
collection screw
Existing baffle removed
Core less pronounced, Similar to
no-baffle results
Proposed lateral baffles
Core less pronounced
Proposed longitudinal baffle
Comparison – Peak flow (22 mgd)
Pronounced core of very low V
Higher V around the
core
Upflow V approaching
weir
Existing baffle
Overall more consistent V
Existing baffle removed
Core varies but exists throughout
tank length
Overall very similar to the no-baffle
results
Proposed lateral baffles
Core less pronounced
Higher V around the core
Proposed longitudinal baffle
Comparison – Peak flow (22 mgd)

4/15/2013
28
Recommended Improvements
• Improvements completed – observed improved grit removal
(1) Removeexisting baffle
(2) Addproposed
“longitudinal”baffle
Onondaga County, Metropolitan Syracuse WWTP• Combined Sewer
• 2 Screening and Grit Removal Facilities– New Screening & Grit (NS&G)
– Existing Screening & Grit (ES&G)
• Flows– Peak Flow: 240 MGD
– Design Flow: 84 MGD
– Average Flow: 65 MGD (2010)
– Tertiary Treatment: <126 MGD
NSG
ESG
PS
Headworks
4/15/2013
29
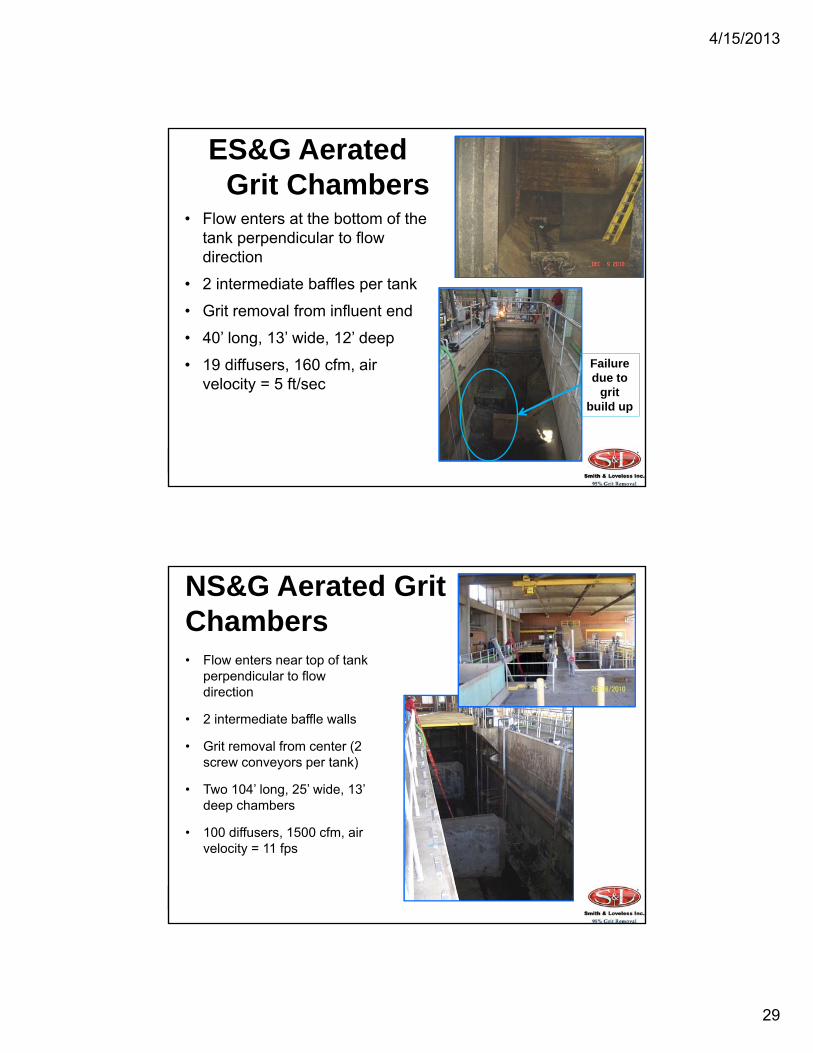
ES&G Aerated Grit Chambers
• Flow enters at the bottom of the tank perpendicular to flow direction
• 2 intermediate baffles per tank
• Grit removal from influent end
• 40’ long, 13’ wide, 12’ deep
• 19 diffusers, 160 cfm, air velocity = 5 ft/sec
Failure due to
grit build up
NS&G Aerated Grit Chambers• Flow enters near top of tank
perpendicular to flow direction
• 2 intermediate baffle walls
• Grit removal from center (2 screw conveyors per tank)
• Two 104’ long, 25’ wide, 13’ deep chambers
• 100 diffusers, 1500 cfm, air velocity = 11 fps

4/15/2013
30
Grit Removal Project Goals
• ES&G and NS&G– Optimize grit removal by improving hydraulic flow pattern to
induce vertical roll pattern
– Distribute grit along length of tank
• NS&G– Evenly divide grit between grit chambers 1 and 2
• Create basis for design by using CFD– CFD used as a tool to help maximize value by spending dollars
on most effective modifications
– Modeled existing configuration as a baseline to be able to determine level of improvement achieved by modifications
Comparison of Grit Chambers to MOP-8 Design Criteria
Criteria MOP-8- 5th Ed ES&G NS&G
Width : Depth Ratio 0.8 to 1 1.12 1.92
Depth 12 to 16 feet 11.9 13.0
Length : Width Ratio 3:1 to 8:1 3:1 4:1
Air Rates 3 to 8 cfm/ft 4 cfm/ft 14.2 cfm/ft
CFD Modeling of Grit Improvements

4/15/2013
31
ES&G: Model Simulation Results for Baseline Conditions
ES&G: Proposed Model Simulations
• Once baseline simulations were complete, recommendations for proposed modifications were selected– Remove intermediate baffles
– Increase air flow
– Modify influent “doghouse” baffle

4/15/2013
32
ES&G Comparison of Baseline and ProposedES&G Baseline ES&G Proposed
Grit Tracer Study
ES&G – Proposed
ES&G – Baseline

4/15/2013
33
NS&G1 and NS&G2: Baseline Conditions
NS&G 1 NS&G 2
Future Work
• ES&G: evaluate longitudinal baffle possibly
• NS&G 1: evaluate design of baffles to straighten influent flow
• NS&G 2: likely similar modifications as NSG 1, other than how flow is straightened

4/15/2013
34
Gloucester Water Pollution Control Facility (WPCF)
• Purpose: Assess overall hydraulic performance with respect to potential for grit re-suspension
• CFD model (Fluent version 12.1) – Single-phase, steady state analysis
– Simulated aeration by introducing air bubbles with discrete-phase model (DPM)
• WPCF has two identical aeration grit tanks operating in parallel only one tank was modeled
• Two flow conditions were simulated: – Case 1: 15 mgd with one tank in service
– Case 2: 15 mgd with two tanks in service (assume equal flow split between the two tanks)
Gloucester WPCF Results
Case 1: One tank for full 15 mgd flow
Case 2: Two tanks in service, split 15 mgd flow

4/15/2013
35
CFD Lessons Learned
• Develop potential modifications early and build into the geometry of the model, but be prepared for additional effort if baseline simulation shows something unexpected
• Workshops/collaboration important – team approach
• If something is going to be changed in near future, modify the geometry and include it in baseline simulation as a given
• If funding available, model at different flow rates
• Review overall impacts of changes (upstream/downstream hydraulics for example)
Closing• Acknowledgements
– GAUD• Dan Bisson (CDM), Bill McConnell (CDM), Brian
Tarbuck (GAUD)
– Augusta County• Dan Jean (GAUD), Jim Renk (GAUD), Nancy
Vigneault (CDM)
– Gloucester• Mike Kostur (CDM)
• Questions?

4/15/2013
36
Vortex Case StudiesFull Scale and Pilot Scale
by
Brian F. McNamara
Grit Removal Efficiency
Grit Unit Grit Effluent
Final Product
Grit Influent
Sample Location
%Grit Efficiency = Grit Inf – Grit Eff x 100Grit Inf

4/15/2013
37
Vertical Sampler Technique
This technique was employed for both full scale and pilot scale
studies
Typical pump rate approximately 120 gpm
Vertical SamplerGathers a representative sample from the entire vertical water column
Slot width function of stream velocity, channel depth, pump velocity, & cross sectional area of pump suction

4/15/2013
38
50-micron Grit Settler
Sampling begins as diurnal flows raise up and continue thru the peak of the afternoon. Continuous composite for 6 hours.
Post-Sampling Activities
• Decant sample from settler
• Rinse loose floatable organics from sample
• Drain off liquid
• Volume & Weight of total sample recorded
• Wet-sieve

4/15/2013
39
Wet-sieve System
Fixed Solids Determination
Flow weighted calculations for quantity or grit per MGD
Grit vs. Grit
Pilot Evaluation Comparing
Multi-Tray
verses
Structured
Vortex Grit Removal Technologies

4/15/2013
40
Multiple Tray Technology
Multiple Tray Features
• Full Scale
• Two Units
• 18 MGD each (68 ML/d)
• 9 Trays
– 12 foot dia (3.66 m)
– 1062 ft2 (98.7 m2)
• Plastic & Stainless Steel
• Two foot head loss (60 cm)
• Cut Point 100 µm @ 2.65 sg

4/15/2013
41
Multiple Tray Pilot Unit
Two Trays 4 ft diameter (1.22 m)Optimum Performance: Feed Rate170 gpm Cut point : 75 µm @ 2.65 sg
Structured Vortex Technology

4/15/2013
42
Structured Vortex Features
• Full Scale
• Two Units
• 18 MGD each (68 ML/d)
• 22 foot diameter (6.7 m)
• Concrete & Stainless Steel
• Less than one foot head loss (30.5 cm)
• Cut point 150 µm @ 2.6 sg
Structured Vortex Pilot Unit
4 ft dia (1.22m)Optimum Performance: Feed Rate180 gpm Cut point : 106 µm @ 2.65 sg

4/15/2013
43
Test Protocol
• Simultaneous Parallel testing
• Same day testing
• Use native grit from plant RWI
• Comparable flow rates
• Applicable full scale flow rates
• Same test procedures
• Same analysis
• One laboratory
Scale Up Test Protocol

4/15/2013
44
Pilot Testing
Dual Vertical Samplers at RWI

4/15/2013
45
Pilots with Sampling Equipment
Testing Problems
•Ultrasonic Flow Meters could not perform
•Feed rates determined by fill test and adjusting throttle on pump motor
•Rags fouled pump suctions•Bar screens placed in hand
•Could not achieve pump rates of 300 gpm (1136 Lpm) or the full scale equivalent of 18 MGD (68 LPD)
•RWI channel 22 ft deep•Trash pumps too small•Rented pumps unable to perform

4/15/2013
46
10 MGD ResultsMultiple Tray39 ML/d (10.4 MGD) December 17, 2007
Structured Vortex 40 ML/d (10.5 MGD) December 17, 2007
15 MGD Results
Structured
Vortex
56 ML/d
(14.8 MGD)
December 18,
2007
Multiple Tray 57 ML/d (15.1 MGD) December 18, 2007

4/15/2013
47
Pilot Unit Removal Efficiencies
Conclusion
• Foot Print Equal
• Price Comparable– $1.3 Million for 2 Multiple Tray Units
– $1.2 Million for 2 Vortex Units
• Head loss greater for multiple tray unit
• Multiple tray unit exhibited higher removal rates at higher flows

4/15/2013
48
True Grit
Full-Scale Performance Assessment At Three
Mechanical Vortex Grit Removal Treatment Plants
*Specs indicate both 30 MGD and 50 MGD**All systems reference grit at 2.65 SG
Note: All removal processes refined the grit using cyclones & classifiers
Evaluated Grit Removal Processes

4/15/2013
49
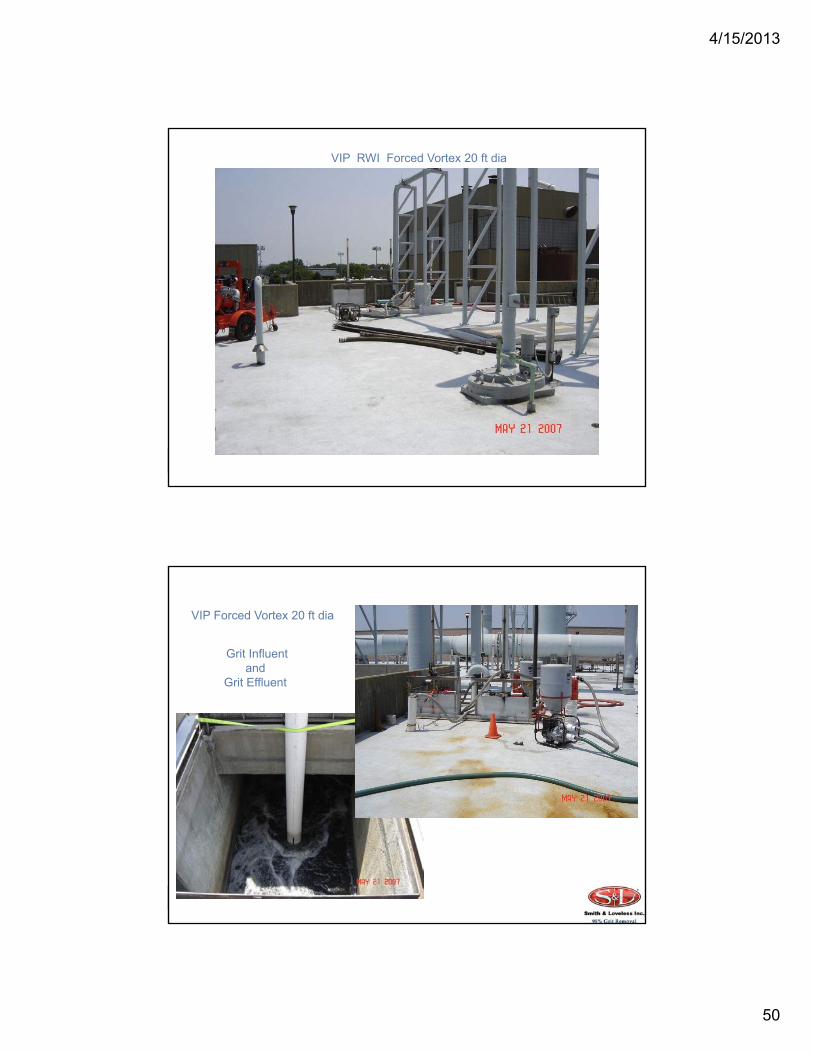
VIP Forced Vortex 20 ft dia
Plant Design 40 MGD with Collection system composed of both gravity and force mains
Vortex Grit Effluent
Grit Refinement
Final Product
RWI
Plant Recycles
Plant Drains
Grit Influent
Recycle
VIP Forced Vortex 20 ft dia
54” vertical rise
Preceded by RWI wet well
29 MGD
RWI = 2.8 fps
Grit Inf = 2.3 fps
Grit Eff = 3.5 fps
4/15/2013
50
VIP RWI Forced Vortex 20 ft dia
Grit Influent and
Grit Effluent
VIP Forced Vortex 20 ft dia

4/15/2013
51
Grit in primary biosolids
Premature wear on centrifuges
Grit volume taking up valuable incinerator space
Plant HistoryVIP Forced Vortex 20 ft dia
Plant HistoryVIP Forced Vortex 20 ft dia
RWI flow and Incinerator feed belt totalizer during a hydraulic event.

4/15/2013
52
Concentration of Grit VIP Force Vortex 20 ft dia on May 20, 2007Sunday
Average hourly flow during sampling was approximately 30 MGD
Specification requires 65% of 100 mesh (150 μm) at a maximum design flow of 26.7 MGD and 2.65 sg
Virginia Initiative PlantVortex 20 ft Dia Efficiency Results

4/15/2013
53
System ConclusionsVIP Forced Vortex 20 ft dia
- 70% of RWI grit was over 200 microns
- > 300 micron grit shape flat, settled slowly
- Current system operation does not adequately protect downstream equipment
- Note: Plant was advised to use 2 vortexes if flows over 26 MGD
CETP Forced Vortex 24 ft dia
Plant Design 24 MGD with a collection system composed of force mains

4/15/2013
54
Vortex Grit Effluent
Grit Refinement
Final Product
RWI
Plant Recycles
Plant Drains
Grit Influent
Recycle
CETP Forced Vortex 24 ft dia
Force main collection system. Predominantly urban.
23 MGD
RWI = 2.0 fps
Grit Inf = 4.0 fps
Grit Eff = 3.0 fps
Parshall Flume
Sample Location
CETP Forced Vortex 24 ft dia RWI & Grit Influent
23 MGD RWI = 2 fps Grit Inf = 4 fps Grit Eff = 3 fps

4/15/2013
55
CETP Forced Vortex 24 ft dia
Grit Effluent
Plant HistoryCETP Forced Vortex 24 ft dia
Prior to forced vortex units, plant used square grit chambers or Detritors.
2005 Detritors removed 24,570 ft3 grit
2007 Forced vortex & hydro-cyclones removed 2,034 ft3
4/15/2013
56
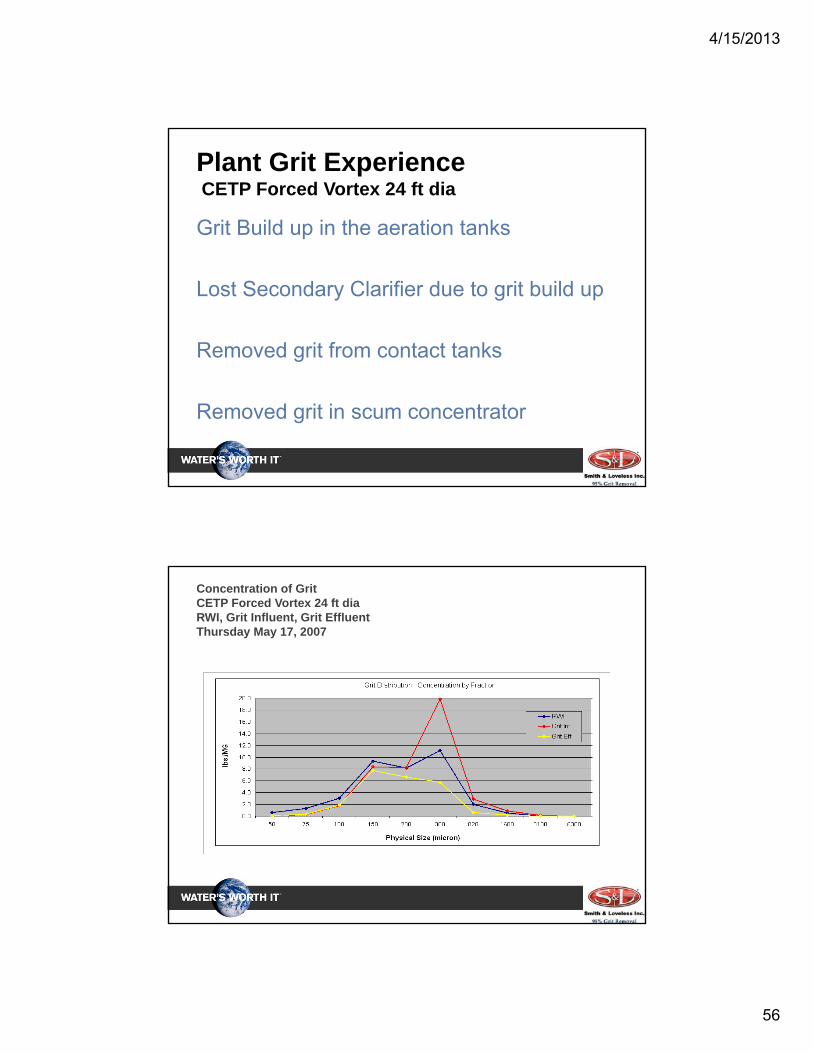
Plant Grit ExperienceCETP Forced Vortex 24 ft dia
Grit Build up in the aeration tanks
Lost Secondary Clarifier due to grit build up
Removed grit from contact tanks
Removed grit in scum concentrator
Concentration of Grit CETP Forced Vortex 24 ft diaRWI, Grit Influent, Grit EffluentThursday May 17, 2007

4/15/2013
57
CETP Forced Vortex 24 ft dia Removal Efficiency
At 30 MGD, manufacturer specifies 95% removal of 100-mesh with 2.65 sg
Average hourly flow during sampling was approximately 20 MGD/hour
System ConclusionsCETP Forced Vortex 24 ft dia
- +80% of RWI grit was over 200 microns
- > 300 micron grit shape flat, settled slowly
- System did not protect downstream equipment

4/15/2013
58
Nansemond Treatment Plant24 ft Vortex
Plant Design 30 MGD
with a collection system composed of force mains
Vortex Grit Effluent
Grit Refinement
Final Product
RWI
Plant Recycles
Plant Drains
Grit Influent
Recycle
NTP Forced Vortex 24 ft dia
48” vertical rise
22.5 MGD
RWI = 2.8 fps
Grit Inf = 1.7 fps
Grit Eff = 1.93 fps

4/15/2013
59
Plant Grit ExperienceNTP Forced Vortex 24 ft dia
1203 Wet Metric Tons Removed from Digester 2008
NTP Forced Vortex 24 ft dia Removal Efficiency
Average hourly flow during sampling was approximately 20 MGD/hour
At 50 MGD, manufacturer specifies 95% removal of 100-mesh with 2.65 sg *

4/15/2013
60
System ConclusionsNansemond 24 ft Vortex
• Over 80% of grit was less than 297 µm
• System does not adequately protect down stream equipment.– 1203 Metric tons removed from digester in 2008
Overall ConclusionsTECHNIQUE- The grit sampling and testing methods are repeatable and meaningful- Evaluating the overall system is necessary
EQUIPMENT (for this study)- Forced vortex units had high efficiencies for large micron particles- Forced vortex units performed better at less than design flow rates
OPERATIONAL ADVICE- Evaluate putting more units in service to catch slug loads (first morning
flows and wet weather events)
FUTURE- More testing is desired during wet weather events- CFD Modeling to examine how to improve performance

4/15/2013
61
True Grit Summary
Questions?
Brian McNamaraArmy Base Treatment Plant
401 Lagoon RoadNorfolk, VA 23505

4/15/2013
62
Questions?
This Webcast Is Brought To You By:
Smith & Loveless Inc.