fundamentals of instrumentation design - module i
DESCRIPTION
An Introduction to Instrumentation for the Oil and Gas IndustryTRANSCRIPT

Fundamentals of Industrial Control Instrumentation Design
&
An Introduction to SmartPlant Instrumentation Software (INTOOLS)
www.IPgruppEngineering.com44B Ajanaku Str Opebi, Lagos 018984028 08023036794
Training Coordinator: Shola Daley
www.IPgruppEngineering.com44B Ajanaku Str Opebi, Lagos 018984028 08023036794

Training Module I : Introductory Concepts & General Terminologies ……..1 day
Training Module II : “Project specific” Instrumentation and control concepts and deliverables review …………4 days
Training Module III : “Basic SPI(INtools) Concepts and application ……….5 days
www.IPgruppEngineering.com44B Ajanaku Str Opebi, Lagos 018984028 08023036794

Training Module I
Introductory Concepts & General Terminologies
•Introduction : An overview of process controlKey terms & definitions Components of the control system (The Control Loop)Process and Control Diagrams ( A primer)
www.IPgruppEngineering.com44B Ajanaku Str Opebi, Lagos 018984028 08023036794

Training Module II
“Project specific” Instrumentation and control concepts and deliverables review
•Piping & Instrumentation Diagrams in DetailControl Systems Field & Remote Instrumentation EquipmentInstrumentation Project DeliverablesInterfacing with other engineering Disciplines
www.IPgruppEngineering.com44B Ajanaku Str Opebi, Lagos 018984028 08023036794
Training Module III
“Basic SPI(INtools) Concepts and it’s application
• System and Project Administration Module OverviewUser Report Interface Module OverviewCalculations Module OverviewSpecifications Module OverviewWiring Module OverviewProcess Data Module OverviewSpecifications Modules OverviewLoop Diagrams Modules OverviewInstallation Details Modules Overview
www.IPgruppEngineering.com44B Ajanaku Str Opebi, Lagos 018984028 08023036794

Bio-Slide: Shola Daley
Electrical/Electronics OAU 89Shell Petroleum Warri E/I Engineer(Field) 90-92Chevron Oil Escravos Facilities Engineer 92-95Mobil Producing Qua Iboe Terminal Electrical Eng 95-96Data Communications & Control SouthBank UK 96Sandersons Construction Company , UK 97-99Ipgrupp Engineering Technical Manager , to date
www.IPgruppEngineering.com44B Ajanaku Str Opebi, Lagos 018984028 08023036794

Ground-rules1. Please keep phones on vibrate while in class
2. Please minimize questions out of scope of the training as outlined in the modules
3. Please ensure all our activities are performed with safety in mind
4. Please feel free to share your comments or opinions as we progress thru this training notes
www.IPgruppEngineering.com44B Ajanaku Str Opebi, Lagos 018984028 08023036794

Training Module I : Introductory Concepts & General Terminologies …1 day
44B Ajanaku Str Opebi, Lagos www.IPgruppEngineering.com 018984028 08023036794

Introduction
Process as used in the terms process control and process industry,refers to the methods of changing or refining raw materials to createend products.
The raw materials, which either pass through or remainin a liquid, gaseous, or slurry (a mix of solids and liquids) stateduring the process, are transferred, measured, mixed, heated orcooled, filtered, stored, or handled in some other way to produce the end product
Process industries include the oil and gas and the power industry.
www.IPgruppEngineering.com44B Ajanaku Str Opebi, Lagos 018984028 08023036794

Introduction
Industrial Process control Instrumentation refers to the methods that are used to control process variables , factors such as the proportion of one material to another, the temperature of the materials, how well the materials are mixed and the pressure under which the materials are held or transferred over distances can significantly impact the quality of an end product.
Control of the production process is generally required for three primary reasons:
•Ensure process safety••Reduce variability
•Increase efficiency
www.IPgruppEngineering.com44B Ajanaku Str Opebi, Lagos 018984028 08023036794
Introduction
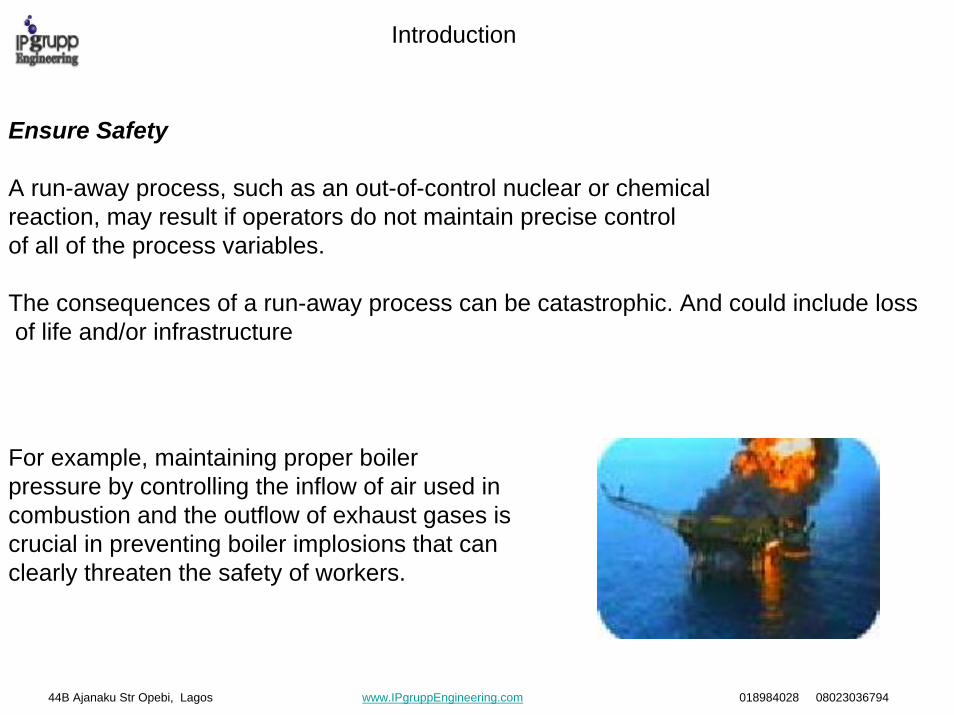
Ensure Safety
A run-away process, such as an out-of-control nuclear or chemicalreaction, may result if operators do not maintain precise controlof all of the process variables.
The consequences of a run-away process can be catastrophic. And could include lossof life and/or infrastructure
www.IPgruppEngineering.com44B Ajanaku Str Opebi, Lagos 018984028 08023036794
For example, maintaining proper boiler pressure by controlling the inflow of air used in combustion and the outflow of exhaust gases is crucial in preventing boiler implosions that can clearly threaten the safety of workers.

Reduce Variability
Process control can reduce variability inthe end product, which ensures a consistentlyhigh-quality product. Manufacturers can also save money by reducing variability.
For example, in a petrol blending process, as many as 10 or more different components may be blended to make a specific grade of petrol. If the refinery does not have precise control over the flow of the separate components, the petrol may get too much of the high-octane components. As a result, customers would receive a higher grade and more expensive petrol than they paid for, and the refinery would losemoney.
The opposite situation would be customers receiving a lower grade at a higher price.
44B Ajanaku Str Opebi, Lagos www.IPgruppEngineering.com 018984028 08023036794
Introduction

Introduction
Increase Efficiency
Some processes need to be maintained at a specific point to maximize efficiency. For example, a control point might be the temperature at which a chemical reaction takes place.
Accurate control of temperature ensures process efficiency. Operators save money by minimizing the resources required to produce the end product.
www.IPgruppEngineering.com44B Ajanaku Str Opebi, Lagos 018984028 08023036794

Control System Theory(terms & definations)
www.IPgruppEngineering.com44B Ajanaku Str Opebi, Lagos 018984028 08023036794
Terms and Definitions
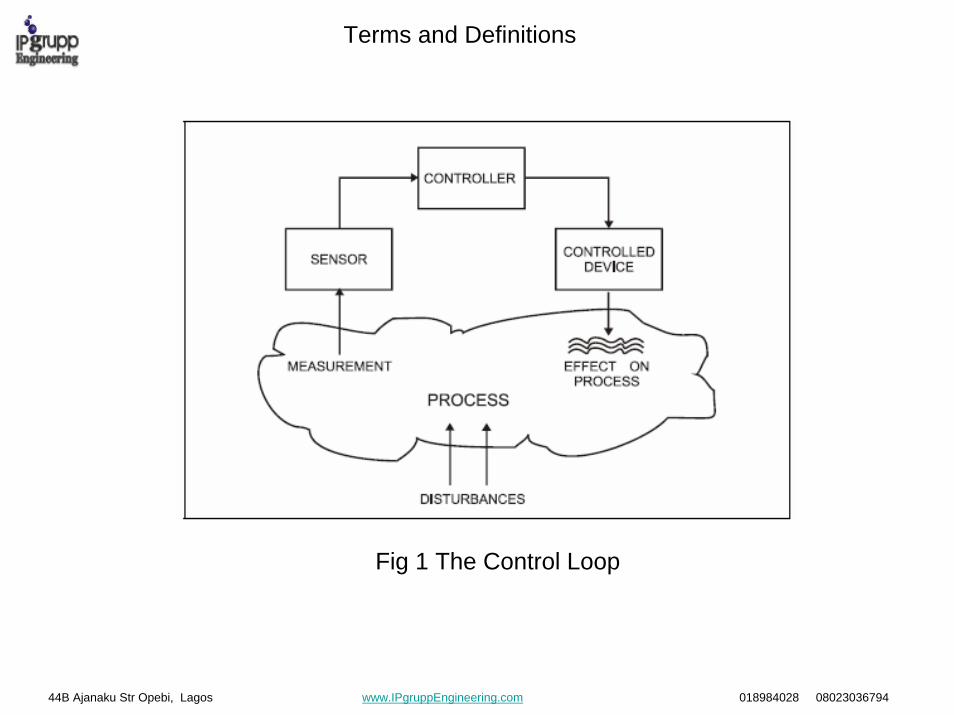
Fig 1 The Control Loop
www.IPgruppEngineering.com44B Ajanaku Str Opebi, Lagos 018984028 08023036794

The control loop
Control loops in the process control industry work in the same way, requiring three tasks to occur:
• Measurement
• Comparison
• Adjustment
In Figure adjacent, a level transmitter (LT) measures the level in the tankand transmits a signal associated with the level reading to a controller(LIC). The controller compares the reading to a predetermined value,in this case, the maximum tank level established by the plantoperator, and finds that the values are equal. The controller thensends a signal to the device that can bring the tank level back to alower level—a valve at the bottom of the tank. The valve opens to letsome liquid out of the tank.Many different instruments and devices may or may not be used incontrol loops (e.g., transmitters, sensors, controllers, valves, pumps),but the three tasks of measurement, comparison, and adjustment are always present.
44B Ajanaku Str Opebi, Lagos www.IPgruppEngineering.com 018984028 08023036794
Terms and Definitions

Terms and Definitions
Closed and Open Control Loops
A closed control loop exists where a process variable is measured,compared to a set point, and action is taken to correct any deviationfrom set point.
An open control loop exists where the process variableis not compared, and action is taken not in response tofeedback on the condition of the process variable, but is instead taken without regard to process variable conditions. For example, a water valve may be opened to add cooling water to a process to prevent the process fluid from getting too hot, based on a pre-set time interval, regardless of the actual temperature of the process fluid.
www.IPgruppEngineering.com44B Ajanaku Str Opebi, Lagos 018984028 08023036794

Terms and Definitions
1.Process Variable
www.IPgruppEngineering.com44B Ajanaku Str Opebi, Lagos 018984028 08023036794
A process variable is a condition of the process fluid (a liquid or gas) that can change the manufacturing process in some way. In the example of you sitting in the “air conditioned office”, the process variable was temperature. In the example of the tank in previous Figure the processvariable is level.
Common process variables include:PressureFlowLevelTemperatureDensityPh (acidity or alkalinity)MassConductivity

Terms and Definitions
2.SetpointThe set point is a value for a process variable that is desired to bemaintained. For example, if a process temperature needs to keptwithin 5 °C of 100 °C, then the set point is 100 °C.
A temperature sensor can be used to help maintain the temperature at set point. The sensor is inserted into the process, and a controller compares the temperature reading from the sensor to the set point. If the temperature reading is 110 °C, then the controller determines that the process is above set point and signals the fuel valve of the burner to close slightly until the process cools to 100 °C.
www.IPgruppEngineering.com44B Ajanaku Str Opebi, Lagos 018984028 08023036794
Terms and Definitions
4.Error
Error is the difference between the measured variable and theset point and can be either positive or negative. In the temperaturecontrol loop example, the error is the difference between the 110 °Cmeasured variable and the 100 °C setpoint—that is, the error is +10°C.The objective of any control scheme is to minimize or eliminate error.
www.IPgruppEngineering.com44B Ajanaku Str Opebi, Lagos 018984028 08023036794

Terms and Definitions
5.Offset
Offset is a sustained deviation of the process variable from theset point. In the temperature control loop example, if the controlsystem held the process fluid at 100.5 °C consistently, even thoughthe set point is 100 °C, then an offset of 0.5 °C exists.
www.IPgruppEngineering.com44B Ajanaku Str Opebi, Lagos 018984028 08023036794

Terms and Definitions
6.Range
The region between the limits within which a quantity is measured, received, or transmitted, expressed by stating the minimum value (lower range value) and maximum value (upper range value). Every sensor is designed to work over a specified workable range. While an electrical output may be adjusted to suit the application, this is not usually practical with mechanical transducing elements.
The design ranges of these mechanisms are usually fixed, and exceeding them can permanently damage a sensor. Transducing elements must be used over the part of their range in which they provide predictable performance and often truer linearity.
www.IPgruppEngineering.com44B Ajanaku Str Opebi, Lagos 018984028 08023036794

Terms and Definitions
7.Calibration To be meaningful, the measurement of the output of a sensor must be in response to an accurately known input. This process is known as calibration, and the devices that produce the inputs are described as calibration standards. It is usual to provide measurements at a number of points in the working range of the sensor, so ratio of output to input may be determined from the measured points by calculation. Such a ratio is described as a calibration factor.
The ratio of output to input is not always a constant over the range of a sensor, and the calibration graph may describe a curve. In these instances, a best straight line may be fitted through the points and the errors accepted, or a different calibration factor must be providedfor every measurement.
www.IPgruppEngineering.com44B Ajanaku Str Opebi, Lagos 018984028 08023036794
8.Accuracy & Precision
Terms and Definitions
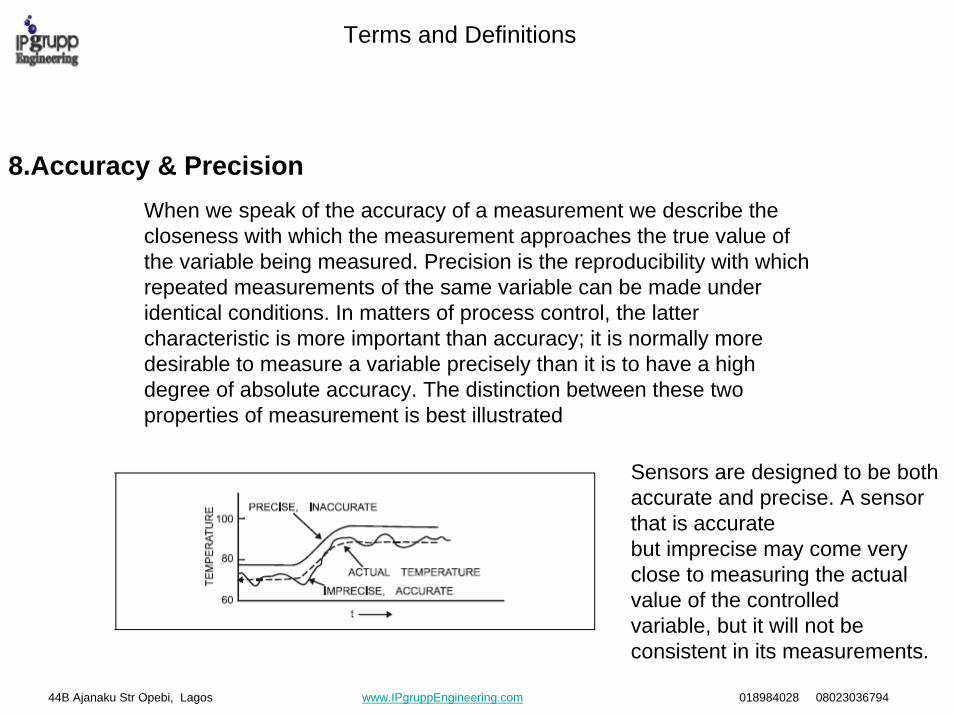
When we speak of the accuracy of a measurement we describe the closeness with which the measurement approaches the true value of the variable being measured. Precision is the reproducibility with which repeated measurements of the same variable can be made under identical conditions. In matters of process control, the latter characteristic is more important than accuracy; it is normally moredesirable to measure a variable precisely than it is to have a high degree of absolute accuracy. The distinction between these two properties of measurement is best illustrated
Sensors are designed to be both accurate and precise. A sensor that is accuratebut imprecise may come very close to measuring the actual value of the controlledvariable, but it will not be consistent in its measurements.
www.IPgruppEngineering.com44B Ajanaku Str Opebi, Lagos 018984028 08023036794

Terms and Definitions
Standards of Measurement
Before proceeding further, a review of standards of measurement is in order, since accurate measurement is the basis of all science. There are six base units of measurement:
• Length >> meter M • Mass >> Kilogram Kg• Time >> Second S• Temperature Kelvin K• Electric current Ampere • Light. Candela cd
www.IPgruppEngineering.com44B Ajanaku Str Opebi, Lagos 018984028 08023036794

Terms and Definitions
Level Measurement
Measuring and controlling liquid level is essential in a processplant, where a wide variety of liquids are handled in both batch and continuous processes. The accurate measurement of level is important for environmental protection (for example, tank overflow to drains), plant safety, product quality, and inventory control.Almost all liquid level devices measure by way of the position or height of the liquid above a zero or lowest point, or the hydrostatic pressure or head.
Examples of Level Instruments• Sight Glass• Floatation Devices•Displacement Devices• Electrical Sensors• Sonic & Ultrasonic Sensors
www.IPgruppEngineering.com44B Ajanaku Str Opebi, Lagos 018984028 08023036794

Pressure Measurement
Pressure is one of the primary measurements used in instrumentation and control. Grasping its meaning, units, and measuring devices is key to gaining a proper understanding not only of what is occurring in a process but also how instruments and controls are used to monitor the process.The atmosphere consists of gases and liquids that have weight and exert apressure on the surface of the earth.
Pressure is defined as force exerted over a unit area. Mathematically, pressure is expressed as
P = F/A, where P = pressure, F = force, A = area. Therefore, the amount of force exerted by a substance directly affects the amount of pressure
Examples of Pressure Instruments• Manometers• Deformation Devices(Bourdon Tube)• Electrical Sensors
Terms and Definitions
www.IPgruppEngineering.com44B Ajanaku Str Opebi, Lagos 018984028 08023036794

Flow Measurement
Flow must be accurately measured and controlled to maintain the processconditions required for maximum plant production and product quality. In most process applications, proper regulation of flow rates ensures control of the process reaction and helps regulate other variables such as pressure, level, and temperature. Often, flow measurements are used as indicators of overall process performance. Flow is one of the most difficult process variables to measure accurately. methods used must take into consideration two basic properties of fluid — density and viscosity
Head FlowmetersThe most frequently used flow-measuring method is the variable head or differential metering method, in which the rate of flow is determined by measuring the differential pressure across an engineered restriction. The restriction devices are usually orifice plates, flow nozzles, and Venturi tubes
Terms and Definitions
www.IPgruppEngineering.com44B Ajanaku Str Opebi, Lagos 018984028 08023036794

Flow Measurement
Other Examples of Flow Measuring Instruments• Turbine/Rotary Flow Meters• Displacement Flow Meters•Magnetic Flow Meters•Thermal Flow Meters•Ultrasonic Flow Meters
Terms and Definitions
www.IPgruppEngineering.com44B Ajanaku Str Opebi, Lagos 018984028 08023036794

Terms and Definitions
Temperature Measurement
Equally important to plant safety and operation is acurate process temperature measurment
Examples of Temperture Measuring Instruments
• Resistance Terminal Device• Thermocouple Devices• Thermometer
RTD’s
Bi-Metallic Gauge
www.IPgruppEngineering.com44B Ajanaku Str Opebi, Lagos 018984028 08023036794

Control System Theory(Components of the control loop)
www.IPgruppEngineering.com44B Ajanaku Str Opebi, Lagos 018984028 08023036794

Components of the Control Loop
The previous section described the basic elements of control asmeasurement, comparison, and adjustment. In practice, there areinstruments and strategies to accomplish each of these essentialtasks. In some cases, a single process control instrument, such as amodern pressure transmitter, may perform more than one of the basic control functions. Other technologies have been developed so that communication can occur among the components that measure,compare, and adjust.
www.IPgruppEngineering.com44B Ajanaku Str Opebi, Lagos 018984028 08023036794

44B Ajanaku Str Opebi, Lagos www.IPgruppEngineering.com 018984028 08023036794
C10
C10
C10
FIELD INSTRUMENT
FI10a
PANEL MOUNTEDINSTRUMENT
COMPUTERFUNCTION
ELECTRICALSIGNAL
FIELD INSTRUMENT
ELECTRICALSIGNAL
PNEUMATICSIGNAL
I/P
PROCESSPIPE
FT10
FV10
FE10
CONTROLVALVE
2" - CS-140-S135
PIPE ID
FY10
AS
FLOW
Components of the Control Loop

Primary Elements(Sensors)
Because sensing devices are the first element in the control loop to measure the process variable, they are also called primary elements. Examples of primary elements include:
Components of the Control Loop
Pressure sensing diaphragms, strain gauges, capacitance cellsResistance temperature detectors (RTDs)ThermocouplesOrifice platesPitot tubesVenturi tubesMagnetic flow tubesCoriolis flow tubesRadar emitters and receiversUltrasonic emitters and receiversAnnubar flow elementsVortex sheddar Typical Thermocouple Assemble
www.IPgruppEngineering.com44B Ajanaku Str Opebi, Lagos 018984028 08023036794

Primary elements are devices that cause some change in their property with changes in process fluid conditions that can then be measured. For example, when a conductive fluid passes through the magnetic field in a magnetic flow tube, the fluid generates a voltage that is directly proportional to the velocity of the process fluid. The primary element (magnetic flow tube) outputs a voltage that can be measured and used to calculate the fluid’s flow rate. With an RTD, as the temperature of a process fluid surrounding the RTD rises or falls, the electrical resistance of the RTD increases or decreases a proportional amount. The resistance is measured, and from this measurement, temperature is determined.
Components of the Control Loop
Principles of the Magnetic Flowmeter
www.IPgruppEngineering.com44B Ajanaku Str Opebi, Lagos 018984028 08023036794

A transducer is a device that translates a mechanical signal into anelectrical signal. For example, inside a capacitance pressure device, atransducer converts changes in pressure into a proportional change incapacitance.
Components of the Control Loop
A transmitter is a device that converts a reading from a sensor or transducer into a standard signal and transmits that signalto a monitor or controller. Transmitter types include:
The pressure transducers measure pressure in the following ranges: -1 to 14 bar and -1 to 34 bar. The transducers produce a 0-10V or 4-20mA output to a controller or monitor.
Pressure Transmitter
www.IPgruppEngineering.com44B Ajanaku Str Opebi, Lagos 018984028 08023036794

A Signal There are three kinds of signals that exist to transmit the process variable measurement from the instrument to a centralized control system.
•Pneumatic
•Analog
•Digital
Components of the Control Loop
www.IPgruppEngineering.com44B Ajanaku Str Opebi, Lagos 018984028 08023036794

Components of the Control Loop
Pneumatic
Pneumatic signals are signals produced by changing the air pressure in a signal pipe in proportion to the measured change in a process variable. The common industry standard pneumatic signal range is 3–15 psig. The 3 corresponds to the lower range value (LRV) and the 15 corresponds to the upper range value (URV). Pneumatic signaling is still common. However, since the advent of electronic instruments in the 1960s, the lower costs involved in running electrical signal wire through a plant as opposed to running pressurized air tubes has made pneumatic signal technology less attractive.
www.IPgruppEngineering.com44B Ajanaku Str Opebi, Lagos 018984028 08023036794

Analog
The most common standard electrical signal is the 4–20 mA current signal. With this signal, a transmitter sends a small current through a set of wires. The current signal is a kind of gauge in which 4 mA represents the lowest possible measurement, or zero, and 20 mA represents the highest possible measurement.
For example, imagine a process that must be maintained at 100 °C. An RTD temperature sensor and transmitter are installed in the process vessel, and the transmitter is set to produce a 4 mA signal when the process temperature is at 95 °C and a 20 mA signal when the process temperature is at 105 °C. The transmitter will transmit a 12 mA signal when the temperature is at the 100 °C set point. As the sensor’s resistance property changes in response to changes in temperature, the transmitter outputs a 4–20 mA signal that is proportionate to the temperature changes.
This signal can be converted to a temperature reading or an input to a control device, such as a burner fuel valve. Other common standard electrical signals include the 1–5 V (volts) signal and the pulse output.
Components of the Control Loop
www.IPgruppEngineering.com44B Ajanaku Str Opebi, Lagos 018984028 08023036794

Digital
Digital signals are discrete levels or values that arecombined in specific ways to represent process variables and also carryother information, such as diagnostic information. The methodologyused to combine the digital signals is referred to as protocol.Manufacturers may use either an open or a proprietary digitalprotocol. Open protocols are those that anyone who is developing acontrol device can use. Proprietary protocols are owned by specificcompanies and may be used only with their permission. Open digitalprotocols include the HART® (highway addressable remotetransducer) protocol, FOUNDATION™ Fieldbus, Profibus, DeviceNet,and the Modbus® protocol.
Components of the Control Loop
www.IPgruppEngineering.com44B Ajanaku Str Opebi, Lagos 018984028 08023036794

Indicators
While most instruments are connected to a control system, operatorssometimes need to check a measurement on the plant floor at themeasurement point. An indictor makes this reading possible. Anindicator is a human-readable device that displays information aboutthe process. Indicators may be as simple as a pressure or temperaturegauge or more complex, such as a digital read-out device. Someindicators simply display the measured variable, while others havecontrol buttons that enable operators to change settings in the field.
Components of the Control Loop
www.IPgruppEngineering.com44B Ajanaku Str Opebi, Lagos 018984028 08023036794

Recorders
A recorder is a device that records the output of a measurementdevices. Many process manufacturers are required by law to provide aprocess history to regulatory agencies, and manufacturers use recorders to help meet these regulatory requirements. In addition, manufacturers often use recorders to gather data for trend analyses. By recording the readings of critical measurement points and comparing those readings over time with the results of the process, the process can be improved.Different recorders display the data they collect differently. Somerecorders list a set of readings and the times the readings were taken;others create a chart or graph of the readings. Recorders that createcharts or graphs are called chart recorders.
Components of the Control Loop
www.IPgruppEngineering.com44B Ajanaku Str Opebi, Lagos 018984028 08023036794

Controller
A controller is a device that receives data from a measurementinstrument, compares that data to a programmed set point, and, ifnecessary, signals a control element to take corrective action.Local controllers are usually one of the three types: pneumatic,electronic or programmable. Controllers also commonly residein a digital control system.
Components of the Control Loop
www.IPgruppEngineering.com44B Ajanaku Str Opebi, Lagos 018984028 08023036794

Controller Cont’d
Controllers may perform complex mathematical functions to comparea set of data to set point or they may perform simple addition orsubtraction functions to make comparisons. Controllers always havean ability to receive input, to perform a mathematical function withthe input, and to produce an output signal. Common examples ofcontrollers include:Programmable logic controllers (PLCs)—PLCs are usuallycomputers connected to a set of input/output (I/O) devices. Thecomputers are programmed to respond to inputs by sendingoutputs to maintain all processes at set point.Distributed control systems (DCSs)—DCSs are controllers that,in addition to performing control functions, provide readings ofthe status of the process, maintain databases and advancedman-machine-interface.
Components of the Control Loop
www.IPgruppEngineering.com44B Ajanaku Str Opebi, Lagos 018984028 08023036794

Components of the Control Loop
Final Control/(correcting) Element
The correcting or final control element is the part of the controlsystem that acts to physically change the manipulated variable. Inmost cases, the final control element is a valve used to restrict or cutoff fluid flow. Pump motors, solenoids, and other devices can also be final control elements.Final control elements are typically used to increase or decrease fluidflow. For example, a final control element may regulate the flow offuel to a burner to control temperature, the flow of a catalyst into areactor to control a chemical reaction, or the flow of air into a boilerto control boiler combustion.In any control loop, the speed with which a final control elementreacts to correct a variable that is out of set point is very important.Many of the technological improvements in final control elements arerelated to improving their response time.
www.IPgruppEngineering.com44B Ajanaku Str Opebi, Lagos 018984028 08023036794
Actuators
An actuator is the part of a final control device that causes a physicalchange in the final control device when signaled to do so. The mostcommon example of an actuator is a valve actuator, which opens orcloses a valve in response to control signals from a controller.Actuators are often powered pneumatically, hydraulically, orelectrically. Diaphragms, bellows, springs, gears, hydraulic pilotvalves, pistons, or electric motors are often parts of an actuator system.
Components of the Control Loop
www.IPgruppEngineering.com44B Ajanaku Str Opebi, Lagos 018984028 08023036794

Examples of Control Loops
Components of the Control Loop
Pressure Control Loop:
Pressure control loops vary in speed—that is, they can respond tochanges in load or to control action slowly or quickly. The speedrequired in a pressure control loop may be dictated by the volume ofthe process fluid. High-volume systems (e.g., large natural gas storagefacilities) tend to change more slowly than low-volume systems
www.IPgruppEngineering.com44B Ajanaku Str Opebi, Lagos 018984028 08023036794

Examples of Control Loops
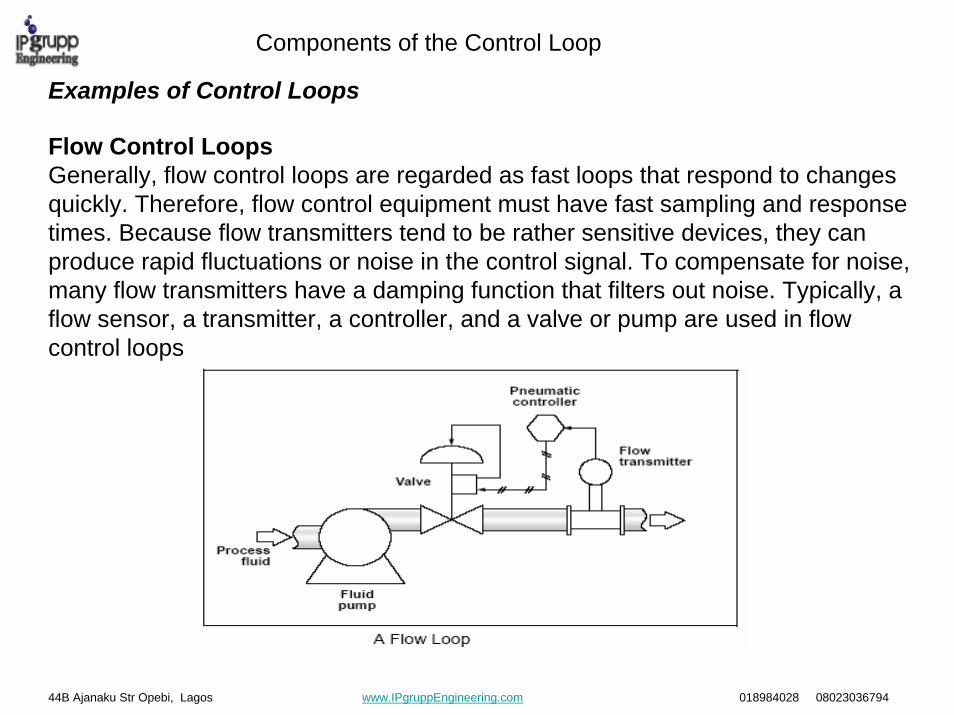
Flow Control Loops Generally, flow control loops are regarded as fast loops that respond to changes quickly. Therefore, flow control equipment must have fast sampling and response times. Because flow transmitters tend to be rather sensitive devices, they can produce rapid fluctuations or noise in the control signal. To compensate for noise, many flow transmitters have a damping function that filters out noise. Typically, a flow sensor, a transmitter, a controller, and a valve or pump are used in flow control loops
Components of the Control Loop
www.IPgruppEngineering.com44B Ajanaku Str Opebi, Lagos 018984028 08023036794
Examples of Control Loops
Flow Control Loops Generally, flow control loops are regarded as fast loops that respond to changes quickly. Therefore, flow control equipment must have fast sampling and response times. Because flow transmitters tend to be rather sensitive devices, they can produce rapid fluctuations or noise in the control signal. To compensate for noise, many flow transmitters have a damping function that filters out noise. Typically, a flow sensor, a transmitter, a controller, and a valve or pump are used in flow control loops
Components of the Control Loop
www.IPgruppEngineering.com44B Ajanaku Str Opebi, Lagos 018984028 08023036794

Examples of Control Loops
44B Ajanaku Str Opebi, Lagos www.IPgruppEngineering.com 018984028 08023036794
Level Control LoopsThe speed of changes in a level control loop largely depends on thesize and shape of the process vessel (e.g., larger vessels take longer tofill than smaller ones) and the flow rate of the input and outflow pipes. Manufacturers may use one of many different measurement technologies to determine level, including radar, ultrasonic, float gauge, and pressure measurement. The final control element in a level control loop is usually a valve on the input and/or outflow connections to the tank. Because it is often critical to avoid tank overflow, redundant level control systems are sometimes employed.
Components of the Control Loop

Examples of Control Loops
Components of the Control Loop
Temperature Control Loop
Because of the time required to change the temperature of a process fluid, temperature loops tend to be relatively slow. RTDs or thermocouples are typical temperature sensors. Temperature transmitters and controllers are used, although it is not uncommon to see temperature sensors Wired directly to the input interface of a controller. The final control element for a temperature loop is usually the fuel valve to a burner or a valve to some kind of heat exchanger.
www.IPgruppEngineering.com44B Ajanaku Str Opebi, Lagos 018984028 08023036794

Control System Theory(Process & Control Diagrams)
www.IPgruppEngineering.com44B Ajanaku Str Opebi, Lagos 018984028 08023036794

Developing the Piping & Instrumentation Diagrams(P & IDs)
The P&IDs are the foundation of the instrumentation and control(I&C) engineering package of a typical project deliverables. The P&ID is a multidiscipline drawing that presents information from the piping, process, I&C, and electrical departments.
The P&ID is developed from the Process Flow Diagram(PFD), a mechanical department product, and the Heat and Material Balance(HMB) sheet, a process engineering department product.
Block Diagrams
PFD’s
HMB’s
P & ID’s
www.IPgruppEngineering.com44B Ajanaku Str Opebi, Lagos 018984028 08023036794

Developing the Piping & Instrumentation Diagrams!(P & IDs)
The “owner” of the P & ID is usually the process group and they provide drawing content, process data and vendor equipment depiction with other disciplines providing input :
Figure 5. Tank TK-10 controls, P&ID presentation
Mechanical/Piping
HS15A
LSLL47
LALL47
TK-10
HS15B
PY48
AS
I/P P
V48
M
LI10
3-WAY LT
10HY13
ASHV13
FC
I
PT48
HOA
ZSC13
ZLC13
I
PIC48
PAH/L
PAH-48
PP-10
FO
PRODUCT TO TK-11
FROM PRODUCT HEADER
TRENCH
DRAIN
2nd Floor
3rd FLOOR
HS13
I
VAC P
SV58
PAL-48
I
I
YL15B
AUTO
YL15A
RUNNING
LAHHLAH
LALLAL
LLSH10
Mechanical: Pipe ID NoEquipment NoEquipment LabelsGraphical depicting of equipment & piping
I & C : Instrument NoGraphical depicting of Instrument & wiring
Electrical : Motor ratingsMotor wiring depicting
www.IPgruppEngineering.com44B Ajanaku Str Opebi, Lagos 018984028 08023036794

Developing the Piping & Instrumentation Diagrams!(P & IDs)
PFDs and HMBs are purely conceptual documents. They have only a minimum of information relating to the specifics of the piping or instrumentation of a system.
The P&ID provides the link between the conceptual and the actual
www.IPgruppEngineering.com44B Ajanaku Str Opebi, Lagos 018984028 08023036794

Developing the Piping & Instrumentation Diagrams!(P & IDs)
The Instrumentation, Systems, and Automation Society (ISA) is one ofthe leading process control standards organization. The ISAhas developed a set of symbols for use in engineering drawings anddesigns of control loops (ISA S5.1 instrumentation symbolspecification). Figure below shows a control loop using ISA symbology.
www.IPgruppEngineering.com44B Ajanaku Str Opebi, Lagos 018984028 08023036794

Developing the Piping & Instrumentation Diagrams!(P & IDs)
In a P&ID, a circle represents individual measurement instruments,such as transmitters, sensors, and detectors
A single horizontal line running across the center of the shape indicates that the instrument or function is located in a primary location (e.g., a control room). A double line indicates that the function is in an auxiliary location (e.g., an instrument rack). The absence of a line indicates that the function is field mounted, and a dotted line indicates that the function or instrument is inaccessible (e.g., located behind a panel board).
Discrete Instruments
Symbols
www.IPgruppEngineering.com44B Ajanaku Str Opebi, Lagos 018984028 08023036794
Developing the Piping & Instrumentation Diagrams!(P & IDs)
Symbols
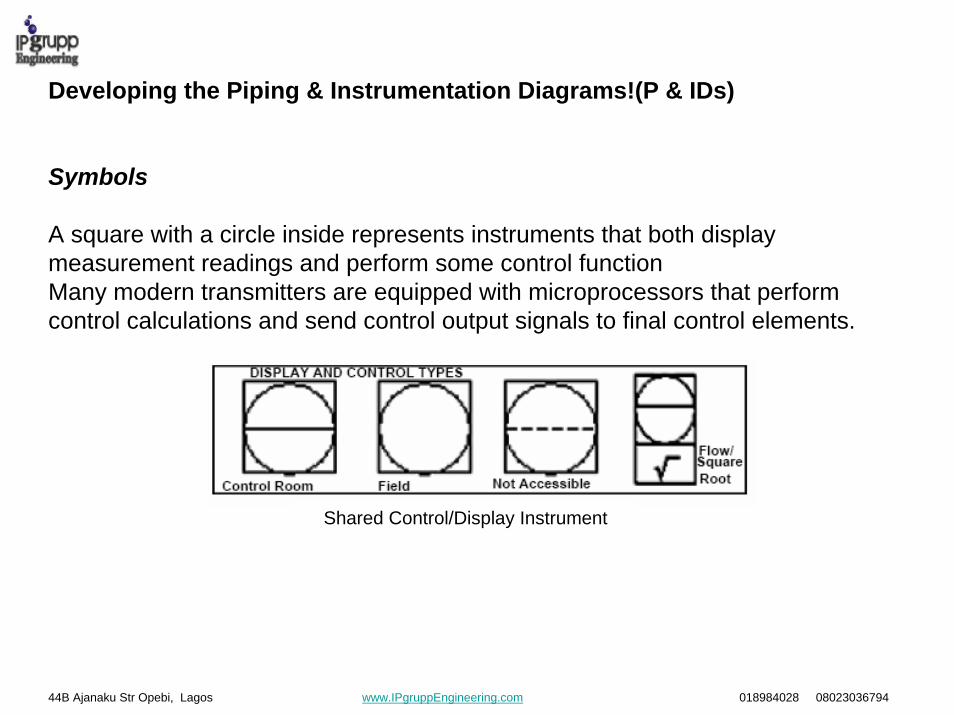
A square with a circle inside represents instruments that both displaymeasurement readings and perform some control functionMany modern transmitters are equipped with microprocessors that perform control calculations and send control output signals to final control elements.
Shared Control/Display Instrument
www.IPgruppEngineering.com44B Ajanaku Str Opebi, Lagos 018984028 08023036794

Developing the Piping & Instrumentation Diagrams!(P & IDs)
Symbols
A hexagon represents computer functions, such as those carried outby a controller
Computer Function/Controllers
www.IPgruppEngineering.com44B Ajanaku Str Opebi, Lagos 018984028 08023036794

Developing the Piping & Instrumentation Diagrams!(P & IDs)
Symbols
A square with a diamond inside represents Programmable Logic Controller(PLC)
PLC’s
www.IPgruppEngineering.com44B Ajanaku Str Opebi, Lagos 018984028 08023036794

Developing the Piping & Instrumentation Diagrams!(P & IDs)
Symbols
A square with a diamond inside represents Programmable Logic Controller(PLC)
PLC’s
www.IPgruppEngineering.com44B Ajanaku Str Opebi, Lagos 018984028 08023036794

Developing the Piping & Instrumentation Diagrams!(P & IDs)
Symbols
Two triangles with their apexes contacting each other (a “bow tie”shape) represent a valve in the piping. An actuator is always drawnabove the valve
www.IPgruppEngineering.com44B Ajanaku Str Opebi, Lagos 018984028 08023036794

Developing the Piping & Instrumentation Diagrams!(P & IDs)
Symbols
Pumps: Directional arrows showing the flow direction represent a pump
www.IPgruppEngineering.com44B Ajanaku Str Opebi, Lagos 018984028 08023036794

Piping and Connections :
Piping and connections are represented with several different symbolsA heavy solid line represents pipingA thin solid line represents process connections to instruments (e.g., impulse piping)A dashed line represents electrical signals(e.g., 4–20 mA connections)A slashed line represents pneumatic signal tubes A line with circles on it represents data links Other connection symbols include capillary tubing for filled systems (e.g., remote diaphragm seals), hydraulic signal lines, and guided electromagnetic or sonic signals.
Developing the Piping & Instrumentation Diagrams!(P & IDs)- Symbols
www.IPgruppEngineering.com44B Ajanaku Str Opebi, Lagos 018984028 08023036794

Identification Letters
Identification letters on the ISA symbols (e.g., TT for temperature transmitter) indicate:The variable being measured (e.g., flow, pressure, temperature) The device’s function (e.g., transmitter, switch, valve, sensor,indicator)
Some modifiers (e.g., high, low, multifunction)Table 7.1 on page 26 shows the ISA identification letter designations. The initial letter indicates the measured variable. The second letter indicates a modifier, readout, or device function. The third letter usually indicates either a device function or a modifier. For example, “FIC” on an instrument tag represents a flow indicatingcontroller. “PT” represents a pressure transmitter.
Developing the Piping & Instrumentation Diagrams!(P & IDs)- Symbols
www.IPgruppEngineering.com44B Ajanaku Str Opebi, Lagos 018984028 08023036794

Tag Numbers
Numbers on P&ID symbols represent instrument tag numbers. Often these numbers are associated with a particular control loop (e.g., flow transmitter 123)
Developing the Piping & Instrumentation Diagrams!(P & IDs)
www.IPgruppEngineering.com44B Ajanaku Str Opebi, Lagos 018984028 08023036794

ISA SYMBOLOGY REVIEWThe figure below shows the elements of ISA symbology used in a P&ID.
Developing the Piping & Instrumentation Diagrams!(P & IDs)
www.IPgruppEngineering.com44B Ajanaku Str Opebi, Lagos 018984028 08023036794