instrumentation, applications and fundamentals of plasma
TRANSCRIPT

Purdue UniversityPurdue e-Pubs
Open Access Dissertations Theses and Dissertations
Fall 2013
Instrumentation, Applications And FundamentalsOf Plasma Ionization Of Organic Molecules FromSurfacesJoshua Scott WileyPurdue University
Follow this and additional works at: https://docs.lib.purdue.edu/open_access_dissertations
Part of the Analytical Chemistry Commons
This document has been made available through Purdue e-Pubs, a service of the Purdue University Libraries. Please contact [email protected] foradditional information.
Recommended CitationWiley, Joshua Scott, "Instrumentation, Applications And Fundamentals Of Plasma Ionization Of Organic Molecules From Surfaces"(2013). Open Access Dissertations. 26.https://docs.lib.purdue.edu/open_access_dissertations/26

Graduate School ETD Form 9 (Revised 12/07)
PURDUE UNIVERSITY GRADUATE SCHOOL
Thesis/Dissertation Acceptance
This is to certify that the thesis/dissertation prepared
By
Entitled
For the degree of
Is approved by the final examining committee:
Chair
To the best of my knowledge and as understood by the student in the Research Integrity and Copyright Disclaimer (Graduate School Form 20), this thesis/dissertation adheres to the provisions of Purdue University’s “Policy on Integrity in Research” and the use of copyrighted material.
Approved by Major Professor(s): ____________________________________
____________________________________
Approved by: Head of the Graduate Program Date
Joshua S. Wiley
INSTRUMENTATION, APPLICATIONS AND FUNDAMENTALS OF PLASMAIONIZATION OF ORGANIC MOLECULES FROM SURFACES
Doctor of Philosophy
R. Graham Cooks
Mary J. Wirth
Chittaranjan Das
Peter T. Kissinger
R. Graham Cooks
R. E. Wild 11/22/2013

INSTRUMENTATION, APPLICATIONS AND FUNDAMENTALS OF PLASMA
IONIZATION OF ORGANIC MOLECULES FROM SURFACES
A Dissertation
Submitted to the Faculty
of
Purdue University
by
Joshua S. Wiley
In partial Fulfillment of the
Requirements for the Degree
of
Doctor of Philosophy
December 2013
Purdue University
West Lafayette, Indiana

ii
Dedicated to my parents and previous teachers for their continuous and loving support

iii
ACKNOWLEDGMENTS
I would like to first acknowledge my parents, Dave and Linda Wiley, for support
through each phase of my life and educational development. Without them, none of this
would have been possible. I would like to thank my brother, David, for setting an
example of how to live and enjoy life and for being someone I could always look up to.
My extended family and friends has been an amazing network of support that has
encouraged me to strive for the best. I have numerous teachers growing up to thank, all
of which have played a role in my development. In particular, I would like to
acknowledge Larry and Jeff Hauswald, Dennis Lopp, Karen York and Kevin Trobaugh as
those teachers who have perhaps had the most impact in my educational development and
career path. As an undergraduate at Indiana University, Prof. Gary Hieftje undoubtedly
had a significant hand in introducing me to analytical chemistry and showing me how to
both enjoy and succeed in the field. I would not be in analytical chemistry if not for him,
and I am very grateful for what he has done for me. The graduate students in Prof.
Hieftje’s group were also instrumental in the development of my passion for analytical
chemistry. In particular, Jake Shelley played a crucial role in teaching me to think, act
and write as a successful scientist does. At Purdue, Prof. Cooks and the entire group
have been amazing to work with. Prof. Cooks’ passion for chemistry is truly contagious
and his benevolence inspirational. Lastly, Achini Bandara has made the last 10 months

iv
of graduate school enjoyable and exciting. She is always willing to lend an ear for
discussion and her generosity has enriched my life. I cannot thank everyone who has
played a major role in my life enough for helping me make it where I am today.

v
TABLE OF CONTENTS
Page
LIST OF TABLES ........................................................................................................... viii
LIST OF FIGURES ........................................................................................................... ix
ABSTRACT ..................................................................................................................... xiv
CHAPTER 1 INTRODUCTION TO PLASMA-BASED AMBIENT IONIZATION MASS SPECTROMETRY ..................................................................................................1
1.1 Background and Concepts .......................................................................................1 1.2 Methods....................................................................................................................6
1.2.1 LTP Setup .......................................................................................................6 1.2.1.1 Safety Considerations ............................................................................6 1.2.1.2 LTP Dimensions and Geometries ..........................................................6 1.2.1.3 Adjustable Parameters for an LTP Probe ...............................................8 1.2.2 Principles of LTP-MS Analyses ...................................................................11 1.2.2.1 Reagent Ions.........................................................................................11 1.2.2.2 Analysis of Gaseous, Liquid and Solid Samples .................................12 1.2.2.3 Necessity of Tandem MS .....................................................................13 1.2.2.4 Reactive LTP .......................................................................................14 1.3 References… ..............................................................................................16
CHAPTER 2 SCREENING OF AGROCHEMICALS IN FOODSTUFFS USING LOW-TEMPERATURE PLASMA AMBIENT IONIZATION MASS SPECTROMETRY ............................................................................................................21
2.1 Introduction ............................................................................................................21 2.2 Experimental ..........................................................................................................24
2.2.1 Chemicals and Reagents ...............................................................................24 2.2.2 Samples .........................................................................................................25 2.2.3 Method of Extraction from Fruits and Vegetables .......................................25 2.2.4 Low-Temperature Plasma Mass Spectrometry .............................................26 2.2.5 Direct LTP-MS Analyses of Fruit and Vegetable Skins ...............................27 2.2.6 LTP-MS Analyses of Fruit and Vegetable Extracts .....................................27

vi
Page
2.2.7 LTP-MS Analyses of Water Samples ...........................................................28
2.3 Results and Discussion ..........................................................................................28 2.3.1 LTP-MS Screening of Agrochemicals in Standard Solutions ......................29 2.3.2 LTP-MS Screening of Agrochemicals in Food Extracts ..............................31 2.3.3 Direct LTP-MS Screening of Agrochemicals on Fruit Samples ..................32 2.3.4 LTP-MS Screening of Agrochemicals in Water ...........................................33 2.4 Conclusions ............................................................................................................34 2.5 References ..............................................................................................................35
CHAPTER 3 HANDHELD LOW-TEMPERATURE PLASMA PROBE FOR PORTABLE “POINT-AND-SHOOT” AMBIENT MASS SPECTROMETRY ..............46
3.1 Intoduction .............................................................................................................46 3.2 Experimental ..........................................................................................................49 3.2.1 Chemicals and Reagents ...............................................................................49 3.2.2 Handheld Low-Temperature Plasma Ion Source ..........................................49 3.2.3 Benchtop Mass Spectrometer .......................................................................51 3.2.4 Miniature Mass Spectrometer .......................................................................52 3.3 Results and Discussion ..........................................................................................53 3.3.1 Specifications of Handheld LTP ...................................................................53 3.3.2 Handheld LTP Testing on Benchtop MS ......................................................54
3.3.2.1 Tablet Analysis ....................................................................................54 3.3.2.2 Large-Scale vs. Handheld LTP ............................................................55 3.3.2.3 Effect of Discharge Gas: Air vs. Helium .............................................56 3.3.3 Handheld LTP on Mini 10.5 MS ..................................................................58 3.3.4 Long-Distance Ion Transfer ..........................................................................60
3.4 Conclusions ............................................................................................................61 3.5 References ..............................................................................................................62
CHAPTER 4 FUNDAMENTALS OF LTP: EMISSION SPECTROSCOPY ..................74
4.1 Intoduction .............................................................................................................74 4.2 Experimental ..........................................................................................................76 4.2.1 Atomic Emission Spectrometer ....................................................................76 4.2.2 Monochromatic Imaging Spectrometer ........................................................77 4.2.3 LTP Probe for Spectroscopic Studies ...........................................................78 4.3 Results and Discussion ..........................................................................................78 4.3.1 Identification of LTP Emission Species .......................................................78 4.3.2 Calculation of Electron Density ....................................................................80 4.3.3 2D Images of Steady-State LTP Emission ...................................................81 4.3.4 Rotational Temperatures and Reactions for LTP Reagent Ion Formation ...84 4.3.5 Time-Resolved and 2D LTP Emission .........................................................87 4.3.6 LTP Interactions with Sample Substrates .....................................................89

vii
Page
4.3.7 Implication of Emission Data on LTP Desorption/Ionization Mechanism ........92 4.4 References ..............................................................................................................95
CHAPTER 5 FUNDAMENTALS OF LTP: NON-THERMAL DESORPTION VIA CHEMICAL SPUTTERING ...........................................................................................110
5.1 Introduction ..........................................................................................................110 5.2 Experimental ........................................................................................................113 5.2.1 LTP-MS Analysis .......................................................................................113 5.2.2 Solution-Phase Electrochemistry ................................................................113 5.2.3 Self-Assembled Monolayer (SAM) Surface ...............................................114 5.3 Results ..................................................................................................................115 5.3.1 LTP-MS Analysis of Non-Volatile Halogenated Analytes ........................115 5.3.2 LTP-MS Analysis of Fluorinated Polymers ...............................................116 5.3.3 LTP-MS Analysis of Organic Salts ............................................................118 5.3.4 LTP-MS Analysis of Imidazolium Ionic Liquids .......................................119 5.4 Discussion ............................................................................................................120 5.4.1 Examining Potential Desorption Pathways ................................................120 5.4.2 Evidence for Chemical Sputtering through Reductive Cleavage ...............124
5.4.2.1 Similarities with Solution-Phase Reductive Cleavage and Gas-Phase ETD .....................................................................................................125
5.4.2.2 Signal Enhancement with Common Electrochemical Mediator ........130 5.4.3 Observation of Novel Reactions with LTP-MS ..........................................131
5.4.3.1 Synthesizing Carboxylate-Terminated Perfluoroalkyl Polymers Directly from Polyvinylidene Fluoride in One Step with an Ambient Plasma ............................................................................................................131
5.4.3.2 Selective Cleavage of Imidazolium Side Chains as a Function of the Anion ........................................................................................................135
5.5 Conclusions ..........................................................................................................136 5.6 References ............................................................................................................138
VITA ................................................................................................................................154
PUBLICATIONS .............................................................................................................156

viii
LIST OF TABLES
Tables Page
2.1 LTP-MS for Trace Analysis of 14 Multi-Class Agrochemicals ............................. 38
2.2 Analytical Performance of Low-Temperature Plasma Mass Spectrometry (LTP-MS/MS) for the Analysis of Agrochemicals in Fruits and Vegetables ........ 40
3.1 Specifications of handheld LTP versus large-scale LTP ........................................ 65
3.2 Limits of detection for various analytes with handheld and large-scale LTP-MS/MS with air and helium discharge gases ................................................. 66
5.1 Structures and mass of parent cations and the respective ions that were detected as a result of LTP-MS analysis. ............................................................ 140
5.2 Data for the LTP-MS analysis of 1-ethyl-3-methylimidazolium, 1-methyl-3-propylimidazolium and 1-butyl-3-methylimidazolium as pure samples with various counter-anions. Attention is given to which alkyl side group is lost more preferentially. ....................................................................................... 142

ix
LIST OF FIGURES
Figure Page
1.1 Diagram of a typical LTP-MS setup ...................................................................... 18
1.2 Diagram of LTP-MS experiment showing the overall desorption mechanism that is typically accepted. It involves thermal desorption of an analyte followed by common APCI reactions. ...................................................... 19
1.3 A) Full-scan LTP-MS and B) LTP-MS/MS of m/z 230 for 80 ppb terbuthylazine (2 µL spot) from a glass slide. ....................................................... 20
2.1 Comparison of signal for a (a) non-heated substrate versus a (b) heated substrate for the MS/MS spectrum [M+H]+ (m/z 216) of atrazine. ....................... 41
2.2 (a) LTP-MS/MS analysis of atrazine in an orange (QuEChERS) extract spiked with 10 µg Kg-1 (MS/MS: m/z 306 201); b) LTP-MS/MS analysis of terbuthylazine in a tomato (QuEChERS) extract spiked with 15 µg Kg-1 (MS/MS: m/z 228 186). The LTP-MS experiments were performed using 3 µL of sample extracts spotted onto the glass substrate heated at 150 °C, with examination by tandem mass spectrometry. Example calibration curves for both analytes are overlaid onto the corresponding spectrum. ......................................................................................... 42
2.3 Identification of the fungicide imazalil in unspiked market purchased citrus fruits samples by LTP-MS/MS, (a) orange; (b) lemon. The main characteristic fragment ions of imazalil are: m/z 255, 201, 159, 176 and 109. The analyses were performed directly on the peel of the fruits without the use of heat using standard LTP-MS without substrate. .................................... 43
2.4 Analysis of real unspiked fruit samples by LTP-MS/MS (after sample extraction with QuEChERS protocol); (a) LTP-MS/MS analysis of an apple extract where imazalil was detected (0.28 mg Kg-1 by LC-MS analysis); (b) LTP-MS/MS analysis of a grapefruit extract where imazalil was detected (0.12 mg Kg-1 by LC-MS analysis). The LTP-MS experiments were performed using 3 µL of sample extracts spotted onto the glass substrate heated at 150 °C, with examination by tandem mass spectrometry. .......................................................................................................... 44

x
Figure Page
2.5 Detection of selected herbicides spiked into environmental water samples by LTP-MS/MS. (a) Detection of atrazine (spiking level: 1 µg L-1) in an aqueous solution (MS/MS: m/z 216 174); (b) Detection of terbuthylazine (spiking level: 10 µg L-1) in aqueous solution (MS/MS: m/z 230 174). The LTP-MS experiments were performed using 3 µL of the water sample (without any sample preparation) spotted onto the glass substrate heated at 150 °C, with examination by tandem mass spectrometry. .......................................................................................................... 45
3.1 (a) Schematic and (b) photograph of the handheld LTP ionization source. (c) Schematic of the circuit used for the handheld LTP probe. ............................. 67
3.2 Direct handheld LTP-MS analysis of a headache relief tablet on the Thermo LTQ in (a) positive ion and (b) negative ion mode. Peaks labeled in magenta, green and red are related to acetaminophen, aspirin and caffeine respectively. Both spectra were acquired with a Thermo LTQ. .............. 68
3.3 Analysis of 24 pg atrazine with (a) large-scale and (b) handheld LTP-MS/MS. Both spectra were acquired with a Thermo LTQ using the optimized conditions for each LTP probe. ............................................................ 69
3.4 Positive ion tandem mass spectrum of 1.2 ng isoproturon with (a) helium- and (b) air-based handheld LTP. Negative-ion full-scan mass spectrum of 200-pg RDX with (c) helium and (d) air used as the discharge gas. All four spectra acquired with a Thermo LTQ. Air was supplied by a large compressed air cylinder for air-based handheld LTP. ........................................... 70
3.5 Handheld LTP MS/MS spectrum of 1.2 ng malathion using the Mini 10.5 MS. ........................................................................................................................ 71
3.6 Analysis of 1 µg methamphetamine on an individual’s finger two hours after being deposited with handheld LTP-MS/MS with a Mini 10.5 MS. ............ 72
3.7 (a) Schematic of the handheld LTP with an interface used for long-distance ion transport to a Thermo LTQ. (b) The analysis of a U.S. one dollar bill with this configuration as well as (c) 10 µg of RDX from a glass slide. .............. 73
4.1 Schematic of the instrumental setup used to obtain 1D LTP emission profiles. This configuration allows full emission spectra to be recorded over a 7 mm observation region, which is where the LTP plume was carefully positioned. .............................................................................................. 97

xi
Figure Page
4.2 Diagram of the monochromatic imaging spectrometer (MIS) used for steady-state and time-resolved 2D emission images for LTP optical characterization. ..................................................................................................... 98
4.3 Gate sequence diagram for the LTP time-resolved emission profiles, where the LTP input square wave was used as a trigger and a delay was varied to provide images at various time points in the overall waveform. ........................... 99
4.4 1-D Emission profile of a helium LTP (exposure time of 1 minute) ................... 100
4.5 Steady-state, monochromatic emission profiles of A.) N2+• (391.2 nm), B.)
He (706.5 nm) and C.) N2 (337.1 nm) from the LTP probe (brown dashed line). (LTP: 0.6 L/min He, 2.8 kHz) (iCCD: 10 s exposure, gain 180) ............... 101
4.6 Steady-state LTP emission from He* (706.5 nm) at various He flow rates. Brown dashed line corresponds to location of the LTP probe. ........................... 102
4.7 Background mass spectra recorded from LTP at two different He flow rates. ..................................................................................................................... 103
4.8 Steady-state LTP emission from He* (706.5 nm) as a function of power consumption. Brown dashed line corresponds to location of the LTP probe. ................................................................................................................... 104
4.9 Vertical profile of measured OH and N2+ rotational temperatures of He-
LTP. Note the monotonically increasing trend for the N2+ rotational
temperature. The two straight lines for the N2+ rotational temperature are
included for visualization purposes. The error bars represent only the error of the slope in the linear regression. Helium flow - 1.60 L/min .......................... 105
4.10 Schematic diagram showing the identified spatially dependent reactions for the afterglow and reagent-ion formation in the LTP probe ambient ionization source. The spectra on the right correspond to N2, N2
+ and He* emission as a function of distance (scaled such that it aligns with the picture of the LTP probe to the left). ................................................................... 106
4.11 Time-resolved emission at 706.5, 391.2 and 337 nm, revealing plasma bullet propagation for He, N2
+ and N2 emission respectively. The gate width was 200 ns with an overall exposure of 35,000 gates for each image. Brown dashed line corresponds to location of the LTP probe. ........................... 107

xii
Figure Page
4.12 Time-resolved, 2D emission of N2+● at 391.2 nm for the interaction of
LTP with an electrically grounded needle (for gate delays between 18 and 90 µs after the rising edge of the square wave used for the LTP source). The gate width was 200 ns with an overall exposure of 35,000 gates for each image. Brown dashed line corresponds to location of the LTP probe. ...... 108
4.13 A) MIS configuration used to monitor plasma-sample interactions. B) Time-resolved images of low-temperature plasma-highlighter (λmax near 507 nm) interactions at various gate delays. The gate width was 100 ns with an overall exposure of 35,000 gates for each image. .................................. 109
5.1 A) Diagram of an F-SAM. B) Negative ion LTP mass spectrum of F-SAM at room temperature. C) Structures of three types of ions detected from the LTP-MS analysis of F-SAM (structures were confirmed with accurate and tandem MS). ......................................................................................................... 143
5.2 LTP-MS analysis of 100 ng of thyroxine from a glass surface in negative ion mode at room temperature. ............................................................................. 144
5.3 LTP-MS analysis of polytetrafluoroethylene (PTFE) in negative ion mode on a Thermo Exactive Orbitrap over A) a wide mass range and B) a more narrow range with different peaks labelled by their chemical formula... ............. 145
5.4 LTP-MS analysis of A) poly(chlorotrifluoroethylene) and B) poly(vinylidene fluoride) in negative ion mode at room temperature. ................. 146
5.5 A) LTP-MS4 analysis of poly(vinylidene fluoride) in negative ion mode and B) the corresponding ion structures at each stage of the MS4 analysis. ........ 147
5.6 LTP-MS analysis of A) tetraoctylammonium bromide and B) benzylhexadecyldimethyl ammonium chloride dry from a glass substrate at room temperature in positive ion mode. ............................................................... 148
5.7 LTP-MS analysis of A) ethylpyridinium bromide and B) 2-(2,5-Dioxopyrrolidin-1-yl)-1,1,3,3-tetramethyluronium tetrafluoroborate dry from a glass substrate at room temperature in positive ion mode. ....................... 149
5.8 LTP-MS analysis of A) 1-ethyl-3-methylimidazolium chloride and B) 1-ethyl-3-methylimidazolium methyl carbonate pure from a glass substrate at room temperature in positive ion mode. ............................................................... 150

xiii
Figure Page
5.9 Selected ion chronogram of m/z 87 from the MS/MS of m/z 132 for the LTP-MS/MS analysis in positive ion mode of acetylcholine from a two µl droplet on a glass substrate at A) ~25 °C, B) ~100 °C and C) 200 °C. Areas of the chronograms are color coated for regions where bulk solvent was still present in a large sample-containing droplet (blue), sample is minimally solvated with very small film of solvent remaining (red), and the sample is dry on the surface (green). .............................................................. 151
5.10 A) Photo of a crude electrochemical cell used for solution-phase electrochemistry in droplets without a reference electrode. Paper spray mass spectrum in positive ion mode of an acetylcholine chloride solution in water (MS/MS of m/z 132 inset) using methanol as the spray solvent B) before and C) after performing electrochemistry on the acetylcholine chloride solution. .................................................................................................. 152
5.11 Selected ion chronogram of m/z 87 from the MS/MS of m/z 132 for switching between the LTP-MS/MS analysis in positive ion mode of two separate dried spots on a glass slide at room temperature. One spot contained pure acetylcholine while the other contained acetylcholine and tetracyanoquinodimethane (TCNQ). .................................................................... 153

xiv
ABSTRACT
Wiley, Joshua S., Ph.D., Purdue University, December 2013. Instrumentation, Applications and Fundamentals of Plasma Ionization of Organic Molecules from Surfaces. Major Professor: R. Graham Cooks.
Various aspects of the interaction of low-temperature plasma (LTP) ambient
ionization with organic molecules and surfaces are discussed. As an application, LTP-
MS has been used for the analysis of pesticides directly from fruits and vegetables
revealing low parts per billion limits of detection (LODs). Due to low power and gas
requirements, a battery-operated and handheld LTP probe was developed for the point-
and-shoot MS analyses. Handheld LTP was compared with large-scale LTP on a
benchtop and miniature MS revealing similar LODs for both. Long-distance ion
transport up to one meter was also demonstrated with flexible tubing for non-proximate
sample interrogation. Fundamentals of LTP-sample interaction were examined through
spectroscopy and MS analysis. Spectroscopic studies have provided insights into reagent
ion formation, with new evidence that He2+ acts as a charge carrier in the plasma. In
addition, monochromatic and time-resolved 2D images of LTP emission from plasma
bullet propagation to open air and various sample substrates were acquired. MS analyses

xv
revealed chemical sputtering from alkyl halides and organic salts. Chemical sputtering
that occurs in the LTP environment appears to be a reductive cleavage process and has
resulted in two interesting reactions. More specifically, imidazolium-based ionic liquids
have been found to selectively lose one of the two side chains as a function of the counter
anion, and a partially fluorinated polymer was broken down into tetrafluoroethylene
monomers which immediately polymerized to form perfluorinated alkyl chains.

1
CHAPTER 1
INTRODUCTION TO PLASMA-BASED AMBIENT IONIZATION MASS SPECTROMETRY
1.1 Background and Concepts
The ability to manipulate ions with electric and magnetic fields is fundamental to
mass spectrometry. Molecular ionization processes can conveniently be grouped into
four main types, electron ionization (EI), chemical ionization (CI), desorption ionization
(DI) and spray ionization (SI). Traditionally, the key MS process of ionization has been
implemented internally, under vacuum. Of the four main types of ionization methods,
only SI in the form of electrospray ionization (ESI) is typically done at atmospheric
pressure. Electrospray ionization (ESI)1 is a solution-based ionization method which is
almost always used with prior liquid chromatography separation. Most sample types are
successfully ionized – and indeed give excellent analytical figures of merit - using one or
other of the traditional ionization methods usually with the aid of prior chromatographic
separation. The special case of rapid, direct ionization of complex mixtures is not
handled well with the traditional methods although there are exceptions for selected
chemical types of analytes, as in the case of alkaloids in plant materials2 where soft
ionization can be used to generate a set of intact ionized molecules followed by the use of
tandem mass spectrometry to obtain structurally characteristic spectra.

2
Molecular ionization at atmospheric pressure was initiated with the study of
vapors using a differentially pumped interface to the mass spectrometer3 a method that
proved to be very sensitive but one that was poor-suited to mixtures. This volume deals
for the problem of how to analyze complex mixtures directly by mass spectrometry. This
task requires that condensed phase samples be ionized and to do this quickly the
experiment must necessarily be done in air. ESI itself is not suited to such tasks as it
requires taking up the sample in solution and its performance is degraded by salts and
competition effects in complex mixture samples. Desorption electrospray ionization
(DESI)4 is a method that was introduced to extend ESI in such a way as to allow direct
analysis of samples in the solid state. Complex samples can be interrogated directly
because DESI has a built-in sampling step based on solvent extraction. The successes of
this technique encouraged a variety of other methods of generating ions from native
samples in their ordinary environment, that is, ambient ionization mass spectrometry.5 In
all of these methods, the complex sample is interrogated to provide analyte ions which
are transferred into the vacuum system. This selective transfer into vacuum of a portion
of sample material is a further distinction between ambient ionization and electrospray
ionization. So, even though ambient ionization methods are derived from and related to
techniques based on ionization at atmospheric pressure, they are also distinct from them
and form a class of methods that address the problem of rapid, direct mixture analysis.
One further comment on ambient ionization is made to note that the term ambient
ionization refers to a particular class of methods used to create ions from samples in the
ambient environment, as just noted. It could also be defined by the objective of the
experiment which is the rapid analysis of ordinary objects in their native environment.

3
There are methods of ionization which allow ambient analysis but which might also be
termed ambient ionization methods. For example, probe based methods in which a small
sample is removed from an object and ionized by spray ionization might fall into this
class. Such methods include the probes used by Hiraoka.6 To take this point further,
ionization of ordinary objects in their native environment can be performed in two ways:
by direct methods or by sampling methods. The direct methods are by definition ambient
ionization methods. Direct methods allow imaging and avoid the extra physical
manipulations of the sampling methods. However, probe sampling may allow access to
positions difficult to locate directly, relative to MS, although sampling using heated or
unheated gas ‘probes’ can achieve sampling by passing over any object from which
sample vapor may be transferred directly into the MS. The use of physical probes
followed by ESI represents an important class of ambient analysis methods.
The ambient ionization experiments can be divided into categories in several
ways: one method of categorization is based on the nature of the principal agency used:
solvent sprays, electrical discharges and lasers. The topic of this dissertation, electrical
discharges or plasma-based ambient ionization techniques, originated with the advent of
direct analysis in real time (DART) in 2005.7 This caused a platoon of other plasma-
based methods to be developed ranging from flowing-atmospheric pressure afterglow
(FAPA)8 to plasma-assisted desorption ionization (PADI)9 to low-temperature plasma
(LTP)10 and many more.11 Each source offers its own uniqueness in geometry, materials,
type of discharge, ac or dc voltages, temperature, etc. However, despite differences in
how the discharges are formed or configured, each source yields similar reagent ions and
their analytical performance is comparable.

4
Some of the advantages of ambient plasmas include excellent ionization
efficiency (even nonpolar compounds), no solvents or waste generated, little dependence
on sample placement and many are capable of portability for in-field analyses. However,
the largest disadvantage, which limits their value as an ambient ionization source, is their
inability to desorb/ionize large, non-volatile analytes due to heavily relying on thermal
desorption. While some of the sources, like DART, employ heaters for increased
desorption capabilities, the increased temperature still does not facilitate desorption for
large peptides and proteins. Some of the plasma-based sources are self-heated (e.g.
FAPA), while others are room temperature (e.g. LTP); however, heat can easily be
implemented to yield similar performance for each of the sources.
The types of samples that are typically analyzed by plasma-based ambient
ionization sources are smaller molecules with masses less than 500 Da, although this is
not a hard mass cutoff. LTP (the topic of this dissertation) has been applied to the
analysis of drugs of abuse,12 fatty acids,13-15 explosives16 and pesticides.17 One of the
major advantages of LTP is its low power and helium consumption which allows it to be
used as a portable ionization source for use with miniature mass spectrometers where it
has been applied to melamine detection in milk,18 explosives from surfaces19 and the
determination of organic vs. non-organic apples in supermarkets.20 While LTP and all of
the plasma-based ambient ionization sources have proven capable of providing good
figures of merit for the chosen samples, they suffer a great deal by not being applicable to
larger, non-volatile analytes.
If plasma-based ambient ionization is to compete with the desorption capabilities
of spray-based and laser-based methods, a mechanism other than thermal desorption will

5
be necessary. One potential desorption mechanism is sputtering due to the presence of
numerous reactive species with large amounts of internal energy in the plasma. Since it
is known that ambient plasmas with excited helium, nitrogen, oxygen, and water species
are incapable of inducing sputtering for many large molecules, it might be necessary to
modify the gas or sample environment to facilitate sputtering. This is an experiment
known as reactive desorption/ionization, and it will be the future of the field of plasma-
based ambient ionization MS if the subfield is to compete with other ambient ionization
techniques. If appropriate sample-plasma environments can be established to allow the
desorption of larger molecules through reactive desorption/ionization, the advantages of
portability, ease of use, and their solvent- and waste-free nature will go a long way in
pushing plasma-based ambient ionization ahead of other ambient ionization methods.
This dissertation is aimed at taking a step toward advancing LTP ionization
through the development of novel applications, instrumentation and fundamental studies.
The next section is meant to be a guide discussing general LTP-MS procedures and
practicalities. In chapter two results are shown for the direct analysis of pesticides from
food items with LTP-MS as well as the development of a cordless, handheld and portable
LTP probe for point-and-shoot analyses in chapter three. Portability is an area of plasma-
based ionization that has not been emphasized much in the literature, but demanding
applications suggest it will be important in the future with advanced miniature MS
instrumentation. The final to chapters are focused on fundamentals of LTP, with Chapter
four focusing on spectroscopic studies of the plume for the elucidation of reagent ion
reactions and plasma-substrate interactions. The final chapter is the real cornerstone of
this dissertation, focusing on non-thermal desorption mechanisms observed with LTP-

6
MS. It is this author’s goal that the discovery of chemical sputtering with LTP and the
investigation of the sputtering process leads to further improvement of plasma-based
ionization through novel reactive desorption/ionization of non-volatile and potentially
large biomolecular analytes.
1.2 Methods
1.2.1 LTP Setup
1.2.1.1 Safety Considerations
Exposed, ac high voltages were present at the LTP source and mass spectrometer
inlet. Electrically insulating gloves and extreme care were used to prevent electrical
shock. Material safety data sheets for all chemicals used were consulted prior to
performing experiments.
1.2.1.2 LTP Dimensions and Geometries
A schematic of a typical LTP-MS experimental setup can be seen in Figure 1.1.
In the original LTP configuration by Harper et al., the glass tube’s outer diameter is 6.35
mm with an internal diameter of 3.75 mm.10 Within the glass tube is a ground electrode
made of stainless steel with an outer diameter of ~1.6 mm. A piece of copper tape is
wrapped around the exterior of the glass tube as the high voltage electrode. Note that the
width of the copper tape electrode will have an effect on the power that can be applied to

7
the plasma. Wider electrodes decrease the plasma density and allow for much higher
powers to be supplied to the plasma without arcing, while having a less wide electrode
will allow the plasma to operate at lower potentials. A similar effect can be observed
with varying the diameter of the internal ground electrode. The typical potential range
for this LTP configuration is 2.5 – 5 kV ac, and the frequency is not as crucial. The
original LTP probe employed a voltage at 2.5 – 5 kHz, but this range has been extended
to over 60 kHz and yields similar analytical sensitivity. Upon applying the ac potential in
addition to the flow of a discharge gas (typically helium) at ~0.4 L/min through the glass
tube, the plasma is formed and directed toward a sample.
The typical LTP-sample-MS orientation is similar to that in the visualization in
Fig. 1.1. Neither angles nor distance have much effect on LTP-MS analyses. A standard
LTP-MS distance from the probe to the sample is ~5 mm and the sample would be ~5
mm from the MS inlet. The angle labelled as “α” is typically 30° - 45°, but this is not
critical as every angle from antiparallel (α = 0°) to 90° to 180° have been demonstrated
and are effective. The particular angle at 180° is a geometry used in the coaxial LTP
configuration, where the inlet capillary to the MS serves as the ground electrode inside
the LTP probe. Excited species from LTP are pushed out of the glass tube to interact
with sample and are then sucked into the MS inlet capillary/ground electrode. A coaxial
LTP source has also been demonstrated that either uses an array of LTPs surrounding the
MS inlet capillary or uses the MS inlet as the ground electrode within one LTP probe.
LTP arrays offer another way of being able to increase the overall power that is supplied
to the plasma without arcing.21

8
The LTP arrays utilized a smaller version of the LTP probe than the original LTP
configuration. Despite the advantages of having an array of LTP probes, even having just
one LTP probe of reduced geometry is advantageous. As will be discussed further in
chapter three, an LTP probe with reduced dimensions is more suitable for portability.
The required power to ignite the plasma is much less due to the thinner dielectric and
more narrow electrode gap, which can be even further reduced if smaller electrodes are
used. In addition, the smaller LTP probe handles lower discharge gas flow rates better
than larger probes, since a constant gas flow rate will result in faster gas velocities and
higher densities of the discharge gas with decreasing tubing diameter. Even though the
exact reasoning is not clear, the smaller version of the LTP probe typically yields better
analytical sensitivity than the larger probe. This point is also discussed further in chapter
three.
1.2.1.3 Adjustable Parameters for an LTP Probe
For a constructed LTP source of any dimension/geometry, the major adjustable
parameters that have an impact on desorption/ionization capabilities include choice and
flow of discharge gas, positioning of the two electrodes, current/voltage applied and the
application of heat. The latter two are intimately related, as increasing the applied power
results in an increase in the plasma temperature via joule heating and leads to increased
thermal desorption capabilities. However, as mentioned in the previous section, the use
of either LTP arrays or larger/wider electrodes is needed to allow voltages high enough to
induce heating without arcing. Adding an additional source of heat is possible and has
been achieved with LTP by either directly heating the sample substrate or heating the

9
gas/plasma flow (which in turn heats the sample substrate). Both methods of heating
yield similar results; however, direct heating of the sample substrate is generally used due
to ease of implementation. Heating the gas/plasma requires a heating element around
either the gas tube entering the LTP probe or directly on the glass tube in which the
plasma is formed (somewhat similar to how heat is applied with DART7). Conversely,
directly heating the sample substrate can be achieved simply with a heat gun placed under
the sample. The effect of heat obviously depends on the temperature the sample substrate
reaches, but as will be shown in chapter two, heating the sample substrate to ~150 °C
leads to signal enhancement of approximately two orders of magnitude for many analytes
as compared to analysis at room temperature. While increased sensitivity is usually a
good thing, having to apply heat is not always practical (e.g. analysis of delicate samples
like human skin or luggage). This is an advantage of LTP over heated sources like FAPA
because LTP’s room temperature nature makes it better suited for delicate samples, while
also enabling it to be battery-operated for portability due to requiring less power.
Discharge gas composition also plays a large role in desorption/ionization
capabilities. Note that the discharge gas flow rate is not crucial as long as it is high
enough to push excited species out of the plasma to the sample but not so high that it
causes unwanted turbulence. Helium is typically chosen as it yields the best sensitivity,
but nitrogen, air, argon, carbon dioxide, and xenon have all been used with LTP-MS as
well. It is not clear why helium is better than other discharge gases, but it is believed to
be related to the fact that helium has much higher excited states (well above 20 eV) than
each of the other gases and can form the necessary reagent ions more efficiently. Wright
et al. have shown that adding 0.9% hydrogen to a helium DBD can result in even further

10
signal enhancement by a factor of 68 from helium alone.22 The use of mixtures of
discharge gases is an area of plasma-based ambient ionization that has not been heavily
investigated but has the potential to positively impact both desorption and ionization
capabilities. In particular, addition of low amounts of a gaseous reagent to enhance
desorption/ionization with an air discharge gas would be beneficial for in field analyses.
Air is an intriguing and greener option that is well-suited for portable instrumentation, but
as will be discussed in chapter three, the sensitivity with an air-LTP with a majority of
analytes is roughly two orders of magnitude worse than for He-LTP.
Electric field is another important parameter that can have an effect on analyte
signal. Harper et al. have shown that increasing the gap between the ground and high
voltage electrodes results in increased analyte fragmentation.10 Adjustment of the high
voltage amplitude and waveform also has a significant impact on both reagent ion
formation as well as creating proper electric fields for ions of a given polarity reaching
the MS inlet. Note that establishing a visible plasma with LTP should allow both
negative and positive ions to be created; however, ions of both polarity do not always
reach the MS inlet. This is believed to be due to positive or negative current/voltage
spikes that vary as function of voltage and/or frequency and may create fields that are
more favorable for ions of one polarity to reach the inlet. The dependence on frequency
is difficult to characterize and will vary with every LTP source as inductance and
capacitance changes. The role of voltage is complicated as well, but, in general, positive
ions seem to reach the MS inlet more efficiently at lower potentials, whereas negative
ions can be detected more efficiently at higher potentials with an overlap where both
polarities reach the MS inlet at intermediate potentials. Various LTP configurations and

11
power supplies may behave differently though. As will be discussed in the next section,
varying the potential has a definite impact on reagent ion formation, which can be
advantageous for LTP-MS of some analytes.
1.2.2 Principles of LTP-MS Analyses
1.2.2.1 Reagent Ions
Plasma-based ambient ionization is generally believed to occur through thermal
desorption of an analyte followed by typical atmospheric-pressure chemical ionization
(APCI) reactions (cf. Figure 1.2). In this sense, plasma-based ambient ionization is only
distinguished from APCI by the fact that ambient plasmas are capable of directly
sampling an analyte from a surface, which is not achieved with a typical APCI setup.
Furthermore, plasma-based ambient ionization and APCI can be further related to
reduced pressure ionization techniques like EI and CI, in that all of the techniques
involve thermal desorption of an analyte followed by ionization in the gas phase at either
atmospheric or reduced pressure. There are three main types of reactions that occur
during LTP ionization (cf. Fig. 1.2), which are proton transfer, electron transfer and
adduct formation. In positive ion mode, protonated water clusters are responsible for the
majority of analyte ionization through proton transfer. Species like N2+, O2
+ and NO+ are
capable of ionizing an analyte via electron transfer, while NH4+ is capable of forming an
analyte ion through the formation of an adduct. In negative ion mode, the various reagent
ions include OH-, O2-, CO3
-, CO4-, NO2
- and NO3-, which combine to form ions through

12
each of the three mechanisms mentioned. As shown in Fig. 1.2, superoxide and nitrate
are capable of electron transfer ionization and adduct formation.
Nitrate and other NOx- species are a good example of ions that are only formed at
certain electric fields. Sekimoto et al. have shown that NOx- species are only formed at
higher electric fields, versus COx- species that are readily formed with lower electric
fields. This has also been observed with LTP, where nitrates are only formed when
larger ac voltages are applied. This is significant because, nitrate plays a large role in the
ionization of various explosives (e.g. RDX) and other analytes through adduct formation.
Some results are discussed in Chapter three, but many explosives will not ionize
efficiently without the presence of nitrate anions. A similar dependence on voltage for
reagent ion formation has not been observed to play a significant role in the positive ion
mode, but variations in LTP background mass spectra can be observed.
1.2.2.2 Analysis of Gaseous, Liquid and Solid Samples
One advantage of plasma-based ambient ionization over spray- and laser-based
methods is the ability to analyze samples from all three states of matter. Gases are the
easiest sample to analyze with LTP-MS, but represent the least interesting samples as no
desorption is required and they could be analyzed by any number of methods. Liquids
can be analyzed with LTP-MS by analyzing either a small aliquot of the bulk solution on
a surface or simply analyzing the bulk solution as shown by Harper et al.10 However,
analyzing small aliquots of the bulk solution will often yield better limits of detection, as
many analytes give higher signal after the spot has dried. Note that drying actually

13
occurs at accelerated rates in a plasma environment at room temperature, which is
believed to be due to electrolysis of the solvent. Solid samples represent a phase of
matter that can be analyzed by LTP-MS and other plasma-based ambient MS methods,
but they are also easily analyzed by spray- and laser-based MS methods. In general, the
latter two methods will be a better choice for the analysis of solids, but lower molecular
weight solids like pesticides and drugs of abuse can also analyzed efficiently with LTP-
MS.
1.2.2.3 Necessity of Tandem MS
Any mass spectrum of ions produced under ambient conditions will be polluted
with numerous peaks from contaminants in solvents, air or from surfaces. The number of
peaks increases when performing an ambient MS experiment in which the unprocessed
sample can be a complex mixture of molecules. In Figure 1.3A, is the full-scan LTP-MS
spectrum in positive ion mode of 160 pg of terbuthylazine from a glass slide. Due to the
overwhelming presence of chemical noise from background ions, there is no observable
peak for terbuthylazine at m/z 230. Unless the relative abundance of the analyte of
interest within the sample is unusually high, it is often necessary to use MS/MS to
increase specificity and the signal-to-noise ratio to confirm the presence of an analyte
peak. The MS/MS spectrum shown in Figure 1.3B was taken on the same terbuthylazine
spot as in Fig. 1.3A; however, the peak at m/z 230 was isolated and fragmented revealing
a characteristic fragment at m/z 174, which corresponds to loss of 2-methylpropene.
Without tandem MS it would not have been possible to confirm the presence of
terbuthylazine in the 160 pg sample and the LOD would be much worse.

14
1.2.2.4 Reactive LTP
Reactive ionization is a process by which an analyte is chemically derivatized to
enhance ionization efficiency or to increase specificity. Reactive ionization has been
achieved with spray-based techniques like DESI,23 where secondary droplets emitted
from a surface contain both analyte and a derivatizing agent and allow the reaction to
occur in the solution phase. This type of reactive ionization is possible with LTP, but it is
dependent on ion-molecule reactions as there is no solvent present to facilitate solution-
phase chemistry. Unfortunately, ion-molecule reactions typically favor proton or electron
transfer since these processes occur at further collision distances than the formation of a
bound complex.24 However, ion-molecule reactions are not impossible and have recently
been demonstrated with LTP.25 In the reactive LTP experiment, one of the reagents was
introduced into the plasma before interacting with another reagent on the surface, which
is preferred over having to place the derivatizing agent on top of the sample surface like a
matrix. While no signal enhancement was claimed, their results prove that reactive
ionization is possible with LTP.
If the ambient ionization process is broken down into two steps, desorption and
ionization, both steps represent an opportunity to uses chemical reactions to enhance the
process. Reactive ionization is commonly practiced with DESI and was also
demonstrated with LTP, but there have been no reports of reactive desorption. As a
spray-based technique, there is not as much need to enhance desorption; however, one
potentially useful application would be if there were reagents that could be added to the
spray to perform an immediate and online digestion of proteins or polymers, which are
often difficult to desorb in a DESI-MS experiment. LTP and other plasma-based

15
ionization methods could also greatly benefit from reactive desorption if it allowed the
detection of more nonvolatile analytes. Reactive desorption with LTP would require an
alternative process to thermal desorption, as it seems impractical to add reagents into the
plasma to increase the temperature at the sample surface. Instead, a type of sputtering
process would need to be induced at a sample surface, like chemical sputtering, where
reactions between excited reagents and a nonvolatile analyte result in the ejection of
analyte fragments into the gas phase. This type of reactive desorption process through
chemical sputtering has been discovered with LTP-MS and is the topic of chapter 5. It is
through the further development of novel chemical sputtering processes that plasma-
based ambient ionization must proceed if their desorption capabilities are to compete with
other ambient ionization methods.

16
1.3 References
1. Fenn, J. B.; Mann, M.; Meng, C. K.; Wong, S. F.; Whitehouse, C. M. Science 1989, 246, 64.
2. Kondrat, R. W.; Cooks, R. G. Anal. Chem. 1978, 50, A81.
3. Horning, E. C.; Horning, M. G.; Carroll, D. I.; Dzidic, I.; Stillwel.Rn Anal. Chem. 1973, 45, 936.
4. Takats, Z.; Wiseman, J. M.; Gologan, B.; Cooks, R. G. Science 2004, 306, 471.
5. Monge, M. E.; Harris, G. A.; Dwivedi, P.; Fernández, F. M. Chem. Rev. 2013, 113, 2269.
6. Hiraoka, K.; Nishidate, K.; Mori, K.; Asakawa, D.; Suzuki, S. Rapid Commun. Mass Spectrom. 2007, 21, 3139.
7. Cody, R. B.; Laramee, J. A.; Durst, H. D. Analytical Chemistry 2005, 77, 2297.
8. Andrade, F. J.; Wetzel, W. C.; Chan, G. C. Y.; Webb, M. R.; Gamez, G.; Ray, S. J.; Hieftje, G. M. Journal of Analytical Atomic Spectrometry 2006, 21, 1175.
9. Ratcliffe, L. V.; Rutten, F. J. M.; Barrett, D. A.; Whitmore, T.; Seymour, D.; Greenwood, C.; Aranda-Gonzalvo, Y.; Robinson, S.; McCoustra, M. Analytical Chemistry 2007, 79, 6094.
10. Harper, J. D.; Charipar, N. A.; Mulligan, C. C.; Zhang, X. R.; Cooks, R. G.; Ouyang, Z. Analytical Chemistry 2008, 80, 9097.
11. Harris, G. A.; Galhena, A. S.; Fernandez, F. M. Analytical Chemistry 2011, 83, 4508.
12. Jackson, A. U.; Garcia-Reyes, J. F.; Harper, J. D.; Wiley, J. S.; Molina-Diaz, A.; Ouyang, Z.; Cooks, R. G. Analyst 2010, 135, 927.
13. Garcia-Reyes, J. F.; Mazzoti, F.; Harper, J. D.; Charipar, N. A.; Oradu, S.; Ouyang, Z.; Sindona, G.; Cooks, R. G. Rapid Communications in Mass Spectrometry 2009, 23, 3057.
14. Zhang, J. I.; Costa, A. B.; Tao, W. A.; Cooks, R. G. Analyst 2011, 136, 3091.
15. Zhang, J. I.; Tao, W. A.; Cooks, R. G. Analytical Chemistry 2011, 83, 4738.
16. Garcia-Reyes, J. F.; Harper, J. D.; Salazar, G. A.; Charipar, N. A.; Ouyang, Z.; Cooks, R. G. Analytical Chemistry 2011, 83, 1084.

17
17. Wiley, J. S.; Garcia-Reyes, J. F.; Harper, J. D.; Charipar, N. A.; Ouyang, Z.; Cooks, R. G. Analyst 2010, 135, 971.
18. Huang, G. M.; Xu, W.; Visbal-Onufrak, M. A.; Ouyang, Z.; Cooks, R. G. Analyst 2010, 135, 705.
19. Dalgleish, J. K.; Hou, K.; Ouyang, Z.; Cooks, R. G. Analytical Letters 2012, 45, 1440.
20. Soparawalla, S.; Tadjimukhamedov, F. K.; Wiley, J. S.; Ouyang, Z.; Cooks, R. G. Analyst 2011, 136, 4392.
21. Dalgleish, J. K.; Wleklinski, M.; Shelley, J. T.; Mulligan, C. C.; Ouyang, Z.; Cooks, R. G. Rapid Communications in Mass Spectrometry 2013, 27, 135.
22. Wright, J. P.; Heywood, M. S.; Thurston, G. K.; Farnsworth, P. B. Journal of the American Society for Mass Spectrometry 2013, 24, 335.
23. Cotte-Rodriguez, I.; Takats, Z.; Talaty, N.; Chen, H. W.; Cooks, R. G. Analytical Chemistry 2005, 77, 6755.
24. Gunawardena, H. P.; He, M.; Chrisman, P. A.; Pitteri, S. J.; Hogan, J. M.; Hodges, B. D. M.; McLuckey, S. A. Journal of the American Chemical Society 2005, 127, 12627.
25. Benassi, M.; Garcia-Reyes, J. F.; Spengler, B. Rapid Communications in Mass Spectrometry 2013, 27, 795.

18
Figure 1.1 Diagram of a typical LTP-MS setup.

19
Figure 1.2 Diagram of LTP-MS experiment showing the overall desorption mechanism that is typically accepted. It involves thermal desorption of an analyte followed by common APCI reactions.

20
Figure 1.3 A) Full-scan LTP-MS and B) LTP-MS/MS of m/z 230 for 80 ppb terbuthylazine (2 µL spot) from a glass slide.

21
CHAPTER 2
SCREENING OF AGROCHEMICALS IN FOODSTUFFS USING LOW-TEMPERATURE PLASMA AMBIENT IONIZATION MASS SPECTROMETRY
2.1 Introduction
Pesticides are an integral part of the modern agricultural industry with over 1,000
different compounds in use as active pest exterminators.1 Their use helps to ensure crop
longevity which leads to greater food production. Pesticide consumption by humans and
wildlife through residue presence in foodstuffs or in the water supply, however, has been
shown to have adverse health effects.2-5 Thus, it is important to detect and quantify trace
levels of pesticides in relevant foodstuffs or water supplies.6, 7 To help establish suitable
constraints, maximum residue levels (MRLs) have been set by the European Union8-11
and United States Environmental Protection Agency (US EPA)12, providing limits for the
amount of a given pesticide in consumables.
Targeted chemical analyses demand rapid, sensitive and specific techniques
capable of detecting analytes in complex matrices. The methodology commonly used for
sub-MRL verification involves either liquid chromatography (LC) or gas chromatography
(GC) coupled with mass spectrometry (MS).13, 14 Typically tandem MS experiments
(LC-MS/MS or GC-MS/MS) are employed to increase structural identification and

22
decrease the chances of reporting false-positives.15, 16 While these techniques have
proven to be successful14, the required sample preparation and chromatographic
separation steps are time-consuming and may be cost-ineffective. Reducing or removing
sample preparation will significantly decrease analysis time and assist in moving the
analysis of complex samples out of the lab and towards automated, in situ protocols.
Some of the most promising techniques for direct, real time analysis are based on new
mass spectrometric methods in which samples are ionized in their native states and
without prior preparation in the ambient environment.17-20
The advantages of ambient desorption ionization mass spectrometry19, 20 have led
to a plethora of diverse ambient desorption ionization sources with many different
ionization and desorption techniques. These ambient desorption ionization sources have
been categorized based upon their proposed desorption and ionization mechanisms.19, 20
Some of the ambient ionization methods have already proven successful in pesticide
residue detection as well as general food safety analysis. Chen et. al. used extractive
electrospray ionization coupled with a hybrid quadrupole time-of-flight (QTOF) mass
spectrometer to monitor fruit and vegetable maturity/quality in a non-invasive manner.21
Jecklin et al. coupled the flowing atmospheric-pressure afterglow (FAPA; a
plasma/thermal desorption ambient ionization method) with a QTOF mass spectrometer
to analyze agrochemicals in juice, fruit peel, and salad leaf matrices achieving low ppb
and sub-nanogram LODs without sample pretreatment.22 Schurek et al. used direct
analysis in real time (DART; combining thermal desorption with energetic species
derived from an atmospheric pressure discharge) coupled with time-of-flight (TOF) MS
as well as desorption electrospray ionization (DESI; droplet/liquid jet/gas impact)

23
coupled with a linear ion trap for the detection of strobilurin residues in wheat at limits of
quantitation lower than or close to MRLs, ranging from 5-30 μg/Kg.23 Most recently,
Garcia-Reyes et al. used DESI-MS/MS with a quadrupole ion trap mass spectrometer for
agrochemical detection from fruit peels and fruit extracts yielding results similar to those
of Jecklin et al, both methods (FAPA and DESI) claiming detection limits as low as the
1-10µg/Kg range for selected multi-class pesticides in fruits and vegetables.24
Among the ambient ionization methods within the thermal desorption category,
which rely on heat to increase signal response19, several employ atmospheric pressure
plasmas including, FAPA25, 26, DART27, desorption atmospheric pressure chemical
ionization (DAPCI)28, plasma-assisted desorption ionization (PADI)29 and dielectric
barrier discharge ionization (DBDI).30 The recently introduced ambient plasma-based
ionization technique, low-temperature plasma (LTP)31, although somewhat similar to
PADI has the key advantage that it permits the analysis of essentially any surface,
regardless of shape or size, due to the probe configuration employed. Analysis of trace
compounds on these solid surfaces as well as in complex matrices32 is possible without
the need for solvents or reagents except the carrier/discharge gas. The desorption
mechanism for LTP is not yet elucidated, however, LTP can operate at room temperature
(~30 °C) while providing sufficient signal, although in some cases signal enhancement is
achieved upon heat.32 An advantage of LTP over some of the other plasma-based
techniques in that there is virtually no damage to the sample from excessive heat.
The current study reports on LTP-MS analysis of various agrochemicals in
different foodstuffs, including LODs in different matrices and some semi-quantitative
determinations. To evaluate the potential of LTP-MS for the proposed analyses, 13

24
compounds belonging to different pesticide categories were selected and spiked into or
onto foodstuff samples such as fruits and vegetables. Analyses were performed via
extracts taken from the sample and direct analysis of the peels. In addition, some of the
pesticides were spiked into water to determine the efficacy of LTP-MS for agrochemical
detection.
2.2 Experimental
2.2.1 Chemicals and Reagents
Pesticide analytical standards were purchased from Dr. Ehrenstorfer GmbH.
(Ausburg, Germany) and from Riedel de Haën, Pestanal® quality (Seelze, Germany).
Individual pesticide stock solutions (200 – 300 µg mL-1) were prepared in methanol and
stored at -20º C. Working solutions were prepared by appropriate dilution with
acetonitrile. A Milli-Q-Plus ultra-pure water system from Millipore (Bedford, MA,
USA) was used to obtain HPLC-grade water. HPLC-grade acetonitrile and methanol
were obtained from Mallinckrodt Baker Inc. (Phillipsburg, NJ, USA). Formic acid was
obtained from Fluka (Buchs, Switzerland). Primary-Secondary Amine (PSA) Bond Elut
was purchased from Varian, Inc. (Palo Alto, CA, USA). Anhydrous magnesium sulfate,
acetic acid and sodium acetate were purchased from Sigma-Aldrich.

25
2.2.2 Samples
Fruit and vegetable samples (oranges, lemons, apples, green peppers,
persimmons, grapefruits tomatoes, pears and grapes samples) were purchased from
different local markets. Two main experiments were performed: 1) Direct LTP-MS
analysis on peels of fruits and vegetables were analyzed without any pre-treatment; and
2) LTP-MS analysis of acetonitrile extracts from a detailed extraction protocol which is
usually used in pesticide testing and follows pesticide residue testing guidelines.
2.2.3 Method of Extraction from Fruits and Vegetables
A common procedure33 (so-called “QuEChERS”, from quick, easy, cheap,
effective, rugged and safe) was used to obtain the acetonitrile extracts used for LTP-MS
analyses. It comprises the following steps: a representative 15 g portion of previously
homogenized sample was weighed in a 200 mL PTFE centrifuge tube. The sample
(fruit/vegetable) was homogenized without any previous treatment or cleaning (i.e.
removal of leaves or rinsing). The homogenization was carried out using a high speed
blender (Ultraturrax). Then 15 mL of acetonitrile were added, and the tube was
vigorously shaken for 1 min. After this time, 1.5 g of NaCl and 6g of MgSO4 were
added, and the shaking process was repeated for 1 min. The extract then was centrifuged
(3700 rpm) for 1 min. 5 mL of the supernatant (acetonitrile phase) was then taken with a
pipette and transferred to a 15 mL graduated centrifuge tube containing 250 mg of
primary secondary amine (PSA) and 750 mg of MgSO4, that was then energetically
shaken for 20 s. The extract was then centrifuged again (3700 rpm) for 1 min. Finally,

26
an extract containing the equivalent of 1 g of sample per mL in 100% acetonitrile was
obtained.
2.2.4 Low-Temperature Plasma Mass Spectrometry
Experiments were performed using a Thermo LTQ linear ion trap mass
spectrometer (Thermo Finnigan San José, CA, USA) tuned for optimum detection of the
precursor ion of interest via the Xcalibur software. LTP-MS analyses were performed in
the positive and negative ion mode and spectra were collected in the automatic gain
control mode with a maximum ion trap injection time of 200 ms and 2 microscans per
spectrum. The main experimental parameters used were as follows: m/z range 150-600;
capillary temperature: 200 ºC; tube lens (V): -65 V; capillary voltage: -15 V. Tandem
mass spectrometry experiments (MS/MS) were performed using collision-induced
dissociation (CID) experiments in order to confirm the presence of particular
agrochemicals in the studied samples. These experiments were performed using an
isolation window of 1.5 (m/z units) and 25-35 % collision energy (manufacturer’s unit).
The MS/MS spectral features of the studied agrochemicals are shown in Table 2.1; the
data are consistent with previous literature on the same compounds using electrospray
mass spectrometry.34
The LTP probe consists of a glass tube (O.D. 6.35 mm and I.D. 3.75 mm) with an
internal grounded electrode (stainless steel, diameter: 1.57mm) centered axially, an outer
electrode (copper tape) surrounding the outside of the tube, and the wall of the glass tube
serving as a dielectric barrier.31 An alternating high voltage, 5 – 10 kV at a frequency of

27
ca. 2.5 kHz, is applied to the outer electrode with the center electrode grounded to
generate the dielectric barrier discharge. The AC voltage was provided by a custom built
power supply with variable frequency and voltage, consuming less than 3 watts of total
power. Helium (flow rate of 0.4 L/min) was used as a discharge gas and to push the
reagent ions over the sample surface as well as transporting analyte ions to the mass
spectrometer. The samples were placed on the sample holder, typically 0.5 cm away
from the LTQ inlet and the LTP probe was placed with its end 4 mm away from the
surface and with an angle of ca. 30° from the sample surface. In addition, each analysis
(except for direct peel analysis) was done with the use of a heat gun (model HG-001VT,
NTE Electronics, 44 Farrand St., Bloomfield, NJ 07003) directly under the sample holder
to increase the temperature of the substrate (to ~150 °C), thereby increasing desorption
capabilities and enhancing signal.
2.2.5 Direct LTP-MS Analyses of Fruit and Vegetable Skins
No sample treatment was required. A piece of ca. 2 cm2 of peel was cut and
exposed to the LTP probe. No heating was used in the direct examination of fruit skins.
2.2.6 LTP-MS Analyses of Fruit and Vegetable Extracts
Sample extracts from the QuEChERS method (3 µL of acetonitrile solution, no
further pre-treatment) were deposited using a micropipette on a microscope glass slide
(beveled micro slides, size 75 x 25 mm, thickness 1 mm, Gold Seal ®, Bencton and
Dinckinson Company, Franklin Lakes, NJ USA) and analyzed by LTP-MS.

28
2.2.7 LTP-MS Analyses of Water Samples
No sample pre-treatment was required. Aliquots (3 µL of each solution) were
deposited using a micropipette on a microscope glass slide and analyzed by LTP-MS.
2.3 Results and Discussion
There are four main analyses that were performed for the purposes of the study.
The first is the analysis of standard solutions spiked with known amounts of
agrochemical compounds to test the analytical performance for each agrochemical with
LTP-MS. Secondly, QuEChERS extracts were spiked with agrochemicals for a proof of
concept and rough comparison with typical LC-MS samples to ensure that LTP-MS is
capable of identifying the compounds of interest in complex food matrices. The third
analysis was performed on unspiked QuEChERS extracts to ensure similar qualitative
performance as compared with LC-MS analyses. Note that concurrent LC-MS analyses
of these same extracts were performed as a reference method but the data was not
displayed. Lastly, and most emphatically, the direct analysis of real unspiked
fruits/vegetables was performed to examine the capability of LTP-MS to perform rapid
analyses with no sample preparation as a possible pre-screening methodology. This last
analysis takes advantage of the key features of LTP-MS and is seen as the most probable
application for in situ measurements.

29
2.3.1 LTP-MS Screening of Agrochemicals in Standard Solutions
Representative product ion MS/MS spectra of the agrochemicals used in this
study can be found in the Supporting Information. (For more information on tandem mass
spectrometry scans see Schwartz et. al.35 ) They were obtained by spotting 3 L of the
sample dissolved in methanol onto a glass slide. As is typical of ambient ionization
sources, soft ionization occurs with the protonated molecule typically being observed as
the unique ion in the positive ion mode. No fragmentation was observed in these
compounds. Table 2.1 shows the structure, molecular weight, most abundant ion in the
full mass scan, and the molecular ion and characteristic fragments (obtained from
MS/MS) for each agrochemical in the study. Improved LODs were obtained using
MS/MS, which is a common situation for complex mixtures. The product ion MS/MS
data also help confirm the presence of particular agrochemicals in the spectrum. Thus, no
full MS spectra are displayed.
Application of heat to the glass substrate bearing the sample was found to
increase signal, due to an increase in vapor pressure of the analyte at higher temperatures
which increases the number of analyte molecules in the gas phase so that they can be
ionized by chemical ionization processes. The signal enhancement due to the use of a
heated substrate has been discussed for LTP by Huang et. al.32 In the current study,
signal was found to be enhanced 10-100 times depending on the compound at a
temperature of 150 °C. Figure 2.1 shows the signal enhancement for the characteristic
fragment at m/z 174 in the MS/MS product ion spectrum of the [M+H]+ for atrazine (m/z
216) which accompanies heating. This thermal enhancement is approximately two
orders of magnitude, from ~11 (a.u.) with no heat to ~1100 (a.u.) with heat.

30
A summary of the basic LTP-MS performance for agrochemical detection coming
from dried standard solution spots along with LODs (determined by S/N = 3) for
different matrices is displayed in Table 2.2. When performing MS/MS experiments, the
LODs of the studied agrochemicals were appropriately low. For example, in the case of
the herbicides ametryn and terbuthylazine, the LOD was 0.1 μg L-1 (0.3 pg absolute),
which is well below the typical MRL of 5 μg L-1 for many pesticides in water (typical
MRLs in food range from 10-500 μg/kg).8 The range of LODs for analyte standards (in
pure solvents) was 0.1- 15 µg L-1 (0.3-45 pg absolute). Most of the compounds tested
showed remarkable sensitivity in LTP-MS approaching that attainable with conventional
direct infusion electrospray MS.
Table 2.2 also displays the results of calibration curves plotted for each of the
agrochemicals. The curves were generated by recording three spectra for each
concentration of a given compound and taking an average of a three second interval of
the most abundant characteristic fragment ions to obtain each data point (each plot
included four data points). Relative standard deviations (RSD) values, not shown,
ranged from 10-30%. However, over 18 months of experience with LTP has shown that
this estimate of 10-30% RSD is likely overly cautious, as the typical range is ca. 10-15%,
and even as low as 8-10% with the use of a three to ten second average. Even with the
large RSD, adequate correlation coefficients (r2) were achieved for each compound,
showing promise for the use of LTP-MS as a semi-quantitative tool. Note the term
‘semi’-quantitative is employed because LTP-MS is not intended to be a true quantitative
method replacing the standard LC-MS approach. Instead, LTP-MS is applicable to pre-
screening and should be complementary to LC-MS. Thus, the calibration curves were

31
performed to show that the true sensitivity is adequate for pre-screening and that a
general trend of linearity is exhibited. The concentrations used in the calibration plots
varied with the analyte and were likely limited by the dynamic range of the ion trap mass
analyzer, which tends to be 103 – 104. Another widely varying parameter was the true
sensitivity (slope of the calibration curve), with the smallest values being ~0.03
counts.ng/mL for compounds like ethoxyquin and imazalil, and the largest being ~30
counts.ng/mL for compounds like ametryn, terbuthylazine and DEET. The data suggest
that the calibration curves are adequate for screening purposes, with a concentration
range over two orders of magnitude and r2 values better than 0.98 in most cases.
2.3.2 LTP-MS Screening of Agrochemicals in Food Extracts
To evaluate the performance of LTP-MS for semi-quantitative screening of
agrochemicals in foodstuffs, different experiments were performed using fruit and
vegetable extracts spiked with known amounts of the studied analytes at concentrations in
the range 0.1 to 100 ppb. Three representative fruits and vegetables in with different
types of matrices were selected for study: tomato (high water content), orange (high acid
content (organic)) and pepper. Interestingly, the LODs in fruit and vegetable extracts
were not much worse than those obtained for standard solutions (see Figure 2.2 for
example MS/MS spectra). LODs of the studied agrochemicals were as low as 0.2 µg kg-1
sample (0.6 pg) for ametryn and terbuthylazine in tomato and ranged from 0.2 - 20 µg kg-
1 sample (0.3-60 pg) for this set of compounds in the presence of the matrices. The
matrix results are slightly higher than those obtained in neat solvent (depending upon the
complexity of the matrix and the MS/MS transition examined). In spite of the large

32
amount of matrix material (including sugar, dyes, etc.), the results for most of the studied
compounds are once again satisfactory for screening purposes. The original acetonitrile
extract contained 1 g/mL of fruit/vegetable. Three µL of extract was spotted onto the
glass slide, which is equivalent to 3 mg of fruit/vegetable sample.
The LOD results are suffice considering they are below MRL regulatory levels for
the studied compounds in fruit and vegetables. The regulations established in each
country vary depending on the pesticide and the agricultural commodity. For instance,
the MRL allowed for fungicides such as thiabendazole, imazalil, prochloraz, and
bitertanol in fruits typically ranges from 1-10 mg kg-1 in Japan, the United States, and
Europe. Other commodity/pesticide combinations of regulated chemicals are typically in
the range of 0.05-1 mg kg-1 per compound.8-11 Bearing this in mind, the proposed
approach fulfills the sensitivity requirements for pesticide testing of authorized
agrochemicals in fruits and vegetables.
2.3.3 Direct LTP-MS Screening of Agrochemicals on Fruit Samples
In addition to extract analysis, direct analysis of fruit peels, without agrochemical
spiking was performed. The detection of imazalil directly from lemon and orange peels
is shown in Figure 2.3 along with its detection in traditional QuEChERS extracts of an
apple and a grapefruit (Figure 2.4). Note that LC-MS analysis of the fruits was
performed for comparison and confirmed that imazalil is the only agrochemical present in
the QuEChERS extracts. This is likely true because, as a fungicide, imazalil is typically
applied to the fruit/vegetable in the final stage of their production. Thus, LTP-MS is an

33
ideal methodology for the direct screening of many fungicides on foodstuffs due to their
presence mainly at the surface, which may easily and directly be analyzed via LTP-MS.
The LTP-MS methodology being explored proves advantageous due to the absence of
sample preparation, no solvent requirements, and no sample destruction. The ionization
process occurred directly on the surface of the peel without having to use any solvent
treatment. LTP-MS could prove to be a useful tool for any industry handling large
quantities of fruit, such as the soft drink or food-packaging companies.
2.3.4 LTP-MS Screening of Agrochemicals in Water
Samples from various lakes, ditches, and bottled water were analyzed via LTP-
MS for the presence of common agrochemicals (atrazine, DEET, and terbuthylazine).
Fortunately for consumers and local residents, samples did not contain detectable
amounts of any of the common agrochemicals. However, to determine if LTP-MS is
capable of detecting the agrochemicals (atrazine, DEET, and terbuthylazine) present at
low-levels, water samples were spiked with the three analytes. A sample MS/MS
spectrum was recorded and displayed in Figure 2.5 for atrazine (1 ppb) and
terbuthylazine (10 ppb). LODs were estimated to be 6 pg (2 ppb) for atrazine and
terbuthylazine and 36 pg (12 ppb) for DEET, using a 3 L sample of solutions of these
three agrochemicals and taking a total time of less than 30 seconds for the measurement.
In the case of atrazine, the LOD is below the maximum contaminant level for drinking
water, established by US EPA.12 Terbuthylazine is considered an organic contaminant by
US EPA although the tolerated concentration has yet to be declared. The present results

34
reveal the potential of LTP-MS for trace detection of agrochemicals in environmental
water samples.
2.4 Conclusions
The current study suggests that LTP-MS could be a significant tool in the field of
agrochemical detection. A large number of agrochemicals can be detected with LODs
below MRL regulations, regardless of the sample being in a solvent or a more complex
matrix. Advantages of LTP-MS over typically-used chromatographic techniques include
a decrease in overall analysis time due to minimal to no sample preparation, as well as
the lack of a need for solvents in which direct analysis of a fruit’s surface may be
analyzed with no destruction. It is not suggested that this or any other ambient ionization
method replace chromatography/mass spectrometry methods as reference methods;
simply that primary field analysis should be possible using the new methods. In terms of
quantitative analyses, the proposed LTP-MS method does not match the performance of
reference chromatography-based methods. However, despite the overall analytical
performance in terms of precision (RSD %), the speed, chemical specificity, detection
limits and satisfactory linear response do suggest its immediate use for trace
agrochemical detection.

35
2.5 References
1. Tomlin, C. The Pesticide Manual-A World Compendium, 13th edn., British Crop Protection Council (BCPC), Hampshire, UK, 2003.
2. Andreotti, G.; Freeman, L. E. B.; Hou, L. F.; Coble, J.; Rusiecki, J.; Hoppin, J. A.; Silverman, D. T.; Alavanja, M. C. R. Int. J. Cancer, 2009, 124, 2495-2500.
3. Fieten, K. B.; Kromhout, H.; Heederik, D.; de Joode, B. V. Am. J. Epidemiol., 2009, 169, 1500-1506.
4. Hirsch-Ernst, K.; Marx-Stolting, P.; Moeller, T.; Pfeil, R.; Banasiak, U. 46th Congress of the European-Societies-of-Toxicology, Dreden, GERMANY, 2009.
5. Saldana, T. M.; Basso, O. Hoppin, J. A.; Baird, D. D.; Knott, C.; Blair, A.; Alavanja, M. C. R.; Sandler, D. P. Diabetes Care, 2007, 30, 529-534.
6. Richardson, S. D. Anal. Chem., 2008, 80, 4373-4402.
7. Richardson, S. D. Anal. Chem., 2007, 79, 4295-4323.
8. Available at: http://www.codexalimentarius.net/mrls/pestdes/jsp/pest_q-e.jsp (accessed March 2009).
9. Available at: http://ec.europa.eu/food/plant/protection/pesticides/regulation_ec_396_2005_en.htm (accessed March 2009)
10. Council Directive of 15 July 1991 (91/414/EEC) concerning the placing ofplant protection products on the market (OJ L 230 19.8.1991).p1.
11. Available at: www.europa.eu.int/comm/food/index_en.htm (accessed March 2009)
12. Available at: www.epa.gov/safewater/contaminants/index.html (accessed March 2009).
13. Fernandez-Alba, A. R. Chromatographic-Mass Spectrometric Food Analysis for Trace Determination of Pesticide Residues, Comprehensive Analytical Chemistry, Vol. XLII; Elsevier, Amsterdam, The Netherlands, 2005.
14... Alder, L.; Greulich, K.; Kempe, G.; Vieth, B. Mass Spectrom. Rev., 2006, 25, 838-865.
15. Soler, C.; Pico, Y. Trends in Analytical Chemistry, 2007, 26, 103-115.
16. Pico, Y.; Blasco, C.; Font, G. Mass Spectrom. Rev., 2004, 23, 45-85.

36
17. Cooks, R. G.; Ouyang, Z.; Takats, Z.; Wiseman, J. M. Science, 2006, 311, 1566-1570.
18. Harris, G. A.; Nyadong, L.; Fernandez, F. M. Analyst, 2008, 133, 1297-1301.
19. Van Berkel, G. J.; Pasilis, S. P.; Ovchinnikova, O. J. Mass Spectrom., 2008, 43, 1161-1180.
20. Venter, A.; Nefliu, M.; Cooks, R. G. Trac-Trends Anal. Chem., 2008, 27, 284-290.
21. Chen, H. W.; Sun, Y. P.; Wortmann, A.; Gu, H. W.; Zenobi, R. Anal. Chem., 2007, 79, 1447-1455.
22. Jecklin, M. C.; Gamez, G.; Touboul, D.; Zenobi, R. Rapid Commun. Mass Spectrom., 2008, 22, 2791-2798.
23. Schurek, J.; Vaclavik, L.; Hooijerink, H.; Lacina, O.; Poustka, J.; Sharman, M.; Caldow, M.; Nielen, M. W. F.; Hajslova, J. Anal. Chem., 2008, 80, 9567-9575.
24. Garcia-Reyes, J. F.; Jackson, A. U.; Molina-Diaz, A.; Cooks, R. G. Anal. Chem., 2009, 81, 820-829.
25. Andrade, F. J.; Shelley, J. T.; Wetzel, W. C.; Webb, M. R.; Gamez, G.; Ray, S. J.; Hieftje, G. M. Anal. Chem., 2008, 80, 2646-2653.
26. Andrade, F. J.; Wetzel, W. C.; Webb, M. R.; Gamez, G.; Ray, S. J.; Hieftje, G. M. Anal. Chem., 2008, 80, 2654-2663.
27. Cody, R. B.; Laramee, J. A.; Durst, H. D. Anal. Chem., 2005, 77, 2297-2302.
28. Takats, Z.; Cotte-Rodriguez, I.; Talaty, N.; Chen, H. W.; Cooks, R. G. Chem. Commun., 2005, 1950-1952.
29. Ratcliffe, L. V.; Rutten, F. J. M.; Barrett, D. A.; Whitemore, T.; Seymour, D.; Greenwood, C.; Aranda-Gonzalvo, Y.; Robinson, S.; McCoustra, M. Anal. Chem., 2007, 79, 6094-6101.
30. Na, N.; Zhao, M.; Zhang, S.; Yang, C.; Zhang, X. J. Am. Soc. Mass Spectrom., 2007, 18, 1859-1862.
31. Harper, J. D.; Charipar, N. A.; Mulligan, C. C.; Zhang, X. R.; Cooks, R. G.; Ouyang, Z. Anal. Chem., 2008, 80, 9097-9104.
32. Huang, G. M.; Ouyang, Z.; Cooks, R. G. Chem. Commun., 2009, 556-558.

37
33. . Anastassiades, M.; Lehotay, S. J.; Stajnbaher, D.; Schenck, F. J. J. AOAC Int., 2003, 86, 412-431.
34. Garcia-Reyes, J. F.; Hernando, M. D.; Ferrer, C.; Molina-Diaz, A.; Fernandez-Alba, A. R. Anal. Chem., 2007, 79, 7308-7323.
35. Schwartz, J. C.; Wade, A. P.; Enke, C. G.; Cooks, R. G. Anal. Chem., 1990, 62, 1809-1818.

38
Table. 2.1 LTP-MS for Trace Analysis of 14 Multi-Class Agrochemicals
Compound Structure Nominal Monoisotopic Mass
Species detected (+/-)
MS/MS
Ametryn 227 [M+H]+ 228 186
Amitraz 293 [M+H]+ 294 163
Atrazine 215 [M+H]+ 216 174
Buprofezin 305 [M+H]+ 306 201; 116
DEET 191 [M+H]+ 192 119 91
Diphenylamine 169 [M+H]+ 170 92
N N
NS
HN
HN
N
N N
N N
NHN
HN
Cl
N
N
S
O N
H3CN
O
CH
CH3
HN

39
Table 2.1, continued
Compound Structure Nominal Monoisotopic Mass
Species detected (+/-)
MS/MS
Ethoxyquin 217 [M+H]+ 218 190; 176
Imazalil 296 [M+H]+ 297 255; 201; 159
Isofenphos-methyl
331 [M+H]+ 332 290; 271; 231
Isoproturon 206 [M+H]+ 207 165;72
Malathion 330 [M+H]+ 331 285; 127
Parathion-ethyl 291 [M+H]+ 292 264; 236
Terbuthylazine 229 [M+H]+ 230 174
HN O
Cl
Cl
O
N
N
O
O
O
P
SHN
O
HN N
O
CH3
CH3
H3C
CH3
O
O
O
O
P
O
SO
S
OP
S
OO
NO2
H3C
H3C
N N
NCl
HN
HN

40
Table 2.2 Analytical Performance of Low-Temperature Plasma Mass Spectrometry (LTP-MS/MS) for the Analysis of Agrochemicals in Fruits and Vegetables
Compound Conc. Range Tested
Calibration Equation
Correl. Coeff.
Limit of detection (LOD)a*
(ng g-1) [y (a.u.), x (ng ml-1)]
r2 LOD Solvent
LOD pepper
LOD orange
LOD tomato
Ametryn 8 – 400 y = 38.1x + 299 0.9797 0.1 ng g-1 (0.3 pg)
0.4 ng g-1 (1.2 pg)
0.4 ng g-1 (1.2 pg)
0.2 ng g-1 (0.6 pg)
Amitraz 1 - 1000 y = 0.335x + 18.2 0.9948 2 ng g-1 (6 pg)
200 ng g-1 600 pg
6.6 ng g-1 (20 pg)
20 ng g-1 (60 pg)
Atrazine 8 - 2000 y = 24.4x - 816 0.9992 0.2 ng g-1 (0.6 pg)
1 ng g-1 (3 pg)
1.5 ng g-1 (4.5 pg)
0.4 ng g-1 (1.2 pg)
Buprofezin 8 – 400 y = 0.425x - 2.56 0.9996 2 ng g-1 (6 pg)
2 ng g-1 (6 pg)
6.6 ng g-1 (20 pg)
2 ng g-1 ( 6 pg)
DEET 8 – 104 y = 52.4x - 914 0.9988 3 ng g-1 (9 pg)
6.6 ng g-1 (20 pg)
15 ng g-1 (45 pg)
15 ng g-1 (45 pg)
Diphenylamine 8 - 2000 y = 0.647x - 9.66 0.9914 8 ng g-1 (24 pg)
6.6 ng g-1 (20 pg)
10 ng g-1 (30 pg)
15 ng g-1 (45 pg)
Ethoxyquin 400 - 2000
y = 0.0345x - 20.7 0.9971 15 ng g-1 (45 pg)
20 ng g-1 (60 pg)
20 ng g-1 (60 pg)
20 ng g-1 (60 pg)
Imazalil 10 – 500 y = 0.0316x + 9.27 1 5 ng g-1 (15 pg)
10 ng g-1 (30 pg)
10 ng g-1 (30 pg)
10 ng g-1 (30 pg)
Isofenphos-methyl
1 – 100 y = 0.899x + 8.47 0.9992 1 ng g-1 (3 pg)
10 ng g-1 (30 pg)
13.3 ng g-1 (40 pg)
20 ng g-1 (60 pg)
Isoproturon 8 – 400 y = 0.729x + 6.73 0.9969 8 ng g-1 (24 pg)
10 ng g-1 (30 pg)
20 ng g-1 (60 pg)
10 ng g-1 (30 pg)
Malathion 80 - 2000 y = 0.0414x + 4.54 0.984 2 ng g-1 (6 pg)
6.6 ng g-1 (20 pg)
20 ng g-1 (60 pg)
5 ng g-1 (15 pg)
Parathion-ethyl 8 - 2000 y = 9.18x + 837 1 0.6 ng g-1 (2 pg)
3 ng g-1 (9 pg)
13.3 ng g-1 (40 pg)
10 ng g-1 (30 pg)
Terbuthylazine 8 - 2000 y = 30.5x - 570 0.9976 0.1 ng g-1 (0.3 pg)
0.66 ng g-1 (2 pg)
0.66 ng g-1 (2 pg)
0.2 ng g-1 (0.6 pg)
a LODs were calculated in MS/MS mode -calculated as S/N = 3- with matrix-matched standards and neat solvent standards. Acetonitrile-based fruit and vegetable extracts from QuEChERS procedure containing 1 g of matrix/mL were analyzed without further treatment. LOD (expressed as ng g-1) were calculated with matrix-matched standards prepared with pepper, orange and tomato using the QuEChERS procedure. 3µL of each matrix-matched standard were deposited on a glass slide and analyzed by LTP-MS/MS

41
Figure 2.1 Comparison of signal for a (a) non-heated substrate versus a (b) heated substrate for the MS/MS spectrum [M+H]+ (m/z 216) of atrazine.
100 150 200 250 300 350 400 450m/z
0
200
400
600
800
1000
0
200
400
600
800
1000
Inte
nsi
ty
173.9
Inte
nsi
ty
173.9
No Heat
Heat
m/z 216
m/z 216
(a)
(b)

42
Figure 2.2 (a) LTP-MS/MS analysis of atrazine in an orange (QuEChERS) extract spiked with 10 µg Kg-1 (MS/MS: m/z 306 201); b) LTP-MS/MS analysis of terbuthylazine in a tomato (QuEChERS) extract spiked with 15 µg Kg-1 (MS/MS: m/z 228 186). The LTP-MS experiments were performed using 3 µL of sample extracts spotted onto the glass substrate heated at 150 °C, with examination by tandem mass spectrometry. Example calibration curves for both analytes are overlaid onto the corresponding spectrum.
100 150 200 250 300 350 400 450
m/z
0
10
20
30
40
50
60
70
80
90
100
Rel
ativ
e A
bu
nd
ance
174.0
198.1
m/z 216
(b)
100 150 200 250 300 350 400 450
m/z
0
10
20
30
40
50
60
70
80
90
100
Rel
ativ
e A
bu
nd
anc
e
174.0
m/z 230
(b)
m/z 216
(a)
y = 30.56x ‐ 570.3R² = 0.9976
‐1.00E+04
0.00E+00
1.00E+04
2.00E+04
3.00E+04
4.00E+04
5.00E+04
6.00E+04
7.00E+04
0 500 1000 1500 2000 2500
Absolute Signal
Concentration (ppb)
Standard Calibration Curve for Terbuthylazine
y = 24.421x ‐ 816.49R² = 0.9992
‐1.00E+04
0.00E+00
1.00E+04
2.00E+04
3.00E+04
4.00E+04
5.00E+04
6.00E+04
0 500 1000 1500 2000 2500
Absolute Signal
Concentration (ppm)
Standard Calibration Curve for Atrazine

43
Figure 2.3 Identification of the fungicide imazalil in unspiked market purchased citrus fruits samples by LTP-MS/MS, (a) orange; (b) lemon. The main characteristic fragment ions of imazalil are: m/z 255, 201, 159, 176 and 109. The analyses were performed directly on the peel of the fruits without the use of heat using standard LTP-MS without substrate.
100 120 140 160 180 200 220 240 260 280 300m/z
0
50
100
Re
lati
ve
Ab
un
da
nc
e
255.0
201.0
159.0
176.2 297.00
m/z 297
(b)
100 120 140 160 180 200 220 240 260 280 300m/z
0
50
100
Re
lati
ve
Ab
un
da
nc
e
255.1
201.0
159.1176.1
185.1109.2
297.0
m/z 297
(a)

44
Figure 2.4 Analysis of real unspiked fruit samples by LTP-MS/MS (after sample extraction with QuEChERS protocol); (a) LTP-MS/MS analysis of an apple extract where imazalil was detected (0.28 mg Kg-1 by LC-MS analysis); (b) LTP-MS/MS analysis of a grapefruit extract where imazalil was detected (0.12 mg Kg-1 by LC-MS analysis). The LTP-MS experiments were performed using 3 µL of sample extracts spotted onto the glass substrate heated at 150 °C, with examination by tandem mass spectrometry.
(a)
100 120 140 160 180 200 220 240 260 280 300m/z
0
50
100
Re
lati
ve
Ab
un
da
nc
e
255.1
201.0
159.1176.1
109.2 297.1
100 120 140 160 180 200 220 240 260 280 300m/z
0
50
100
Re
lati
ve
Ab
un
da
nc
e
255.1
201.0
176.1
159.1
109.2297.1
(b)
m/z 297
m/z 297

45
Figure 2.5 Detection of selected herbicides spiked into environmental water samples by LTP-MS/MS. (a) Detection of atrazine (spiking level: 1 µg L-1) in an aqueous solution (MS/MS: m/z 216 174); (b) Detection of terbuthylazine (spiking level: 10 µg L-1) in aqueous solution (MS/MS: m/z 230 174). The LTP-MS experiments were performed using 3 µL of the water sample (without any sample preparation) spotted onto the glass substrate heated at 150 °C, with examination by tandem mass spectrometry.
m/z 230
80 100 120 140 160 180 200 220m/z
0
50
100
Re
lati
ve
Ab
un
da
nc
e
173.9 (b)
m/z 216(a)
60 80 100 120 140 160 180 200 220m/z
0
50
100
Re
lati
ve
Ab
un
da
nc
e
174.0
197.1
103.0 117.1
131.0

46
CHAPTER 3
HANDHELD LOW-TEMPERATURE PLASMA PROBE FOR PORTABLE “POINT-AND-SHOOT” AMBIENT MASS SPECTROMETRY
3.1 Introduction
Miniaturization of analytical instrumentation for portability and field-applicability
has been an area of interest in many areas of science. A common hurdle for the
development of portable instrumentation is the ability to maintain adequate analytical
performance with a more compact and potentially less sophisticated device. Techniques
such as Raman spectroscopy1 and X-Ray fluorescence (XRF)2 have been shown to
overcome many of the hurdles of portability and are commonly used in the field. One
aspect of maintaining appropriate analytical performance with any technique pertains to
the ability to present the sample to the instrument so it can be efficiently and effectively
probed. Methods such as attenuated total reflectance for IR absorption spectroscopy3 and
laser-induced breakdown spectroscopy (LIBS)4 for atomic emission spectroscopy have
substantially simplified the sampling process and proven useful for portable
instrumentation.
Of the many portable analytical instrumentations available, none possess the
ability to provide a measurement as specific, sensitive and broadly applicable as mass
spectrometry (MS), which can be accentuated with tandem MS to expand capabilities for

47
complex-mixture analysis. An intriguing approach to sample collection and introduction
is through ambient MS, which incorporates direct sampling and desorption/ionization
from a sample in its native environment in one step. While initially a difficult task,
miniature MS instruments now have the ability to introduce ions formed in the ambient
environment into the reduced-pressure mass analyzer by limiting ion introduction to a
short period of time via a discontinuous atmospheric-pressure interface (DAPI).5 Using
DAPI, the coupling of ambient ionization methods with a miniature mass spectrometer
enables rapid, in situ analysis of complex mixtures without sample pretreatment;6,7
however, this coupling has mostly been achieved in the laboratory setting due to the lack
of true source portability. While many of the ambient ionization methods have shown
impressive performance and simplification of procedure, they are often bulky when
considering the gases, solvents, electrical power and/or solvent pumps that are needed for
operation. This limits the possibility of size reduction as well as increasing setup time.
For example, desorption electrospray ionization (DESI)8 requires a syringe pump for
solvent flow as well as gas flow rates of approximately 1 L/min,. There also exist
ambient ionization sources based on lasers,9-11 which currently are not portable but have
been demonstrated to desorb viruses, bacteria and blood cells for MS analysis12 and can
be combined with electrospray ionization (ESI) for increased ionization efficiency.13
Consequently, there is still a need for a handheld and portable device with the ability to
easily interrogate surfaces.
Of the many ambient ionization sources,14 only a few exhibit the properties
necessary for complete portability. One technique that is easily made portable is paper-
spray ionization,15 which requires triangular pieces of paper to deposit each sample on,

48
solvent, and a power supply providing ~3.5 kV. A similar technique to paper spray has
utilized wooden toothpicks instead of paper, making it easier to sample from some
surfaces, and is a promising technique for forensic investigations.16 A modified version
of DESI, Venturi easy ambient sonic-spray ionization (V-EASI),17 can also be made
portable because a syringe pump is not required and canned air can be used to supply the
nebulizing gas.18
Plasma-based ambient ionization techniques are an intriguing approach for
portability due to their inherent lack of solvent and generated waste, as well as the ability
to change the discharge gas composition for increased desorption/ionization
capabilities.19,20 Plasma assisted desorption/ionization (PADI)21 is a technique that has
been demonstrated as a potentially portable ambient ionization source without the need of
a pressurized gas.22 Another plasma-based approach that meets all of the requirements
for portability is low-temperature plasma (LTP) ambient ionization, based on a room-
temperature dielectric barrier discharge.23 The ability of LTP to operate at gas flow rates
below 100 mL/min with powers less than one Watt, allows the plasma to be powered by
small batteries along with a miniature helium tank. No solvents or liquid/gas pumps are
necessary. In addition, the ability to directly analyze solid, liquid and gaseous samples
with LTP-MS allows for a wide variety of applications.23-25
Here, we present the development and application of the first handheld and
wireless LTP source for point-and-shoot analyses on both bench-top and miniature mass
spectrometers. A major benefit of the handheld LTP source pertains to the reduced setup
time and its ease of use. The entire source, including consumables such as helium and
power, is enclosed in a handheld device weighing ~0.9 kg. Various samples have been

49
analyzed to compare the analytical performance of the handheld source to the LTP source
described by Harper et al.23 as well as the effects of helium versus air as the discharge
gas. A long-distance ion transport interface from the sampling region to the MS inlet has
demonstrated the ability to analyze samples at locations that are non-proximate to the
mass spectrometer.
3.2 Experimental
3.2.1 Chemicals and Reagents
Pesticide analytical standards were purchased from Dr. Ehrenstorfer GmbH.
(Ausburg, Germany) and from Riedel de Haën, Pestanal® quality (Seelze, Germany).
Analytical standards of explosives were purchased from Cerilliant Corporation (Round
Rock, Texas). Individual pesticide and explosive stock solutions (200 – 300 µg mL-1)
were prepared in methanol and stored at -20 °C. Working solutions were prepared by
appropriate dilution with acetonitrile. A Milli-Q-Plus ultra-pure water system from
Millipore (Bedford, MA, USA) was used to obtain HPLC-grade water. HPLC-grade
acetonitrile and methanol were obtained from Mallinckrodt Baker Inc. (Phillipsburg, NJ,
USA).
3.2.2 Handheld Low-Temperature Plasma Ion Source
The handheld LTP source consisted of a battery-powered circuit, a glass tube for
plasma formation, a miniature helium cylinder with a regulator (49615HeK, Leland
Limited Inc., South Plainfield, NJ, USA), and a plastic housing (A9056208, OKW

50
Enclosures, Inc., Bridgeville, PA, USA). The circuit, converting a low, DC potential to a
high, AC potential, is discussed in greater detail in the ‘Results and Discussion’ section.
Parts used for the circuit consisted of an N-channel MOSFET (497-2758-5-ND, Digi-key,
Thief River Falls, MN, USA), 555 timer (497-1963-5-ND, Digi-key, Thief River Falls,
MN, USA), 6-volt regulator (497-1444-5-ND, Digi-key, Thief River Falls, MN, USA),
step-up transformer (28K077, Information Unlimited, Amherst, NJ, USA) and a 7.4-volt,
900 mAh lithium polymer battery (Tenergy Corp., Fremont, CA, USA). The entire
source cost less than $290 USD in parts, which included $198 USD for the gas regulator.
The actual LTP probe used was a smaller version of the one reported previously.23
A 1/16” Swagelok® tee was used to connect a 1.6-mm o.d. PEEK® gas line, a
borosilicate capillary (1.6 mm o.d., 0.86 mm i.d.) and a grounded stainless-steel wire (32
AWG) that is coaxially positioned inside the glass capillary. The gas line contains an
additional 1-cm long piece of PEEK® capillary (100 µm i.d., 1.6 mm o.d.) to restrict He
flow to the plasma to extend the lifetime of the miniature He cylinder; the flow rate could
be controlled by adjusting the outlet pressure on the helium regulator. The high-voltage
electrode on the outside of the glass tube consisted of a coiled and soldered wire
(approximately 2 mm in width) and was positioned such that the internal grounded wire
terminated in the center of the external electrode. The external electrode was connected
to the high-voltage output from the secondary winding of the transformer. A mechanical
trigger connected to the positive terminal of the battery completed the circuit and, along
with the flow of either He or air as the discharge gas, enabled plasma formation. It is
important to note that when air was used as the discharge gas in these studies, it was
typically supplied by a large cylinder of compressed air. However, a small diaphragm

51
pump (NMP015M, KNF Neuberger, Inc., Trenton, NJ, USA) can also be used to supply
flowing air to the plasma region by supplying 6 volts (regulated) from the battery, but the
pump greatly increased power consumption and was not used in these studies to conserve
battery power. This small pump adds minimal weight (65 g) and size to the device while
providing sufficient air flow to sustain the discharge.
3.2.3 Benchtop Mass Spectrometer
Initial experiments were performed using a benchtop Thermo LTQ linear ion trap
mass spectrometer (Thermo Finnigan San José, CA) tuned for optimum detection of the
precursor ion of interest via the Xcalibur software. LTP-MS analyses were performed in
the positive- and negative-ionization mode, making no changes to the source including
the applied voltage, and spectra were collected with automatic gain control enabled, a
maximum ion-trap injection time of 200 ms, and 2 microscans per spectrum. The main
experimental parameters used were as follows: capillary temperature: 200 ºC; tube lens: -
65 V; capillary voltage: -15 V. Tandem mass spectrometry experiments (MS/MS) were
performed via collision-induced dissociation (CID) in order to confirm the presence of
particular agrochemicals in the studied samples. These experiments were performed
using an isolation window of 1.5 Th and 25 - 35% collision energy (manufacturer’s
scale). Long-distance ion transport was achieved with a direct connection of a one-
meter-long Tygon® tube (1/8” o.d. and 1/16” i.d.) to the LTQ inlet capillary, which
pulled ions to the LTQ from a Tygon® and Teflon® sampling vessel that enclosed the
LTP sampling region when placed flush with a sample.

52
3.2.4 Miniature Mass Spectrometer
Experiments on a miniature mass spectrometer were performed using a Mini 10.5
mass spectrometer as described by Gao et. al.5 Key features include the use of a
rectilinear ion trap (RIT), TPD011 hybrid turbomolecular pump (Pfeiffer Vacuum Inc.,
Nashua, NH), a two-stage diaphragm roughing pump (KNF Neuberger Inc., Trenton, NJ),
and a discontinuous atmospheric pressure interface (DAPI) all combined as a compact
device weighing ~10 kg and consuming less than 75 W. The DAPI consisted of a pinch
valve (390NC24330, ASCO Valve Inc., Florham Park, NJ) surrounding conductive
tubing (i.d. of 1.6 mm., an o.d. of 3.2 mm., and a length of 5.0 cm), which was connected
to two capillaries. A transfer capillary (i.d. 1 mm, o.d. 1.6 mm, 5 cm length) was
connected via Swagelok® fittings to allow direct injection of ions into the RIT while the
sampling capillary (i.d. 250 µm, o.d. 1.6 mm, 10 cm length) was filed to a point and
exposed to atmosphere. Upon application of a variable 5 V pulse from the Mini 10.5, the
pinch valve would open for a short period of time, which allowed packets of air/ions from
atmosphere to enter the ion trap. Mini 10.5 operating conditions include: 15 ms DAPI
open time, m/z 50 – 500 mass range, grounded and non-heated inlet capillary. MS/MS
was performed via notch broadband isolation and resonant excitation of the selected ion.

53
3.3 Results and Discussion
3.3.1 Specifications of Handheld LTP
A diagram of the handheld LTP probe is shown in Figure 3.1a with a photograph
shown in Figure 3.1c. The overall weight of the handheld source is 910 g, which reduces
to ~280 g when air is used as the discharge gas due to the replacement of the helium
cylinder and regulator by a diaphragm pump. The cost of parts for the entire source is
quite inexpensive, with most of the cost due to the regulator, and easy to assemble. The
incorporation of a PEEK® flow restrictor reduced helium flow rates to 100 mL/min or
less, depending on the back pressure supplied by the regulator. With this configuration
and a back pressure of ~70 kPa, there was sufficient helium in the cylinder to sustain the
plasma for over 8 hours. In addition, the simple, battery-operated power supply, (shown
in Figure 3.1b) was able to power the plasma with ~2 kVp-p at 100 kHz for over two
hours continuously. It should be noted that the total time of operation of the source in the
field is much longer, considering the power supply is only triggered on when needed; the
helium supply may be turned off while not in use for a prolonged lifetime as well,
typically lasting 8 – 10 hours before requiring a battery recharge or new helium cylinder.
The circuit utilized a 7.4-V, 900 mAh Li-polymer battery, which was down-regulated to 6
V for circuit stability by a voltage regulator. The constant 6-V output was applied to one
lead of the primary winding of a transformer as well as a 555 timer. The output of the
555 timer, which was wired in an astable configuration with a repetition rate of ~100 kHz
with 50% duty cycle, was connected to the gate of an N-channel MOSFET. The drain of
the MOSFET was connected to the other lead on the primary winding of the transformer,

54
while the source of the transistor was held at ground. One end of the secondary winding
provided the high-voltage AC waveform for the LTP, while the other was grounded.
Even though the input to the transformer was a square wave, the circuit behaves as
resonant LC circuit, so the output closely resembles a sine wave.
3.3.2 Handheld LTP Testing on Benchtop MS
3.3.2.1 Tablet Analysis
The performance of the handheld LTP probe was characterized through various
applications on a conventional benchtop ion-trap instrument. Pharmaceutical tablet
analysis has been a targeted application for ambient MS analysis since the onset of the
field,22,26-29 acting as a demonstration of direct sample analysis with no preparation.
Figure 3.2 shows mass spectra recorded for the direct analysis of a headache relief tablet
with handheld LTP-MS (acquired with a Thermo LTQ). The spectra reveal the three
active ingredients: caffeine, acetaminophen and aspirin. In the positive-ion mode (c.f.
Figure 3.2a), the ion [M+H]+ , where M indicates an intact molecule, was detected for all
three compounds at 195 Th for caffeine, 152 Th for acetaminophen and 181 Th for
aspirin (not labeled). Numerous adduct and fragment peaks were also evident, especially
for aspirin. The same experiment was also done in the negative-ionization mode, without
changing any of the ion-source settings. Analysis of the tablet in the negative-ion mode
revealed a small peak for the proton-abstraction ion, [M-H]-, of aspirin at m/z 179 as well

55
as a fragment ion at m/z 137, [M-H-C2H
2O]-, as the most abundant peak (c.f. Figure
3.2b). No negative ions were detected for acetaminophen or caffeine because of their
high gas-phase basicities. The assignments of each of the detected species were verified
with MS/MS.
3.3.2.2 Large-Scale vs. Handheld LTP
One important metric of the handheld, portable version of the LTP probe is how
well it compares with the large-scale LTP probe. The conditions used for the handheld
and large-scale probes are listed in Table 3.1. Note that the conditions for the large-scale
LTP probe were the same as those used in the original optimization experiments.23 The
large-scale LTP source was operated with a lower-frequency voltage waveform,
increased voltage/power, increased helium flow rates and within a larger diameter glass
tube in comparison to the handheld LTP probe. Figure 3.3 displays MS/MS data
recorded for a common agrochemical, atrazine (24 pg, absolute on SURFACE) using the
large-scale (Figure 3.3a) and handheld (Figure 3.3b) LTP with a Thermo LTQ. The
fragmentation observed is due to propene loss from [M+H]+.
Using optimized conditions for each probe on the same MS instruments, the
absolute signal was slightly larger with the handheld LTP probe as was the S/N which
was ~22 for the handheld probe and ~16 for the large-scale probe. This trend was also
true for most other analytes when comparing the two sources. Of the eleven

56
agrochemicals analyzed, LODs ranged from essentially identical to about an order of
magnitude better with the handheld LTP source (c.f. Table 3.2). While the small
discrepancies in LODs between the large-scale and handheld LTP source could be
attributed to various instrumental and operating parameters, including gas-flow profile,
source-to-sample orientation, detector efficiency, it is clear that reducing the power and
helium flow for the handheld LTP setup did not negatively affect the analytical
performance.
3.3.2.3 Effect of Discharge Gas: Air vs. Helium
Another capability of the handheld LTP probe includes the use of either helium or
simply air as discharge gas. To remain consistent in comparing the use of an air and a
helium discharge, similar voltages were used for each gas, which included the use of the
same PEEK® flow restrictor and a large cylinder with a back pressure of 140 kPa. It
should be noted that while the voltage was held constant for the helium and air plasmas,
the current was not, resulting in different currents/powers for the two discharges. Figures
3.4a and 3.4b show tandem mass spectra using a handheld LTP with a Thermo LTQ for
the detection of 1.2 ng of the agrochemical isoproturon obtained with helium and air,
respectively, as the discharge gas, revealing fragments at 72 and 165 Th. Interestingly,
the signal was between one and two times higher with helium as compared to air. The
LODs obtained for the analysis of other agrochemicals that readily undergo proton
transfer (c.f. Table 3.2), were typically 1 – 2 orders of magnitude better with a helium

57
LTP. Trinitrotoluene (TNT) was a unique example where no analyte ions were detected
with air LTP, despite being able to readily detect analyte ions with helium LTP. This
phenomenon is attributed to the fact that TNT ionizes by a different mechanism, either
deprotonation or electron attachment, than the eleven pesticides that favor protonation.
The use of air establishes a difference in the LTP sampling region, so that neither
ionization mechanism can take place for TNT. This point is further evidenced in Figures
3.4c and 3.4d, where there is much less chemical noise in the negative ion mode when
using air-based LTP. It has been seen in other studies that the use of helium as a
discharge gas for LTP often produces an abundance of background ions as compared to a
nitrogen- or air-based LTP,23 likely due to excited states of helium exceeding 19 eV
capable of ionizing a greater range of species.
Examples of cases where the analytical performance was similar when either air
or helium was used as the discharge gas includes the analysis of explosives that readily
undergo nitrate adduction, as with RDX, PETN and tetryl. In Figure 3.4, the analysis of
200 pg of RDX with both plasma gases in the handheld LTP revealed the [M+NO3]-
adduct at m/z 284 (cf. Figures 3.4c and 3.4d) using a Thermo LTQ. The signal for RDX
was higher when helium was used, but the ratio of the signal to the surrounding chemical
noise was much poorer. Overall, the detection limits (c.f. Table 3.2) are roughly the same
for air and helium discharges for explosives which undergo nitrate addition. In general,
helium is the appropriate choice for achieving better LODs for most samples, unless

58
nitrate addition is expected. The ability of both helium and air plasmas to generate NO3
-
and higher-order nitrate clusters in large abundance in the ambient air from N2 and O
2
allows sufficient adduct formation with appropriate analytes. However, the reason for
reduced sensitivity with air versus helium for proton transfer ionization is unclear, but is
likely due to a difference in reagent ion formation with the different discharge gas
compositions.
3.3.3 Handheld LTP on Mini 10.5 MS
The coupling of handheld LTP with a miniature mass spectrometer results in a
completely field-portable instrument, capable of analyzing gaseous, liquid and solid
samples in their native, ambient environment. The process of minimizing helium and
power consumption in comparison to large-scale LTP has led to other benefits. The
decreased voltage for operation of the source reduced the radiated AC noise which has
adverse effects on the MS instrumentation as observed with previous versions of the LTP.
In addition, lower helium flow rates also helped when coupling the source to a Mini MS
which has limited pumping capacity because the performance of the small
turbomolecular pumps degrades when helium is being pumped. This phenomenon has
required the use of supplemental pumping in the past,30 which was not needed for
coupling of the handheld LTP with the Mini 10.5 MS.

59
An MS/MS spectrum for 1.2 ng of malathion on the Mini 10.5 (c.f. Figure 3.5)
reveals the expected loss of ethanol. Tandem mass spectra for malathion and other
pesticides were used in determining LODs for handheld LTP on the miniature instrument.
Absolute quantities within an order of magnitude of a few nanograms could confidently
be detected for all of the agrochemicals and produced adequate signal for the qualitative
assessments often desired for in situ experiments. The Mini 10.5 instrument did not have
the ability to detect negative ions, so explosives were not analyzed.
Another potential compound class of interest for detection by a portable
instrument is drugs of abuse. The detection of illicit drugs with the large-scale LTP on a
benchtop instrument has been demonstrated,24 with LODs in the range of picograms to
nanograms, absolute. In the current study, the ability to detect a drug directly from an
individual’s finger after a few hours after exposure was tested. A small amount, 1 µg, of
methamphetamine was deposited onto a human finger and analyzed two hours after
application with handheld LTP-Mini 10.5 MS/MS. The subject was allowed to perform
daily tasks with his hands as usual for the two hours. It should be noted that, the subject
did not wash his hands between the time of spotting the drug and analysis. The spectrum
in Figure 3.6 was obtained by direct analysis of the finger with the handheld LTP probe,
revealing the presence of methamphetamine with the [M+H]+ and characteristic fragment
ions present at 150 and 119 Th respectively. The non-destructive and room-temperature
nature of the handheld LTP allows analysis of delicate samples, such as human skin,
without damage or discomfort.

60
3.3.4 Long-Distance Ion Transfer
To demonstrate the most likely way a handheld ambient ionization source would
be used in the field, a long-distance ion transfer system was implemented to help
transport ions from non-proximate sampling regions to the MS inlet. Similar designs
have been reported by Cotte-Rodriguez et al. for non-proximate detection with DESI31
and by Garimella et al., where simulations and experimental results demonstrated that
plastic tubing allows effective transfer of ions produced by DESI and LTP for distances
over one meter.32 This simple system, diagrammatically shown in Figure 3.7a, consisted
of a large Tygon® and Teflon® vessel, which can be placed flush with a sample surface,
allowing interaction of excited species from the LTP with the sample in a fixed geometry.
The ions/neutral species were then transferred to the MS inlet via a flexible one-meter-
long Tygon® tube. Laminar flow is established 1 cm into the tube, so any reasonable
bends in the tube had little effect on signal. The vacuum within the Thermo LTQ created
the suction necessary to pull the ions/neutrals to the MS inlet. This setup was tested on
the commercial bench-top Thermo LTQ. Cocaine, highly prevalent on United States
banknotes,33 was detected on an untreated U.S. one dollar bill using tandem MS (Figure
3.7b). The expected loss of benzoic acid yields the base peak at 182 Th from the parent
[M+H]+ ion at 304 Th. Figure 3.7c is the resulting mass spectrum from the analysis of 10
µg of RDX on a glass microscope slide. Again, the [M+NO3]- ion was present at m/z
284. With the current setup, around two orders of magnitude of signal loss was

61
experienced and remains an area of future work as well as the implementation of long-
distance ion transport on miniature MS instruments.
3.4 Conclusions
A handheld low-temperature plasma probe has been developed for both miniature
and bench-top MS applications. Despite using lower power and helium flow rates in
comparison to a conventional, large-scale LTP, there was no loss in analytical
performance with the handheld LTP-MS setup. While helium was typically used as the
discharge gas, due to typically obtaining better LODs, air was also effective for many
analytes. When using air, the weight of the handheld source was ~280 g, with electrical
current from a 7.4 Li-polymer battery being the only consumable. When coupled with a
Mini 10.5 MS, LODs at the nanogram level were achieved for various agrochemicals as
well as the ability to directly detect methamphetamine from skin; however, the desorption
capabilities of plasma sources inherently limit the methodologies to lower molecular
weight analytes. The demonstration of long-distance ion transfer with the handheld LTP
and a flexible transfer line has shown the potential for point-and-shoot analysis with a
free range of motion about the MS instrument.

62
3.5 References
1. Sutherland, W. S.; Alarie, J. P.; Stokes, D. L.; Vodinh, T. Instrum. Sci. Technol. 1994, 22, 231.
2. Karttunen, J. O.; Evans, H. B.; Niemann, R. L.; Henderson, D. J.; Markovic.Pj Anal. Chem. 1964, 36, 1277.
3. Harrick, N. J. J. Phys. Chem. 1960, 64, 1110.
4. Debrasguedon, J.; Liodec, N. C.R. Hebd. Acad. Sci. 1963, 257, 3336.
5. Gao, L.; Cooks, R. G.; Ouyang, Z. Anal. Chem. 2008, 80, 4026.
6. Sanders, N. L.; Kothari, S.; Huang, G.; Salazar, G.; Cooks, R. G. Anal. Chem. 2010, 82, 5313.
7. Sokol, E.; Noll, R. J.; Cooks, R. G.; Beegle, L. W.; Kim, H. I.; Kanik, I. Int. J. Mass Spetrom. 2011, 306, 187.
8. Takats, Z.; Wiseman, J. M.; Gologan, B.; Cooks, R. G. Science 2004, 306, 471.
9. Brady, J. J.; Judge, E. J.; Levis, R. J. Rapid Commun. Mass Spectrom. 2009, 23, 3151.
10. Nemes, P.; Vertes, A. Anal. Chem. 2007, 79, 8098.
11. Shelley, J. T.; Ray, S. J.; Hieftje, G. M. Anal. Chem. 2008, 80, 8308.
12. Peng, W. P.; Yang, Y. C.; Kang, M. W.; Tzeng, Y. K.; Nie, Z. X.; Chang, H. C.; Chang, W.; Chen, C. H. Angew. Chem. Int. Ed. 2006, 45, 1423.
13. Rezenom, Y. H.; Dong, J.; Murray, K. K. Analyst 2008, 133, 226.
14. Monge, M. E.; Harris, G. A.; Dwivedi, P.; Fernández, F. M. Chemical Reviews 2013, 113, 2269.
15. Wang, H.; Liu, J.; Cooks, R. G.; Ouyang, Z. Angew. Chem.-Int. Edit. 2010, 49, 877.

63
16. Hu, B.; So, P. K.; Chen, H. W.; Yao, Z. P. Anal. Chem. 2011, 83, 8201.
17. Santos, V. G.; Regiani, T.; Dias, F. F. G.; Romao, W.; Jara, J. L. P.; Klitzke, C. F.; Coelho, F.; Eberlins, M. N. Anal. Chem. 2011, 83, 1375.
18. Schwab, N. V.; Porcari, A. M.; Coelho, M. B.; Schmidt, E. M.; Jara, J. L.; Visentainer, J. V.; Eberlin, M. N. Analyst 2012, 137, 2537.
19. Heywood, M. S.; Taylor, N.; Farnsworth, P. B. Anal. Chem. 2011, 83, 6493.
20. Wright, J. P.; Heywood, M. S.; Thurston, G. K.; Farnsworth, P. B. J. Am. Soc. Mass. Spectrom. 2013, 24, 335.
21. Ratcliffe, L. V.; Rutten, F. J. M.; Barrett, D. A.; Whitmore, T.; Seymour, D.; Greenwood, C.; Aranda-Gonzalvo, Y.; Robinson, S.; McCoustra, M. Anal. Chem. 2007, 79, 6094.
22. Bowfield, A.; Barrett, D. A.; Alexander, M. R.; Ortori, C. A.; Rutten, F. M.; Salter, T. L.; Gilmore, I. S.; Bradley, J. W. Rev. Sci. Instrum. 2012, 83, 063503.
23. Harper, J. D.; Charipar, N. A.; Mulligan, C. C.; Zhang, X. R.; Cooks, R. G.; Ouyang, Z. Anal. Chem. 2008, 80, 9097.
24. Jackson, A. U.; Garcia-Reyes, J. F.; Harper, J. D.; Wiley, J. S.; Molina-Diaz, A.; Ouyang, Z.; Cooks, R. G. Analyst 2010, 135, 927.
25. Zhang, Y.; Ma, X.; Zhang, S.; Yang, C.; Ouyang, Z.; Zhang, X. Analyst 2009, 134, 176.
26. Chen, H. W.; Talaty, N. N.; Takats, Z.; Cooks, R. G. Anal. Chem. 2005, 77, 6915.
27. Green, F. M.; Salter, T. L.; Stokes, P.; Gilmore, I. S.; O'Connor, G. Surf. Interface Anal. 2010, 42, 347.
28. Steeb, J.; Galhena, A. S.; Nyadong, L.; Facundo, J. J.; Fernandez, M. Chem. Commun. 2009, 4699.

64
29. Williams, J. P.; Scrivens, J. H. Rapid Commun. Mass Spectrom. 2005, 19, 3643.
30. Huang, G.; Xu, W.; Visbal-Onufrak, M. A.; Ouyang, Z.; Cooks, R. G. Analyst 2010, 135, 705.
31. Cotte-Rodriguez, I.; Mulligan, C. C.; Cooks, G. Anal. Chem. 2007, 79, 7069.
32. Garimella, S.; Xu, W.; Huang, G.; Harper, J. D.; Cooks, R. G.; Ouyang, Z. J. Mass Spectrom. 2012, 47, 201.
33. Armenta, S.; de la Guardia, M. Trac-Trend Anal. Chem. 2008, 27, 344.

65
Table 3.1 Specifications of handheld LTP versus large-scale LTP.
Handheld LTP Large-Scale LTP Frequency 100 kHz 2.8 kHz Voltage ~2 kV 5 – 15 kV Gas Flow <100 mL/min ~400 mL/min Weight 0.910 kg *~67 kg Probe O. D. 1.5 mm 6.35 mm Probe I. D. 0.86 mm 3.75 mm *Weight includes LTP source, function generator, DC power
supply, gas regulator and a 6.9 kL helium gas cylinder

66
Table 3.2 Limits of detection for various analytes with handheld and large-scale LTP-MS/MS with air and helium discharge gases.
LODs* (ng)
Analyte Category
Analyte Air
Handheld LTP
He Handheld
LTP
He Large-Scale LTP
He Handheld LTP/Mini MS
Pesticides Amitraz 0.3 0.05 0.8 50 Atrazine 0.01 0.003 0.005 0.1 Buprofezin 0.2 0.004 0.04 0.2 DEET 0.2 0.04 0.003 0.6 Diphenylamine 0.6 0.04 0.07 0.2 Ethoxyquin 300 0.9 8 30 Isofenphos-methyl 6 0.09 1 10 Isoproturon 0.7 0.04 0.2 6 Malathion 5 0.2 0.7 1 Paration-ethyl 0.2 0.05 0.01 200 Terbuthylazine 0.004 0.001 0.006 0.3 Explosives RDX 0.02 0.02 n.m. n.m. TNT n.d. 0.02 n.m. n.m. PETN 0.2 0.05 n.m. n.m. Tetryl 2 2 n.m. n.m. *LODs were calculated based on S/N = 3 from a calibration curve of at least 3 points
using at least 3 repetitions for each point. The linear equation from the calibration curve was used to calculate the LOD between the lowest concentration detected and the highest concentration not detected (varying each concentration by ~one order of magnitude).
n.d. – not detected; n.m. – not measured

67
Figure 3.1 (a) Schematic and (b) photograph of the handheld LTP ionization source. (c) Schematic of the circuit used for the handheld LTP probe.
a) b)
c)

68
O
NH
OH
Acetaminophen (M1)Molecular Weight: 151.1626
O OH
O
O
Aspirin (M2)Molecular Weight:
180.1574
O N
N
N
N
O
Caffeine (M3)Molecular Weight:
194.1906
Figure 3.2 Direct handheld LTP-MS analysis of a headache relief tablet on the Thermo LTQ in (a) positive ion and (b) negative ion mode. Peaks labeled in magenta, green and red are related to acetaminophen, aspirin and caffeine respectively. Both spectra were acquired with a Thermo LTQ.

69
50 100 150 200 2500
20
40
60
80
100
Rel
ativ
e A
bu
nd
ance
m/z
50 100 150 200 2500
20
40
60
80
100
Re
lati
ve A
bu
nd
an
ce
m/z
Figure 3.3 Analysis of 24 pg atrazine with (a) large-scale and (b) handheld LTP-MS/MS. Both spectra were acquired with a Thermo LTQ using the optimized conditions for each LTP probe.
174
216
216
174
a)
b)
NL: 3.19E1
NL: 1.00E2
m/z 216
m/z 216

70
Figure 3.4 Positive ion tandem mass spectrum of 1.2 ng isoproturon with (a) helium- and (b) air-based handheld LTP. Negative-ion full-scan mass spectrum of 200-pg RDX with (c) helium and (d) air used as the discharge gas. All four spectra acquired with a Thermo LTQ. Air was supplied by a large compressed air cylinder for air-based handheld LTP.

71
150 200 250 300 3500
20
40
60
80
100
Re
lati
ve A
bu
nd
ance
m/z
Figure 3.5 Handheld LTP MS/MS spectrum of 1.2 ng malathion using the Mini 10.5 MS.
OO
SP
OO
S
O
O
Malathion
Molecular Weight: 330.3580
331
285
m/z 331

72
60 80 100 120 140 160 180 2000
20
40
60
80
100
Re
lati
ve
Ab
un
da
nc
e
m/z
Figure 3.6 Analysis of 1 µg methamphetamine on an individual’s finger two hours after being deposited with handheld LTP-MS/MS with a Mini 10.5 MS.
150
119
m/z 150 [M+H]+
[M+H-NH2CH
3]+

73
Figure 3.7 (a) Schematic of the handheld LTP with an interface used for long-distance ion transport to a Thermo LTQ. (b) The analysis of a U.S. one dollar bill with this configuration as well as (c) 10 µg of RDX from a glass slide.

74
CHAPTER 4
FUNDAMENTALS OF LTP: EMISSION SPECTROSCOPY
4.1 Introduction
A wide range of analytical techniques are readily used to characterize
atmospheric- and reduced-pressure plasmas. One technique and focus of this dissertation
is mass spectrometry, which is useful in identifying both positive and negative ions in the
plasma. Electrical measurements, such as current and voltage, can help in the
classification of discharge type (i.e. corona, glow, arc, etc.). In addition, a Langmuir
probe allows one to obtain information such as electron temperature, electron density,
and electric potential of a plasma. Plasma temperature, which is proportional to the
power of a discharge, can easily be measured with various thermometric devices like
thermocouples; however, IR thermography cameras are better suited for two- and three-
dimensional temperature plots, as has previously been used to characterize LTP
temperature profiles.1
While the various techniques are effective for their intended measurements, one
technique that provides many of these metrics and more is emission spectroscopy.
Hence, to better understand LTP on a fundamental level, various emission studies of the
plasma plume were performed. From spectroscopic studies, several fundamental features
of the plasma can be identified. Where mass spectrometry is used to determine the

75
composition of ions in the plasma, with emission spectroscopy it is possible to identify
both ions and neutrals based on distinct emission wavelengths. In addition, extraction of
the total energy balance or distributions among the various excited species in the plasma,
as well as determination of electron density and electron and rotational temperatures
(kinetics) is also permitted by emission spectroscopy.2-4 Knowledge of the species
responsible for atomic and molecular emission may also assist in the elucidation of
desorption and ionization processes.5-7 In the literature, He-based low frequency plasmas
typically yield emission from OH, O, He, N2 and N2+• species.8
The focus of this chapter is on the characterization of LTP through various
emission spectroscopy studies. Full emission spectra over the visible light range help to
determine which excited atomic and diatomic species are present in the discharge. For
diatomic species, rotational temperatures were calculated by fitting with a Boltzmann
distribution. The electron number density was calculated from Hß emission.3 A
monochromatic imaging spectrometer (MIS) was used to visualize 2D images of various
emitting species under different plasma conditions. By using very short exposure times,
it was possible to obtain time-resolved images of emission corresponding to plasma bullet
propagation.9,10 Positioning a fluorophore-coated glass-slide into the path of the LTP as
well as on the focal plane of the MIS also provided some perspective into plasma-surface
interactions.

76
4.2 Experimental
4.2.1 Atomic Emission Spectrometer
A series of UV-Vis spectroscopic studies were completed using an ACTIVA
inductively coupled plasma atomic emission spectrometer (Horiba-Jobin Yvon,
Longjumeau, France) spectrometer (c.f. Figure 4.1) equipped with a two-dimensional
charge coupled device (CCD) detector. The ICP torch was removed and an LTP probe
was fixed to a three-dimensional translation stage in the ICP compartment vertically to be
aligned with the ICP torch axis and focused onto the entrance 20 μm slit of the
spectrometer. The combination of the 2D CCD detector with a Czerny-Turner grating
configuration allowed simultaneous measurement of the entire vertical emission profile
of the plasma. Spectra were collected over a range of 200 – 780 nm as well as 1D spatial
profiles for defined spectral ranges. Using a demagnification ratio of 3.12 : 1, a
measurement height of 21.5 mm was possible. An exposure time of ~1 minute was
necessary to obtain adequate signal-to-noise due to the relatively low emission intensities
of LTP.

77
4.2.2 Monochromatic Imaging Spectrometer
A monochromatic imaging spectrometer (MIS) was used to obtain two-
dimensional images of LTP emission (c.f. Figure 4.2). The instrument consisted of a
collimating lens (plano-convex, fused silica, 48 mm dia.), a Heath monochromator
(model EU 700, Heath Co., Benton Harbor, MI, USA), a focusing lens (plano-convex,
fused silica, 48 mm dia.), and an intensified charge coupled device (iCCD, PI-MAX, 512
x 512 pixels, Princeton Instuments Inc., Trenton, NJ, USA). An LTP source was placed
at a distance approximately equal to the focal length from the first collimating lens. This
detection system enabled time-averaged (steady-state) and time-resolved images of single
transitions of emitting species in the LTP plume. Time-averaged emission profiles were
acquired with 10 second exposure times under various plasma conditions.
Nanosecond time-resolved images were acquired by gating the detector with the
input LTP waveform. In each of the time-resolved 2D images, the gate delay refers to the
time difference between the rising edge of the 5-volt square wave used for LTP and the
beginning of the 100-200 ns time window at which emission was detected by the iCCD
(c.f Figure 4.3). Each image was the summation of exposure for 35,000 gates with gate
widths of either 100 or 200 ns. In two of the experiments, interaction of the plasma with
a surface was studied by placing the surface in the focal plane of the MIS and aiming
LTP emission at the surface, while recording time-resolved emission profiles. In one
study, the surface was a sharp needle and emission at 391.2 nm (from N2+) was
monitored. In a second study, the surface was a glass microscope slide coated with
yellow highlighter and emission at 507 nm (near the λmax of a fluorophore in the
highlighter) was monitored.

78
4.2.3 LTP Probe for Spectroscopic Studies
The LTP probe was the same as the one used in chapter 2 for the analysis of
agrochemicals. In short, the probe was the same configuration as the larger version used
by Harper et al.11 It consisted of the larger diameter glass tubing (in comparison to the
handheld LTP probe) along with an applied voltage of 5 – 10 kV at 2.8 kHz. Spectra
shown in this chapter were collected using a He carrier gas, but Ar was used as well and
revealed emission only from excited Ar species.
4.3 Results and Discussion
4.3.1 Identification of LTP Emission Species
An advantage of emission spectroscopy over MS for the characterization of
plasma species lies with the ability to identify both neutral and charged species. In
plasma-based MS, the only species that can be identified are long-lived ions that survive
transmission from ambient air to vacuum for separation and detection. It is possible to
study much shorter-lived and potentially higher energetic species in emission
spectroscopy. However, a major advantage of MS is that larger, polyatomic ions are
detected which is only possible in emission spectroscopy if the polyatomic species
fluoresce, and even then the sensitivity is much greater with MS. Instead, with emission
spectroscopy, smaller atomic and diatomic species can be identified and characterized,
providing insight into the initial plasma reactions that lead to reagent ion formation. The
emission spectrum of the LTP probe at a carrier gas flow of 1.6 L/min is depicted in

79
Figure 4.4. The atomic emission species that can be identified in the spectrum include
He (706.5 nm), O• (777 nm) and H• (Hα – 656.3 nm; Hß – 486.2 nm), while the molecular
species observed include N2 (337.1 nm), •OH (306.5 nm) and N2+ (391.2 nm). He-LTP
emission is similar to other He plasmas in the literature; however, the emission profile of
the LTP probe is unique, with differences most likely occurring because of the unique
electrical characteristics (i.e. voltage/current) and geometrical configurations of each
plasma. The most intense emission detected is from the N2+• at 391.2 nm ion followed by
N2 (337.1) and He (I, 706.5 nm). Both N2+• (15.6 eV)12 and He(I) (~22.7 eV; 33S1 triplet
state)12 are expected to play a large role in LTP ionization through charge transfer and
penning ionization reactions, respectively. One such reaction is depicted in reaction
Scheme 4.1 for the formation of water clusters,12-14 which are thought to be the major
reagent ions responsible for analyte protonation. Note that He* is an excited metastable,
and is the species that results from the loss of a photon from the 33S1 triplet state (i.e.
emission of 706.5 nm photon).
HOHOHnOH
OHOHOHOH
NOHOHN
NNNN
eNHeNHe
n)()1(
2
2
223
322
2224
2422
22*
Scheme 4.1 Commonly accepted APCI mechanism for water cluster formation from He*

80
4.3.2 Calculation of Electron Density
Electron density is an important metric for plasmas as it describes the degree of
ionization of species in the plasma. Due to charge balancing, there must be a positive ion
for every electron in the plasma, so the positive ion density also must be on the order of
the electron density. In addition, the electron density can also be an important metric for
the formation of negative reagent ions in the plasma, which are essential for forming
negative analyte ions. The electron density was approximated using the Stark broadening
of the Hβ line at 486.2 nm.6 Further details about how the electron number density was
calculated can be found in the publication by Chan et al.15 In essence, Stark broadening
was estimated as the difference between the measured Lorentzian linewidth of Hß (53.6
pm) and van der Waals broadening (44.6 pm), which is 9.0 pm. The use of an equation
given by Gigosos et al.16 provided an estimation of an electron density of 9.9x1012 cm-3.
This is in close approximation to other ambient He-based discharges.17 When
considering the number of molecules in the same volume (as calculated from the ideal
gas law) is 1019, assuming the electron density is in close proximity to the ion density
suggests an ionization efficiency on the order of 10-6 – 10-7. While seemingly low, the
ionization efficiency is on par with atmospheric-pressure plasmas and is often higher for
reduced pressure plasmas. In addition, the electron density was calculated from emission
in the LTP afterglow, where the electron density is expected to be less than in the space
between the two electrodes where primary plasma reactions occur.

81
4.3.3 2D Images of Steady-State LTP Emission
In Figure 4.5, steady-state images of the LTP plume with a He flow rate of 0.6
L/min can be observed for N2+ (391.2 nm), He* (706.5 nm) and N2 (337.1 nm) emission.
The intensity scale, displayed above each image, was varied so that population
distributions of the respective emitting species could be compared. For all three emitting
species, the most intense emission occurred near the end of the plume (disregarding
intense emission occurring inside the probe for He* in Figure 4.5b). Interestingly, the
distance from the LTP probe to the center of the most intense emission was further for N2
(~2.8 mm) when compared with N2+ and He* which both had local maxima in emission
intensity at ~2.0 mm from the end of the probe. It is possible that the difference in
maxima for N2+ and N2 is due to the recombination of N2
+ with an electron to form N2
which then emits a photon further downstream. Another possibility is that the
discrepancy in emission profiles is due to regions of varying energy in the plasma. The
more energetic species would be expected to be in closer proximity to the LTP probe
(where the initial discharge began) with less energetic species at further distances from
the probe. This is in fact the case as N2+ and He* with energies of 18.8 and ~22.7 eV
respectively have emission maxima at ~2.0 mm versus ~2.8 mm for N2 with ~3.7 eV of
energy.
In a typical LTP-MS experiment involving proton transfer, it is better to have the
sample placed outside the visible and more energetic afterglow region of the plasma.
Proton transfer tends to occur with lower efficiency when samples are placed in the more
energetic, visible portion of the LTP afterglow. This could either be due to not having
sufficient proton transfer reagent ions in the high-energy afterglow or potentially due to

82
neutralization of the analyte with high-energy species that have opposite polarity (e.g.
positive ions capturing electrons). On the contrary, it is possible that the visible
afterglow region of the plasma is better suited for higher energy desorption processes,
such as chemical sputtering, due to the presence of species with over 22 eV in this region;
although this has yet to be demonstrated.
Figure 4.6 displays steady-state images of emission at 706.5 nm at various helium
flow rates. As previously mentioned, this corresponds to a transition from one excited
state of He* to a metastable state (Hem). Thus, these profiles give an estimate of the
relative distribution of Hem in the plasma plume. The role of Hem can be understood
from the reactions shown earlier in Scheme 4.1, which reveals a commonly accepted
APCI mechanism for the production of water clusters starting with Hem. Water clusters
are of immense importance in LTP-MS analysis due to their role in proton transfer
ionization. In particular H3O+ likely plays the largest role due to its low proton affinity
(PA) at ~690 kJ/mol which enables it to transfer a proton to many different compounds,
much more so than two proton-bound waters [(H2O)2H+] which has a PA of ~808 kJ/mol
due to solvation effects.18 However, even (H2O)2H+ is capable of transferring a proton to
many species, such as amines which tend to have a PA greater than 900 kJ/mol. It
follows then, that increased emission at 706.5 nm and consequent production of Hem
should lead to increased water cluster formation which ultimately leads to increased
ionization capabilities.
Figure 4.7 shows mass spectra recorded at 1.0 L/min and 0.4 L/min He flow rates.
The higher flow rate, which reveals increased He* emission as depicted in Fig. 4.6, also
yields increased water cluster production (m/z 37 corresponds to (H2O)2H+). Note that

83
other flow rates were attempted as well and revealed the same trend. It should also be
noted that this trend does not necessarily suggest that higher flow rates will yield more
analyte signal from proton transfer. With the large-scale LTP geometry, 0.4 l/min of
helium usually provides sufficient reagent ion formation that the analyte typically seems
to be the limiting reagent. This is further evidenced by the handheld LTP probe
discussed in the previous chapter, which utilizes flow rates below 100 mL/min and still
provides similar or even better sensitivity than the large-scale probe with its larger He
flow rates. In fact, increasing the flow rate to over 1 l/min with the large-scale LTP
actually decreases analyte signal for typical probe to sample distances. This could be due
to changes in the gas flow profiles or potentially because of elongation of the visible
afterglow to the sample surface, which can result in less formation of proton transfer
products as previously discussed.
Unlike adjusting the helium flow, varying the LTP power by changing the voltage
supplied to the probe does not reveal a simple trend of increased emission with increased
power (c.f. Figure 4.8). Instead, there appears to be a local maximum of emission within
the afterglow at about 2.1 W, even though the intensity of emission from within the tube
appears to increase with increased power. The explanation of this phenomenon is not
fully understood. However, it would appear that 2.1 W is the optimal power to operate at
over this power range, as it should allow the highest abundance of Hem to be formed
outside of the LTP tube where more nitrogen and water are accessible for the formation
of protonated water clusters via reaction Scheme 4.1. This claim is further substantiated
by the fact that when performing analyses with LTP-MS at different powers, there is
typically a point at which increasing the power decreases signal for proton transfer

84
products. However, the actual optimum power setting is likely to change with different
configurations of the LTP probe as well as different He flow rates. It would have been
interesting to determine whether the intense emission in the afterglow at 2.1 W was a
local or global maximum, but this was not possible due to discharge instability and arcing
at higher potentials.
4.3.4 Rotational Temperatures and Reactions for LTP Reagent Ion Formation
Rotational temperatures of diatomic species in a plasma can be determined by
fitting one of its branches of emission (R or P) with a Boltzman distribution.15 Typically,
rotational temperatures are a good indicator of gas-kinetic temperature due to the rapid
equilibrium of rotational levels with translational energy of the molecule. A good
example of this can be observed in Figure 4.9, which shows rotational temperatures for
two different species at various positions within and outside the LTP probe. In the case
of OH, there was no deviation within experimental error between the typical measured
gas kinetic temperature and the rotational temperature of OH (290 – 300 K). However,
the rotational temperature for N2+, calculated from the distribution of N2
+ rotational levels
for 12 emission lines in the R branch, did not display the same trend.
Interestingly, the N2+ rotational temperatures are significantly higher than the gas
kinetic temperature. Within the LTP probe, the rotational temperature of N2+ is around
350 K and actually rises to ~550 K at the furthest edge of the afterglow. Note that when
changing helium flow rates, there was no effect on the maximum rotational temperature;
only the distance at which the maximum occurred from the LTP probe changed.

85
Discovering the N2+ rotational temperatures were above 350 K has actually led to a better
understanding of how N2+ is being formed in the various regions of the plasma by
considering the various pathways in which N2+ can be formed. A more detailed
explanation of how the rotational temperatures were obtained as well as how the
elucidation of the reaction mechanisms can be found in the manuscript by Chan et al.15
The first mechanism that was ruled out is direct electron ionization (EI) of nitrogen, due
to the lack of spatial correlation between the emission from N2 and N2+ (c.f. 2D emission
profiles in Fig. 4.5 or 1D emission profiles in Figure 4.10). The spatial emission
distributions of these two species should overlap if EI were the dominant mechanism.
Instead, either charge transfer or Penning ionization from a higher energy species must be
taking place.
It makes the most since that one of the highly excited forms of helium would be
responsible for the ionization of N2 due to being the only likely species in the plasma
with the necessary ~14.5 eV to ionize nitrogen. Below are three potential reactions of
helium species with nitrogen that could play a role. The first two are charge transfer
(CT) reactions and have been reported to yield N2+ rotational temperatures near 900
K.19,20 Reaction 3 is the Penning ionization (PI) of N2 from Hem and results in N2+
rotational temperatures of ~360 K.20
(1) CT from He2+: He
2+ + N
2 → 2 He + N
2+
(2) CT from He+: He+ + N2 → He + N
2+
(3) PI from Hem: Hem + N2 → He + N
2+ + e-

86
The rotational temperatures within the LTP probe and in the initial parts of the
plume are in strong agreement with those that arise from PI in reaction 3. However, the
increase in rotational temperature in Figure 4.9 to 550 K suggests that a charge transfer
mechanism is also taking place (either reaction 1 or 2). Furthermore, it has been found
that reaction 1 is the more likely of the two reactions for two main reasons. It has been
reported in the past that He2+ is in much greater abundance than He+ for DBDs at
atmospheric pressure.21 (2) The vibrational states of N2+ found for the He-LTP more
closely resemble those that result for a CT from He2+ than for a CT from He+.22 Thus,
He2+ must be responsible for the formation of N2
+ and acts as an energy carrier in the He-
LTP plume.
Furthermore, the relative emission intensities of various species in the LTP plume
as well as the information that has been obtained from rotational temperature
measurements has been compiled in Figure 4.10. There are a few interesting findings
when looking at the overlay of the 1D emission profiles of N2, N2+ and He*. As
previously mentioned, there is a discrepancy between the emission profiles of N2 and
N2+. Also of interest is the profile of He* emission in Fig. 4.10, which reveals a global
maximum within the tube, a decrease, and then a local maximum at the same distance
from the probe as the N2+ emission maximum. Note that the same trend was also
discovered in the 2D monochromatic images in Fig. 4.5. This overlap in emission
profiles suggests that both He* and N2+ are being formed by the same reagent (i.e. He2
+).
The different reactions occurring in the various regions of the LTP plume are displayed in
Fig. 4.10. In the first region, within and just outside of the discharge tube, is the region
where He2+ is being formed by the three different reactions shown. Note this is also the

87
region where N2+ is being formed by PI from Hem. In the next region, He2
+ reacts with
nitrogen to form N2+ and also recombines with an electron and dissociates to form He*
and He. The final region is the least energetic, where either recombination of N2+ with an
electron or the excitation of N2 by lower energy species occurs.
4.3.5 Time-Resolved and 2D LTP Emission
Time-resolved images of 2D LTP emission were acquired by gating the iCCD
with the input frequency to the LTP and adjusting the gate delay to obtain images at
different time points. In Figure 4.11, 2D and time-resolved images were acquired for
emission from He* (706.5 nm), N2+ (391.2 nm) and N2 (337.1 nm) and are displayed
such that each column corresponds to the same gate delay for each 2D emission profile.
The gate width was 200 ns for each image with 35,000 gates per exposure. The images
of He* emission revealed that a propagating energy wave, or plasma bullet,13 travels
between gate delays of 16.0 and 18.4 µs at ~3,000 m/s (much faster than the He gas
velocity which is at ~0.4 m/s). Plasma bullets were also observed for N2+• and N2,
although their emission over the same 200 ns exposure times was much more spatially
dispersed than that of He* emission. Comparing the timing and positioning of plasma
bullets for each of the three species has allowed further insights into the mechanisms
discussed in the previous section.
He* emission stops after a gate delay of 18.4 µs, but continues for N2+ and N2
until 19.6 µs. The fact that N2+ and He* seem to propagate at similar times with similar
spatial correlation up until a gate delay of 18.4 µs suggests they are being formed via a
88
similar mechanism. As introduced in the previous section, it is believed that He2+ is
responsible for the formation and consequent emission of He* and N2+ in this initial time
of bullet propagation between gate delays of 16 – 18.4 µs. However, the fact that He*
emission stops, while N2+ emission continues after a gate delay of 18.4 µs, suggests that
another mechanism is responsible for the formation of N2+ during gate delays of 18.4 and
19.6 µs. The most probable candidate is Hem, which is formed as a result of He*
emission; so even though He* emission stops at 18.4 s, Hem is still around for the next
1.2 µs to ionize nitrogen. Other interpretations of the relationship between the time-
resolved images of N2+ and He* exist; however, the idea of two or more mechanisms
being responsible for nitrogen ionization is supported by rotational temperatures of N2+,
the comparison of steady state emission profiles and the 2D time-resolved images.
Emission at 337.1 nm (N2) follows a similar time correlation with N2+ and He*
emission, but the distribution is shifted further from the LTP probe. This could be
attributed to the plasma bullet acting as a travelling energy wave, where emission from
N2 would be expected to occur first as the lower tail of the energy wave propagates and is
followed by the higher energy part which is capable of exciting He to over 22.7 eV. The
formation of N2* is believed to occur as a result of the excitation of ground state N2 up
until a gate delay of 18.4 µs. After this time, N2 emission starts again and closely
correlates with N2+ in time and space. Hence, for gate delays of 18.4 – 19.6 µs, it is
believed that N2* is formed via recombination with an electron. Note that the
recombination of N2+ with an electron may also contribute at earlier gate delays, but due
to the lack of spatial correlation with N2+ and He*, excitation of ground state N2 is likely
the larger contributor.

89
4.3.6 LTP Interactions with Sample Substrates
Emission from the LTP probe has provided some insight into the reactions
responsible for reagent ion formation, but unfortunately this does not reveal anything
about the interaction of LTP species with a sample substrate. Emission spectroscopy is
not well suited for studying this type of plasma interaction as most molecular samples do
not emit light in the visible region. However, two interesting plasma-sample substrate
interactions were monitored with emission spectroscopy: 1) plasma focusing to a
grounded needle and 2) fluorescence from a highlighter-coated glass slide.
The first interaction studied was based on a finding by Huang et al. (unpublished
data) that increased signal was observed when a sample was analyzed by LTP from a
grounded and sharpened metal needle. The time-resolved emission of N2+ to an
electrically grounded needle is shown in Figure 4.12. The image acquired at a gate delay
of 21 µs shows the LTP plume beginning to anchor to the needle. In contrast to the
images shown in section 4.3.5, no plasma bullet was shown propagating towards the
needle. Instead there was steady emission between the LTP probe and the needle that
intensified until gate delays of 26 – 27 µs and slowly decreased until a gate delay of 33
µs. Interestingly, emission decreased in intensity just before reaching the needle, yet was
very intense at the point of the needle. In comparison with the plasma bullets not
interacting with a surface/substrate from Fig. 4.11, which had a lifetime of ~3 µs, the
emission between the probe and the needle alone lasts about four times longer. The
intense emission from the needle continues on until a gate delay of ~80 µs, as what is
believed to be a corona discharge caused by charging of the needle by LTP. In all,
emission from N2+ lasts about 60 µs, which is nearly 20 times longer than the plasma

90
bullets in the typical LTP configuration. It is possible that the either the increase in
emission duty cycle for N2+ (from ~1% to ~18%) or the increased emission intensity at
the needle tip could be responsible for the increased sensitivity observed for the LTP-MS
analysis of a sample from a needle.
Figure 4.13a shows the MIS setup used to investigate the interaction between LTP
with a mock sample on a glass slide. A glass slide coated with highlighter ink was placed
perpendicular to the light path and the LTP probe was placed 45° from the glass slide
such that the plasma plume was allowed to directly interact with the flourophore sample.
The wavelength monitored was near the λmax of the flourophore in the highlighter at 507
nm. Unfortunately, the fluorophore in the highlighter could not be detected by LTP-MS
as LTP typically has difficulties with the desorption/ionization of dyes.
Figure 4.13b displays time-resolved images of the plasma-induced highlighter
emission. The plasma reaches the substrate at a gate delay of ~22.9 µs as determined by
the increased emission at 507 nm. The intense emission then lingers for ~0.5 µs until it
starts to disperse in a V-pattern at ~23.4 µs. The spreading/fading slowly continues in
this V-pattern until it surpasses the focal area of the lensing system at 24.7 µs. It is of
interest which plasma species is causing excitation of the highlighter flourophore and
whether it is electronic or photonic. The initial low-intensity spike of emission that
occurs at a gate delay of 22.0 µs, is thought to be through photonic excitation from either
N2+ or N2 due the time gap between emission at 22 µs and the intense emission at 22.9 µs
(when plasma species actually reach the glass slide). The low intensity could be
attributed to the distance between photon emission from within the LTP at early gate
delays, resulting in a low intensity of photons reaching the surface.

91
If the intense emission at later gate delays is caused by an excited helium species,
it must be through electronic excitation because full emission spectra indicate that He
lacks abundant emission of photons capable of exciting and inducing fluorescence at 507
nm (most emission of He is ~700 nm). N2+ is likely capable of exciting the flourophore
via an electronic or a photonic mechanism because it emits light at 391.2 nm and also has
an energy greater than 15 eV. It is believed that the intense excitation for 0.5 µs is due to
electronic excitation from He* or Hem because the duration is similar to the lifetime of
He* emission at the same respective distance from LTP probe which is also ~0.5 µs,
whereas emission from N2 and N2+ lasts for ~1.5 µs (c.f Fig. 4.11). The lower extent of
excitation/emission at later gate delays could come from other species that endure longer
excited lifetimes than He through either electronic or photonic processes. It should be
noted that plasma bullets were not measured for all emitting species in the LTP plume, so
the role of these other species cannot be ruled out. However, the emission intensities
suggest He*, N2 and N2+ are the most abundant and perhaps more likely to cause the
observed excitation at the highlighter surface.
Another parameter worth noting is the spot size of the plasma for chemical
imaging. The goal in most MS imaging experiments is to obtain the smallest spot size or
highest resolving power. The 2D images of emission from a sample substrate have
helped provide some indication of what the spot size of excitation is for LTP-MS. In
mimicking a typical LTP-MS experiment, the interaction of the plasma with highlighter
on a glass slide suggests a spot size with a 3 – 4 mm diameter. This is quite large and
could explain why LTP is not considered to be well-suited for MS imaging, despite an
attempt by Liu et al.23 The images in Fig. 4.12 for the LTP-needle interaction suggest a

92
much smaller spot size with a diameter of 0.4 – 0.5 mm at the tip of the needle. If this
was the actual spot size for LTP-MS imaging, it would be acceptable; however, without
performing the MS imaging experiment it cannot be certain that desorption/ionization
occurs within the same confined spot. In practice, it was difficult to obtain spot sizes less
than 1 mm due to the fact that most samples that can be analyzed with LTP-MS have a
fairly high vapor pressure.
4.3.7 Implications of Emission Data on LTP Desorption/Ionization Mechanism
There has been evidence suggesting that non-thermal desorption/ionization
mechanisms are capable of taking place with LTP. Experiments conducted with LTP on
a Teflon substrate have revealed clusters of peaks separated by 50 m/z units, which
correspond to different lengths of the fluorocarbon chain. The only way these ions can
form is if LTP is able to break the C-C bond in the polymer (with a bond energy greater
than 3.8 eV). The momentum of the species in the plasma at ambient thermal energies
alone is clearly incapable of breaking this bond. There are two main possibilities that
should be considered for why LTP is capable of breaking a C-C bond in Teflon (although
all possible desorption mechanisms are considered in the following chapter): 1) spikes of
increased temperature occur during plasma bullet propagation or 2) a chemical
sputtering-type process.
The possibility of local spikes of intense heat during plasma bullet propagation
can be ruled out due to the rotational temperature data discussed previously. While the
rotational temperatures of N2+ clearly had not reached equilibrium with translational

93
energy, the OH rotational temperature should serve as a better indicator. Figure 4.9
revealed that the OH rotational temperatures were approximately room temperature at
~300 K. The OH rotational temperatures were calculated by fitting the distribution of
different OH lines with a Boltzmann distribution. Combining this with the fact that there
is no OH emission when the plasma bullet is not present indicates that the rotational
temperatures reported in Figure 4.9 are representative of the temperatures during the
plasma bullet propagation. This is because the distribution of OH peaks that occurred
during the time interval of plasma bullet propagation will not be distorted by the absence
of OH emission during the rest of the time interval. Thus, the 300 K rotational
temperatures calculated for OH indicate that there is not a spike in temperature during
plasma bullet propagation, and another mechanism must be responsible for breaking the
C-C bond in Teflon.
One potential mechanism is chemical sputtering through vertical electronic
transitions within surface-bound molecules. There are two possibilities by which this
electronic transition can take place. The first is by a high energy electron bombarding the
surface. However, the energy of the electrons propagating at the speed of the plasma
bullet (~3,000 m/s) would be merely 25.6 micro-eV, which is clearly not enough energy
to desorb a surface analyte (106 m/s electron would be needed for eV energies). In
addition, C-C bond breaking from Teflon can occur even when the visible part of the
plasma is not in contact with the polymer, which is significant because free electrons are
quickly solvated or form anions once out of the high-energy and visible part of the
plasma where they are formed. Another method of electron transfer that can occur is via
interaction of an ion or electronically excited atom/molecule donating its energy to the

94
surface analyte. This is more plausible for several reasons, with the first being that there
are many highly excited species above 20 eV in a He plasma that are clearly capable of
breaking chemical bonds as well as various radicals and ions that can also provide energy
for chemical reactivity. Also, the fact that He-LTP was capable of exciting a fluorophore
in highlighter ink through electronic excitation from He* suggests this type of energy
transfer is possible from excited gas-phase species to a surface-bound analyte.
The desorption/ionization model, while attempting to explain some of the
observed examples of non-thermal desorption with LTP-MS, has little supporting
evidence and does not explain the inability to detect certain compounds with mass
spectrometry. It does not explain the failure to observe pre-charged molecules and certain
organic ions. Specifically, the failure to desorb/ionize dyes like rhodamine 6G and
organic lipids are not yet explained. In the next chapter, this non-thermal desorption
mechanism will be investigated in much further detail.

95
4.4 References
1. Dalgleish, J. K.; Wleklinski, M.; Shelley, J. T.; Mulligan, C. C.; Ouyang, Z.; Cooks, R. G. Rapid Communications in Mass Spectrometry 2013, 27, 135.
2. Andrade, F. J.; Wetzel, W. C.; Chan, G. C. Y.; Webb, M. R.; Gamez, G.; Ray, S. J.; Hieftje, G. M. Journal of Analytical Atomic Spectrometry 2006, 21, 1175.
3. Ionascut-Nedelcescu, A.; Carlone, C.; Kogelschatz, U.; Gravelle, D. V.; Boulos, M. I. Journal of Applied Physics 2008, 103.
4. Ochkin, V. N. Spectroscopy of Low Temperature Plasma; Wiley-VCH Verlag GmbH & Co. KGaA: Weinheim, 2009.
5. Eliasson, B.; Egli, W.; Kogelschatz, U. Pure and Applied Chemistry 1994, 66, U1766.
6. Kong, M. G.; Deng, X. T. Ieee Transactions on Plasma Science 2003, 31, 7.
7. Korzec, D.; Finantu-Dinu, E. G.; Teschke, M.; Engemann, J.; Miclea, M.; Kunze, K.; Franzke, J.; Niemax, K. Plasma Sources Science & Technology 2006, 15, 345.
8. Kim, S. J.; Chung, T. H.; Bae, S. H. Thin Solid Films 2009, 517, 4251.
9. Lu, X.; Laroussi, M. Journal of Applied Physics 2006, 100.
10. Vogel, N. I.; Kochan, N. Physical Review Letters 2001, 86, 232.
11. Harper, J. D.; Charipar, N. A.; Mulligan, C. C.; Zhang, X. R.; Cooks, R. G.; Ouyang, Z. Anal. Chem. 2008, 80, 9097.
12. Dzidic, I.; Carroll, D. I.; Stillwell, R. N.; Horning, E. C. Anal. Chem. 1976, 48, 1763.
13. Horning, E. C.; Carroll, D. I.; Dzidic, I.; Haegele, K. D.; Horning, M. G.; Stillwel.Rn Journal of Chromatographic Science 1974, 12, 725.
14. Kambara, H.; Mitsui, Y.; Kanomata, I. Anal. Chem. 1979, 51, 1447.
15. Chan, G. C. Y.; Shelley, J. T.; Jackson, A. U.; Wiley, J. S.; Engelhard, C.; Cooks, R. G.; Hieftje, G. M. Journal of Analytical Atomic Spectrometry 2011, 26, 1434.
16. Gigosos, M. A.; Gonzalez, M. A.; Cardenoso, V. Spectrochimica Acta Part B-Atomic Spectroscopy 2003, 58, 1489.
17. Martens, T.; Bogaerts, A.; Brok, W. J. M.; van der Mullen, J. J. A. M. Journal of Analytical Atomic Spectrometry 2007, 22, 1033.

96
18. Goebbert, D. J.; Wenthold, P. G. European Journal of Mass Spectrometry 2004, 10, 837.
19. Endoh, M.; Tsuji, M.; Nishimura, Y. Journal of Chemical Physics 1983, 79, 5368.
20. Belikov, A. E. Chemical Physics 1997, 215, 97.
21. Deloche, R.; Monchicourt, P.; Cheret, M.; Lambert, F. Physical Review A 1976, 13, 1140.
22. Leventhal, J. J.; Earl, J. D.; Harris, H. H. Physical Review Letters 1975, 35, 719.
23. Liu, Y.; Ma, X.; Lin, Z.; He, M.; Han, G.; Yang, C.; Xing, Z.; Zhang, S.; Zhang, X. Angewandte Chemie-International Edition 2010, 49, 4435.

97
Figure 4.1 Schematic of the instrumental setup used to obtain 1D LTP emission profiles. This configuration allows full emission spectra to be recorded over a 7 mm observation region, which is where the LTP plume was carefully positioned.

98
Figure 4.2 Diagram of the monochromatic imaging spectrometer (MIS) used for steady-state and time-resolved 2D emission images for LTP optical characterization.

99
Figure 4.3 Gate sequence diagram for the LTP time-resolved emission profiles, where the LTP input square wave was used as a trigger and a delay was varied to provide images at various time points in the overall waveform.

100
Figure 4.4 1-D Emission profile of a helium LTP (exposure time of 1 minute).

101
Figure 4.5 Steady-state, monochromatic emission profiles of A.) N2+• (391.2 nm), B.) He
(706.5 nm) and C.) N2 (337.1 nm) from the LTP probe (brown dashed line). (LTP: 0.6 L/min He, 2.8 kHz) (iCCD: 10 s exposure, gain 180)

102
Figure 4.6 Steady-state LTP emission from He* (706.5 nm) at various He flow rates. Brown dashed line corresponds to location of the LTP probe.

103
Figure 4.7 Background mass spectra recorded from LTP at two different He flow rates.
20 40 60 80 100 120 140 160 180 200m/z
0
10000000
1000000
Abun
danc
e
37.58
37.58
Abun
danc
e
0.4 LPM He Flow
1.0 LPM He Flow

104
Figure 4.8 Steady-state LTP emission from He* (706.5 nm) as a function of power consumption. Brown dashed line corresponds to location of the LTP probe.

105
Figure 4.9 Vertical profile of measured OH and N2+ rotational temperatures of He-LTP.
Note the monotonically increasing trend for the N2+ rotational temperature. The two
straight lines for the N2+ rotational temperature are included for visualization purposes.
The error bars represent only the error of the slope in the linear regression. Helium flow - 1.60 L/min

106
Figure 4.10 Schematic diagram showing the identified spatially dependent reactions for the afterglow and reagent-ion formation in the LTP probe ambient ionization source. The spectra on the right correspond to N2, N2
+ and He emission as a function of distance (scaled such that it aligns with the picture of the LTP probe to the left).

107
Figure 4.11 Time-resolved emission at 706.5, 391.2 and 337 nm, revealing plasma bullet propagation for He, N2
+ and N2 emission respectively. The gate width was 200 ns with an overall exposure of 35,000 gates for each image. Brown dashed line corresponds to location of the LTP probe.

108
Figure 4.12 Time-resolved, 2D emission of N2+● at 391.2 nm for the interaction of LTP
with an electrically grounded needle (for gate delays between 18 and 90 µs after the rising edge of the square wave used for the LTP source). The gate width was 200 ns with an overall exposure of 35,000 gates for each image. Brown dashed line corresponds to location of the LTP probe.

109
Figure 4.13 A) MIS configuration used to monitor plasma-sample interactions. B) Time-resolved images of low-temperature plasma-highlighter (λmax near 507 nm) interactions at various gate delays. The gate width was 100 ns with an overall exposure of 35,000 gates for each image.
A)
B)

110
CHAPTER 5
FUNDAMENTALS OF LTP: NON-THERMAL DESORPTION VIA CHEMICAL SPUTTERING
5.1 Introduction
Sputtering is a process in which particles are removed from a surface as a result of
interaction with an incident particle. There are two main types of sputtering: chemical
and physical. Physical sputtering occurs when kinetic energy of an impinging particle
leads to removal of a surface particle. In contrast, chemical sputtering is not based on
momentum of the impinging particle, but instead relies on chemical reactivity to liberate
a surface-bound particle into the gas phase. Both of these sputtering phenomenon are
traditionally observed at reduced pressure, as is the case in secondary ion mass
spectrometry (SIMS) where larger ions (i.e. Ar+, Cs+, C60+, etc.) are accelerated toward a
surface. Reduced pressures are important for physical sputtering so that the projectile
ion/particle can gain enough momentum to remove material from a surface. However,
the fact that chemical sputtering is dependent on reactivity and not momentum suggests it
does not necessarily have to occur at reduced pressure.
Not too surprisingly, there have been many reports of chemical sputtering at
atmospheric pressure with the use of plasmas, first demonstrated by Rossmann et al.
where emission spectra of vapor phase metals were recorded as a result of RF plasma

111
exposure to a solid substrate.1 This general process has proven useful for the semi-
conductor industry in the growth of metal oxide films, which is a process that also occurs
during the sputtering of the metals as a result of reactive oxygen species in the plasma.
Another industry that has benefited from ambient sputtering induced by plasma is in the
polymer industry for the manipulation of polymer properties. It was originally shown
that a Tesla coil could introduce polar oxygen groups on a polyolefin surface.2 Later it
was shown that in addition to functionalizing polymers with oxygen, exposure of a
polymer to a corona discharge in an oxygen environment at 1 atm. caused the mass of the
polymer to decrease through the release of CO2 and H2O.3 As a biomedical application,
it has been proposed through simulation of an ambient DBD interacting with a lipid-like
surface (mimicking a cell membrane), that sputtering yields of ten or more percent should
be possible as a result of various reactive oxygen species in the plasma;4 however, there
was no experimental proof. Note that one common theme of all of the sputtering that has
occurred under ambient environments is the role of excited oxygen species, which have
been found to not only functionalize the surface, but have also been present in the gas-
phase sputter products.
Despite numerous accounts of ambient sputtering in other fields, mass
spectrometry, which has a long history of physical and chemical sputtering at reduced
pressure, seems somewhat antiquated with regards to its lack of evolution to atmospheric-
pressure sputtering. A major hurdle for mass spectrometry is that it has traditionally been
performed entirely at reduced pressure, from ionization to ion detection. Hence, it is not
surprising that sputtering phenomenon have not been reported under ambient conditions
in a mass spectrometric experiment. Despite having the capability of producing ions at

112
atmospheric pressure and introducing them to reduced pressure mass analyzers since the
early 1970s,5 it was only recently in 2004 that methods were developed to directly
interrogate surfaces with spray-based6 and plasma-based7 ambient ionization methods. It
is this overlap of the use of plasmas for various sputtering applications in polymer and
semi-conductor industries as well as their recent development for ambient ionization
mass spectrometry that has led to the current investigation of the role of chemical
sputtering as a desorption/ionization process for mass spectrometry.
Desorption processes for plasma-based ambient ionization sources for mass
spectrometry (MS) have mainly been attributed to thermal energy; however, there have
been hints of non-thermal desorption with ambient plasmas with no mechanistic
explanation.8,9 In the report by Xing et al., metals were the sample of choice and it was
found that a DBD could remove metals from the surface, but the use of an inductively
coupled plasma (ICP) to ionize the metals after DBD exposure suggests the metals
leaving the surface were not ions.9 In the other study, plasma assisted desorption
ionization (PADI) was used to interrogate various polymers and small molecules, and the
authors suggested a non-thermal mechanism must be taking place but did not offer an
explanation.8 In order to develop plasma-based ambient ionization for broader
applications, a better explanation of non-thermal desorption processes is needed. The
range of molecules that can be analyzed via thermal desorption, followed by ionization, is
limited to smaller, more volatile samples. Applying more heat by various methods will
increase the range of molecules that thermally desorb, but bulkier molecules such as
proteins and polymers are still inaccessible. Only through a higher energy process like
chemical sputtering will the analysis of such low-volatility molecules be possible. The

113
focus of this chapter is to better understand if and how non-thermal desorption processes
occur during an LTP-MS experiment.
5.2 Experimental
5.2.1 LTP-MS Analysis
The handheld LTP probe discussed in Chapter 3 was used for all analyses in the
chapter. Helium was used as the discharge gas. All reagents and solvents were
purchased from Sigma-Aldrich (St. Louis, MO). Analysis of pure analyte solids and
liquids were performed by dipping the closed end of a melting point tube into the pure
analyte and holding in the sampling region of the LTP in front of the MS inlet. Diluted
analyte solutions were analyzed by pipetting a small aliquot (2 – 3 µL) onto a glass slide.
In cases where heat was applied, a small heating element with controller was used to heat
up a metal block and the glass slide (with sample) was placed on top.
5.2.2 Solution-Phase Electrochemistry
Solution-phase electrochemistry was achieved using a configuration shown in
Figure 5.10A. Graphite electrodes (~1 mm dia.) were spaced ~1 mm apart. 20 µL of 1
ppTh acetylcholine in water was spotted such that both graphite electrodes were in
contact with the droplet and voltage/current was supplied via a 30V dc power supply
(AX503, AEMC Instruments, Dover, MA, USA). Three µL of pre- and post-
electrochemistry treated acetylcholine solution was placed onto filter paper (Whatman

114
Grade 1) and analyzed via paper spray mass spectrometry, which required cutting the
paper into a sharp triangle followed by application of 20 – 30 µL of methanol and 3.5 kV
to the paper to generate an electrospray-type process.
5.2.3 Self-Assembled Monolayer (SAM) Surface
Self-assembled monolayers (SAMs) of 3,3,4,4,5,5,6,6,7,7,8,8,9,9,10,10,10-
Heptadecafluoro-1-decanethiol (F-SAM) on Au substrate were prepared by a reported
method by Chidsey et al.10 10 x 10 mm Au coated (200 nm thickness) silicon wafers
(International Wafer Service, Inc. Cofax, CA) were cleaned with a piranha solution (3:1
sulfuric acid to hydrogen peroxide) to remove any contaminants and washed with
distilled water and ethanol respectively. The cleaned substrates were immersed in 1 mM
solution of thiol in ethanol for 24 h (enough time for SAM to form via gold-sulfur
covalent bond). After the SAM had formed it was thoroughly washed with ethanol
several times and dried under nitrogen atmosphere to ensure no unreacted thiol remained
on the surface.

115
5.3 Results
5.3.1 LTP-MS Analysis of Non-Volatile Halogenated Analytes
A self-assembled monolayer (SAM) is produced by spontaneous covalent
bonding of a long-chain thiol to a gold surface through a Au-S bond. An advantage of
SAMs is that they are an excellent sample substrate to study chemical sputtering due to
their thermal stability, ensuring that the chemical moiety for which the chemical
sputtering is to occur with is not prematurely in the gas phase. The heavily fluorinated
SAM, referred to as F-SAM (cf. Figure 5.1A), was prepared and exposed to excited
species from LTP. The resulting mass spectrum (cf. Figure 5.1B) reveals ions which
were produced by the cleavage of C-C bonds at multiple locations. Figure 5.1C shows
structures of the most abundant ions detected and were confirmed using accurate mass
measurements on an LTQ Orbitrap as well as tandem MS.
The ions at m/z 319, 369 and 419 correspond to straight perfluorinated alkyl
anions with six through eight carbons respectively. Ions at m/z 313, 363, 413 and 463 are
perfluorinated alkyl chains, with five through eight carbons respectively, which have
been functionalized with a carboxylate on the end where the C-C bond cleavage occurred.
This was confirmed by accurate mass data which revealed two oxygens were present as
well as by MS/MS data that revealed the loss of 44 Da (CO2). Note that the once CO2,
was lost, for example from the ion at m/z 463, the fragment at m/z 419 is identical to the
one in the full mass spectrum and their tandem MS is the same. The peaks at m/z 426,
476 and 526 correspond to HNO3 adducts of the perfluorinated alkyl carboxylates at m/z

116
363, 413 and 463 respectively. Nitric acid is formed in large abundance with LTP and
adducts to certain negative ions. It is easy to identify an ion that contains a nitric acid
adduct because large isolation windows are needed to efficiently isolate the parent peak
and very low CID energies (less than 15% manufacturer’s units) result in complete
fragmentation to a daughter ion that is 63 Da lower than the parent.
Figure 5.2 shows the analysis of another halogenated and non-volatile analyte,
thyroxine. Note that, with a molecular weight above 776 Da, the ambient vapor pressure
of thyroxine has not been measured but was calculated to be 1.24 x 10⁻¹⁷ Torr in the
Syracuse Research Corporation (SRC) physprop database (SRC, Inc.,
http://esc.syrres.com/fatepointer/search.asp). The vapor pressure is too low to allow the
molecule to be thermally desorbed by LTP. Hence, the LTP mass spectrum of thyroxine
in Fig. 5.2 does not show an intact molecular ion. Instead, it predominantly shows I2- and
I3- at m/z 254 and 381 respectively, which are formed as a result of cleavage of the
carbon-iodide bond.
5.3.2 LTP-MS Analysis of Fluorinated Polymers
Various polymers were interrogated via LTP-MS by simply placing the pure and
intact polymer in the LTP sampling region. Figure 5.3A shows the LTP-MS analysis of
polytetrafluoroethylene (PTFE or Teflon®) in negative ion mode on a Thermo Exactive
Orbitrap. In the spectrum is a wide distribution of peaks spaced by 50 Da, corresponding
to a difference of one CF2 unit. The spectrum shown in Figure 5.3B is zoomed in over a
region slightly greater than 100 m/z units to better show the various peaks that are present

117
in the spectrum. Since the spectrum was acquired on an Orbitrap, it was possible to
obtain the chemical formula for each of the peaks. Note that the peaks from the LTP-MS
analysis of PTFE have anywhere from 1 – 5 oxygens added to the chain and this
distribution changes as a function of the potential applied and the discharge gas used
(both nitrogen and argon plasmas also give ions from PTFE with different distribution).
In addition, some of the peaks (e.g. m/z ~538/588) have a hydrogen, which is likely
present at the terminal carbon (i.e. –CF2CHF2) as one possible termination of PTFE
polymerization. Other possible termination pathways include the formation of a double
bond (i.e. –CFCF2) or -CF2CF3 at the terminus. Each of these types of ions are present in
the mass spectrum, suggesting the method could be useful for fast and direct Teflon®
characterization, but more work is needed to elucidate ion structures, reduce the
variability in mass spectra and reduce the amount of oxidation which complicates the
spectra. Further insight as to how the oxygens are adding to the perfluoroalkyl chains is
also of interest in determining the desorption/ionization mechanism.
Figure 5.4A shows the LTP-MS analysis of poly(chlorotrifluoroethylene)
(PCTFE) in negative ion mode. Note that the mass spectrum shows peaks separated a
repetitive cycle of 50 and then 66 Da, which correspond to cleavage after every CF2 and
CFCl group respectively. Similar to the F-SAM ions, the major series of PCTFE ions in
the spectrum are terminated with a carboxylate and are nitric acid adducts. However, the
other end of the PCTFE ions terminated with a double bond, so the formula for the ion at
m/z 320 would be CFCl=CF-CFCl-CF2-CO2-•HNO3. Interestingly, there is a bimodal
distribution with PCTFE, where ions that were cleaved such that CFCl was adjacent to
the carboxylate on the end (i.e. m/z 386, 502, 620, 736, etc.) were lower in abundance

118
than ions cleaved where CF2 preceded the carboxylate (i.e. m/z 320, 436, 552, 670, 786,
etc.).
The LTP-MS analysis of poly(vinylidene fluoride) (PVDF) was not as straight
forward (c.f. Figure 5.4B). Despite having a structure that continuously alternates
between CH2 and CF2 units, there was not a corresponding mass spectrum that showed
peaks separated by 14 and then 50 Da. Instead, there was a cluster of peaks from m/z 238
– 414 that were separated by about 14 Da and there was a separate distribution of peaks
at higher masses separated by 100 Da. Performing MS4 (c.f. Figure 5.5A) confirmed that
m/z 526 was the nitric acid adduct of a straight perfluorinated alkyl chain with a
carboxylate terminal (the same as the ion detected from F-SAM in Fig. 5.1B).
5.3.3 LTP-MS Analysis of Organic Salts
Organic salts represent another class of compounds that are typically very non-
volatile. Even when heated to 200 °C, no ions were detected by MS for the organic salts
studied in this section despite their pre-charged nature, which should automatically yield
gas-phase ions upon thermal desorption. When exposed to excited LTP species at room
temperature, there were still no intact parent cations observed. Instead, only fragments of
the organic salts were detected as shown in Table 5.1. As seen in the table, a wide
variety of organic salts were observed to exhibit a similar type of reactivity by
undergoing cleavage directly adjacent to the charged cite in the cation. Figure 5.6A
shows the analysis of tetraoctylammonium bromide, where one of the octyl groups
connected to the cationic, quaternary ammonium was displaced with a proton. In Figure

119
5.6B, the LTP-MS analysis of benzylhexadecyldimethyl ammonium chloride revealed
displacement of the benzyl group again with a proton. Note that both of the organic salts
in Fig. 5.6 contained a quaternary ammonium involved in only sigma bonding, and one of
the four sigma bonds was broken.
Similar reactions can be observed for quaternary ammoniums involved in pi-
bonding as well as for compounds containing tertiary oxygen. Shown in Figure 5.7A is
the mass spectrum obtained for the LTP interrogation of ethylpyridinium bromide, which
contains a quaternary ammonium involved in pi-bonding. Similar to, the examples in
Fig. 5.6, the LTP-MS analysis of ethylpyridinium reveals the displacement of the ethyl
group with a proton. Figure 5.7B displays the LTP-MS spectrum of an organic salt
containing tertiary oxygen, 2-(2,5-Dioxopyrrolidin-1-yl)-1,1,3,3-tetramethyluronium
tetrafluoroborate. Again, no peaks for the parent uronium cation at m/z 214 exist, but
similar to the quaternary ammoniums, cleavage of the nitrogen-oxygen bond resulted in
protonated tetramethylurea at m/z 117. It is also worth noting that the proton-bound
dimer of tetramethylurea at m/z 233 is present, suggesting that neutral tetramethylurea is
formed during the fragmentation of the uronium salt.
5.3.4 LTP-MS Analysis of Imidazolium Ionic Liquids
Many of the imidazolium salts are unique in that they are liquid at room
temperature, hence the name ionic liquids, yet have very low volatility and are difficult to
volatilize. Although, there have been reports of thermally desorbing some ionic liquids at
higher temperatures.11 Given their related structure, imidazolium ionic liquids react in a

120
similar manner as the quaternary ammoniums from the previous section. This can be
seen in Table 5.1 where diisopropylimidazolium and 1-butyl-2,3-dimethylimidazolium
chloride react via the replacement of an isopropyl and butyl group respectively and with a
proton. However, it should be noted that the imidazolium salts are resonantly stabilized
such that both nitrogens in the ring share the positive charge. While the symmetric
diisopropylimidazolium can only lose an isopropyl group, 1-butyl-2,3-
dimethylimidazolium and many other imidazoliums can lose either a methyl or a butyl
group. The ability to react at either partially cationic nitrogen was examined further by
analyzing 1-ethyl-3-methylimidazolium (1E3MI), 1-methyl-3-propylimidazolium
(1M3PI) and 1-butyl-3-methylimidazolium (1B3MI) with various counter anions. The
analysis of 1E3MI chloride and 1E3MI methyl carbonate can be found in Figures 5.8A
and 5.8B. The data for the analysis of all three imidazoliums with various anions can be
found in Table 5.2 with attention paid to the preference of losing methyl or the larger
alkyl group.
5.4 Discussion
5.4.1 Examining Potential Desorption Pathways
The most prominent desorption process for plasma-based ambient ionization MS
is undoubtedly thermal, even with LTP which is a room temperature plasma. This is
possible because most of the analytes that are “desorbed” and ionized with LTP have an
appreciable vapor pressure at room temperature (typically 10-7 Torr or higher) such that

121
there is a sufficient abundance of the analyte in the gas-phase (due to the excellent
sensitivity of MS) even without applying heat. The samples discussed in this chapter are
unique in that they have little to no vapor pressure in the room temperature LTP reaction
region. It should be further noted that the LTP reaction region is ~5 cm downstream
from the highly energetic and visible part of the plasma (where plasma bullet propagation
occurs). Thus, any temperature spikes which may have been possible in the highly
energetic plasma bullets would have cooled/equilibrated by the time the sample is
reached, 5 cm past the termination of the plasma bullet. Hence, the mass spectrum in Fig.
5.1 revealing excessive C-C bond cleavage from F-SAM, which is covalently bound to a
gold substrate, can be dismissed as being due to a thermal process.
Similarly, thermal desorption has been ruled for the analysis of organic salts. A
major indication that thermal desorption is not occurring is that simply heating the
organic salts, which are pre-charged, up to 200 °C in front of the MS inlet revealed no
signal. Although, the analysis of ionic liquids with atmospheric pressure thermal
desorption ionization (APTDI) MS has been reported and yields the intact cation/anion as
well as clusters of the anion/cation pairs at 250 °C.11 In a typical plasma-based ambient
ionization experiment, where thermal desorption is the major desorption pathway,
increasing the temperature of the analyte substrate will increase the volatility of the
analyte and, hence, result in a higher MS signal. However, if no thermal desorption is
occurring, increasing the temperature of the analyte substrate should not have a
significant effect on MS signal. To examine the role of temperature on the LTP-MS
analysis of organic salts, LTP-MS/MS spectra were acquired by analyzing acetylcholine
chloride from a glass microscope slide heated to various temperatures.

122
The expected product from the reductive cleavage of acetylcholine in the LTP
environment is 2-dimethylaminoethyl acetate (as shown in Table 5.1), with an m/z of 132
after being protonated. The MS/MS of protonated 2-dimethylaminoethyl acetate results in
ions at m/z 87 and 72, which correspond to the loss of dimethylamine and acetic acid,
respectively. For Figures 5.9a and 5.9b, the temperature of the glass slide was held at 25
and 100 °C, respectively, and the signal of the fragment at m/z 87 was monitored with
respect to time (i.e. the selected ion chronogram) and plotted on a log rhythmic scale on
the y-axis. The chronograms show an interesting trend where there is no signal in the
bulk solution, but in a minimally-solvated state there is a large signal enhancement before
decreasing again after the spot dries. The decrease in signal from the minimally-solvated
state to the dry spot has been attributed to the formation of ionic bonds that are more
energy-consuming to break, whereas the minimally-solvated state provides both a high
concentration of acetylcholine as well as weakened ionic interactions through solvation
that permit significant reactivity. Nevertheless, the chronograms show no significant
difference in absolute signal for analysis of the dried salt from 25 °C to 100 °C.
However, the signal increases over two orders of magnitude when the organic salt is
heated to 200 °C (Figure 5.9C). Note that the signal actually begins to increase once the
glass slide is heated to 150 °C. This is a due to thermal degradation of acetylcholine,
which has been shown to occur with similar quaternary ammoniums in the range of 140
to 180 °C.12
After ruling out thermal desorption, the remaining desorption methods to be
considered include solvent-assisted, acoustic, field, laser, physical sputtering, high-
energy electron sputtering and chemical sputtering. Both solvent-assisted and acoustic
123
desorption can be quickly ruled out because there is no solvent or acoustic wave present
in LTP. Field desorption also is not possible because the electric field is not nearly high
enough in the LTP reaction region which is at least 5 cm from the high voltage
electrodes. As for a laser-based mechanism, LTP does produce visible and UV photons,
but given that the sample substrate is placed 5 cm away from the visible plasma, the
photons would quickly be quenched such that the intensity would not be high enough to
allow significant desorption. In addition, the LTP source has not exhibited similar
desorption abilities as lasers for other non-volatile analytes.
The three desorption processes yet to be ruled out all involve some type of
sputtering. Physical sputtering might be possible in ambient conditions if the electric
field is high enough to accelerate reagent ions to the sample substrate, but as previously
mentioned, the electric field is too low and the pressure is too high in the reaction region
of the LTP such that ions could not have enough kinetic energy to induce sputtering. As
was briefly discussed in the last chapter, it is also very unlikely that bare electrons would
exist over a distance of 5 cm in ambient air, from their formation in the initial DBD to the
LTP reaction region, because they are quickly converted to anions or become solvated in
an ambient environment. There certainly would not be a high enough flux of high-energy
electrons in the LTP reaction region to allot for significant desorption. Hence, the only
remaining desorption mechanism that cannot be ruled out is chemical sputtering.
Chemical sputtering is considered a reactive process. This fits well with the fact
that each product of the LTP interaction with non-volatile alkyl halides and organic salts
involved breaking of chemical bonds, which is the basis of chemical reactions.
Furthermore, chemical sputtering requires a reactive species in the gas phase that can

124
break bonds within surface-bound molecules. A plasma is well-suited at providing
numerous reactive and gas-phase species in the form of ions, radicals, excited metastables
and even reactive neutrals like ozone. Each of these species exist over long
distances/times in air allowing them to interact with and ionize samples in the LTP
reaction region. In addition to ionization through proton transfer, electron transfer and
adduct formation, reactive oxygen species like ozone have been used for the ozonolysis
and ionization of fatty acids with LTP.13,14 Taking everything into consideration,
including the fact that sputtering phenomenon have been observed with ambient plasmas
in the literature,1-3 chemical sputtering is considered as the major desorption pathway of
the samples in this chapter.
What is novel in the present work is that chemical sputtering can not only occur
with LTP at atmospheric pressure, but that the ambient sputtering process can produce
ions for MS detection and can consequently be an important mechanism for plasma-based
desorption/ionization. Previous literature has revealed that ambient plasmas are capable
of producing CO2 and H2O from hydrocarbon chains (similar to combustion)3 as well as
gas-phase, neutral metals from solid, metal-containing substrates through a sputtering
process.1,9 However, the LTP-MS analysis of non-volatile alkyl halides and organic salts
reveals that large multi-atom species can be produced by an ambient sputtering process,
in contrast to the atomic and triatomic sputtering products shown in previous work.
Better understanding the mechanism by which chemical sputtering occurs may lead to
increased desorption/ionization capabilities of non-volatile analytes with plasma-based
ionization techniques.

125
5.4.2 Evidence for Chemical Sputtering through Reductive Cleavage
5.4.2.1 Similarities with Solution-Phase Reductive Cleavage and Gas-Phase ETD
An advantage of chemical sputtering over other desorption methods is that it is
based on reactivity. If the reactions responsible for the observed chemical sputtering of
non-volatile halogenated compounds and organic salts can be elucidated, it might be
possible to change the reaction environment to enable or enhance reactivity toward
specific samples (i.e. reactive ionization) or to pursue new reactions altogether. One of
the first pieces in better understanding the chemical sputtering reaction is found in
Figures 5.7B, 5.8A and 5.8B. The presence of the proton-bound dimer of the reaction
products in each of the three mass spectra indicates that a neutral fragment is released
during the LTP-induced chemical sputtering of organic cations. Hence, in the case of the
uronium salt in Fig. 5.7A, neutral tetramethyl urea was necessarily produced to allow
formation of the dimer with protonated tetramethyl urea. This suggests neutral
tetramethyl urea was an intermediate prior to becoming a protonated ion. This means
that a two-step process where neutral tetramethylurea is formed via chemical sputtering
in the first step and released into the gas phase and ionized via proton transfer by reagent
ions in the plasma (i.e. protonated water clusters) in the second step. Note that, similar to
organic salts which are reduced from a cation to a neutral in the chemical sputtering
process, F-SAM was also reduced, except from a neutral to an anion.
This type of cleavage closely resembles electron transfer reactions that have been
observed in solution-phase chemistry. Similar electron transfer reactions have been

126
shown in the gas phase as well and will be briefly discussed below. The solution-phase
reaction is typically done as an electrochemical reaction known as reductive cleavage
with a variety of reagents which include organic salts and alkyl halides. Ross et al.
demonstrated that quaternary ammoniums will get reduced and break apart to a neutral
tertiary amine and an alkyl radical (or carbanion in the two-electron process) during
reductive cleavage (c.f. Scheme 5.1).15
Scheme 5.1 Reductive cleavage of a quaternary ammonium
Note that if the site of electron transfer, the quaternary ammonium in this case, is only
involved in sigma bonds, the incoming electron will occupy an antibonding σ-orbital that
causes the observed α-cleavage of an alkyl group in a concerted mechanism.16 In the
case where the site of the incoming electron is involved in π–bonding (as with
pyridiniums, imidazoliums and uroniums), the reduced radical may exist as an
intermediate (as observed with cyclic voltammetry) but eventually α-cleavage of a σ-
bond is observed.16 These phenomena correspond well with LTP-MS spectra, which
have revealed the production of neutral tertiary amines for quaternary ammoniums
involved in both σ- and π–bonding. However, after their production, the neutral amines
are rapidly protonated in the plasma due to their high basicity and the abundance of
acidic water clusters.

127
Despite a fair amount of literature on the solution-phase electrochemical reaction,
the correlation of the reactivity of the proposed chemical sputtering via reductive
cleavage with solution-phase reductive cleavage was examined using one of the organic
salt reagents. Figure 5.10A shows an image of the crude electrochemical setup on a glass
slide with two graphite electrodes but no reference electrode. Electrochemistry was
carried out for ~2 minutes by placing a 20 µL drop of 1 ppTh acetylcholine chloride to
cover both electrodes and applying 1.5 volts to one electrode and grounding the other.
Figure 5.10B shows a paper spray17 mass spectrum of normal acetylcholine chloride. The
spectrum in Figure 5.10C was acquired after electrochemistry in the methanol-
acetylcholine chloride solution for two minutes. It is clear that the protonated 2-
dimethylaminoethyl acetate product (m/z 132) is not observed before electrochemistry,
but it appears afterwards, just as in the LTP-MS analysis of acetylcholine. Hence, the
reactivity of acetylcholine in the LTP environment is similar to that of the solution-phase
electrochemical reaction.
In contrast to cationic species which yield two neutral fragments upon reductive
cleavage, alkyl halides tend to yield a negatively charged halide and an alkyl radical (c.f.
Scheme 5.1B).
Scheme 5.2 Reductive cleavage of an alkyl halide
Note that the reduction step results in a product with one less charge, so while cations
form two neutral fragments, neutrals like alkyl halides yield an anion and a neutral. In

128
solution phase, reductive cleavage rates vary from molecule to molecule; for example,
alkyl iodides have been observed to have much higher cleavage rates than alkyl fluorides,
due to having weaker carbon-halogen bonds. If reductive cleavage is responsible for the
observed chemical sputtering with LTP-MS, this could explain why carbon-iodide bonds
were readily cleaved in non-volatile samples like thyroxine, while heavily fluorinated
alkyl chains showed a propensity for C-C cleavage. The bond dissociation energy (BDE)
for C-C (~3.6 eV) is weaker than the C-F bond (~5 eV), whereas the BDEs for C-I (~2.5
eV) and C-Cl (~3.4 eV) are lower than the C-C BDE.18
These BDEs can also help explain the LTP-MS spectrum of PCTFE in Fig. 5.4A
in terms of reductive cleavage. Assuming a reductive cleavage process was responsible
for the LTP mass spectrum of PCTFE, ions at m/z 502, 620, 736, etc. are a result of
electron transfer to the CClF carbon. This is because these ions contain one more CClF
(66 Da) than the ions at m/z 436, 554 and 670, and since the other, neutral terminus of the
ion remains constant, CClF is the site where reductive cleavage was initiated for ions at
m/z 502, 620, 736, etc. There are two possible reasons for why the proposed reductive
cleavage at a CClF site occurs at a lower rate than at a CF2 site: 1) the presence of the
chlorine induces less of a partial positive on the carbon which makes it slightly less likely
to take part in electron transfer than a carbon with two fluorines or 2) the C-Cl bond
cleavage competes with the C-C cleavage due to being slightly lower in energy. Either
explanation favors reductive cleavage as the responsible chemical sputtering mechanism.
If chemical sputtering is occurring in the LTP environment through a reductive
cleavage process, a question arises of which species in the plasma causes the reduction.
One obvious candidate would be excited oxygen species due to their role in sputtering

129
processes in previous experiments with ambient plasmas.1-4 Marotta et al. have more
thoroughly investigated the role of excited oxygen anions (O2-, O2(H2O)- and O3
-) by
using APCI to create the ions at atmospheric pressure and then selecting one in the first
quadrupole of a triple quad MS.19 In the second quadrupole they introduced halothane
(CHBrCl-CF3) vapor, allowing its interaction with their selected oxygen anions. The
resulting mass spectra revealed that each of the three species were able to undergo either
dissociative electron transfer or nucleophilic substitution with halothane, suggesting these
reactive oxygen species are capable of causing the reductive cleavage proposed herein
with structurally similar non-volatile samples. Interestingly, similar studies using NO2-,
N2O2- and NO3
-, which are readily formed in ambient plasmas like LTP, revealed no
electron transfer reactions at all. Hence, excited oxygen anions are most likely
responsible for the reactions at hand; however, other possibilities exist including other
anions and reactive neutrals like ozone.
As Marotta et al. also pointed out, the dissociation reactions can occur through
either electron transfer or nucleophilic substitution. LTP-MS data also suggests that both
of these reactions could be taking place. The LTP-MS analysis of F-SAM,
fluoropolymers, and some of the quaternary ammoniums revealed products that could
arise from direct electron transfer as well as products with oxygens covalently attached
which could have been a result of nucleophilic substitution. Unfortunately, it is not
possible to know whether oxygen addition occurred during or after the sputtering process,
so its role as a chemical sputtering reaction is still unclear. However, considering gas-
phase processes in vacuum, two reacting species must first come into a bound orbit
before becoming close enough for electron transfer to occur.20 If the species continue to

130
attract during the collision, they can form a long-lived complex that can lead to covalent
modification. Hence, it is possible that a species like O2- is responsible for the observed
chemical sputtering with LTP via multiple reaction pathways; in some cases the collision
results in electron transfer but in others they become close enough to form a complex
which allows nucleophilic substation.
5.4.2.2 Signal Enhancement with Common Electrochemical Mediator
For many electrochemical processes, the use of electrochemical mediators, such
as tetracyanohydroquinone (TCNQ), has become common to increase the rate of electron
transfer to a target molecule. One important property of an electrochemical mediator is
the formal potential, which should be within a few hundred millivolts to that of the target
molecule (cf. Fultz et al. for a table of common mediators and their formal potentials).21
To further examine if reductive cleavage is taking place, the mediated reductive cleavage
of acetylcholine chloride was attempted using TCNQ as an electrochemical mediator.
TCNQ was mixed with acetylcholine, with each concentration at 10 ppTh. Two µLs of
TCNQ/acetylcholine solution were spotted on one area of a glass slide and two µLs of 10
ppTh of pure acetylcholine in methanol were spotted two cm away. Each spot was
allowed to dry and then exposed to LTP-MS/MS, yielding the chronogram in Figure 5.11
for the MS/MS fragment of m/z 132 at m/z 87. The spot with the TCNQ/acetylcholine
mixture was analyzed three times, resulting in a ~20-fold enhancement. The
enhancement in signal further suggests a reductive cleavage process, in which the rate
can be increased with the right selection of an electrochemical mediator.

131
Due to the significant enhancement in MS signal observed, mediated
electrochemistry is a promising reactive experiment to increase the sensitivity for plasma-
based ambient ionization MS. As has been done extensively with DESI-MS through
general reactive ionization,22 the process of mediated electrochemistry could provide a
means of not only increasing sensitivity, but also extending the range of non-volatile
analytes that can be analyzed with plasma-based ambient ionization. It should be noted
that reactive ionization through mediated electrochemistry with LTP is different from the
general reactive chemistry demonstrated with DESI-MS. Mediated electrochemistry with
LTP is primarily enhancing the desorption process, as this is the part of
desorption/ionization that often limits LTP-MS analyses; whereas with DESI-MS,
reactions are often used to increase ionization efficiency. Carefully choosing gaseous,
liquid or solid mediators to facilitate novel chemical sputtering reactions will be
necessary if plasma-based techniques are going to be able to compete with the desorption
capabilities of ambient ionization sources that rely on solvent-assisted desorption for the
analysis of peptides, proteins, and other heavy molecules.
5.4.3 Novel Reactions with LTP-MS
5.4.3.1 Synthesizing Carboxylate-Terminated Perfluoroalkyl Polymers Directly from Polyvinylidene Fluoride in One Step with an Ambient Plasma
Plasma polymerization has been a common process for the formation of polymer
films since its introduction in the 1960s23 and was later shown to also be successful with
ambient plasmas.24 In forming a polymeric film, one important property is the ability to

132
adhere to a surface. Polytetrafluoroethylene (PTFE), for example, does not adhere well
to many surfaces. However, oxidation of the polymer has been shown to increase
adhesion capabilities,25 which is a process that can be done with an atmospheric-pressure
plasma.26 Besides functionalization capabilities, another advantage of plasma
polymerization is the solvent-free nature of the method, only requiring gases and an
electrical discharge. While the lack of solvents makes for a potentially greener process,
the gaseous monomers used for polymerization can be hazardous and are not ideal to
work with. If possible, a solid reagent could prove to be useful as a precursor for
polymerization.
As previously discussed, ambient plasmas have proven capable of chemically
sputtering species from various non-volatile materials (including polymers). Hence, in
the right environment, plasmas have the ability to both build and break polymers. If the
sputtering process from a solid material can yield typical monomeric units, it would then
be possible to build polymers from a solid precursor in a plasma. Previous reports of
obtaining triatomic sputtering products with ambient plasmas suggest it may be possible
to yield small monomers from large molecular precursors.3 While the solid precursor
could be any type of molecule, it could even be another polymer which gets converted
into a different polymer based on the monomeric units that are formed. In the present
work, a partially fluorinated polymer is converted into a pure perfluorinated polymer with
a carboxylate terminus upon mere exposure to an ambient plasma environment.
The LTP-MS analyses of two different fluoropolymers are shown in Fig. 5.4.
Both analyses reveal chemical sputtering products as most fluoropolymers do under LTP
interrogation. As discussed previously, PTCFE shows an expected distribution of peaks

133
separated by a repeating sequence of 66 and 50 Da for mass differences of CClF and CF2
units respectively. However, the mass spectrum in Figure 5.4B reveals a peculiar
distribution of ions. Despite having a structure of alternating CH2 and CF2 units, the
mass spectrum does not reveal this type of spacing (i.e. peaks alternating in spacing by 14
and 50 Da). Instead, there is a distribution of peaks spaced out by 100 Da at higher
masses (m/z 526 – 726) as well as a distribution spaced out by 14 – 16 Da at lower
masses (m/z 238 – 414). Performing tandem MS on one of the peaks in the distribution
spaced by 100 Da, m/z 526, (cf. Fig. 5.5A and 5.5B for MS4 spectrum and corresponding
structures of ions at each stage of CID) revealed that the ion was a nitric acid adduct of a
perfluorinated alkyl chain of eight carbons with a carboxylate terminus (C9F17O2-•HNO3).
This is the same ion that was detected in the LTP-MS analysis of F-SAM at m/z 526.
The question arises of how -(CH2CF2)n- becomes CF3(CF2)nCO2- (n = 8, 10, 12)
upon mere exposure to an ambient plasma? The most plausible explanation is that these
perfluorinated alkyl chains exist already in the polymer and are merely being chemically
sputtered by LTP. However, there are two reasons why this is unlikely. First, PVDF is
formed by the polymerization of a vinylidene difluoride (H2C=CF2), which is unable to
form a straight perfluorinated chain via traditional polymerization techniques. Secondly,
the spacing of the perfluorinated peaks are spaced 100 Da apart, versus the perfluorinated
ion peaks in the LTP-MS spectrum of F-SAM which were only 50 Da apart. Hence, the
chemical sputtering process should be indiscriminate and cleave at every C-C bond in a
perfluorinated alkyl chain, resulting in peaks separated by 50 Da. The fact that the peaks
are spaced apart by 100 Da indicates that the ions must be created through a
134
polymerization process, which necessarily occurs by sequential addition of monomeric
units (100 Da in the case of tetrafluoroethylene, TFE).
This means that the plasma must be breaking PVDF down into single CF2 units
that then recombine with another CF2 unit to form TFE (F2C=CF2). Once TFE is formed,
it can then rapidly polymerize in the plasma via a typical plasma polymerization process.
It is not known when the carboxylate is added to the polymeric chain, as it could be at the
beginning of polymerization or after the perfluorinated polymer has been formed.
However, the fact that the peaks remained spaced by 100 Da suggests that the
carboxylate may have been present during or even before polymerization occurred,
because if the neutral fluoropolymer was formed without the carboxylate present it
should rapidly fragment via electron transfer dissociation to yield spacing by 50 Da (as
commonly observed with perfluorinated species).
Building a carboxylate-terminated perfluorinated polymer from a partially
fluorinated precursor with an atmospheric and room-temperature plasma is a novel
process with potential applications in materials chemistry. The lack of solvents and gases
(other than a discharge gas which can even be air) make it a green process for potential
applications of preparing polymer films. The example shown is particularly suited for
polymeric films due to the incorporation of the carboxylate terminus on PTFE, leading to
increased adhesion abilities. While the conversion of one polymer to a structurally
different polymer was demonstrated, it should also be possible to form similar polymers
from any molecule with an appropriate abundance of CF2 groups. A potential application
is for the plasma-induced recycling of environmental waste, where it could be useful for
converting partially fluorinated or perfluorinated polymer waste to PTFE films. Such a

135
scale-up could have a significant impact and could even be extended to other non-
fluorinated materials if the right plasma conditions are chosen.
5.4.3.2 Selective Cleavage of Imidazolium Side Chains as a Function of the Anion
As shown in Fig. 5.8, an imidazolium cation can react to lose either side-chain
attached to the nitrogens as a function of the anion. For example, 1E3M will lose an
ethyl group upon LTP exposure when chloride is the counteranion (cf. Fig. 5.8A) but
preferentially loses methyl with a methyl carbonate anion (cf. Fig. 5.8B). Table 5.2
shows data for the LTP-MS analysis of 1E3MI, 1M3PI and 1B3MI with various anions.
Included in the table is the ratio of the methyl loss to the larger R-group loss, where R is
ethyl, propyl and butyl for 1E3MI, 1M3PI and 1B3MI respectively. When harder,
monoatomic anions were the counteranion (Cl-, Br- and I-) the reaction always favored
loss of the larger R-group. In contrast, the use of softer, polyatomic anions (phosphate,
methyl carbonate and acetate) preferentially yielded loss of the methyl group for all three
cations. The one potential outlier is thiocyanate, which when analyzed as a salt with
1B3MI, preferentially favored methyl loss.
While thiocyanate is a polyatomic anion, it is very small, lying somewhere
between acetate and iodide in size. It could be suggested that size or hardness of the
anion plays a role and somehow causes different stacking that leads to the selective
reaction; however, the extent of polarity of the reaction products is quite striking when
looking at the ratios of the side-chain losses. If size/hardness was responsible for the
difference in reactivity, it would be expected that varying the size of the anion would

136
vary the ratio of the side-chain losses such that at some point there is a transition where
the ratio is ~1:1. This does not seem to be the case, as the 1B3M salt with one of the
seemingly transitional anions, thiocyanate, favors the R-loss ~4 orders of magnitude
greater than the methyl loss. There also is no trend towards favoring the methyl loss
more when varying the counteranion from chloride to iodide. Nevertheless, neither
size/hardness nor the stacking of the ionic liquid can be ruled out as contributing to the
selective reactivity. It is worth noting that each of the salts with anions that preferentially
experience R-group loss are all ogygen-containing. It is possible that in the presence of
these oxygen-containing anions, the methyl ester is being formed as opposed to loss of
the R-group. However, there is little evidence to support this claim. While the reason for
the reactivity has yet to be discerned, the fact that these imidazolium salts exhibit very
selective reactivity based on the nature of the anion is novel in and of itself.
5.5 Conclusions
Of the three main parts of this chapter (fluoropolymer analysis, organic salt
analysis and understanding the mechanism of chemical sputtering), there are a few holes
that still need further explanation. In particular, the LTP-MS spectrum of Teflon has not
been fully interpreted as to how the ions are formed and how oxygens are being added to
the perfluoroalkyl chains. In fact, the addition of oxygen to any of the samples is not
fully understood. This is partially due to the fact that the gas-phase reagent that initiates
chemical sputtering is not known. The likely reagent is some sort of reactive oxygen
species (O, O2-, O3
-, O3, etc.) and, depending on the collision, the reaction is either
electron transfer or oxygen addition if a reaction complex is formed. Another possibility

137
for oxygen addition for the cases of F-SAM and Teflon analysis is the reaction of
negatively charged perfluorinated alkyl ions with carbon dioxide to form the carboxylate-
terminated ion. In the case of the organic salts, in addition to not knowing the gas-phase
reagent, the biggest question is concerning the analysis of imidazolium salts. It is clear
that the cleavage of the R-group is a selective process, but the reason for the selectivity is
not clear. It is possibly due to the hardness of the counteranion, and the ion-ion stacking
in the ionic liquid, but further reasoning or even modelling is needed to confirm.
Despite not fully understanding each of the desorption/ionization processes in this
chapter, there have been many significant findings from this work. For the first time,
non-thermal desorption via chemical sputtering with an ambient plasma has been
demonstrated to yield large fragment ions as a significant desorption mechanism for
plasma-based ambient ionization MS. The type of chemical sputtering seems to follow a
reductive cleavage process for many of the samples. This has led to reactive desorption
for the LTP-MS analysis of acetylcholine by addition of a common electrochemical
mediator (TCNQ) with a signal enhancement of ~20. Chemical sputtering with LTP has
also lead to novel reactions via breaking a partially fluorinated polymer into smaller
components and subsequently building a perfluorinated polymer with a carboxylate
terminus as well as the selective side-chain cleavage of ionic liquids based on the
counteranion. It is through the investigation of novel chemical sputtering reactions with
plasma-based ambient ionization sources that the field might one day advance to a
different tier and be able to compete with spray- and laser-based methods by enabling the
desorption/ionization of new non-volatile materials like proteins/peptides.

138
5.6 References
1. Stephens, R. Journal of Analytical Atomic Spectrometry 1988, 3, 1137.
2. Rossmann, K. Journal of Polymer Science 1956, 19, 141.
3. Cooper, G. D.; Prober, M. Journal of Polymer Science 1960, 44, 397.
4. Babaeva, N. Y.; Ning, N.; Graves, D. B.; Kushner, M. J. Journal of Physics D-Applied Physics 2012, 45.
5. Horning, E. C.; Horning, M. G.; Carroll, D. I.; Dzidic, I.; Stillwel.Rn Anal. Chem. 1973, 45, 936.
6. Takats, Z.; Wiseman, J. M.; Gologan, B.; Cooks, R. G. Science 2004, 306, 471.
7. Cody, R. B.; Laramee, J. A.; Durst, H. D. Anal. Chem. 2005, 77, 2297.
8. Salter, T. L.; Gilmore, I. S.; Bowfield, A.; Olabanji, O. T.; Bradley, J. W. Anal. Chem. 2013, 85, 1675.
9. Xing, Z.; Wang, J. A.; Han, G. J.; Kuermaiti, B.; Zhang, S. C.; Zhang, X. R. Anal. Chem. 2010, 82, 5872.
10. Chidsey, C. E. D.; Liu, G. Y.; Rowntree, P.; Scoles, G. Journal of Chemical Physics 1989, 91, 4421.
11. Neto, B. A. D.; Meurer, E. C.; Galaverna, R.; Bythell, B. J.; Dupont, J.; Cooks, R. G.; Eberlin, M. N. Journal of Physical Chemistry Letters 2012, 3, 3435.
12. Xie, W.; Gao, Z.; Pan, W.-P.; Hunter, D.; Singh, A.; Vaia, R. Chemistry of Materials 2001, 13, 2979.
13. Zhang, J. I.; Costa, A. B.; Tao, W. A.; Cooks, R. G. Analyst 2011, 136, 3091.
14. Zhang, J. I.; Tao, W. A.; Cooks, R. G. Anal. Chem. 2011, 83, 4738.
15. Finkelstein, M.; Petersen, R. C.; Ross, S. D. Journal of the American Chemical Society 1959, 81, 2361.
16. Grimshaw, J. In Electrochemical Reactions and Mechanisms in Organic Chemistry; Elsevier B.V.: 2000, p 89.
17. Wang, H.; Liu, J.; Cooks, R. G.; Ouyang, Z. Angewandte Chemie-International Edition 2010, 49, 877.
18. Blanksby, S. J.; Ellison, G. B. Accounts of Chemical Research 2003, 36, 255.

139
19. Marotta, E.; Bosa, E.; Scorrano, G.; Paradisi, C. Rapid Communications in Mass Spectrometry 2005, 19, 391.
20. Gunawardena, H. P.; He, M.; Chrisman, P. A.; Pitteri, S. J.; Hogan, J. M.; Hodges, B. D. M.; McLuckey, S. A. Journal of the American Chemical Society 2005, 127, 12627.
21. Fultz, M. L.; Durst, R. A. Analytica Chimica Acta 1982, 140, 1.
22. Cotte-Rodriguez, I.; Takats, Z.; Talaty, N.; Chen, H. W.; Cooks, R. G. Anal. Chem. 2005, 77, 6755.
23. Goodman, J. Journal of Polymer Science 1960, 44, 551.
24. Donohoe, K. G.; Wydeven, T. Journal of Applied Polymer Science 1979, 23, 2591.
25. Klupfel, B.; Lehmann, D. Journal of Applied Polymer Science 2006, 101, 2819.
26. Okubo, M.; Tahara, M.; Saeki, N.; Yamamoto, T. Thin Solid Films 2008, 516, 6592.

140
Table 5.1 Structures and mass of parent cations and the respective ions that were detected as a result of LTP-MS analysis.
StartingMaterial
MW StructureofStartingMaterial
PredominantLTP‐MSIonDetected
MajorIon(s)m/z
Tetrahexylammoniumbromide
354.41
270
Tetraoctylammoniumbromide
466.53
354
1‐Methylpyridin‐1‐iumchloride
94.06
80
1‐Ethylpyridin‐1‐iumchloride
108.08
80
Benzylhexadecyl‐dimethylammoniumchloride
360.36
270
Acetylcholinechloride
146.12
132
2‐Amino‐N,N,N‐trimethylethan‐
aminiumbromide
103.12
60
3‐Bromo‐N,N,N‐trimethylpropan‐1‐aminiumbromide
180.04
60

141
Table 5.1, continued
Starting Material MW Structure of Starting Material
Predominant LTP-MS Ion Detected
Major Ion(s) m/z
1,3-Diisopropyl-imidazolium
Chloride 153.24
111
1-Butyl-2,3-dimethyl-
imidazolium 153.24
97
2-(2,5-Dioxopyrrolidin-1-
yl)-1,1,3,3-tetramethyluronium
tetrafluoroborate
214.12
NH
N
O
117
FC-135
N,N,N-Trimethyl-3-(perfluorooctylsulfon
amido)propan-1-aminium iodide
599.07
Positive
185 + 50n
(n = 2 – 8)
199 + 50n (n = 2 –
8)
Negative
183 + 50n
(n = 2 – 8)
Thyroxine 776.69 NH2
I
O
I
HO
I
I
O
O
I2- 254

142
Table 5.2 Data for the LTP-MS analysis of 1-ethyl-3-methylimidazolium, 1-methyl-3-propylimidazolium and 1-butyl-3-methylimidazolium as pure samples with various counter-anions. Attention is given to which alkyl side group is lost more preferentially.
Cation Anion Major Ion
Detected with LTP-MS
Methyl- to R-Loss Ratio*
0.0024
0.052
0.00032
18
170
0.00032
83,000
14
0.00022
0.033
0.00013
250
*R represents either the ethyl, propyl or butyl side chain for the respective imidazolium

143
Figure 5.1 A) Diagram of an F-SAM. B) Negative ion LTP mass spectrum of F-SAM at room temperature. C) Structures of three types of ions detected from the LTP-MS analysis of F-SAM (structures were confirmed with accurate and tandem MS).

144
Figure 5.2 LTP-MS analysis of 100 ng of thyroxine from a glass surface in negative ion mode at room temperature.
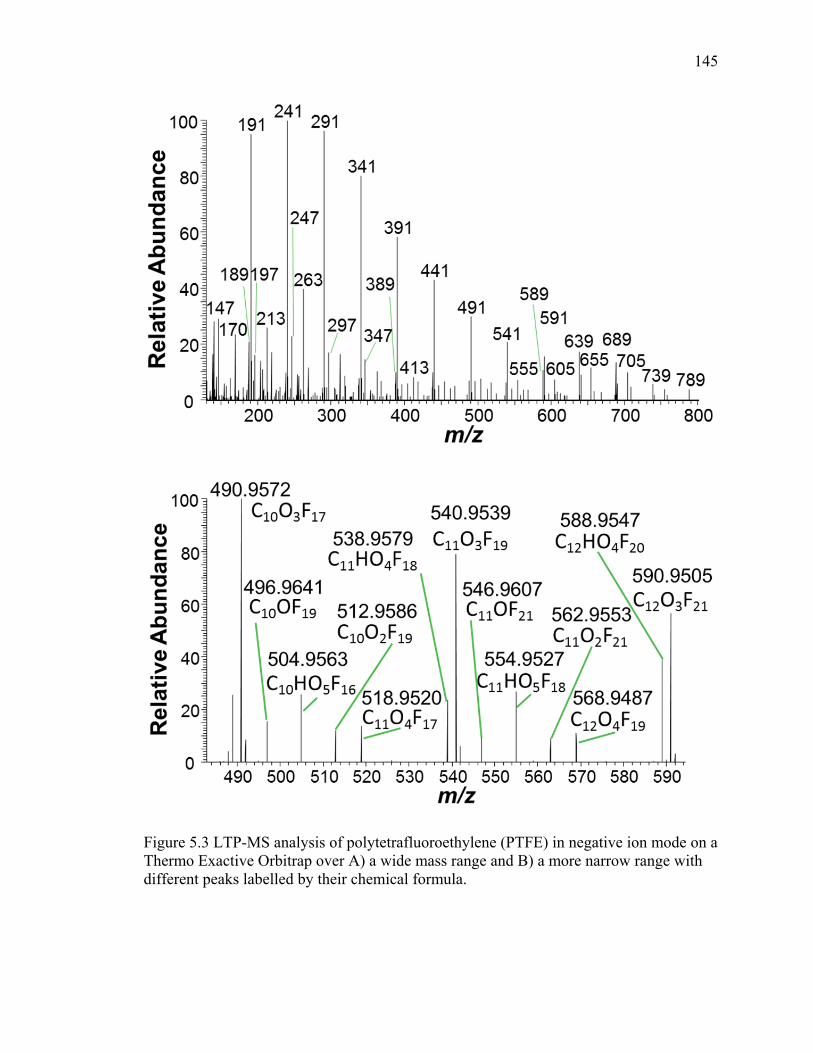
145
Figure 5.3 LTP-MS analysis of polytetrafluoroethylene (PTFE) in negative ion mode on a Thermo Exactive Orbitrap over A) a wide mass range and B) a more narrow range with different peaks labelled by their chemical formula.

146
Figure 5.4 LTP-MS analysis of A) poly(chlorotrifluoroethylene) and B) poly(vinylidene fluoride) in negative ion mode at room temperature.

147
Figure 5.5 A) LTP-MS4 analysis of poly(vinylidene fluoride) in negative ion mode and B) the corresponding ion structures at each stage of the MS4 analysis.

148
Figure 5.6 LTP-MS analysis of A) tetraoctylammonium bromide and B) benzylhexadecyldimethyl ammonium chloride dry from a glass substrate at room temperature in positive ion mode.

149
Figure 5.7 LTP-MS analysis of A) ethylpyridinium bromide and B) 2-(2,5-Dioxopyrrolidin-1-yl)-1,1,3,3-tetramethyluronium tetrafluoroborate dry from a glass substrate at room temperature in positive ion mode.

150
Figure 5.8 LTP-MS analysis of A) 1-ethyl-3-methylimidazolium chloride and B) 1-ethyl-3-methylimidazolium methyl carbonate pure from a glass substrate at room temperature in positive ion mode.

151
Figure 5.9 Selected ion chronogram of m/z 87 from the MS/MS of m/z 132 for the LTP-MS/MS analysis in positive ion mode of acetylcholine from a two µl droplet on a glass substrate at A) ~25 °C, B) ~100 °C and C) 200 °C. Areas of the chronograms are color coated for regions where bulk solvent was still present in a large sample-containing droplet (blue), sample is minimally solvated with very small film of solvent remaining (red), and the sample is dry on the surface (green).

152
Figure 5.10 A) Photo of a crude electrochemical cell used for solution-phase electrochemistry in droplets without a reference electrode. Paper spray mass spectrum in positive ion mode of an acetylcholine chloride solution in water (MS/MS of m/z 132 inset) using methanol as the spray solvent B) before and C) after performing electrochemistry on the acetylcholine chloride solution.

153
Figure 5.11 Selected ion chronogram of m/z 87 from the MS/MS of m/z 132 for switching between the LTP-MS/MS analysis in positive ion mode of two separate dried spots on a glass slide at room temperature. One spot contained pure acetylcholine while the other contained acetylcholine and tetracyanoquinodimethane (TCNQ).

VITA

154
VITA
Joshua Scott Wiley was born and raised in Corydon, Indiana, a small town in the
southern part of the state. He graduated from Corydon Central High School as
valedictorian in May 2004. After high school, he went to Indiana University to pursue a
degree in chemistry. During his sophomore year he was introduced to Prof. Gary Hieftje
and started doing research in his lab the summer between his sophomore and junior years.
It was then that his passion for analytical chemistry began while studying fundamentals
of plasma-based ambient ionization sources, and he won various awards from Indiana
University as well as an American Chemical Society Analytical Chemistry Award in
2007. He also began presenting at technical conferences where he gave his first talk at
Pittcon in 2008 and his first poster at FACSS in 2008 where he won a FACSS student
poster award. In 2008, he continued his pursuit of knowledge in analytical chemistry in
the PhD program at Purdue University as a Ross Fellow working for Prof. R. Graham
Cooks. Working in the Cooks group, he continued studying fundamentals of plasma-
based ambient ionization while working with the low-temperature plasma (LTP) probe.
In fall 2010, he was an awarded a Department of Energy (DOE) Fellowship that was
focused on studying plasma-surface interactions with LTP-MS. Thanks to DOE funding,
he was able to develop a battery-powered, handheld LTP probe for “point-and-shoot” MS
analyses and also began investigating chemical sputtering processes with LTP-MS over a

155
three-year span. His combined work at Purdue and Indiana Universities has resulted in
eight publications with more on the way, and he has given four invited lectures, four non-
invited lectures and a three posters at various conferences internationally. In 2013, he
was selected by Purdue faculty to receive the Thomas W. Keough award for an
accomplished student in mass spectrometry. After graduate school he would like to
pursue a career in either academia or at a national lab.

PUBLICATIONS

156
PUBLICATIONS
1. Wiley, J. S.; Shelley, J. T.; Cooks, R. G., Handheld Low-Temperature Plasma Probe for Portable “Point-and-Shoot” Ambient Ionization Mass Spectrometry. Anal. Chem. 2013, 85 (14), 6545-52.
2. Soparawalla, S.; Tadjimukhamedov, F. K.; Wiley, J. S.; Ouyang, Z.; Cooks, R. G., In-Situ Analysis of Agrochemical Residues on Fruit using Ambient Ionization on a Handheld Mass Spectrometer. Analyst 2011, 136 (21), 4392-6.
3. Shelley, J. T.; Wiley, J. S.; Hieftje, G. M., Ultrasensitive Ambient Mass Spectrometric Analysis with a Pin-to-Capillary Flowing Atmospheric-Pressure Afterglow Source. Analytical Chemistry 2011, 83 (14), 5741-8.
4. Chan, G. C.; Shelley, J. T.; Jackson, A. U.; Wiley, J. S.; Engelhard, C.; Cooks, R. G.; and Hieftje, G. M., Spectroscopic Plasma Diagnostics on a Low-Temperature Plasma Probe for Ambient Mass Spectrometry. Journal of Analytical Atomic Spectrometry 2011, 26 (7), 1434-44.
5. Chan, G. C.; Shelley, J. T.; Wiley, J. S.; Engelhard, C.; Jackson, A. U.; Cooks, R. G.; Hieftje, G. M., Elucidation of Reaction Mechanisms Responsible for Afterglow and Reagent-Ion Formation in the Low-Temperature Plasma Probe Ambient Ionization Source. Analytical Chemistry 2011, 83 (10), 3675-86.
6. Jackson, A. U.; Garcia-Reyes, J. F.; Harper, J. D.; Wiley, J. S.; Molina-Diaz, A.; Ouyang, Z.; Cooks, R. G., Analysis of drugs of abuse in biofluids by low temperature plasma (LTP) ionization mass spectrometry. Analyst 2010, 135 (5), 927-33.
7. Wiley, J. S.; Garcia-Reyes, J. F.; Harper, J. D.; Charipar, N. A.; Ouyang, Z.; Cooks, R. G., Screening of agrochemicals in foodstuffs using low-temperature plasma (LTP) ambient ionization mass spectrometry. Analyst 2010, 135 (5), 971-9.

157
8. Shelley, J. T.; Wiley, J. S.; Chan, G. C. Y.; Schilling, G. D.; Ray, S. J.; Hieftje, G. M., Characterization of Direct-Current Atmospheric-Pressure Discharges Useful for Ambient Desorption/Ionization Mass Spectrometry. Journal of the American Society for Mass Spectrometry 2009, 20 (5), 837-44.

158
To be submitted for publication by the Royal Society of Chemistry as a chapter in
the book entitled Ambient Ionization Mass Spectrometry
Chapter 12: Desorption Electrospray
Mass Spectrometry
Joshua S. Wiley1, Zoltan Takats2, Zheng Ouyang3,4 and R. Graham Cooks1,4
1 Purdue University, Dept. of Chemistry, West Lafayette, IN 47907 USA 2 University of London Imperial College of Science and Technology and Medicine,
Faculty of Medicine, Department of Surgery & Cancer, London SW7 2AZ, England 3 Purdue University, Weldon School of Biomedical Engineering, West Lafayette, IN
47907 USA 4 Purdue University, Center of Analytical Instrumentattion Development, West Lafayette,
IN 47907 USA

159
ABSTRACT
This chapter encompasses applications, fundamentals, instrumentation and future
perspectives of desorption electrospray ionization (DESI) mass spectrometry (MS).
Since it was first reported in 2004, DESI has paved the way for the development of
ambient ionization MS with a wide variety of applications ranging from the analysis of
pharmaceutical and illicit drugs to biological lipids and fatty acids. DESI-MS imaging
has proven to be one of the most important applications of DESI, yielding comparable
data to non-ambient MS imaging techniques for tumor classification, virtual fingerprint
chemical mapping and many other imaging applications. The development of DESI-MS
for such a wide variety of applications has been aided by fundamental studies, which
have established a mechanism in which primary DESI droplets first cause analyte
dissolution followed by splashing from the surface to produce secondary, sample-
containing droplets. A major area that has evolved directly from increased mechanistic
understanding is the development of reactive DESI-MS, where reagents are added so as
to react with analyte in the secondary droplets to yield better specificity and/or ionization
efficiency. In addition to enhancing analytical performance, reactivity in these small
secondary droplets often occurs at rates many orders of magnitude faster than bulk-phase
reactions. Another developing area of DESI-MS application is its use as an intrasurgical
tool to obtain tissue diagnosis including tumor margin assessment. The implementation
of DESI-MS for novel applications like these as well as its use in conjunction with a
portable mass spectrometer is covered.

160
12.1 Background and Concepts
The ability to manipulate ions with electric and magnetic fields is fundamental to
mass spectrometry. Molecular ionization processes can conveniently be grouped into
four main types, electron ionization (EI), chemical ionization (CI), desorption ionization
(DI) and spray ionization (SI). Traditionally, the key MS process of ionization has been
implemented internally, under vacuum. Of the four main types of ionization methods,
only SI in the form of electrospray ionization (ESI) is typically done at atmospheric
pressure. Electrospray ionization (ESI)1 is a solution-based ionization method which is
almost always used with prior liquid chromatography separation. Most sample types are
successfully ionized – and indeed give excellent analytical figures of merit - using one or
other of the traditional ionization methods usually with the aid of prior chromatographic
separation. The special case of rapid, direct ionization of complex mixtures is not
handled well with the traditional methods although there are exceptions for selected
chemical types of analytes, as in the case of alkaloids in plant materials2 where soft
ionization can be used to generate a set of intact ionized molecules followed by the use of
tandem mass spectrometry to obtain structurally characteristic spectra.
Molecular ionization at atmospheric pressure was initiated with the study of
vapors using a differentially pumped interface to the mass spectrometer3 a method that
proved to be very sensitive but one that was poor-suited to mixtures. This volume deals
for the problem of how to analyze complex mixtures directly by mass spectrometry. This
task requires that condensed phase samples be ionized and to do this quickly the
experiment must necessarily be done in air. ESI itself is not suited to such tasks as it
requires taking up the sample in solution and its performance is degraded by salts and

161
competition effects in complex mixture samples. Desorption electrospray ionization
(DESI),4 the subject of this chapter, is a method that extends ESI in such a way as to
allow direct analysis of samples in the solid state. Complex samples can be interrogated
directly because DESI has a built-in sampling step based on solvent extraction. The
successes of this technique encouraged a variety of other methods of generating ions
from native samples in their ordinary environment, that is, ambient ionization mass
spectrometry.5 In all of these methods, the complex sample is interrogated to provide
analyte ions which are transferred into the vacuum system. This selective transfer into
vacuum of a portion of sample material is a further distinction between ambient
ionization and electrospray ionization. So, even though DESI is derived from and related
to electrospray ionization, it is also distinct from it and with the other ambient ionization
methods forms a class of methods that address the problem of rapid, direct mixture
analysis.
The ambient ionization experiments can be divided into categories in several
ways: one method of categorization is based the nature of the principal agency used:
solvent sprays, electrical discharges and lasers. DESI uses a single agency, charged
droplets, to perform the desorption (extraction) step and also the ionization process. In
other cases two separate agents are used as in electrospray laser desorption ionization
(ELDI),6 where the desorption step is performed by a UV-laser and ionization of the
resulting vapor phase neutrals by charged droplets. DESI, as depicted in the schematic in
Figure 12.1, belongs to the spray-based, single agency category.

162
Figure 12.1 Schematic of the DESI-MS experiment
One further comment on ambient ionization is made to note that the term ambient
ionization refers to a particular class of methods used to create ions from samples in the
ambient environment, as just noted. It could also be defined by the objective of the
experiment which is the rapid analysis of ordinary objects in their native environment.
There are methods of ionization which allow ambient analysis but which might also be
termed ambient ionization methods. For example, probe based methods in which a small
sample is removed from an object and ionized by spray ionization might fall into this
class. Such methods include the probes used by Hiraoka.7 To take this point further,
ionization of ordinary objects in their native environment can be performed in two ways:
by direct methods or by sampling methods. The direct methods are by definition ambient
ionization methods. Direct methods allow imaging and avoid the extra physical
manipulations of the sampling methods. However, probe sampling may allow access to
positions difficult to locate directly, relative to MS, although sampling using heated or

163
unheated gas ‘probes’ can achieve sampling by passing over any object from which
sample vapor may be transferred directly into the MS. The use of physical probes
followed by ESI represents an important class of ambient analysis methods.
12.2 Implementation
A DESI source utilizes a solvent flow at 0.5 – 5 µl/min., a nebulizing gas at linear
velocities in the 100 – 250 m/s range and a DC potential in the range of 2 – 5 kV. The
initial charged droplets impact the sample surface and form, by a simple splash,
secondary droplets which contain dissolved analyte and are also electrically changed.
The electric charge leads to coulomb explosion to create smaller droplets and assists in
the formation of dry ions, either by the ion evaporation or by the charge residue model,
both of which are familiar as processes that occur in the standard ESI experiment. Note
that the DESI experiment can be done without applying a voltage and in special cases the
nature of the sample might demand this. This version of the experiment is termed easy
ambient sonic-spray ionization (EASI);8 however, applying voltage increases the
droplets’ charge accumulation and allows for more efficient ionization.
An aspect of DESI that is relatively critical is the angle of the spray emitter with
respect to the surface and MS inlet capillary. The angle between DESI source and
sample surface is typically in the range of 40-70°, but a geometry-independent DESI has
been developed in which the spray moves perpendicularly onto the sample plane and the
sampling inlet is antiparallel to this.9 This is readily implemented using coaxial capillary
to primary and secondary droplets. In addition to direct impact onto the surface by the
charged droplet stream, a transmission mode DESI may be employed, where the DESI
emitter is positioned directly in front of and antiparallel to the MS inlet capillary and the

164
sample placed on a mesh in between the DESI source and the inlet capillary.10 Further
important parameters include the spray tip-to-surface and spray tip-to-MS inlet distances.
12.3 Mechanism
The DESI experiment can be broken down into two main steps: surface wetting
followed by splashing of secondary microdroplets and their transfer to the mass
spectrometer (the DESI phenomenon has been observed to take place also on hot
surfaces, presumably following an alternative mechanism, see below). The first step
requires that the solvent dissolve the analyte from the sample surface. Hence, changing
the solvent will greatly affect the overall ionization efficiency, based on the solubility and
dissolution kinetics of an analyte in the spray solvent. Once the analyte is in solution on
the wetted surface, new droplets impact the surface and cause a splash event in which
secondary analyte-containing microdroplets are ejected. Given that the surface is either
electrically insulated or kept at a non-zero potential relative to the MS inlet, the departing
droplets still carry electric charge, which makes them amenable to the generation of free
gas-phase ions by electrospray-like ionization mechanisms.
The combination of simulations and phase Doppler particle analysis has helped to
confirm the main proposed mechanism. As seen in the histogram of droplet sizes in
Figure 12.2a,11 the average size of the droplets in a typical experiment is 3 µm and the
histogram in Figure 12.2b11 reveals an average velocity of 150 m/s. In addition, the
DESI-MS analysis of thermometer ions has suggested a median internal energy
distribution centered at ~2 eV (cf. Figure 12.2c),12 which is low and similar to ESI and
corresponds well with the soft ionization that is observed with both techniques. In a less
common alternative to the described mechanism, ion formation may occur following

165
neutral molecule desorption into the gas phase, which helps account for DESI observed
on hot and electrically conductive (and grounded) surfaces.
Figure 12.2 A) Histogram of A) diameters of droplets at 5 mm from the sprayer tip with a 2 µL/min solvent flow rate and B) velocities of droplets at 2 mm from the sprayer tip with a 5 µL/min solvent flow rate. Both histograms were obtained using phase Doppler particle analysis with 50% methanol/water solution and a gas pressure of 1130 kPa. C) Calculated breakdown (left) and internal energy (right) curves for DESI and ESI sources using the survival yield method.

166
12.4 Analytical Performance with Small and Large Molecules in Food, Energy and Forensics
12.4.1 Wide Applicability
As a spray-based technique, DESI is able to desorb/ionize samples ranging from
small molecules to salts13 to proteins.14,15 Furthermore, DESI is able to analyze raw
biofluids deposited onto solid carrier surfaces including blood and urine with little matrix
effects. A major advantage of DESI and other spray-based ambient ionization methods is
the ability to derivatize an analyte in the course of ionization to increase sensitivity or
specificity, as discussed in greater detail in the next section. These reactions occur in
small droplets and increase sensitivity and/or specificity, as discussed in greater detail in
the next section. Reactive DESI has allowed the analysis of many analytes that are
difficult to ionize, including steroids,16 triacylglycerol species17,18 and saturated
hydrocarbons.19 Only requiring solvents, voltage and gas flow, DESI is capable of being
coupled with a miniature mass spectrometer and used for in-field analyses. A fieldable
derivative of DESI called Venturi (very easy ambient sonic-spray) has also been
developed; it uses no voltage, no syringe pump and an air canister to supply gas flow.20
Spray-based ambient ionization methods are arguably the most versatile of the
three categories, combining field-portability with wide applicability. Techniques based
on laser desorption/ionization tend to have an excellent mass range, but are less suitable
for in-field analyses. Techniques based on laser desorption/ionization tend to have an
excellent performance for heavier compounds, but are not well-suited to in-field analysis.
Plasma-based techniques rely heavily on thermal desorption as the primary desorption
mechanism, and, consequently, are often limited to lower molecular weight (typically less

167
than m/z 500) and more volatile analytes. However, plasma-based ambient ionization
sources are well-suited for field applicability and various associated small-molecule
applications. One area where both laser- and plasma-based ambient ionization excel over
spray-based methods is for the analysis of non-polar analytes, which is difficult with
DESI-MS but can be achieved as is discussed later in the section on reactive DESI.
12.4.2 Positive/Negative Ions
As is the case with ESI-MS, the ability to produce both negative and positive ions
is easily achieved with DESI by applying a potential the same polarity as that of the
intended ion. In the negative ion mode, the [M-H]- is predominantly detected but
electron transfer and adduct formation can also be observed yielding for example, M-• and
[M+Cl]- ions. Analogously, proton transfer is most common in the positive ion mode,
[M+H]+ ions usually predominating, however, sodium and potassium adducts are also
common and M+• formation occurs for particular analytes.
12.4.3 Trace/Bulk Analysis
A common problem with ESI and especially nanospray ionization deals with the
spray emitter clogging when a large amount of floating material is present in unprepared
native samples. In a DESI-MS experiment, the sample is directly desorbed from a
surface and therefore clogging of the spray emitter is not a factor. This allows the
analysis of bulk samples and raw matrices, especially samples consisting of high salt
content, that are not easily analyzed with ESI or nanospray MS. While the sensitivity of

168
DESI is generally inferior to ESI methods by a small factor, the method features
sufficiently low LOD values (typically sub-nanogram absolute) for most practical
applications.
12.4.4 Necessity of Tandem MS
Any mass spectrum of ions produced under ambient conditions will be polluted
with numerous peaks from contaminants in solvents, air or from surfaces. The number of
peaks increases when performing an ambient MS experiment in which the unprocessed
sample can be a complex mixture of molecules. In Figure 12.3A, is the full-scan DESI-
MS spectrum in negative ion mode of diluted and dried human plasma, containing a
mixture of micronutrients (including folic acid at 50 ppb). While there is a small peak for
the [M-H]- of folic acid at m/z 440, it is hard to discern from chemical noise. Unless the
relative abundance of the analyte of interest within the sample is unusually high, it is
often necessary to use MS/MS to increase specificity and the signal-to-noise ratio to
confirm the presence of an analyte peak. The MS/MS spectrum shown in Figure 12.3B
was taken on the same human plasma sample as in Figure 12.3A; however, the peak at
m/z 440 was isolated and fragmented to unique fragments at m/z 311, 422 and 396, which
correspond to losses of C5H5O4, H2O and CO2 respectively. Tandem MS not only helps
confirm that the analyte of interest is present but also significantly increases the signal-to-
noise ratio.

169
Figure 12.3 A) Full DESI mass spectrum of some drug in blood (should not see large peak for drug). C) DESI-MS/MS spectrum for drug in blood.
12.4.5 Solvents, Surfaces and Mass Range
As a spray-based ionization technique, DESI is capable of desorbing/ionizing
analytes with a wide range of masses. Desorption of an analyte is dependent on
solubility, so it is common to adapt the solvent mixture to capably dissolve the analyte.

170
Besides analyte solubility, the solvent system has to be electrically conductive and
volatile (i.e. it should evaporate without leaving a solid residue) under given experimental
conditions. Mixtures of methanol and water are most commonly used; however,
combinations of acetonitrile, ethanol and dimethylformamide are also used as well as the
addition of a weak acid (i.e. formic or trifluoroacetic acid) to facilitate proton transfer.
Selecting the appropriate solvent mixture is not always sufficient to ensure desorption of
an analyte, due to unfavorable surface tension or dissolution kinetics. While the
successful DESI-MS analysis of proteins has been reported from liquid samples,14,15
attempting DESI-MS from biological tissue yields no protein signal when using typical
DESI spray solvents. The non-covalent interaction of an analyte with the substrate on
which it resides can decrease the probability of desorption, even when working with
surfaces more inert than biological tissue. For example, many analytes yield higher
signal from a Teflon® surface as compared with a glass surface.16
12.5 Applications
As the first ambient ionization method developed, DESI has been used for a wide
variety of applications. In this section, each of the major categories of DESI-MS
applications will be discussed; however, given the extensive use of DESI-MS over the
past near-decade, it will not be possible to cover each and every application.

171
12.5.1 Analysis of Formulated Pharmaceuticals
One application of DESI-MS is for the direct, rapid analysis of pharmaceutical
drug tablets. The ability to sample from a tablet directly, without requiring destruction of
the tablet, makes DESI-MS a practical technique for quality control on pharmaceutical
products. Figure 12.4 (from Chen et al.) shows the DESI-MS spectrum of an Excedrin
tablet (Figure 12.4a), where all three active ingredients (aspirin, acetaminophen and
caffeine) were detected, and a Centrum vitamin tablet (Figure 12.4b) in which thirteen
vitamins were successfully detected (only seven are labeled in the full MS spectrum).21
In addition to the [M+H]+ peaks for acetaminophen and caffeine, the two most abundant
ions in the spectrum are the sodium adducts of acetaminophen and aspirin at m/z 174 and
203 respectively. Chen et al. also reported the ability to measure 2.67 Claritin tablets per
second by having the tablets on a moving belt setup, demonstrating the potential of
DESI-MS for high throughput quality control of pharmaceutical tablets.21 While
pharmaceutical tablets have been heavily targeted with DESI-MS, tablets of illicit drugs
have also been examined as a potential forensics application.22,23

172
Figure 12.4 DESI-MS of an A) Excedrin and B) Centrum vitamin tablet with methanol:water (1:1) in positive ion mode.21
12.5.2 Analysis of Biofluids
While the analysis of tablets is an example of detecting a mixture of analytes at
higher abundances near the % level, the analysis of biofluids containing these drugs or
other metabolites within often requires greater sensitivity. Much effort has been directed
towards the analysis of biomatrices with DESI-MS for a wide variety of applications.

173
Since biological fluids represent mostly liquid phase samples, their DESI-MS analysis
generally requires a simple preparation step, which results in a solid phase sample.
Sample preparation may comprise deposition of fluids onto solid surface followed by
drying or the absorption of biofluid by porous medium (e.g. filter paper). The latter can
also be used to selectively bind interfering matrix components, for instance inorganic
salts by the porous medium. The DESI-MS analysis of urine has been applied to lung
cancer biomarker screening in mice,24 diagnosis of patients with inborn errors in
metabolism,25 screening for anabolic steroids (discussed further in the reactive DESI
section)16 and drugs of abuse.26 Thanks to the non-destructive nature of DESI, skin has
also been analyzed by DESI-MS for the analysis of explosives,27 gunshot residues,28
personal care products29 as well as other areas of forensics and clinical chemistry.30 The
analysis of human plasma with DESI-MS has also been demonstrated for various
purposes.31-33 However, separating blood plasma from whole blood is not always a
necessary step for DESI-MS analyses. The analysis of dried blood spots (DBSs) plays an
important role in the medical community for applications ranging from neonatal
screening to pharmaco-/toxicokinetic studies to therapeutic drug monitoring. DESI-MS
has successfully been applied to the direct analysis of DBSs for model compounds
(sitamaquine, terfenadine, and prazosin), achieving linearity from 10 – 10,000 ng mL-1.34
However, an ambient ionization method which is perhaps more suitable and has been
heavily tested for DBS analysis is paper spray ionization.35

174
12.5.3 Food Safety
A nice review for the DESI-MS analysis of chemical food contaminants has been
prepared by Nielen et al.36 Applications of DESI-MS to food safety include: the analysis
of strobilurin fungicides in wheat,37 agrochemicals on fruits and vegetables,38 arsenic
speciation on animal feeds and plant foods,39 Sudan dyes in food,40 dithiocarbamate
fungicides in fruit,41 lipid profiling of bacteria,42 triglycerides in foods18 and melamine in
milk.43 The number of applications extend beyond these listed and should only continue
to grow as demanded. As mentioned by Nielen et al., the ability for DESI-MS to be
performed on site to provide qualitative or semi-quantitative information makes it an
intriguing approach for sample pre-screening in the field, limiting the number of samples
that get sent back to the lab.
12.5.4 Forensic and Public Safety
As with food safety, DESI-MS has also been heavily applied to forensics, and a
recent review detailing the areas of forensics that have been targeted has been written by
Morelato et al.44 Again, the ability for in situ analyses has warranted the wide
application of DESI-MS to forensic studies, which demands rapid, direct and efficient
methodologies for in-field analyses. Some of the forensic applications that have been
targeted by DESI-MS include: the analysis of illicit drugs, gunshot residues, explosives,
inks and counterfeited documents, fingerprints, and chemical warfare agents. Explosives
have also been analyzed by DESI on a miniature MS.45 Currently, many in-field forensic
investigations are performed with ion mobility or Raman spectrometers, which lack the

175
overall combination of sensitivity, specificity and broad applicability of MS. As
miniature MS instruments continue to develop and become smaller,46 they should
eventually replace these techniques, with ambient ionization as the means of directly
sampling from crime scene materials, luggage at airport security, etc.
12.5.5 Microorganisms (bacteria, algae, embryos)
In close relation to public and food safety, microorganisms have been another
targeted area for DESI-MS analysis. As mentioned previously, various types of bacteria
have been analyzed and distinguished based on their distinct lipid profiles.42 Also relying
on lipid signatures, a recent effort has been made to chemically study oocytes, blastocysts
and embryos.17,47,48 In a study where pre-implanted embryos were obtained at various
stages and directly analyzed with DESI-MS, two- and four-cell embryos were seemingly
more synthetically active than unfertilized oocytes with a wider range of phospholipids
detected as well as higher fatty acid signals.49 While phospholipids and fatty acids have
been an excellent target analyte for the characterization of various microorganisms due to
their ability to readily form anions, sometimes it is necessary to choose a target analyte
which might not form an ion of either polarity very well. In a study where DESI-MS was
performed directly on marine algal tissue, various anions (e.g. Cl- and Br-) were added to
the spray solvent to increase the sensitivity for the detection of bromophycolide (an
antimicrobial chemical defense agent) in a reactive DESI experiment.50

176
12.6 Reactive DESI
12.6.1 Concept/Overview
Reactive ionization is an emerging area of ambient mass spectrometry and is
based on adding reagents which can derivatize an analyte in order to enhance desorption
or ionization abilities. This is typically done by converting an analyte to a charged
product or one that can be efficiently ionized. In a DESI-MS experiment, this is typically
done by putting the derivatizing reagent in the spray solvent while the analyte is on a
surface. After impact with primary reagent-containing droplets, secondary droplets are
emitted from the surface, which contain a distribution of both compounds, allowing
reactions to occur. Despite the small reaction times between dissolution of the analyte
and drying of the droplets in the inlet capillary, a wide variety of reactions have been
demonstrated with DESI-MS. In fact, results have indicated that reactions often occur at
accelerated rates in the confined droplets. One likely reason is the large change in pH
that occurs as a result of the voltage applied and the decreasing droplet size which
promote acid/base-catalyzed chemistry. Two reactions that have been demonstrated are
shown in Schemes 12.1 and 12.2 below. The first utilized phenylboronic acid to
recognize cis-diol functionalities at a surface due to the selective ability to form the cyclic
boronate (cf. Scheme 12.1).51 In Scheme 12.2 is the reaction of boric acid with
phosphonate esters, commonly used as chemical warfare agents, to form the hydrolysis
product.52 The various types of reactions that have been demonstrated with DESI-MS are
discussed in this section.

177
Scheme 12.1
Scheme 12.2
12.6.2 Steroids
Two closely related reactions have been demonstrated for the DESI-MS analysis
of ketosteroids, which represent an intriguing target for analytical methods due to the use
of illegal anabolic steroids and testosterone in sports. The first DESI-MS reaction with
ketosteroids involved the addition of hydroxylamine in the spray solvent, which becomes
protonated during the electrospray process and can attack the carbonyl of the steroid.16
As observed in Scheme 12.3, the oxime is the final product; however, the intermediate
shown in the scheme just after hydroxylamine addition has been detected at a higher
abundance than the oxime. Figure 12.5a shows the reactive DESI mass spectrum of 20
ng of epitestosterone where hydroxylamine was doped into the spray solvent. Note that
while the oxime (m/z 304) was detected with higher abundance than the intermediate
(m/z 322), this was not observed for all ketosteroids and DESI conditions.16

178
Figure 12.5 Reactive DESI-MS of A) 20 ng of epitestosterone with hydroxylamine16 and B) 200 ng of cortisone with Girard’s Reagent T.53
Scheme 12.3
R1 R2
O H2N OH
HR1 R2
HN OH2
OH
R1 R2
NH
HO
MajorProduct
Oxime
H2O-

179
Another reaction that has been demonstrated with ketosteroids is shown in Scheme 12.4,
and is similar to the hydroxylamine reaction except that a hydrazine, Girard’s reagent T
(GT), was used to attack the carbonyl.53 The advantage of using GT is that it has a
permanent charge, which remains with the product after formation, ultimately increasing
sensitivity as a result of not having to ionize the product. Figure 12.5b shows a reactive
DESI mass spectrum of 200 ng of cortisone where GT was doped into the spray solvent.
The major product was the hydrazone as shown in Scheme 12.4, labeled as [MGT]+ in
the mass spectrum at m/z 474.3.
Scheme 12.4
12.6.3 Oxidation Reactions
While a reaction involving covalent bond formation between a reagent in the
spray solvent and a surface-bound analyte is typical for reactive DESI, there are other
routes of reactive ionization with DESI-MS. One such alternative is based on
electrochemistry and can be done with or without the addition of reagents into the spray
solvent. For this to occur, special DESI spray conditions (namely higher voltages) are
required. In this experiment, which has been used to oxidize carboxylic acids54 as well as
saturated hydrocarbons,19 a discharge is formed as a result of the higher-than-normal

180
electric field and results in the formation of oxygen radicals which are very strong
oxidizing agents. In a case where reagents, such as iodine and potassium bichromate,
were added to the spray solvent, signal enhancement over two orders of magnitude was
achieved for the oxidation of dibutyl dithiocarbamate to form M+•.55 Interestingly, this
enhancement was only observed during the short timescale of mixing during DESI-MS;
whereas, allowing the reagents to be mixed together longer during an electrosonicspray
ionization (ESSI) MS experiment allowed other reactions to occur and much less
enhancement of M+• signal was observed.
12.6.4 Metal Attachment
As with electrochemistry, another reactive DESI approach that does not require
covalent bond formation is through metal adduction, which is a non-covalent association
between a metal ion and a neutral analyte molecule. For some analytes, the ability to
bind to a charged metal ion is highly favorable and results in increased
specificity/sensitivity. This has recently been achieved by the addition of silver to the
spray solvent, which is able to readily form stable adducts with olefins.56 In this study,
AgNO3 was doped into the spray solvent and used for the analysis of various unsaturated
lipids and fatty acids, providing greater specificity and up to 50 times signal
enhancement. Further application of Ag+ cationization has been demonstrated for the
analysis of bovine oocytes, in which adduction with Ag+ allowed detection of
triacylglycerol.17 Silver cations are also intriguing for other applications, such as
chelation with aromatic compounds through pi-stacking;57 although this has not been
demonstrated with DESI-MS. While other metals may also result in adduct formation

181
with analytes, there have been no such reports for DESI-MS besides Na+ and K+ adducts
which often occur without doping their salts into the spray solvent. However, other
adducting reagents have been doped into the DESI spray for various applications
including chloride and trifluoroacetate for explosives27,58 and bromophycolides50 as well
as ammonium for triglycerides.18
12.6.5 Cholesterol/Betaine Aldehyde
As a marker for monitoring heart disease such as triglycerides, cholesterol is
another analyte that is difficult to ionize but has also been detected with reactive DESI-
MS. The reaction involved the use of betaine aldehyde, which is susceptible to
nucleophilic attack by the alcohol functional group in cholesterol (ca. Scheme 12.5 for
general reaction scheme).59 The hemiacetal was detected at m/z 488.6 for the reactive
DESI-MS analysis of cholesterol. The ability to detect cholesterol by reactive DESI was
further demonstrated directly from rat brain tissue while keeping track of the spatial
distribution of cholesterol along with phospholipids, an experiment known as mass
spectral imaging.
Scheme 12.5

182
12.7 DESI-MS Imaging
12.7.1 Introduction
Perhaps one of the most intriguing applications of DESI-MS is for the 2-D
mapping of chemical entities from a surface in an experiment known as MS imaging.
Historically, secondary ion mass spectrometry (SIMS) and matrix-assisted laser
desorption ionization (MALDI) have been used extensively for MS imaging and are
capable of resolving chemical features on a surface at less than ~100 nm with SIMS60 and
at just a few microns with MALDI-MS. While both of these techniques offer better
spatial resolution than DESI-MS, which can be as low as 30 µm, the advantage of
imaging with DESI-MS stems from the ability to analyze a surface with no pretreatment
at atmospheric pressure. Hence, there are no interferences from matrix ions as observed
with MALDI-MS and the possibility of sample contamination is greatly reduced.
Another advantage of imaging with DESI-MS is due to its nondestructive nature. With
no morphological damage to the sample during DESI interrogation, it can then be used
for other studies without concern of any information loss.61 Applications of DESI-MS
imaging have ranged from plant, animal and human tissues to human fingerprints for
forensics; each of which will be discussed further.
12.7.2 Tissue
Analysis of lipids in human/animal tissue is perhaps the most explored and
fascinating application of DESI-MS imaging. The unique distribution of lipids in
different types and/or disease states of tissue allows appropriate classification when

183
relative abundances of the ionized lipids are compared in the mass spectra. Fortunately,
many lipids have high ionization efficiencies and are easily detected with DESI-MS. As
a result, many types of tissue have been analyzed from a wide variety of animals with
DESI-MS, including brain,62-64 bladder,65,66 spinal cord,67 prostate,68 kidney,69 eye lens70
and adrenal glands.71 As an example of distinguishing different types of tissue, Figures
12.6a and 12.6b reveal DESI mass spectra of gray and white matter (respectively) from a
mouse brain. It is clear that the lipid profiles are very different between the gray and
white matter, with m/z 834.4 (a phosphatidylserine, PS 18:0/22:6) as the base peak in the
gray matter and m/z 888.8 (a sulfatide, ST 24:1) the base peak in white matter. Two-
dimensional images of the relative abundances of these peaks are plotted in Figures 12.6c
and 6d. When the two ion images are overlaid, there is a clear distinction between the
gray and white matter regions (Figure 12.6e). If the mouse brain is sliced throughout its
entirety, 2D images can be acquired and stacked for each tissue section, resulting in a
three-dimensional image as in Figure 12.7.

184
Figure 12.6 Negative ion mode mass spectrum of A) gray and B) white matter of a mouse brain. The 2D plot (or ion image) of C) m/z 834.4 and D) m/z 888.8 as well as E) the overlaid ion images of m/z 834.4 and 888.8.

185
Figure 12.7 3D models of the mouse brain by DESI-MS. Top, side, and cross-sectional views are shown for the 3D construction of the distribution of a) PS 18:0/22:6 in green b) ST 24:1 in red, and c) the transparent overlaid distributions of PS 18:0/22:6 and ST 24:1.
Not all DESI-MS imaging applications are this clear-cut in terms of being able to
distinguish between different types of tissue. A prime example, and major application of
DESI-MS imaging, is in the identification and classification of the disease state of tissue,
especially cancerous versus noncancerous tissue. This has been pushed even further in
some studies which have been able to determine the stage of diseased tissue, such as
distinguishing astrocytoma grades,62 using DESI-MS imaging. Classification of the
disease state of tissue is often achieved by monitoring relative distributions of lipids
and/or fatty acids and analyzing with a statistical classification method such as principle
component analysis (PCA). Mass spectral data is then correlated with H&E stains read
by a pathologist. For many samples the distribution of fatty acids and lipids is enough to
allow the classification of cancerous versus noncancerous tissue with the aid of PCA, as

186
observed in the DESI-MS imaging of dog and human bladders.65,66 In the case of human
prostate, classification of tissue by lipid and fatty acid profiles was difficult; however,
cholesterol sulfate was found to be a cancer biomarker and allowed for accurate
correlation of 64 of 68 tissue samples.68
12.7.3 Natural Products
Imaging of natural products is an intriguing application of DESI-MS due to the
real possibility of imaging live organisms since no matrices are required and the
ionization process is non-destructive and can be done with biologically-friendly solvents.
The use of reactive DESI-MS to allow the detection of fungal inhibitors on tropical
seaweed, as discussed previously, was also performed as an imaging experiment by Lane
et al., revealing patches of the bromophycolides on the surface at sufficient
concentrations for fungal inhibition.72 One problem with directly imaging an organism
without first cutting it into sections with smooth surfaces is due to large deviations in
signal that can occur as a result of spraying to/from a rough surface. One method of
overcoming this has been to make an imprint of the sample to be imaged and then acquire
the DESI-MS image from the smooth imprinted surface. The use of imprints for DESI-
MS imaging has been applied to characterization of bacterial culture products73 as well as
various tissues including barley leaves,74 St John’s wort and Jimson weed,75 Lam seed
and mouse brain,76 and various plant leaves for measuring nonfluorescent chlorophyll
catabolites.77 Many of these experiments were also performed directly on the sample as
well, but imprints were used due to yielding better performance.

187
12.7.4 DESI Imaging in Forensics
One of the first applications of DESI-MS imaging was for the analysis of inks,
with a forensics focus on identifying counterfeited documents by distinguishing which
dyes were used on which regions of the document.78 Another application which has
gained a large amount of public interest is the DESI-MS imaging of latent fingerprints.79
For a typical crime scene investigation, the ability to merely match a fingerprint’s pattern
with that of a suspect is a powerful route of incrimination. However, the ability to
combine chemical information with visualization of the pattern can be very useful. One
such example is when multiple fingerprints overlap on a surface. The ability to correlate
certain chemicals with each fingerprint can allow the distinction and visualization of each
fingerprint, which otherwise would not have been possible. In addition, searching for
various drugs or their metabolites within the fingerprint could provide insight into the
mental state of the suspect.
12.7.5 Spatial Resolution
Spatial resolution is defined as the shortest distance at which two distinct features
may be resolved in an MS image. Since the onset of the field of MS imaging, there has
been a great amount of interest in increasing spatial resolution (i.e. decreasing the
distance at which features can be resolved). While some analyses require very high
spatial resolutions, as with MS imaging of single cells, the time required must be taken
into consideration. For every decrease in the pixel size for an imaging experiment, the
number of pixels and, consequently, time of acquisition increases quadratically for a

188
constant overall image area. Initial attempts to measure the spatial resolution of DESI-
MS were done by Ifa et al. by scanning over ink lines, suggesting a spatial resolution less
than 200 µm.80 In general, a standard DESI-MS imaging experiment provides a spatial
resolution of about 180 µm; however, there has been a push to go even lower with reports
by Kertesz et al. suggesting ~40 µm resolution for printed patterns on paper,81 while
Campbell et al. reported ~35 µm resolution for DESI-MS imaging of mouse brain.82 For
each of these studies, various parameters including gas back pressure, capillary sizes,
solvent selection and solvent flow rate were carefully tuned to achieve a spatial resolution
below 50 µm. Further improvements in spatial resolution are possible, but will likely
require added engineering in the design of the DESI source.
12.7.6 Data Analysis Strategies
Data analysis is generally aimed either at the determination of the concentration
of certain species on the surface or the classification of the mass spectra obtained from
spatially well-defined areas of the sample. A typical example for the former case is the
quantification of drug molecules and drug metabolites in tissue sections, while pixel-by-
pixel histological classification of mass spectrometric images represents a good instance
for the latter case. Nevertheless, in both cases the DESI imaging data requires data pre-
processing, comprising mass spectrometric calibration, normalization of the signal and
optional co-registration of mass spectrometric data with any other – usually optical –
image of the sample. Mass spectrometric recalibration is critical in case of high-
resolution time-of-flight (TOF) analyzers, since these the mass accuracy drift of these
instruments can be significant within the timeframe of an imaging experiment (up to a

189
few tens of hours). Normalization of signal is expected to compensate for the overall
instrumental fluctuation of signal intensity. Various normalization strategies have been
described including normalization to TIC, median intensity or certain, arbitrarily chosen
peaks in the spectra, which are expected to show uniform concentration within the
sample. Since DESI-MS imaging is non-destructive, the analysis is usually followed by
morphological imaging, comprising histological staining and optical imaging (scanning).
In order to establish correlation between the two types of data, co-registration is
necessary with accuracy better than half of the MS pixel diameter. Co-registration
algorithms allow translation, rotation and two dimensional stretching of images, in order
to maximize the overlap.
Coarse quantification of certain detected species is easily achievable by
visualizing the normalized intensity distribution of the corresponding molecular ion,
however this approach provides only relative values and also does not take into account
the different matrix effects taking place in different tissue types. More accurate
quantification requires the determination of histology-dependent response factors by the
parallel analysis of the corresponding tissue types by DESI-MS and LC-MS at different
concentration levels.
DESI-MS imaging datasets can also be interpreted as a set of MS profiles
associated with the biochemical/clinical status of the tissues. Since the individual spectra
are treated as spectroscopic fingerprints, no identification or quantification of detected
species is required. In these cases at first an authentic ‘training’ or ‘learning’ dataset is
acquired, which serves as a basis to create a multivariate statistical model. This model is
used for the identification of unknown spectra in the test datasets. As an example, DESI-

190
MS imaging data was collected from a colon adenocarcinoma set and spectra were
analyzed using a combination of principal component analysis and linear discriminant
analysis. Statistical models were created to separate DESI-MS fingerprints of different
histological tissue types (mucosa, adenocarcinoma, smooth muscle) and also patients
with different predictive tumor marker statuses and the models were validated for test
sets. Although the multivariate approach has tremendous value regarding the
identification of tissue types, the training sets are expected to represent population-level
variance of the spectral fingerprints which may require the analysis of several hundreds
of samples for a single pathology. Further problems are associated with the experimental
variance of DESI-MS data, which may exceed the biological/histological variance,
making proper identifications difficult. Further standardization of DESI imaging
parameters and development of more robust hardware (especially regarding spray
emitters) is expected to lift these constraints and allow the construction of global,
histologically-specific DESI-MS spectral libraries available for all users worldwide.
12.8 Future Perspectives
12.8.1 Miniature Mass Spectrometers and in situ Analysis
Miniature mass spectrometers have been in development for quite some time, but
until the recent develop of discontinuous atmospheric pressure interface (DAPI),83
miniature MS had been based on reduced pressure ionization. The advent of DAPI,
which affords the limited pumping ability of a miniature instrument by pulsing gas/ion
191
introduction to just 10-20 ms of a ~1 second duty cycle, has allowed the use of various
ionization sources which operate at atmospheric pressure. Most importantly, the
coupling of ambient ionization with miniature MS is possible, which is ideal for rapid, in
situ analyses. As previously discussed, the ability to perform MS/MS is essential for
these types of analyses, so a geometrically-simplified version of the linear ion trap has
been employed which uses planar electrodes, the rectilinear ion trap (RIT).84 The other
advantage of using an ion trap mass analyzer is due its ability to operate at higher
pressure in comparison to most other mass analyzers.
12.8.2 Synchronized and Inductive DESI
While DESI has been coupled to miniature MS in the laboratory setting,45,83,85,86
sampling efficiency and the need for high gas flow rates have made actual in situ
analyses rather impractical. A method of mitigating both of these issues is by ion source
and MS sampling synchronization. Many mass analyzers are pulsed, only introducing
ion packets over small time windows, while the majority of the time is used for ion
transfer and mass analysis. To better optimize sampling, a synchronized DESI-MS
experiment has been demonstrated in which voltage is applied inductively and both gas
and solvent flows are pulsed in synchronization with ion introduction into the MS.87 This
has resulted in an overall reduction of N2 flow from 2 L min-1 to 0.2 L min-1, solvent flow
from 5 µL min-1 to 0.5 µL min-1 as well as 100-fold increases in sensitivity and sampling
efficiency. Figure 12.8a shows a schematic of this setup on a miniature MS instrument,
with the overall pulse sequence of potentials used in the synchronized experiment in
Figure 12.8b. Figures 12.8c and 12.8d show the synchronized DESI-MS of 10 ng

192
cocaine on a glass substrate and standard DESI-MS of 1 µg cocaine on a glass substrate,
respectively. Despite analyzing 100 times less sample in with synchronized DESI-MS,
the signal for cocaine at m/z 304 is still higher.
Figure 12.8 Synchronized DESI-MS A) schematic and B) pulse sequence. C) Synchronized DESI-MS cocaine (10 ng) and D) standard DESI-MS of cocaine (1 μg), both from a glass slide.
12.8.3 Endoscopic Diagnostics using DESI
DESI sampling/ionization using charged droplets allows direct analysis of
endogenous compounds from biological tissues.64,88 The characteristic lipid profiles
assist in the diagnosis of pathology. To extend the method further, we are exploring the
use of DESI and related methods for intra-surgical and endoscopic procedures, where in-
vivo chemical analysis would provide molecular information potentially of value for
decision-making. A MS system with a sampling probe that can be fitted into an

193
endoscope would enable this capability. Analytes on the tissue are ionized and
transferred to the MS for analysis. However, to apply the DESI method in-vivo, the
conditions of the ambient ionization need to be biocompatible. The high voltage (4-5
kV) and organic solvents typically applied for DESI cannot be used. The damage to the
tissue surface also needs to be minimal and previously introduced histologically
compatible solvents like N,N-dimethylformamide (DMF) / ethanol61 cannot be used.
An MS sampling probe designed for endoscopic chemical analysis uses charged
droplets for sampling but with a number of signification modifications to minimize
physical damage to biological tissues. 89 As shown in Figure 12.9, the sampling probe
consists of a capillary sprayer and a coaxial transmission tube. The fronts of the capillary
sprayer and transmission tube are bundled together to form an endoscopic probe. The
capillary sprayer is made of two silica capillaries, one inside another. The inner capillary
is used to deliver solvent (4-8 μL/min) while the outer capillary is used for deliver
auxiliary nitrogen gas (1.5 - 5.2 L/min). When the open end of the endoscopic probe is
placed at the sampling spot, the spray plume generated from the capillary sprayer
bounces back carrying chemicals extracted from the sampling tissue through the
transmission tube. Transport of droplets through the transmission tube and into MS inlet
allows spectra to be recorded. As a demonstration, a rat brain tissue section was analyzed
with the sampling probe and the spectra recorded from white matter and grey matter
agree with previous DESI results.

194
9
Figure 12.9 (a) Schematic setup of endoscopic sampling ionization probe. The probe is used to collect spectra from a rat brain tissue on the (b) white matter and (c) grey matter, respectively.
This long distance ion transport tubing allows ions to be transported over 4 m,90
which is adequate for endoscopic applications. The use of pure water as the DESI
solvent provides higher single intensity after the transportation, presumably due to the
slower but more efficient desolvation of water droplets in the tubing. The high voltage
used in DESI was also abandoned just as is done in sonic-spray ionization, since the high
velocity gas flow provides enough signal intensity (Figure 12.9b). Typically, a tissue
section would be damaged by the high velocity gas flow, but this can be simply solved by
introducing a pulling force to drag the gas backward into the MS inlet with an additional
diaphragm pump (Figure 12.9c). With all these features, the endoscopic sampling probe
is suitable for in-situ and non-invasive biological analysis. The endoscopic sampling

195
probe can be coupled with a portable Mini 12 mass spectrometer, 91 which provides real
time MS measurement at the point-of-care. This system could provide specific chemical
information about biological tissues for biomedical studies and clinical diagnostics in the
doctor's offices or the surgery.
12.9 Acknowledgements
The authors acknowledge support of their work by National Science Foundation (CHE
13-07264) and the National Institutes of Health (EB015722-01). J.S.W. acknowledges
fellowship support from the US Department of Energy.

196
12.10 References
(1) Fenn, J. B.; Mann, M.; Meng, C. K.; Wong, S. F.; Whitehouse, C. M. Science 1989, 246, 64.
(2) Kondrat, R. W.; Cooks, R. G. Anal. Chem. 1978, 50, A81.
(3) Horning, E. C.; Horning, M. G.; Carroll, D. I.; Dzidic, I.; Stillwel.Rn Anal. Chem. 1973, 45, 936.
(4) Takats, Z.; Wiseman, J. M.; Gologan, B.; Cooks, R. G. Science 2004, 306, 471.
(5) Monge, M. E.; Harris, G. A.; Dwivedi, P.; Fernández, F. M. Chemical Reviews 2013, 113, 2269.
(6) Shiea, J.; Huang, M. Z.; Hsu, H. J.; Lee, C. Y.; Yuan, C. H.; Beech, I.; Sunner, J. Rapid Commun. Mass Spectrom. 2005, 19, 3701.
(7) Hiraoka, K.; Nishidate, K.; Mori, K.; Asakawa, D.; Suzuki, S. Rapid Commun. Mass Spectrom. 2007, 21, 3139.
(8) Haddad, R.; Sparrapan, R.; Eberlin, M. N. Rapid Commun. Mass Spectrom. 2006, 20, 2901.
(9) Venter, A.; Cooks, R. G. Anal. Chem. 2007, 79, 6398.
(10) Chipuk, J. E.; Brodbelt, J. S. J. Am. Soc. Mass Spectrom. 2008, 19, 1612.
(11) Venter, A.; Sojka, P. E.; Cooks, R. G. Anal. Chem. 2006, 78, 8549.
(12) Nefliu, M.; Smith, J. N.; Venter, A.; Cooks, R. G. J. Am. Soc. Mass Spectrom. 2008, 19, 420.
(13) Sokol, E.; Jackson, A. U.; Cooks, R. G. Central European Journal of Chemistry 2011, 9, 790.
(14) Ferguson, C. N.; Benchaar, S. A.; Miao, Z.; Loo, J. A.; Chen, H. Anal. Chem. 2011, 83, 6468.
(15) Miao, Z.; Wu, S.; Chen, H. J. Am. Soc. Mass Spectrom. 2010, 21, 1730.
(16) Huang, G.; Chen, H.; Zhang, X.; Cooks, R. G.; Ouyang, Z. Anal. Chem. 2007, 79, 8327.
(17) Gonzalez-Serrano, A. F.; Ferreira, C. R.; Pirro, V.; Eberlin, L. S.; Heinzmann, J.; Lucas-Hahn, A.; Niemann, H.; Cooks, R. G. Reproduction Fertility and Development 2013, 25, 262.
(18) Gerbig, S.; Takats, Z. Rapid Commun. Mass Spectrom. 2010, 24, 2186.
(19) Wu, C.; Qian, K.; Nefliu, M.; Cooks, R. G. J. Am. Soc. Mass Spectrom. 2010, 21, 261.
(20) Santos, V. G.; Regiani, T.; Dias, F. F. G.; Romao, W.; Jara, J. L. P.; Klitzke, C. F.; Coelho, F.; Eberlins, M. N. Anal. Chem. 2011, 83, 1375.
(21) Chen, H. W.; Talaty, N. N.; Takats, Z.; Cooks, R. G. Anal. Chem. 2005, 77, 6915.

197
(22) Leuthold, L. A.; Mandscheff, J. F.; Fathi, M.; Giroud, C.; Augsburger, M.; Varesio, E.; Hopfgartner, G. Rapid Commun. Mass Spectrom. 2006, 20, 103.
(23) Rodriguez-Cruz, S. E. Rapid Commun. Mass Spectrom. 2006, 20, 53.
(24) Chen, H. W.; Pan, Z. Z.; Talaty, N.; Raftery, D.; Cooks, R. G. Rapid Commun. Mass Spectrom. 2006, 20, 1577.
(25) Pan, Z. Z.; Gu, H. W.; Talaty, N.; Chen, H. W.; Shanaiah, N.; Hainline, B. E.; Cooks, R. G.; Raftery, D. Anal. Bioanal. Chem. 2007, 387, 539.
(26) Kauppila, T. J.; Talaty, N.; Kuuranne, T.; Kotiaho, T.; Kostiainen, R.; Cooks, R. G. Analyst 2007, 132, 868.
(27) Justes, D. R.; Talaty, N.; Cotte-Rodriguez, I.; Cooks, R. G. Chemical Communications 2007, 2142.
(28) Zhao, M.; Zhang, S.; Yang, C.; Xu, Y.; Wen, Y.; Sun, L.; Zhang, X. Journal of Forensic Sciences 2008, 53, 807.
(29) Salter, T. L.; Green, F. M.; Faruqui, N.; Gilmore, I. S. Analyst 2011, 136, 3274.
(30) Katona, M.; Denes, J.; Skoumal, R.; Toth, M.; Takats, Z. Analyst 2011, 136, 835.
(31) Chipuk, J. E.; Gelb, M. H.; Brodbelt, J. S. Anal. Chem. 2010, 82, 4130.
(32) Kennedy, J. H.; Wiseman, J. M. Rapid Commun. Mass Spectrom. 2010, 24, 309.
(33) Xu, G.; Chen, B.; Liu, G.; Yao, S. Analyst 2010, 135, 2415.
(34) Wiseman, J. M.; Evans, C. A.; Bowen, C. L.; Kennedy, J. H. Analyst 2010, 135, 720.
(35) Wang, H.; Liu, J.; Cooks, R. G.; Ouyang, Z. Angew. Chem.-Int. Edit. 2010, 49, 877.
(36) Nielen, M. W. F.; Hooijerink, H.; Zomer, P.; Mol, J. G. J. Trac-Trends Anal. Chem. 2011, 30, 165.
(37) Schurek, J.; Vaclavik, L.; Hooijerink, H.; Lacina, O.; Poustka, J.; Sharman, M.; Caldow, M.; Nielen, M. W. F.; Hajslova, J. Anal. Chem. 2008, 80, 9567.
(38) Garcia-Reyes, J. F.; Jackson, A. U.; Molina-Diaz, A.; Cooks, R. G. Anal. Chem. 2009, 81, 820.
(39) Ziqing, L.; Mengxia, Z.; Sichun, Z.; Chengdui, Y.; Xinrong, Z. Analyst 2010, 135, 1268.
(40) Chen, H. W.; Zhang, X.; Luo, M. B. Chinese Journal of Analytical Chemistry 2006, 34, 464.
(41) Cajka, T.; Riddellova, K.; Zomer, P.; Mol, H.; Hajslova, J. Food Additives and Contaminants Part a-Chemistry Analysis Control Exposure & Risk Assessment 2011, 28, 1372.

198
(42) Zhang, J. I.; Talaty, N.; Costa, A. B.; Yu, X.; Tao, W. A.; Bell, R.; Callahan, J. H.; Cooks, R. G. Int. J. Mass Spectrom. 2011, 301, 37.
(43) Shuiping, Y.; Jianhua, D.; Jian, Z.; Bin, H.; Jianqiang, L.; Huanwen, C.; Zhiquan, Z.; Xiaolin, Q. Anal. Chem. 2009, 81, 2426.
(44) Morelato, M.; Beavis, A.; Kirkbride, P.; Roux, C. Forensic Science International 2013, 226, 10.
(45) Sanders, N. L.; Kothari, S.; Huang, G.; Salazar, G.; Cooks, R. G. Anal. Chem. 2010, 82, 5313.
(46) Xu, W.; Manicke, N. E.; Cooks, G. R.; Ouyang, Z. Jala 2010, 15, 433.
(47) Ferreira, C. R.; Eberlin, L. S.; Hallett, J. E.; Cooks, R. G. Reproduction Fertility and Development 2012, 24, 132.
(48) Hallett, J. E.; Ferreira, C. R.; Eberlin, L. S.; Cooks, R. G. Reproduction Fertility and Development 2012, 24, 163.
(49) Ferreira, C. R.; Pirro, V.; Eberlin, L. S.; Hallett, J. E.; Cooks, R. G. Anal. Bioanal. Chem. 2012, 404, 2915.
(50) Nyadong, L.; Hohenstein, E. G.; Galhena, A.; Lane, A. L.; Kubanek, J.; Sherrill, C. D.; Fernandez, F. M. Anal. Bioanal. Chem. 2009, 394, 245.
(51) Chen, H.; Cotte-Rodriguez, I.; Cooks, R. G. Chemical Communications 2006, 597.
(52) Song, Y.; Cooks, R. G. Journal of Mass Spectrometry 2007, 42, 1086.
(53) Girod, M.; Moyano, E.; Campbell, D. I.; Cooks, R. G. Chem. Sci. 2011, 2, 501.
(54) Benassi, M.; Wu, C. P.; Nefliu, M.; Ifa, D. R.; Volny, M.; Cooks, R. G. Int. J. Mass Spectrom. 2009, 280, 235.
(55) Nefliu, M.; Cooks, R. G.; Moore, C. J. Am. Soc. Mass Spectrom. 2006, 17, 1091.
(56) Jackson, A. U.; Shum, T.; Sokol, E.; Dill, A.; Cooks, R. G. Anal. Bioanal. Chem. 2011, 399, 367.
(57) Nikolova-Damyanova, B. Journal of Chromatography A 2009, 1216, 1815.
(58) Cotte-Rodriguez, I.; Takats, Z.; Talaty, N.; Chen, H. W.; Cooks, R. G. Anal. Chem. 2005, 77, 6755.
(59) Wu, C. P.; Ifa, D. R.; Manicke, N. E.; Cooks, R. G. Anal. Chem. 2009, 81, 7618.
(60) Benninghoven, A. Surf. Sci. 1994, 299, 246.
(61) Eberlin, L. S.; Ferreira, C. R.; Dill, A. L.; Ifa, D. R.; Cheng, L.; Cooks, R. G. Chembiochem 2011, 12, 2129.
(62) Eberlin, L. S.; Dill, A. L.; Golby, A. J.; Ligon, K. L.; Wiseman, J. M.; Cooks, R. G.; Agar, N. Y. R. Angew. Chem.-Int. Edit. 2010, 49, 5953.
(63) Eberlin, L. S.; Ifa, D. R.; Wu, C.; Cooks, R. G. Angew. Chem.-Int. Edit. 2010, 49, 873.

199
(64) Wiseman, J. M.; Ifa, D. R.; Song, Q.; Cooks, R. G. Angew. Chem.-Int. Edit. 2006, 45, 7188.
(65) Dill, A. L.; Eberlin, L. S.; Costa, A. B.; Zheng, C.; Ifa, D. R.; Cheng, L.; Masterson, T. A.; Koch, M. O.; Vitek, O.; Cooks, R. G. Chemistry-a European Journal 2011, 17, 2897.
(66) Dill, A. L.; Ifa, D. R.; Manicke, N. E.; Costa, A. B.; Ramos-Vara, J. A.; Knapp, D. W.; Cooks, R. G. Anal. Chem. 2009, 81, 8758.
(67) Girod, M.; Shi, Y.; Cheng, J.-X.; Cooks, R. G. Anal. Chem. 2011, 83, 207.
(68) Eberlin, L. S.; Dill, A. L.; Costa, A. B.; Ifa, D. R.; Cheng, L.; Masterson, T.; Koch, M.; Ratliff, T. L.; Cooks, R. G. Anal. Chem. 2010, 82, 3430.
(69) Dill, A. L.; Eberlin, L. S.; Zheng, C.; Costa, A. B.; Ifa, D. R.; Cheng, L.; Masterson, T. A.; Koch, M. O.; Vitek, O.; Cooks, R. G. Anal. Bioanal. Chem. 2010, 398, 2969.
(70) Ellis, S. R.; Wu, C.; Deeley, J. M.; Zhu, X.; Truscott, R. J. W.; Panhuis, M. I. H.; Cooks, R. G.; Mitchell, T. W.; Blanksby, S. J. J. Am. Soc. Mass Spectrom. 2010, 21, 2095.
(71) Wu, C.; Ifa, D. R.; Manicke, N. E.; Cooks, R. G. Analyst 2010, 135, 28.
(72) Lane, A. L.; Nyadong, L.; Galhena, A. S.; Shearer, T. L.; Stout, E. P.; Parry, R. M.; Kwasnik, M.; Wang, M. D.; Hay, M. E.; Fernandez, F. M.; Kubanek, J. Proc. Natl. Acad. Sci. U. S. A. 2009, 106, 7314.
(73) Watrous, J.; Hendricks, N.; Meehan, M.; Dorrestein, P. C. Anal. Chem. 2010, 82, 1598.
(74) Li, B.; Bjarnholt, N.; Hansen, S. H.; Janfelt, C. Journal of Mass Spectrometry 2011, 46, 1241.
(75) Thunig, J.; Hansen, S. H.; Janfelt, C. Anal. Chem. 2011, 83, 3256.
(76) Ifa, D. R.; Srimany, A.; Eberlin, L. S.; Naik, H. R.; Bhat, V.; Cooks, R. G.; Pradeep, T. Anal. Methods 2011, 3, 1910.
(77) Muller, T.; Oradu, S.; Ifa, D. R.; Cooks, R. G.; Krautler, B. Anal. Chem. 2011, 83, 5754.
(78) Ifa, D. R.; Gumaelius, L. M.; Eberlin, L. S.; Manicke, N. E.; Cooks, R. G. Analyst 2007, 132, 461.
(79) Ifa, D. R.; Manicke, N. E.; Dill, A. L.; Cooks, G. Science 2008, 321, 805.
(80) Ifa, D. R.; Wiseman, J. M.; Song, Q.; Cooks, R. G. Int. J. Mass Spectrom. 2007, 259, 8.
(81) Kertesz, V.; Van Berkel, G. J. Rapid Commun. Mass Spectrom. 2008, 22, 2639.
(82) Campbell, D. I.; Ferreira, C. R.; Eberlin, L. S.; Cooks, R. G. Anal. Bioanal. Chem. 2012, 404, 389.

200
(83) Gao, L.; Cooks, R. G.; Ouyang, Z. Anal. Chem. 2008, 80, 4026.
(84) Ouyang, Z.; Wu, G. X.; Song, Y. S.; Li, H. Y.; Plass, W. R.; Cooks, R. G. Anal. Chem. 2004, 76, 4595.
(85) Keil, A.; Talaty, N.; Janfelt, C.; Noll, R. J.; Gao, L.; Ouyang, Z.; Cooks, R. G. Anal. Chem. 2007, 79, 7734.
(86) Sokol, E.; Noll, R. J.; Cooks, R. G.; Beegle, L. W.; Kim, H. I.; Kanik, I. Int. J. Mass Spectrom. 2011, 306, 187.
(87) Huang, G. M.; Li, G. T.; Ducan, J.; Ouyang, Z.; Cooks, R. G. Angew. Chem.-Int. Edit. 2011, 50, 2503.
(88) Wu, C.; Dill, A. L.; Eberlin, L. S.; Cooks, R. G.; Ifa, D. R. Mass Spectrometry Reviews 2013, 32, 218.
(89) Chen, C.-H.; Lin, Z.; Garimella, S.; Zheng, L.; Shi, R.; Cooks, R. G.; Ouyang, Z. Analytical chemistry 2013, Under Review.
(90) Garimella, S.; Xu, W.; Huang, G. M.; Harper, J. D.; Cooks, R. G.; Ouyang, Z. Journal of Mass Spectrometry 2012, 47, 201.
(91) Li, L.; Chen, T.-C.; Ren, Y.; Hendricks, P. I.; Cooks, R. G.; Ouyang, Z. Analytical chemistry 2013, Under Review.

Handheld Low-Temperature Plasma Probe for Portable “Point-and-Shoot” Ambient Ionization Mass SpectrometryJoshua S. Wiley, Jacob T. Shelley,† and R. Graham Cooks*
Department of Chemistry and Center for Analytical Instrumentation Development (CAID), Purdue University, 560 Oval Drive, WestLafayette, Indiana 47907, United States
*S Supporting Information
ABSTRACT: We describe a handheld, wireless low-temper-ature plasma (LTP) ambient ionization source and itsperformance on a benchtop and a miniature massspectrometer. The source, which is inexpensive to build andoperate, is battery-powered and utilizes miniature heliumcylinders or air as the discharge gas. Comparison of aconventional, large-scale LTP source against the handheldLTP source, which uses less helium and power than the large-scale version, revealed that the handheld source had similar orslightly better analytical performance. Another advantage ofthe handheld LTP source is the ability to quickly interrogate a gaseous, liquid, or solid sample without requiring any setup time.A small, 7.4-V Li-polymer battery is able to sustain plasma for 2 h continuously, while the miniature helium cylinder supplies gasflow for approximately 8 continuous hours. Long-distance ion transfer was achieved for distances up to 1 m.
Miniaturization of analytical instrumentation for port-ability and field-applicability has been of interest in
many areas of science. A common hurdle in development ofportable instruments is maintenance of adequate analyticalperformance in a more compact and potentially lesssophisticated device. Raman spectroscopy1 and X-ray fluo-rescence (XRF)2 have overcome the hurdles to portability andare commonly used in the field. Maintaining appropriateanalytical performance with any technique requires presenta-tion of the sample to the instrument so it can be efficiently andeffectively probed. Methods such as attenuated total reflectancefor IR absorption spectroscopy3 and laser-induced breakdownspectroscopy (LIBS)4 for atomic emission spectroscopy havesubstantially simplified the sampling process and have beenproven useful for portable instrumentation.Among analytical instruments, none possess the ability to
provide a measurement as specific, sensitive, and broadlyapplicable as mass spectrometry (MS), capabilities that can beaccentuated by using tandem MS to enable complex-mixtureanalysis. An intriguing approach to sample collection andintroduction is through ambient ionization MS, whichincorporates direct sampling and desorption ionization from asample in its native environment in one step. While initially adifficult task, miniature MS instruments now have the ability tointroduce ions formed in the ambient environment into thereduced-pressure mass analyzer by limiting ion introduction toa short period of time via a discontinuous atmospheric-pressureinterface (DAPI).5 Using DAPI, the coupling of ambientionization sources with miniature mass spectrometers enablesrapid, in situ analysis of complex mixtures without samplepretreatment;6,7 however, this coupling has mostly beenachieved in the laboratory setting due to the lack of true
source portability. While many of the ambient ionizationmethods have shown impressive performance and simplifiedprocedures, they are often bulky when considering the gases,solvents, electrical power, and/or solvent pumps that areneeded for operation. This limits the size reduction as well asincreases setup time. For example, desorption electrosprayionization (DESI)8 requires a syringe pump for solvent flow aswell as gas flow rates of approximately 1 L/min. There alsoexists ambient ionization sources based on lasers,9−11 which arecurrently not portable but have been demonstrated to desorbviruses, bacteria, and blood cells for MS analysis12 and can becombined with electrospray ionization (ESI) for increasedionization efficiency.13 Consequently, there is still a need for ahandheld and portable device with the ability to easilyinterrogate surfaces.Of the many ambient ionization sources,14 only a few exhibit
the properties necessary for complete portability. One suchtechnique is paper-spray ionization,15 which requires triangularpieces of paper to deposit the sample, solvent, and a powersupply providing ∼4 kV. A related technique has utilizedwooden toothpicks instead of paper, making it easier to samplefrom some surfaces.16 A modified version of DESI, Venturi easyambient sonic-spray ionization (V-EASI),17 can also be madeportable because a syringe pump is not required and canned aircan be used to supply the nebulizing gas.18
Plasma-based ambient ionization techniques are an intriguingapproach for portability due to their inherent lack of solvent
Received: May 2, 2013Accepted: May 30, 2013Published: May 30, 2013
Editors' Highlight
pubs.acs.org/ac
© 2013 American Chemical Society 6545 dx.doi.org/10.1021/ac4013286 | Anal. Chem. 2013, 85, 6545−6552
201

and generated waste, as well as the ability to change thedischarge gas composition for improved desorption/ionizationcapabilities.19,20 Plasma assisted desorption/ionization(PADI)21 has been demonstrated as a potentially portableambient ionization source without the need for a pressurizedgas.22 Another plasma-based approach that meets all of therequirements for portability is low-temperature plasma (LTP)ambient ionization, based on a room-temperature dielectricbarrier discharge.23 The LTP operates at gas flow rates below100 mL/min with power of less than 1 W, requirements thatcan be met by a miniature helium tank and small batteries. Nosolvents or liquid/gas pumps are necessary. In addition, theability to directly analyze solid, liquid, and gaseous samples withLTP-MS allows for a wide variety of applications.23−25
Here, we present the development and application of the firsthandheld and wireless LTP source for point-and-shoot analysisusing both benchtop and miniature mass spectrometers. Theentire source, including consumables such as helium and power,is enclosed in a handheld device weighing ∼0.9 kg. Varioussamples have been analyzed to compare the analyticalperformance of the handheld source to the LTP sourcedescribed by Harper et al.,23 as well as the effects of heliumversus air as the discharge gas. A long-distance ion transportinterface from the sampling region to the MS inlet hasdemonstrated analysis of samples at locations that arenonproximate to the mass spectrometer.
■ EXPERIMENTAL SECTIONChemicals and Reagents. Pesticide analytical standards
were purchased from Dr. Ehrenstorfer GmbH (Ausburg,Germany) and from Riedel de Haen, Pestanal quality (Seelze,Germany). Analytical standards of explosives were purchasedfrom Cerilliant Corporation (Round Rock, Texas). Individualpesticide and explosive stock solutions (200−300 μg mL−1)were prepared in methanol and stored at −20 °C. Workingsolutions were prepared by appropriate dilution withacetonitrile. A Milli-Q-Plus ultrapure water system fromMillipore (Bedford, MA, USA) was used to obtain HPLC-grade water. HPLC-grade acetonitrile and methanol wereobtained from Mallinckrodt Baker Inc. (Phillipsburg, NJ, USA).Handheld Low-Temperature Plasma Ion Source. The
handheld LTP source consisted of a battery-powered circuit, aglass tube for plasma formation, a miniature helium cylinderwith a regulator (49615HeK, Leland Limited Inc., SouthPlainfield, NJ, USA), and a plastic housing (A9056208, OKWEnclosures, Inc., Bridgeville, PA, USA). The circuit, convertinga low amplitude DC potential to a high amplitude AC potential,is discussed in greater detail in the Results and Discussionsection. Parts used for the circuit consisted of an N-channelMOSFET (497-2758-5-ND, Digi-key, Thief River Falls, MN,USA), 555 timer (497-1963-5-ND, Digi-key, Thief River Falls,MN, USA), 6-V regulator (497-1444-5-ND, Digi-key, ThiefRiver Falls, MN, USA), step-up transformer (28K077,Information Unlimited, Amherst, NJ, USA), and a 7.4-V, 900mAh lithium polymer battery (Tenergy Corp., Fremont, CA,USA). The entire source cost less than $290 USD in parts,which included $198 USD for the gas regulator.The actual LTP probe used was a smaller version of one
reported previously.23 A 1/16 in. Swagelok tee was used toconnect a 1.6 mm o.d. PEEK gas line, a borosilicate capillary(1.6 mm o.d., 0.86 mm i.d.), and a grounded stainless-steel wire(32 AWG) that is coaxially positioned inside the glass capillary.The gas line contains an additional 1 cm long piece of PEEK
capillary (100 μm i.d., 1.6 mm o.d.) to restrict He flow to theplasma to extend the lifetime of the miniature He cylinder; theflow rate could be controlled by adjusting the outlet pressureon the helium regulator. The high-voltage electrode on theoutside of the glass tube consisted of a coiled and soldered wire(approximately 2 mm in width) positioned such that theinternal grounded wire terminated in the center of the externalelectrode. The external electrode was connected to the high-voltage output from the secondary winding of the transformer.A mechanical trigger connected to the positive terminal of thebattery completed the circuit and, along with the flow of eitherHe or air as discharge gas, enabled plasma formation. It isimportant to note that, when air was used as the discharge gas,it was typically supplied by a large cylinder of compressed air.However, a small diaphragm pump (NMP015M, KNFNeuberger, Inc., Trenton, NJ, USA) can also be used to supplyflowing air to the plasma region by supplying 6 V (regulated)from the battery; the pump greatly increased powerconsumption and was not used in these studies to conservebattery power. This small pump adds minimal weight (65 g)and size to the device while providing sufficient air flow tosustain the discharge.
Benchtop Mass Spectrometer. Initial experiments wereperformed using a benchtop Thermo LTQ linear ion trap massspectrometer (Thermo Fisher Scientific, San Jose, CA) tunedfor optimum detection of the precursor ion of interest via theXcalibur software. LTP-MS analyses were performed in thepositive- and negative-ionization mode, making no changes tothe source including the applied voltage, and spectra werecollected with automatic gain control enabled, a maximum ion-trap injection time of 200 ms, and 2 microscans per spectrum.The main experimental parameters were: capillary temperature:200 °C; tube lens: −65 V; capillary voltage: −15 V. Tandemmass spectrometry experiments (MS/MS) were performed viacollision-induced dissociation (CID) in order to confirm thepresence of particular agrochemicals in the studied samples.These experiments were performed using an isolation windowof 1.5 Th and 25−35% collision energy (manufacturer’s scale).Long-distance ion transport was achieved with a directconnection of a one-meter-long Tygon tube (1/8 in. o.d. and1/16 in. i.d.) to the LTQ inlet capillary, which pulled ions (andair) into the LTQ from a Tygon and Teflon sampling vesselthat enclosed the LTP sampling region when placed flush withthe sample.
Miniature Mass Spectrometer. Miniature mass spec-trometer experiments were performed using a Mini 10.5 massspectrometer as described by Gao et al.5 Key features includethe use of a rectilinear ion trap (RIT), TPD011 hybridturbomolecular pump (Pfeiffer Vacuum Inc., Nashua, NH), atwo-stage diaphragm roughing pump (KNF Neuberger Inc.,Trenton, NJ), and a discontinuous atmospheric pressureinterface (DAPI); all combined as a compact device weighing∼10 kg and consuming less than 75 W. The DAPI consisted ofa pinch valve (390NC24330, ASCO Valve Inc., Florham Park,NJ) surrounding conductive tubing (i.d. of 1.6 mm., an o.d. of3.2 mm., and a length of 5.0 cm), which was connected to twocapillaries. A transfer capillary (i.d. One mm, o.d. 1.6 mm, 5 cmlength) was connected via Swagelok fittings to allow directinjection of ions into the RIT while the sampling capillary (i.d.250 μm, o.d. 1.6 mm, 10 cm length) was filed to a point andexposed to the atmosphere. Upon application of a variable 5 Vpulse from the Mini 10.5, the pinch valve would open for ashort period of time, which allowed packets of air/ions from
Analytical Chemistry Editors' Highlight
dx.doi.org/10.1021/ac4013286 | Anal. Chem. 2013, 85, 6545−65526546
202

atmosphere to enter the ion trap. Mini 10.5 operatingconditions include: 15 ms DAPI open time, m/z 50−500mass range, and grounded and nonheated inlet capillary. MS/MS was performed via notch broadband isolation and resonantexcitation of the mass-selected ion.Safety Considerations. Exposed, ac high voltages were
present at the LTP source and mass spectrometer inlet.Electrically insulating gloves and extreme care were used toprevent electrical shock. Material safety data sheets for allchemicals used were consulted prior to performing experi-ments.
■ RESULTS AND DISCUSSION
Specifications for Handheld LTP. A diagram, photograph,and circuit schematic of the handheld LTP probe are shown inFigure 1. The overall weight of the source is 910 g, whichreduces to ∼280 g when air is used as the discharge gas due tothe replacement of the helium cylinder and regulator by adiaphragm pump. The parts for the source are easy to assembleand inexpensive, with most of the cost being that of theregulator. The incorporation of a PEEK flow restrictor reducedhelium flow rates to 100 mL/min or less, depending on theback pressure supplied by the regulator. With this configurationand a back pressure of ∼70 kPa, there was sufficient helium inthe cylinder to sustain the plasma for over 8 h. In addition, thesimple, battery-operated power supply (Figure 1b) was able topower the plasma with ∼2 kVp‑p at 100 kHz for over 2 hcontinuously. It should be noted that the total time ofoperation of the source in the field is much longer, consideringthe power supply is only triggered as needed; the helium supplymay be turned off while not in use for a prolonged lifetime aswell, typically lasting 8−10 h before requiring a battery rechargeor new helium cylinder. The circuit utilized a 7.4 V, 900 mAhLi-polymer battery, which was down-regulated to 6 V for circuitstability by a voltage regulator. The constant 6 V output wasapplied to one lead of the primary winding of a transformer aswell as a 555 timer. The output of the 555 timer, which waswired in an astable configuration with a repetition rate of ∼100kHz with 50% duty cycle, was connected to the gate of an N-channel MOSFET. The drain of the MOSFET was connectedto the other lead on the primary winding of the transformer,
while the source of the transistor was held at ground. One endof the secondary winding provided the high-voltage ACwaveform for the LTP, while the other was grounded. Eventhough the input to the transformer was a square wave, thecircuit behaves as a resonant LC circuit, so the output closelyresembles a sine wave.
Handheld LTP Testing Using Benchtop MS. TabletAnalysis. The performance of the handheld LTP probe wascharacterized through various applications on a conventionalbenchtop ion-trap instrument. Pharmaceutical tablet analysishas been a targeted application for ambient MS analysis sincethe onset of the field,22,26−29 acting as a demonstration of directsample analysis with no preparation. The mass spectra recordedfor the direct analysis of a headache relief tablet with thehandheld LTP-MS (acquired with a Thermo LTQ) revealedthe three active ingredients: caffeine, acetaminophen, andaspirin (Supporting Information, Figure S1). In the positive-ionmode, the ion [M + H]+, where M indicates an intact molecule,was detected for all three compounds at 195 Th for caffeine,152 Th for acetaminophen, and 181 Th for aspirin. Numerousadduct and fragment peaks were also evident, especially foraspirin. The same experiment was also done in the negative-ionization mode, without changing any of the ion-sourcesettings. Analysis of the tablet in the negative-ion moderevealed a small peak for the proton-abstraction ion, [M − H]−,of aspirin at m/z 179 as well as a fragment ion at m/z 137, [M− H − C2H2O]
−, as the most abundant peak (Figure S1b,Supporting Information). No negative ions were detected foracetaminophen or caffeine because of their high gas-phasebasicities. The assignment of each of the detected species wasverified with MS/MS.
Large-Scale vs Handheld LTP. One important metric of thehandheld, portable version of the LTP probe is how well itcompares with the large-scale LTP probe (Table 1). Theconditions used for the large LTP were those used in theoriginal optimization.23 The large-scale LTP source wasoperated with a lower-frequency voltage waveform, increasedvoltage/power, increased helium flow rates, and within a largerdiameter glass tube compared to the handheld LTP probe.Figure 2 displays MS/MS data recorded for a commonagrochemical, atrazine (24 pg, absolute on surface), using thelarge-scale (Figure 2a) and handheld (Figure 2b) LTP with a
Figure 1. (a) Schematic, (b) photograph, and (c) circuit schematic of the handheld LTP ionization source.
Analytical Chemistry Editors' Highlight
dx.doi.org/10.1021/ac4013286 | Anal. Chem. 2013, 85, 6545−65526547
203

Thermo LTQ. The fragmentation observed is due to propeneloss from [M + H]+.Using optimized conditions for each probe on the same MS
instruments, the absolute signal was slightly greater with thehandheld LTP probe (S/N ∼22) than for the handheld probe(S/N ∼16). This trend was also true for most other analyteswhen comparing the two sources. Of eleven agrochemicalsanalyzed, LODs ranged from being essentially identical toabout an order of magnitude better with the handheld LTPsource (Table 2). While the small discrepancies in LODsbetween the large-scale and handheld LTP source could beattributed to various instrumental and operating parameters,including gas-flow profile, source-to-sample orientation, anddetector efficiency, it is clear that reducing the power and
helium flow for the handheld LTP did not negatively affect theanalytical performance.
Effect of Discharge Gas: Air vs Helium. The handheld LTPprobe can be operated using either helium or simply air asdischarge gas. To remain consistent in comparing the use of anair and a helium discharge, similar voltages were used for eachgas, which included the use of the same PEEK flow restrictorand a large cylinder with a back pressure of 140 kPa. It shouldbe noted that, while the voltage was held constant for thehelium and air plasmas, the current necessarily was not,resulting in different currents/powers for the two discharges.Figure 3 shows tandem mass spectra using a handheld LTPwith a Thermo LTQ for the detection of 1.2 ng of theagrochemical isoproturon obtained with helium and air,respectively, and revealing fragment ions at 72 and 165 Th.Interestingly, the signal was approximately twice as high withhelium compared to air. The LODs obtained for the analysis ofother agrochemicals that readily undergo proton transfer(Table 2) were typically 1−2 orders of magnitude better withhelium. Trinitrotoluene (TNT) was a unique example whereno analyte ions were detected with air LTP, despite being ableto readily detect analyte ions with helium LTP. Thisphenomenon is attributed to the fact that TNT ionizes byeither deprotonation or electron attachment, while the elevenpesticides undergo protonation. The use of air enforces adifference in the LTP sampling region, so that neitherionization mechanism can take place for TNT. This point is
Table 1. Specifications of Handheld LTP versus Large-ScaleLTP
handheld LTP large-scale LTP
frequency, kHz 100 2.8voltage, kV ∼2 5−15gas flow, mL/min <100 ∼400weight, kg 0.910 ∼67a
probe O. D., mm 1.5 6.35probe I. D., mm 0.86 3.75
aWeight includes LTP source, function generator, DC power supply,gas regulator, and a 6.9 kL helium gas cylinder.
Figure 2. Atrazine (24 pg) MS/MS spectra recorded with (a) large-scale and (b) handheld LTP acquired using a Thermo LTQ and optimizedconditions for each LTP probe.
Analytical Chemistry Editors' Highlight
dx.doi.org/10.1021/ac4013286 | Anal. Chem. 2013, 85, 6545−65526548
204

Table 2. Limits of Detection for Various Analytes
LODsa (ng)
analyte category analyte air handheld LTP He handheld LTP He large-scale LTP He handheld LTP/mini MS
pesticides amitraz 0.3 0.05 0.8 50atrazine 0.01 0.003 0.005 0.1buprofezin 0.2 0.004 0.04 0.2DEET 0.2 0.04 0.003 0.6diphenylamine 0.6 0.04 0.07 0.2ethoxyquin 300 0.9 8 30isofenphos-methyl 6 0.09 1 10isoproturon 0.7 0.04 0.2 6malathion 5 0.2 0.7 1paration-ethyl 0.2 0.05 0.01 200terbuthylazine 0.004 0.001 0.006 0.3
explosives RDX 0.02 0.02 n.m. n.m.TNT n.d. 0.02 n.m. n.m.PETN 0.2 0.05 n.m. n.m.Tetryl 2 2 n.m. n.m.
aLODs were calculated on the basis of S/N = 3 from a calibration curve of at least 3 points using at least 3 repetitions for each point. The linearequation from the calibration curve was used to calculate the LOD between the lowest concentration detected and the highest concentration notdetected (varying each concentration by ∼1 order of magnitude). n.d., not detected; n.m., not measured.
Figure 3. Positive ion tandem mass spectrum of 1.2 ng isoproturon with (a) helium- and (b) air-based handheld LTP. Negative-ion full-scan massspectrum of 200 pg RDX with (c) helium and (d) air used as the discharge gas. All four spectra were acquired with a Thermo LTQ. Air was suppliedby a large compressed air cylinder for air-based handheld LTP.
Analytical Chemistry Editors' Highlight
dx.doi.org/10.1021/ac4013286 | Anal. Chem. 2013, 85, 6545−65526549
205

further evidenced in Figure 3c,d, where there is much lesschemical noise in the negative ion mode when using air-basedLTP.It has been seen in other studies that the use of helium as a
discharge gas for LTP often produces an abundance ofbackground ions as compared to a nitrogen- or air-basedLTP,23 likely due to excited states of helium exceeding 19 eVcapable of ionizing a greater range of species.Examples of cases where the analytical performance was
similar when either air or helium was used as the discharge gasincludes the analysis of explosives that readily undergo nitrateadduction, as with RDX, PETN, and tetryl. In Figure 3, theanalysis of 200 pg of RDX with both plasma gases for thehandheld LTP revealed the [M + NO3]
− adduct at m/z 284 (cf.Figure 3c,d) using a Thermo LTQ. The signal for RDX washigher when helium was used, but the ratio of the signal to thesurrounding chemical noise was much poorer. Overall, thedetection limits (Table 2) are roughly the same for air andhelium discharges for explosives which undergo nitrateaddition. In general, helium is the appropriate choice forachieving better LODs for most samples, unless nitrate additionis favored. The ability of both helium and air plasmas togenerate NO3
− and higher-order nitrate clusters in largeabundance in the ambient air from N2 and O2 allows sufficientadduct formation with appropriate analytes. However, thereason for reduced sensitivity with air versus helium for protontransfer ionization is unclear, but it is likely due to a differencein reagent ions formed with the different discharge gascompositions.Handheld LTP on Mini 10.5 MS. Coupling a handheld LTP
with a miniature mass spectrometer produces a completelyfield-portable instrument, capable of analyzing gaseous, liquid,and solid samples in their native, ambient environment. Theprocess of minimizing helium and power in comparison tolarge-scale LTP has other benefits. The decreased voltage foroperation of the source reduced the radiated AC noise whichhas adverse effects on the MS instrumentation as observed withprevious versions of the LTP. In addition, lower helium flowrates also helped when coupling the source to a Mini MS whichhas limited pumping capacity because the performance of thesmall turbomolecular pumps degrades when helium is beingpumped. This phenomenon has required the use ofsupplemental pumping in the past,30 which was not neededfor coupling of the handheld LTP with the Mini 10.5 MS.An MS/MS spectrum for 1.2 ng of malathion on the Mini
10.5 (Figure S2 in Supporting Information) reveals theexpected loss of ethanol. Tandem mass spectra for malathionand other pesticides were used in determining LODs forhandheld LTP on the miniature instrument. Absolute quantitieswithin an order of magnitude of a few nanograms couldconfidently be detected for all of the agrochemicals, and theyproduced adequate signals for the qualitative assessments oftendesired for in situ experiments. The Mini 10.5 instrument didnot have the ability to detect negative ions, so explosives werenot analyzed.Drugs of abuse represent another potential compound class
that might be detected using a portable instrument. This hasbeen demonstrated with the large-scale LTP on a benchtopinstrument,24 LODs being in the pg to ng range, absolute. Inthe current study, the ability to detect a drug directly from anindividual’s finger after a few hours after exposure was tested. Asmall amount, 1 μg, of methamphetamine was deposited onto ahuman finger and analyzed 2 h after application by MS/MS
using the handheld LTP-Mini 10.5 combination. The subjectperformed daily tasks as usual for the 2 h. It should be notedthat the subject did not wash his hands between the time ofspotting the drug and analysis. The spectrum in Figure 4 was
obtained by direct finger analysis with the handheld LTP probe,revealing the presence of methamphetamine with the [M + H]+
and characteristic fragment ions present at 150 and 119 Th,respectively. The nondestructive and room-temperature natureof the handheld LTP allows analysis of delicate samples, such ashuman skin, without damage or discomfort.
Long-Distance Ion Transfer. To demonstrate the mostlikely way a handheld ambient ionization source would be usedin the field, a long-distance ion transfer system wasimplemented to help transport ions from a nonproximatesample to the MS inlet. Similar designs have been reported byCotte-Rodriguez et al. for nonproximate detection with DESI31
and by Garimella et al., where simulations and experimentalresults demonstrated that plastic tubing allows effective transferof ions produced by DESI and LTP for distances over 1 m.32
This simple system, diagrammatically shown in Figure 5a,consisted of a large Tygon and Teflon vessel, which can beplaced flush with a sample surface, allowing interaction ofexcited species from the LTP with the sample at a fixedgeometry. The ions/neutral species were transferred to the MSinlet via a flexible one-meter-long Tygon tube. Laminar flow isestablished 1 cm into the tube, so any reasonable bends in thetube had little effect on signal. The vacuum within the ThermoLTQ created the suction necessary to pull the ions/neutrals tothe MS inlet. This arrangement was tested on the commercialbenchtop Thermo LTQ. Figure 5b shows the resulting massspectrum from the analysis of 10 μg of RDX on a glassmicroscope slide. Again, the [M + NO3]
− ion was present at m/z 284. Cocaine, prevalent on US banknotes,33 was also detectedon an untreated U.S. one dollar bill using tandem MS (Figure5c). The expected loss of benzoic acid yields the base peak at182 Th from the parent [M + H]+ ion at 304 Th. Two ordersof magnitude of signal loss was experienced, and this remainsan area of future work as does the implementation of long-distance ion transport on miniature MS instruments.
Figure 4. Analysis of 1 μg of methamphetamine on an individual’sfinger 2 h after deposition using the handheld LTP on a Mini 10.5.
Analytical Chemistry Editors' Highlight
dx.doi.org/10.1021/ac4013286 | Anal. Chem. 2013, 85, 6545−65526550
206

■ CONCLUSIONSA handheld low-temperature plasma probe has been developedfor both miniature and benchtop MS applications. Despiteusing lower power and helium flow rates in comparison to aconventional, large-scale LTP, there was no loss in analyticalperformance with the handheld LTP-MS. While helium wastypically used as the discharge gas, due to typically yieldingbetter LODs, air was also effective for many analytes. Whenusing air, the weight of the handheld source was ∼280 g, withelectrical current from a 7.4 Li-polymer battery being the onlyconsumable. When coupled with a Mini 10.5 MS, LODs at thenanogram level were achieved for various agrochemicals as wellas the ability to directly detect methamphetamine from skin;however, the desorption capabilities of plasma sourcesinherently limit the methodologies to lower molecular weightanalytes. The demonstration of long-distance ion transfer withthe handheld LTP and a flexible transfer line has shown thepotential for point-and-shoot analysis with a free range ofmotion about the MS instrument.
■ ASSOCIATED CONTENT*S Supporting InformationAdditional information as noted in text. This material isavailable free of charge via the Internet at http://pubs.acs.org.
■ AUTHOR INFORMATIONCorresponding Author*E-mail: [email protected]. Telephone: (765) 494-5262. Fax:(765) 494-9421.
Present Address†Institute for Inorganic and Analytical Chemistry, University ofMunster, Corrensstr. 28, Munster 48149, Germany.NotesThe authors declare no competing financial interest.
■ ACKNOWLEDGMENTSThe authors thank Santosh Soparawalla and Robert Noll foradvice and acknowledge support from the Center for AnalyticalInstrumentation Development (CAID). This research was alsosupported by an award from the US Department of Energy(DOE) Office of Science Graduate Fellowship Program (DOESCGF). The DOE SCGF Program was made possible in partby the American Recovery and Reinvestment Act of 2009. TheDOE SCGF program is administered by the Oak RidgeInstitute for Science and Education for the DOE. ORISE ismanaged by Oak Ridge Associated Universities (ORAU) underDOE contract number DE-AC05-06OR23100. All opinionsexpressed in this paper are the authors’ and do not necessarilyreflect the policies and views of DOE, ORAU, or ORISE.Additional support was proved by the National ScienceFoundation Instrumentation Development for BiologicalResearch (DBI 0852740).
■ REFERENCES(1) Sutherland, W. S.; Alarie, J. P.; Stokes, D. L.; Vodinh, T. Instrum.Sci. Technol. 1994, 22, 231.(2) Karttunen, J. O.; Evans, H. B.; Henderson, D. J.; Markovic, P. J.;Niemann, R. L. Anal. Chem. 1964, 36, 1277.(3) Harrick, N. J. J. Phys. Chem. 1960, 64, 1110.
Figure 5. (a) Schematic of the handheld LTP with an interface used for long-distance ion transport to a Thermo LTQ. (b) Analysis of a U.S. onedollar bill using the same configuration as well as (c) 10 μg of RDX from a glass slide.
Analytical Chemistry Editors' Highlight
dx.doi.org/10.1021/ac4013286 | Anal. Chem. 2013, 85, 6545−65526551
207
(4) Debrasguedon, J.; Liodec, N. C.R. Hebd. Acad. Sci. 1963, 257,3336.(5) Gao, L.; Cooks, R. G.; Ouyang, Z. Anal. Chem. 2008, 80, 4026.(6) Sanders, N. L.; Kothari, S.; Huang, G.; Salazar, G.; Cooks, R. G.Anal. Chem. 2010, 82, 5313.(7) Sokol, E.; Noll, R. J.; Cooks, R. G.; Beegle, L. W.; Kim, H. I.;Kanik, I. Int. J. Mass Spetrom. 2011, 306, 187.(8) Takats, Z.; Wiseman, J. M.; Gologan, B.; Cooks, R. G. Science2004, 306, 471.(9) Brady, J. J.; Judge, E. J.; Levis, R. J. Rapid Commun. MassSpectrom. 2009, 23, 3151.(10) Nemes, P.; Vertes, A. Anal. Chem. 2007, 79, 8098.(11) Shelley, J. T.; Ray, S. J.; Hieftje, G. M. Anal. Chem. 2008, 80,8308.(12) Peng, W. P.; Yang, Y. C.; Kang, M. W.; Tzeng, Y. K.; Nie, Z. X.;Chang, H. C.; Chang, W.; Chen, C. H. Angew. Chem., Int. Ed. 2006, 45,1423.(13) Rezenom, Y. H.; Dong, J.; Murray, K. K. Analyst 2008, 133, 226.(14) Monge, M. E.; Harris, G. A.; Dwivedi, P.; Fernandez, F. M.Chem. Rev. 2013, 113, 2269.(15) Wang, H.; Liu, J.; Cooks, R. G.; Ouyang, Z. Angew. Chem., Int.Ed. 2010, 49, 877.(16) Hu, B.; So, P. K.; Chen, H. W.; Yao, Z. P. Anal. Chem. 2011, 83,8201.(17) Santos, V. G.; Regiani, T.; Dias, F. F. G.; Romao, W.; Jara, J. L.P.; Klitzke, C. F.; Coelho, F.; Eberlin, M. N. Anal. Chem. 2011, 83,1375.(18) Schwab, N. V.; Porcari, A. M.; Coelho, M. B.; Schmidt, E. M.;Jara, J. L.; Visentainer, J. V.; Eberlin, M. N. Analyst 2012, 137, 2537.(19) Heywood, M. S.; Taylor, N.; Farnsworth, P. B. Anal. Chem.2011, 83, 6493.(20) Wright, J. P.; Heywood, M. S.; Thurston, G. K.; Farnsworth, P.B. J. Am. Soc. Mass. Spectrom. 2013, 24, 335.(21) Ratcliffe, L. V.; Rutten, F. J. M.; Barrett, D. A.; Whitmore, T.;Seymour, D.; Greenwood, C.; Aranda-Gonzalvo, Y.; Robinson, S.;McCoustra, M. Anal. Chem. 2007, 79, 6094.(22) Bowfield, A.; Barrett, D. A.; Alexander, M. R.; Ortori, C. A.;Rutten, F. M.; Salter, T. L.; Gilmore, I. S.; Bradley, J. W. Rev. Sci.Instrum. 2012, 83, 063503.(23) Harper, J. D.; Charipar, N. A.; Mulligan, C. C.; Zhang, X. R.;Cooks, R. G.; Ouyang, Z. Anal. Chem. 2008, 80, 9097.(24) Jackson, A. U.; Garcia-Reyes, J. F.; Harper, J. D.; Wiley, J. S.;Molina-Diaz, A.; Ouyang, Z.; Cooks, R. G. Analyst 2010, 135, 927.(25) Zhang, Y.; Ma, X.; Zhang, S.; Yang, C.; Ouyang, Z.; Zhang, X.Analyst 2009, 134, 176.(26) Chen, H. W.; Talaty, N. N.; Takats, Z.; Cooks, R. G. Anal.Chem. 2005, 77, 6915.(27) Green, F. M.; Salter, T. L.; Stokes, P.; Gilmore, I. S.; O’Connor,G. Surf. Interface Anal. 2010, 42, 347.(28) Steeb, J.; Galhena, A. S.; Nyadong, L.; Facundo, J. J.; Fernandez,M. Chem. Commun. 2009, 4699.(29) Williams, J. P.; Scrivens, J. H. Rapid Commun. Mass Spectrom.2005, 19, 3643.(30) Huang, G.; Xu, W.; Visbal-Onufrak, M. A.; Ouyang, Z.; Cooks,R. G. Analyst 2010, 135, 705.(31) Cotte-Rodriguez, I.; Mulligan, C. C.; Cooks, G. Anal. Chem.2007, 79, 7069.(32) Garimella, S.; Xu, W.; Huang, G.; Harper, J. D.; Cooks, R. G.;Ouyang, Z. J. Mass Spectrom. 2012, 47, 201.(33) Armenta, S.; de la Guardia, M. TrAC, Trends Anal. Chem. 2008,27, 344.
Analytical Chemistry Editors' Highlight
dx.doi.org/10.1021/ac4013286 | Anal. Chem. 2013, 85, 6545−65526552
208