fundamentals remote sensing
DESCRIPTION
REMOTE SENSING is the process of sensing and measuring objects from a distance without physical contact with them.Remote sensing is the science of acquiring information about the Earth's surface without actually being in contact with it. This is done by sensing and recording reflected or emitted energy and processing, analyzing, and applying that informationTRANSCRIPT
Fundamentals of Remote Sensing
Fundamentals of Remote Sensing

Do we have To characterize
Remote Sensing

REMOTE SENSING is the process of sensing and measuring objects from a distance without physical contact with them
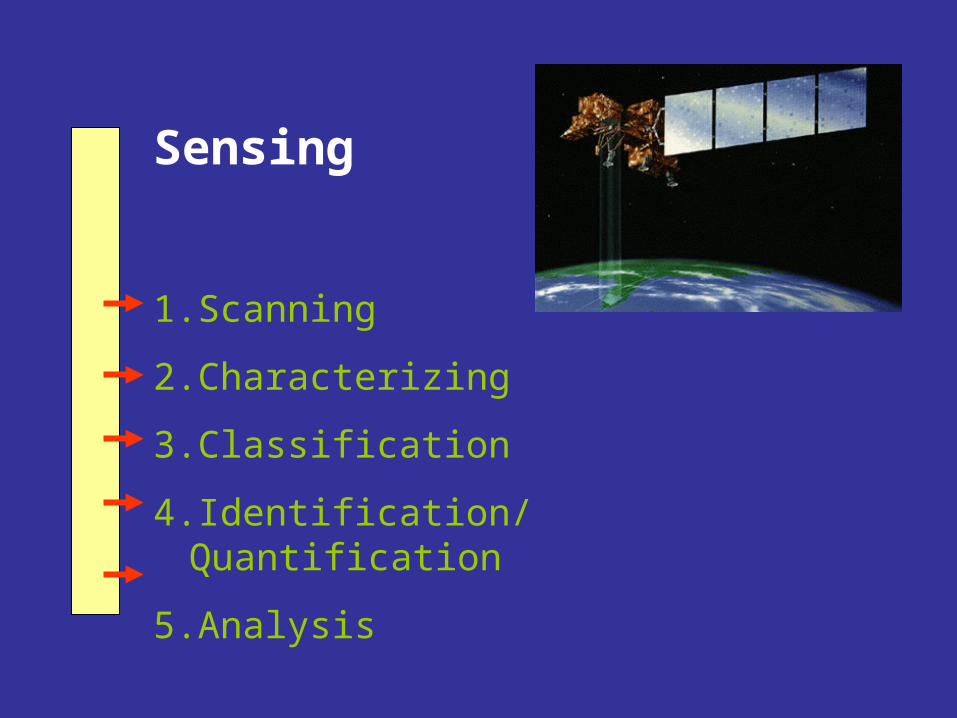
Sensing
1.Scanning
2.Characterizing
3.Classification
4.Identification/ Quantification
5.Analysis
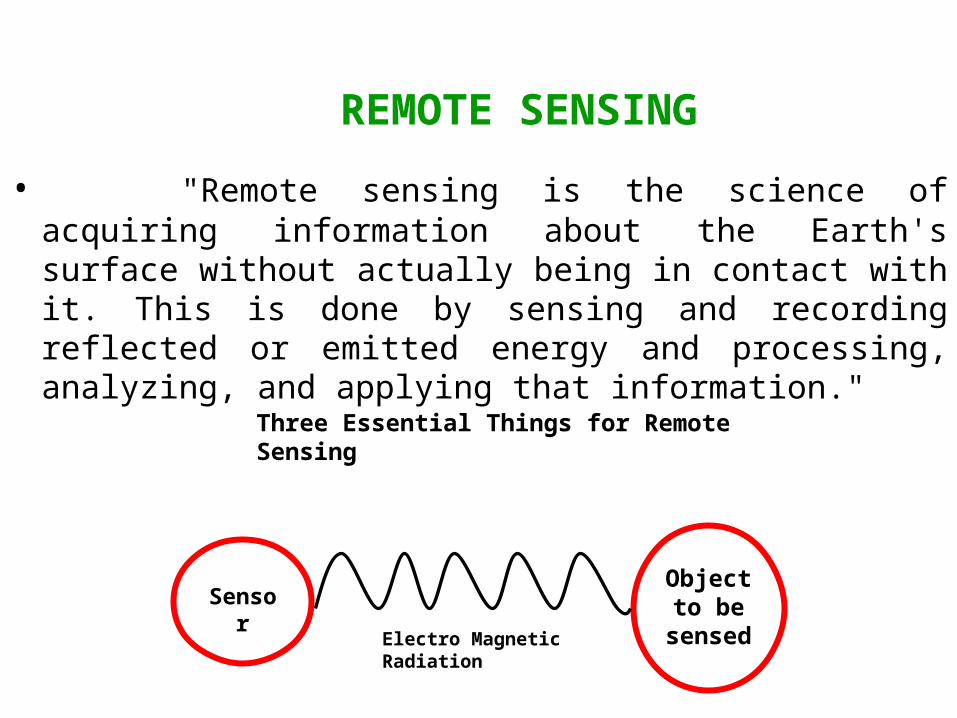
REMOTE SENSING
• "Remote sensing is the science of acquiring information about the Earth's surface without actually being in contact with it. This is done by sensing and recording reflected or emitted energy and processing, analyzing, and applying that information."
SensorObject to be
sensedElectro Magnetic Radiation
Three Essential Things for Remote Sensing

SIX STAGES IN REMOTE SENSING
Stage-1. Source of energyStage-2. Transmission of EMR towards the ObjectStage-3. Interaction of EMR with the ObjectStage-4. Transmission of Interacted EMR towards the SensorStage-5. Recording of the Image by the DetectorStage-6. Analysis of the Imagery
12
3
45 (Film)
6
3
34

Solar Energy
Incident Radiation
Absorption
Scattering
Reflected energy
Thermal emission
Transmission
Platforms& Sensors
Ground Borne
Air Borne
Space Borne
AntennaData Processing
Data Products Soft Copy
Data Products Hard Copy
Visual Interpretation
Digital Interpretation
Outputs Softcopy
Outputs Hard Copy
Decision Making

Rate of transfer of Radiant Energy ( Joules) = Flux ( watts) Energy response from surface of earth = radiant emittance Wm-2
Radiance = radiant flux density from small area = Wm-2 Sr -1
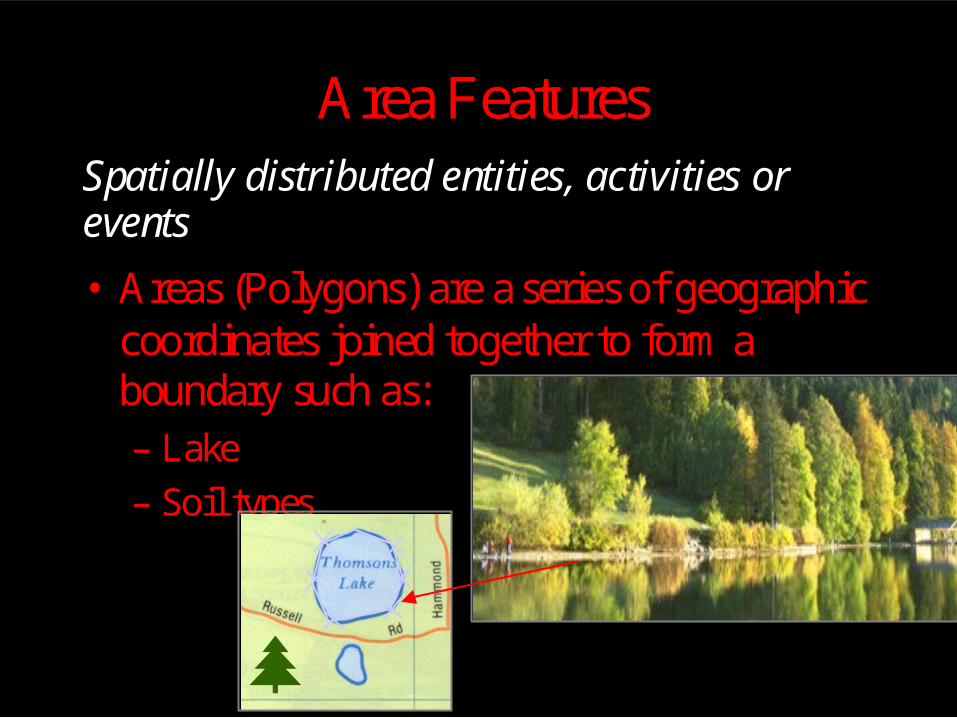
Area FeaturesSpatially distributed entities, activities orevents
• Areas (Polygons) are a series of geographiccoordinates joined together to form aboundary such as:– Lake
– Soil types

Types of RS system
Active RS system
Passive RS system
Artificial Energy source
Natural Energy source
e.g. radar systems
SLAR,SAR
e.g.sensors on satellites
Landsat,SPOT

Sensor Detection
1.Passive Detection
• sensors measure levels of energy that are naturally emitted, reflected, or transmitted by the target object.
• Passive sensors are those which detects naturally occurring energy. Most often, the source of radioactive energy is the sun.
• Detection of reflected solar energy, for example, can only proceed when the target is illuminated by the sun, thus limiting visible light sensors on satellites from being used during a nighttime pass.
• The Thematic Mapper, the primary sensor on the Landsat satellites, is a good example of a passive sensor.

Active detection
1. Active Sensors provide their own energy source for illumination of the target by directing a burst of radiation at the target and use sensors to measure how the target interacts with the energy. 2. Most often the sensor detects the reflection of the energy, measuring the angle of reflection or the amount of time it took for the energy to return. 3. Active sensors provide the capability to obtain measurements anytime, regardless of the time of day or season. 4. They can be used for examining energy types that are not sufficiently provided by the sun, such as microwaves, or to better control the way a target is illuminated. However, active systems require the generation of a fairly large amount of energy to adequately illuminate targets.Doppler radar is an example of an active remote sensing technology.

• IMAGING SENSORS – Sensors which provide output to create an
image– Eg : LISS I,LISS II, LISS III etc.
• NON IMAGING SENSORS• Sensors which provide numerical output
with respect to the quantum of radiation• Eg: Radiometer,Scatterometer etc.

IRS 1C Sensors overview
PAN
LISS III
WiFS

ORBITThe path followed by a satellite
Two types of Orbits are
1) Geostationary Orbits
2) Near Polar Orbits

ORBITThe path followed by a satellite
Two types of Orbits are
1) Geostationary Orbits
2) Near Polar Orbits
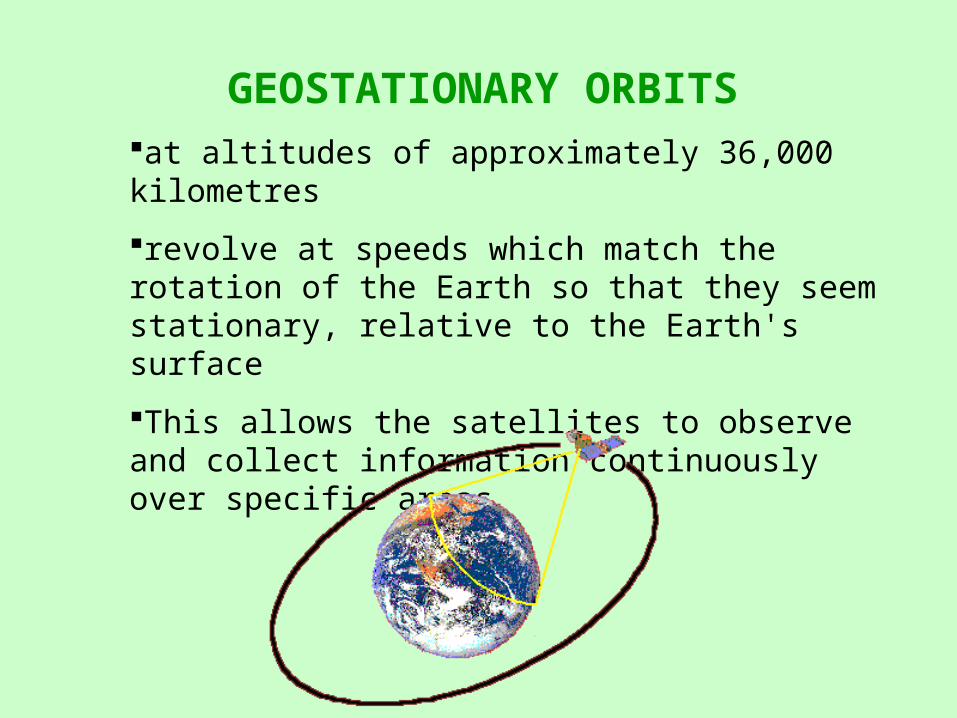
GEOSTATIONARY ORBITSat altitudes of approximately 36,000 kilometres
revolve at speeds which match the rotation of the Earth so that they seem stationary, relative to the Earth's surface
This allows the satellites to observe and collect information continuously over specific areas

NEAR-POLAR ORBITS
• The inclination of the orbit relative to polar axis.
Some of these satellites’ orbits are also sun-synchronous. This means that they cover each area of the world at a constant local time of day called local sun time.
Platforms


• As the satellite revolves around the Earth, the sensor "sees" a certain portion of the Earth's surface.
• The width of the strip imaged is referred to as the swath width.
SWATH

PLATFORM CHARACTERISTICS

USUAL PLATFORMS
• Aircraft – Helicopters– Microlites– Low altitude aircrafts– High altitude aircraft
• Satellites– Orbiting satellites– Geostationary satellites
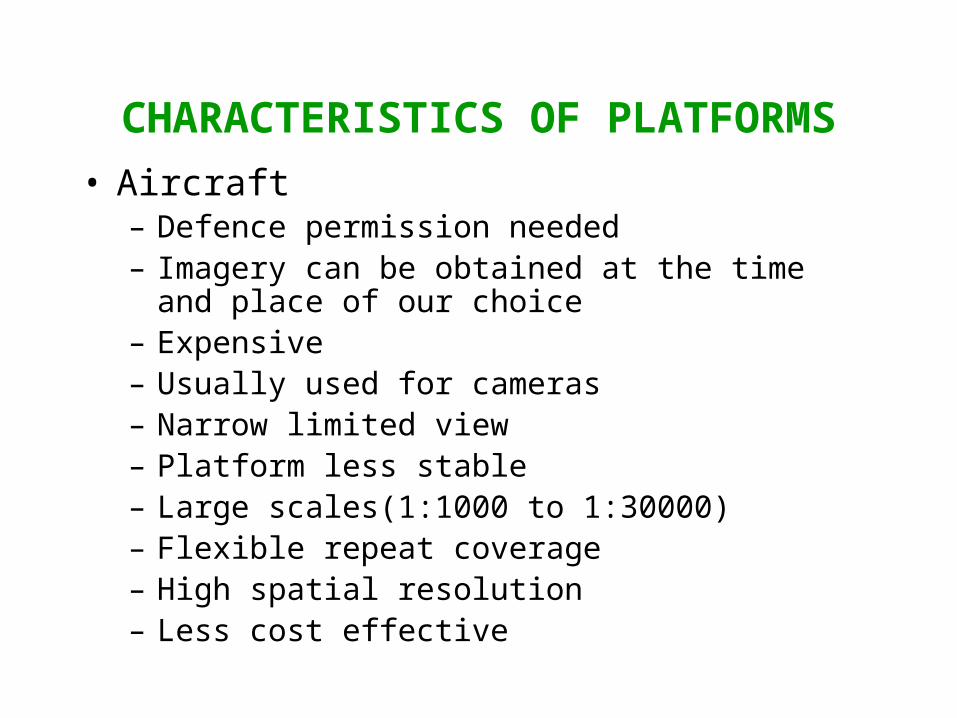
CHARACTERISTICS OF PLATFORMS
• Aircraft – Defence permission needed– Imagery can be obtained at the time and place of
our choice– Expensive– Usually used for cameras– Narrow limited view– Platform less stable– Large scales(1:1000 to 1:30000)– Flexible repeat coverage– High spatial resolution– Less cost effective

• Satellite– Global coverage – No fuel needed(for 3 years operation)– Defence permission not needed– Usually used for scanners and radars which transmit
information in electronic format– Wide,synoptic view– Very stable paltform– Small scale(>1:50000)– Limited repeat coverage(3 to 26 days)– Low spatial resolution– Highly cost effective
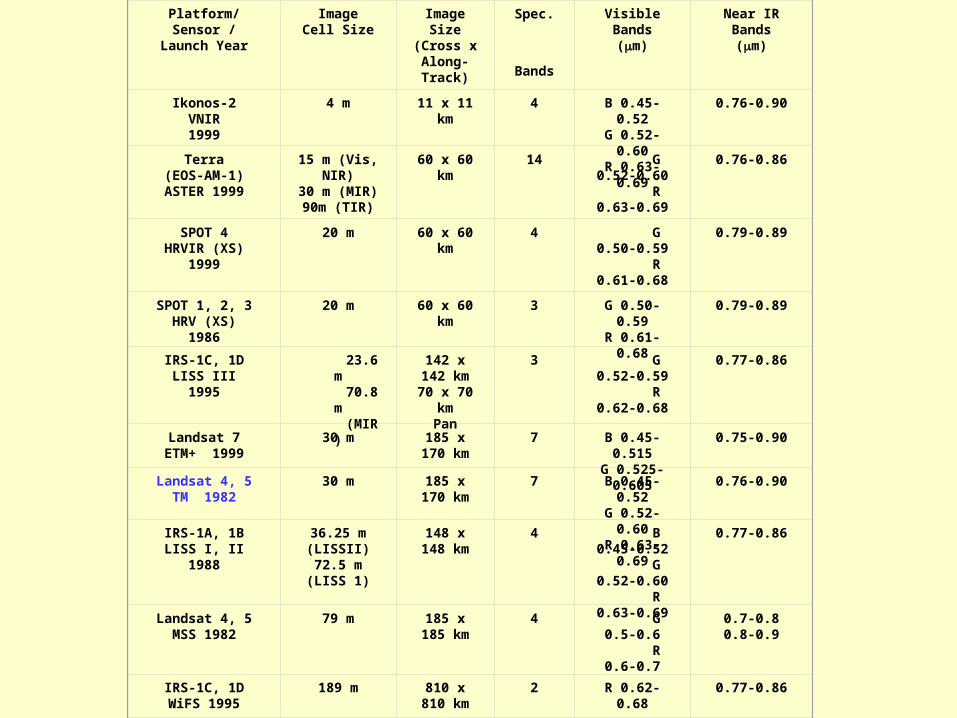
Platform/Sensor /Launch Year
ImageCell Size
Image Size(Cross x Along-Track)
Spec.
Bands
VisibleBands(m)
Near IRBands(m)
Ikonos-2VNIR1999
4 m 11 x 11 km 4 B 0.45-0.52G 0.52-0.60R 0.63-0.69
0.76-0.90
Terra(EOS-AM-1)ASTER 1999
15 m (Vis, NIR)
30 m (MIR)90m (TIR)
60 x 60 km 14 G 0.52-0.60
R 0.63-0.69
0.76-0.86
SPOT 4HRVIR (XS)
1999
20 m 60 x 60 km 4 G 0.50-0.59
R 0.61-0.68
0.79-0.89
SPOT 1, 2, 3HRV (XS)
1986
20 m 60 x 60 km 3 G 0.50-0.59R 0.61-0.68
0.79-0.89
IRS-1C, 1DLISS III
1995
23.6 m
70.8 m
(MIR)
142 x 142 km
70 x 70 kmPan
3 G 0.52-0.59
R 0.62-0.68
0.77-0.86
Landsat 7ETM+ 1999
30 m 185 x 170 km
7 B 0.45-0.515G 0.525-
0.605
0.75-0.90
Landsat 4, 5TM 1982
30 m 185 x 170 km
7 B 0.45-0.52G 0.52-0.60R 0.63-0.69
0.76-0.90
IRS-1A, 1BLISS I, II
1988
36.25 m (LISSII)
72.5 m (LISS 1)
148 x 148 km
4 B 0.45-0.52
G 0.52-0.60
R 0.63-0.69
0.77-0.86
Landsat 4, 5MSS 1982
79 m 185 x 185 km
4 G 0.5-0.6
R 0.6-0.7
0.7-0.80.8-0.9
IRS-1C, 1DWiFS 1995
189 m 810 x 810 km
2 R 0.62-0.68 0.77-0.86

Pixels and Digital Number

Resolution of a Sensor
• Spatial Resolution – ‘Area’ aspects • Spectral resolution – ‘ Band aspect’ • Radiometric resolution – ‘Radiance’
aspect • Temporal resolution – ‘Frequency’
aspect
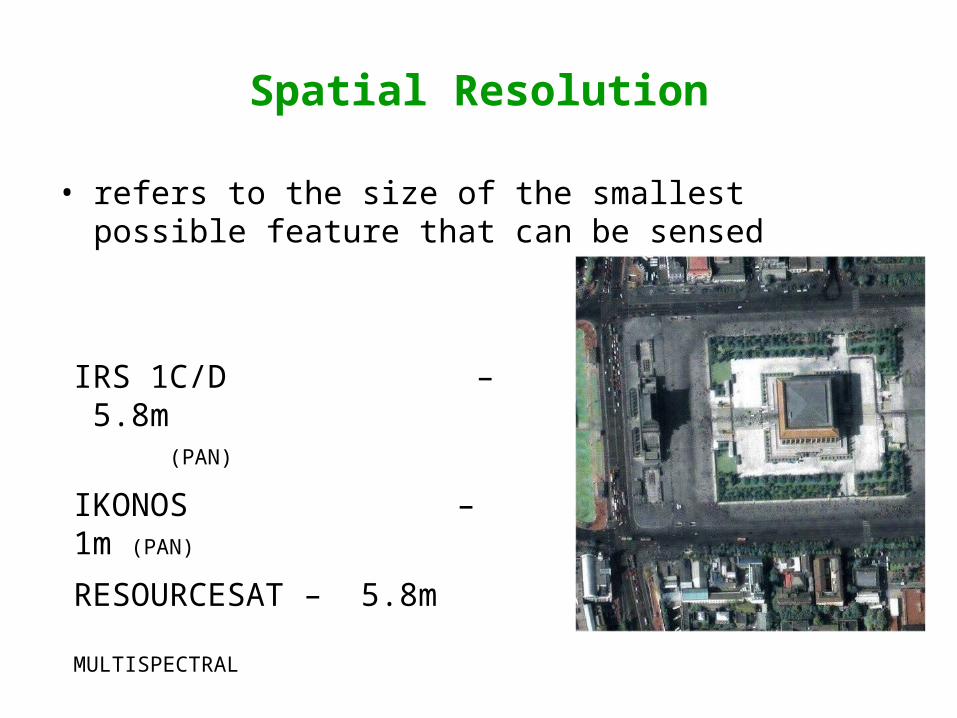
Spatial Resolution
• refers to the size of the smallest possible feature that can be sensed
IRS 1C/D – 5.8m (PAN)
IKONOS – 1m (PAN)
RESOURCESAT – 5.8m MULTISPECTRAL

PIXELS (Picture + elements)
Black - 0
White - 255Pixel
Grey values

Spatial Resolution
LANDSAT
30 m
LISS III
23.5
PAN
5.8 m
IKONOS
1m

60 cm spatial resolution

Spectral Resolution
• Ability of a sensor to define fine wavelength intervals.
• The finer the spectral resolution, the narrower is the wavelength range for a particular channel or band.

IRS 1C PAN IMAGE OF VIZAG STEEL PLANT, 1996IRS 1C PAN IMAGE OF VIZAG STEEL PLANT, 1996


IRS 1C LISS III IMAGE OF VIZAG STEEL PLANT, 1996IRS 1C LISS III IMAGE OF VIZAG STEEL PLANT, 1996
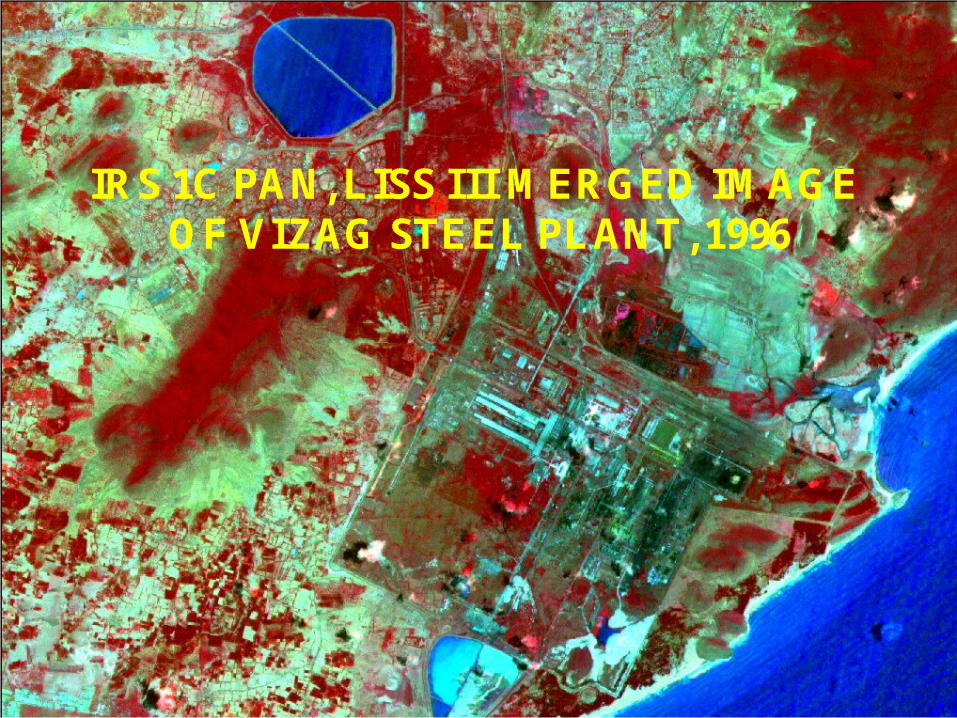
IRS 1C PAN, LISS III MERGED IMAGE OF VIZAG STEEL PLANT, 1996

4 3 2 Composite of Landsat 7

7 4 2 Composite of Landsat 7

The image to the right is a "true color" image of the desert around the Salton Sea and Imperial Valley in Southern California. The American/Mexican border is clearly visible.

Spectral bands of Landsat 7
Band Number Wavelength Interval Spectral Response
1 0.45-0.52 µm Blue-Green
2 0.52-0.60 µm Green
3 0.63-0.69 µm Red
4 0.76-0.90 µm Near IR
5 1.55-1.75 µm Mid-IR
6 10.40-12.50 µm Thermal IR
7 2.08-2.35 µm Mid-IR

• Landsat 7 Land Number Applications
• 1coastal water mapping, soil/vegetation discrimination, forest classification, man-made feature identification
• 2vegetation discrimination and health monitoring, man-made feature identification
• 3plant species identification, man-made feature identification• 4soil moisture monitoring, vegetation monitoring, water body discrimination• 5vegetation moisture content monitoring• 6surface temperature, vegetation stress monitoring, soil moisture
monitoring, cloud differentiation, volcanic monitoring
• 7mineral and rock discrimination, vegetation moisture contentFor more details see: Lillesand, T. and Kiefer, R., 1994. Remote Sensing and Image Interpretation. John Wiley and Sons, Inc., New York, p. 468.

• Ability of the sensor to discriminate very slight differences in energy.
• The finer the radiometric resolution of a sensor, the more sensitive it is to detecting small differences in reflected or emitted energy.
Radiometric Resolution
0 255 0 127 0 63

256 Level Grey Scale

Temporal Resolution
• Time interval between two successive visits of the satellite for the same place.
• Spectral characteristics of features may change over time and these changes can be detected by collecting and comparing multi-temporal imagery.

SCANNERS

CHARACTERISTICS OF SCANNER
• Output in digital form
• Highly amenable for computer processing
• No consumables
• Flexible w.r.t. radiometric and spectral resolutions

ACROSS-TRACK SCANNERS
• Scan the Earth in a series of lines.
• The lines are oriented perpendicular to the direction of motion of the sensor platform (i.e. across the swath).
• Each line is scanned from one side of the sensor to the other, using a rotating mirror (A).
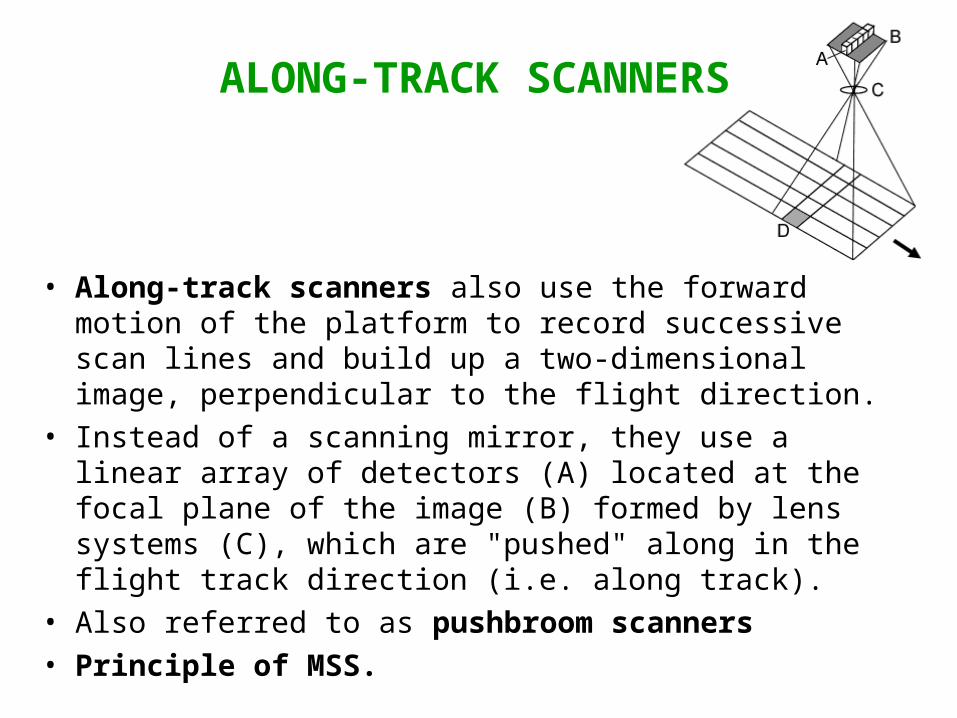
ALONG-TRACK SCANNERS
• Along-track scanners also use the forward motion of the platform to record successive scan lines and build up a two-dimensional image, perpendicular to the flight direction.
• Instead of a scanning mirror, they use a linear array of detectors (A) located at the focal plane of the image (B) formed by lens systems (C), which are "pushed" along in the flight track direction (i.e. along track).
• Also referred to as pushbroom scanners• Principle of MSS.


CHARACTERISTICS OF RADAR
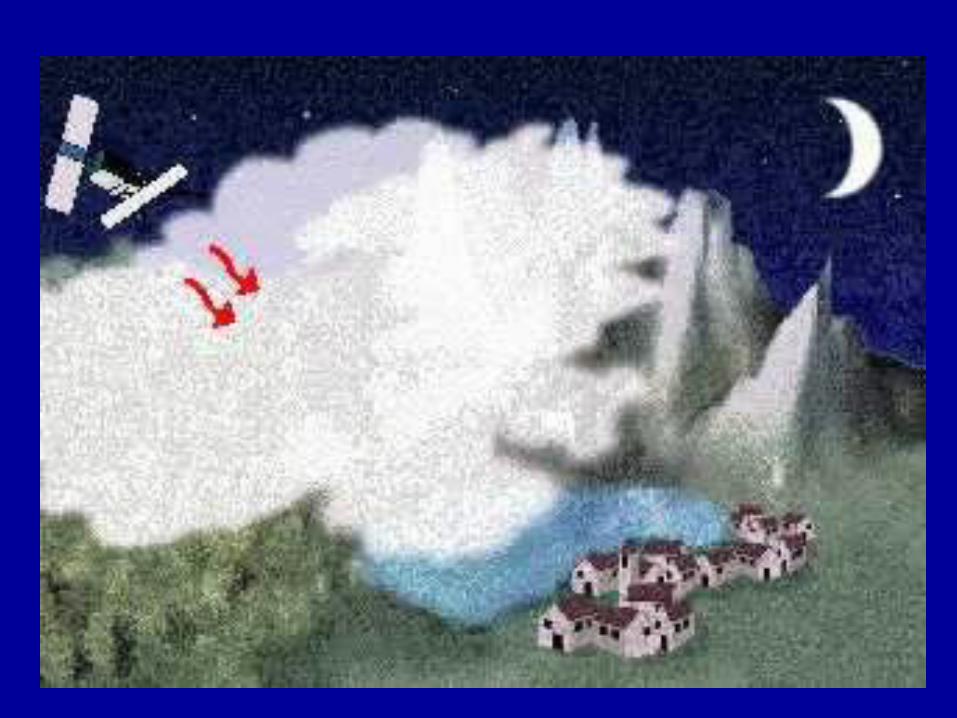
• All weather capability, day and night observing capability
• Sensitive to moisture
• Soil depth penetration to certain extent

Spectral reflectance curve

SPECTRAL REFLECTANCE OF VEGETATION,SOIL AND WATER

Strong absorption in blue and red bands. Reflection depends on the amount of chlorophyll in the leaf.
SPECTRAL REFLECTANCE OF VEGETATION

Reflectance peaks in green, corresponds with solar maximum
SPECTRAL REFLECTANCE OF VEGETATION

Major reflectance peaks in NIR, provides energy balance for vegetation
SPECTRAL REFLECTANCE OF VEGETATION
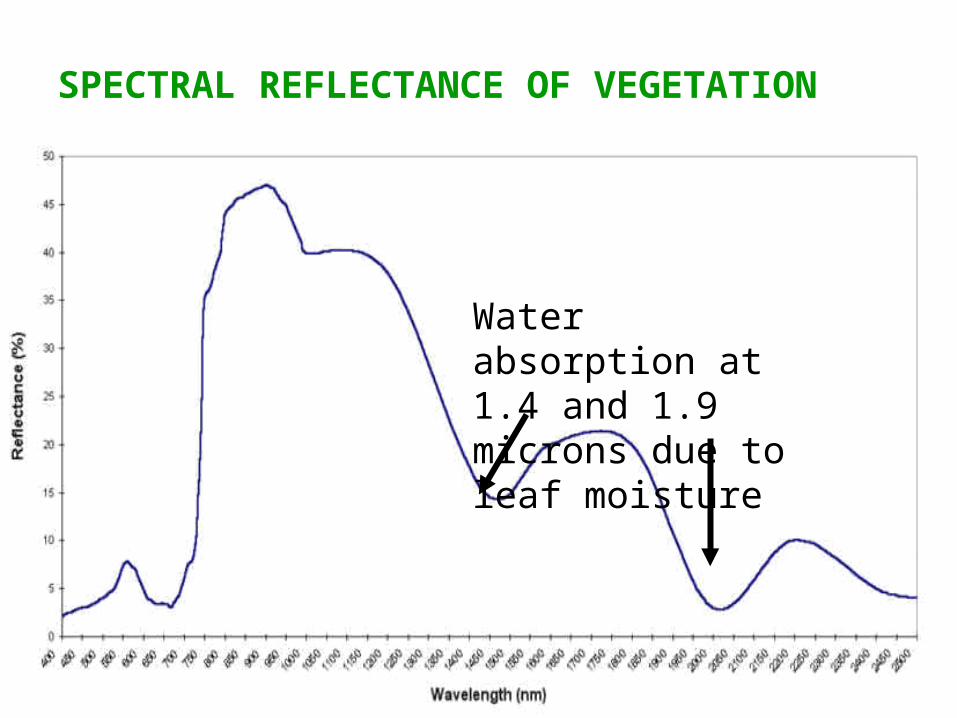
Water absorption at 1.4 and 1.9 microns due to leaf moisture
SPECTRAL REFLECTANCE OF VEGETATION

Soil reflectance generally increases gradually from visible to infrared.
SPECTRAL REFLECTANCE OF SOIL

Molecular water absorptions at 1.4 and 1.9 microns
SPECTRAL REFLECTANCE OF SOIL
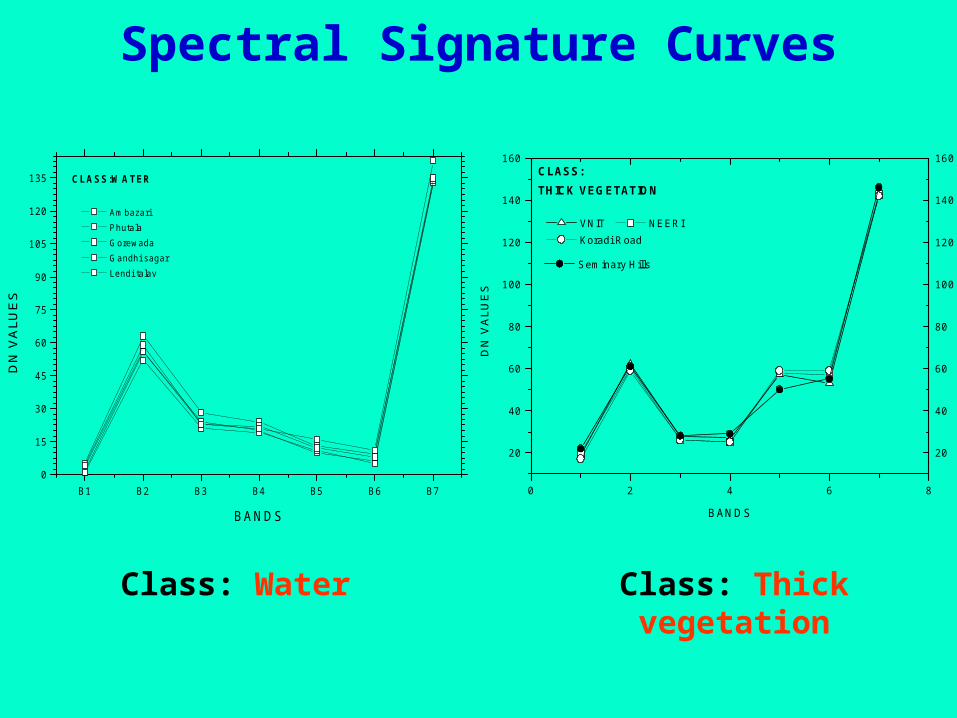
Spectral Signature Curves
B1 B2 B3 B4 B5 B6 B70
15
30
45
60
75
90
105
120
135
CLASS:WATER
Ambazari Phutala Gorewada Gandhi sagar Lendi talav
DN
VA
LUE
S
BANDS
Class: Water
0 2 4 6 8
20
40
60
80
100
120
140
160CLASS:THICK VEGETATION
BANDS
DN
VA
LUE
S
VNIT NEERI Koradi Road
20
40
60
80
100
120
140
160
DN
VA
LUE
S
Seminary Hills
Class: Thick vegetation
Electromagnetic Radiation

AN ELECTROMAGNETIC WAVE
Electromagnetic radiation consists of an electrical field(E) which varies in magnitude in a direction perpendicular to the direction in which the radiation is traveling, and a magnetic field (M) oriented at right angles to the electrical field. Both these fields travel at the speed of light (c).

THE ELECTROMAGNETIC SPECTRUM
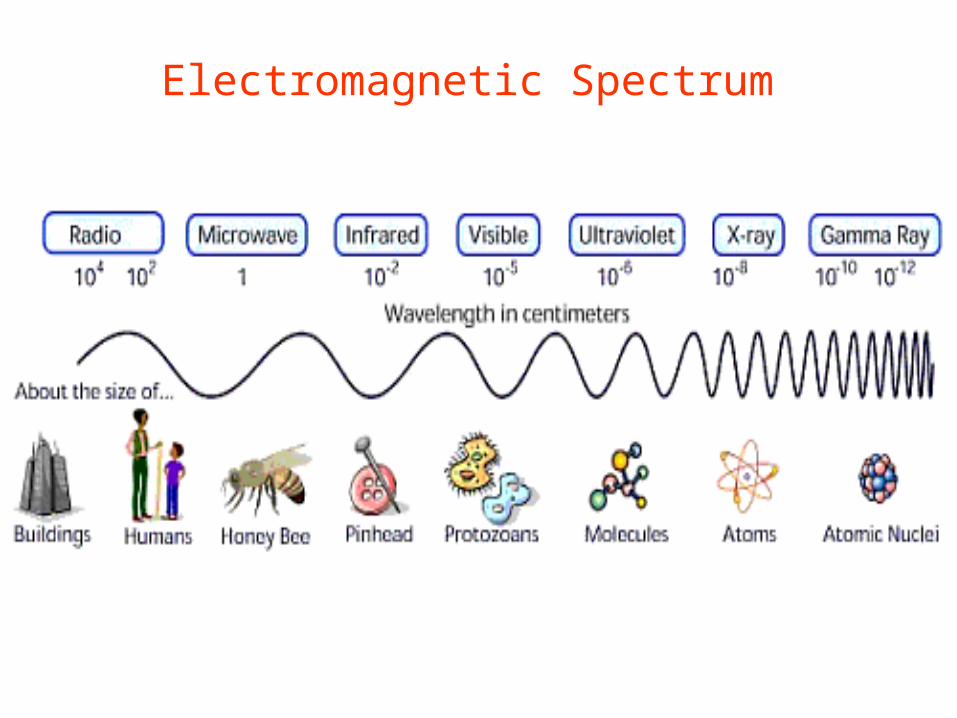
Electromagnetic Spectrum


• Covers the wavelength range from approximately 0.7 mm to 100 mm
• Divided into two categories based on their radiation properties – the reflected IR(0.7-3.0 µm), NIR(0.7-1.1µm), SWIR(1.55-1.7 µm) and TIR(3-14 µm).
INFRARED (IR) REGION

REFLECTED IR
• Radiation in the reflected IR region is used for remote sensing purposes in ways very similar to radiation in the visible portion. The reflected IR covers wavelengths from approximately 0.7 µm to 3.0 µm.
• Photographic IR ranges from 0.7 to 0.9 µm
• The thermal IR region is quite different than the visible and reflected IR portions, as this energy is essentially the radiation that is emitted from the Earth's surface in the form of heat. The thermal IR covers wavelengths from approximately 3.0 µm to 100 µm. But the heat energy is sensed in windows at 3 to 5.5 µm and 8 to 14 µm.
THERMAL IR
MICROWAVE REGION
•The microwave region from about 1 mm to 1m
INTERACTION WITH THE ATMOSPHERE

Radiation used for remote sensing reaches the Earth's surface it has to travel through some distance of the Earth's atmosphere.
Particles and gases in the atmosphere can affect the incoming light and radiation.
These effects are caused by the mechanisms of scattering and absorption.

SCATTERING
• Scattering occurs when particles or large gas molecules present in the atmosphere interact with and cause the electromagnetic radiation to be redirected from its original path.

• Rayleigh scattering occurs particles are very small compared to the wavelength of the radiation
Small specks of dust or nitrogen
and oxygen molecules
The fact that the sky appears "blue"
during the day is because of this
phenomenon.
Rayleigh Scattering 1/λ4
RAYLEIGH SCATTERING

MIE SCATTERING
• Mie scattering occurs when the particles are just about the same size as the wavelength of the radiation. e.g., Dust, pollen, smoke and water vapour
• Mie Scattering 1/ λ to 1/λ2
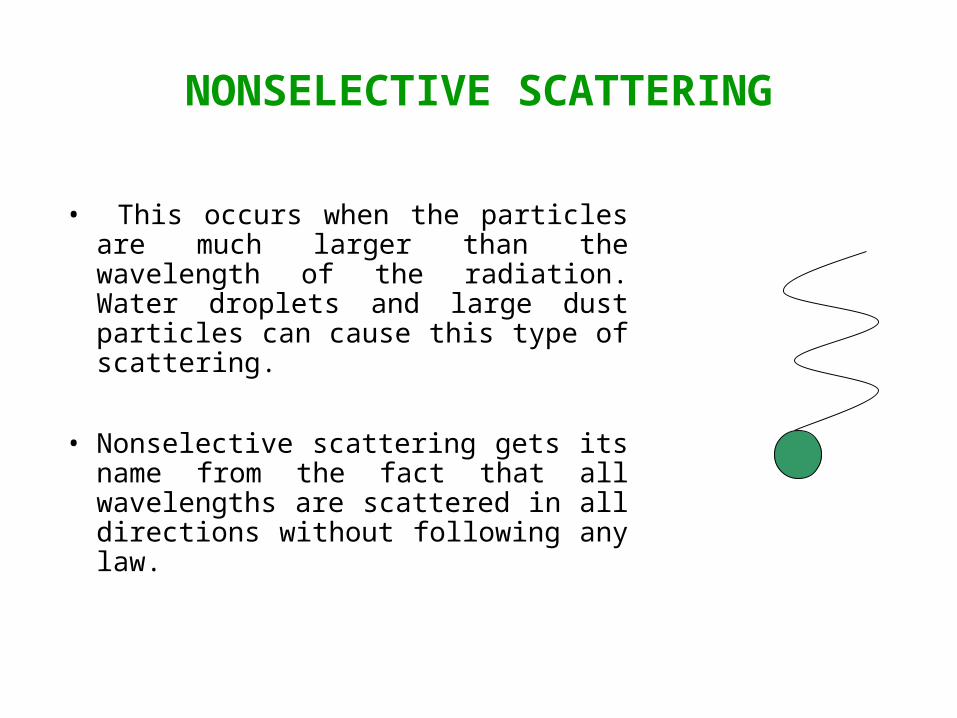
NONSELECTIVE SCATTERING
• This occurs when the particles are much larger than the wavelength of the radiation. Water droplets and large dust particles can cause this type of scattering.
• Nonselective scattering gets its name from the fact that all wavelengths are scattered in all directions without following any law.
Raman Scatter
• Any particle of any size
• Elastic collision of energy with molecule resulting in loss or gain in energy
• May have variable effect

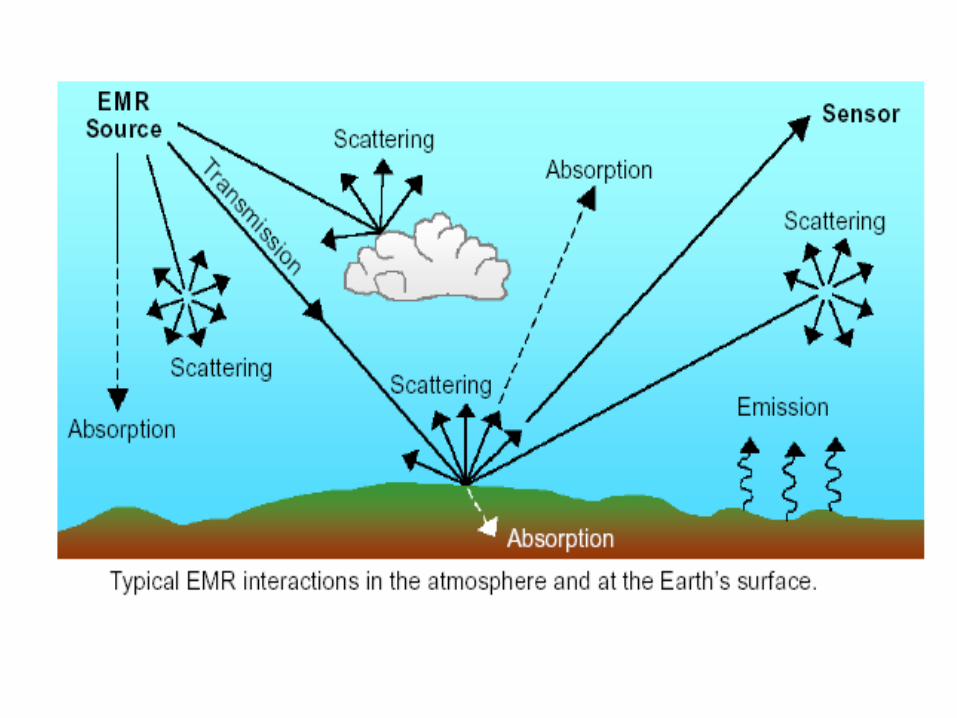
RADIATION - TARGET INTERACTIONS• Radiation that is not absorbed or scattered in the
atmosphere can reach and interact with the Earth's surface
Three forms of interaction are
Absorption (A)
Transmission (T)
Reflection (R).

Incident energy (I) from the source
Absorption (A) occurs when radiation (energy) is absorbed into the target
Transmission (T) occurs when radiation passes through a target
Reflection (R) occurs when radiation "bounces" off the target and is redirected.


TWO TYPES OF REFLECTION

When a surface is smooth we get specular or mirror-like reflection where all (or almost all) of the energy is directed away from the surface in a single direction.
When the surface is rough and the energy is reflected almost uniformly in all directions.
SPECULAR REFLECTION
DIFFUSE REFLECTION

• Because certain gases absorb electromagnetic energy in very specific regions of the spectrum, they influence the wavelengths, which reach the Earth available for remote sensing.
• Those areas of the spectrum which are not severely influenced by atmospheric absorption and thus, are useful to remote sensors, are called atmospheric windows.
ATMOSPHERIC WINDOWS

The transmission and absorption phenomenon varying with the wavelength
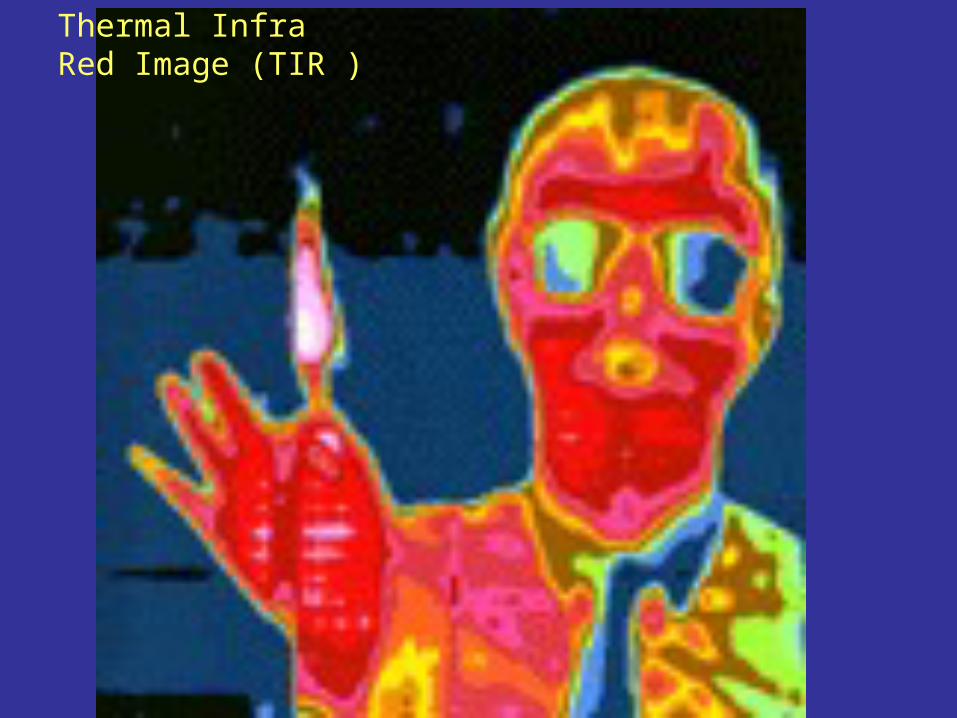
Thermal Infra Red Image (TIR )

True Color Thermal Infrared

CHARACTERISTIC OF IR IMAGES:
ON MOST TIR IMAGES, BRIGHTEST TONE ( HIGHER DN VALUE ) REPRESENT THE WARMEST RADIANT TEMPERATURES AND THE DARKEST TONE ( LOWER DN VALUE ) REPRESENT THE COOLEST TEMPERATURES.
AREAS OF APPLICATION:
1. PENETRATION OF SMOKE PLUMES AROUND STACKS IN INDUSTRIES
2. DETECTION OF DIFFERENTIAL VEGETATION
3. SOIL MOISTURE STUDIES
4. WEATHER RELATED STUDIES

RADAR WAVELENGTHS : WAVELENGTHS AND FREQUENCIES USED IN RS
BAND DESIGNATION WAVELENGTHS FREQUENCY ( CM ) GHZ
KA 0.8 –1.1 40-26.5
K 1.1-1.7 26.5-18KU 1.7-2.4 18-12.5X 2.4-3.8 12.5-8C 3.8-7.5 8.0-4S 7.5-15 4-2L 15-30 2-1P 30-100 1-0.3

Radar• A Radar is an active remote sensing system operating in the microwave portion of the spectrum
• Radar is an acronym for RAdio Detection and Ranging
A radar performs 3 primary functions:
1. It transmits microwave pulses towards a target
2. It receives a return portion of the transmitted signal after it has interacted with the target
3. It observes the strength, temporal behavior, and the time delay of the returned signals

Some definitions:
Target :
Ground objects of interest in a radar image
Backscatter : Returned signal from surface targets
Range :
The distance from the radar to the target
Range direction : The direction in which the radar pulses are transmitted;
generally perpendicular to the flight direction


Principles of Imaging Radars
• A radar sensor operates by transmitting microwaves towards the earth's surface in a direction perpendicular to the flight path of the platform.
• The sensor notes the time it takes for the signal to travel from the sensor to the target and back and uses this information to determine the relative distances of targets in the range direction.
• A radar image is a record of the amount of backscatter received from a target.

The radar creates an electromagnetic energy pulse which is focused by an antenna and transmitted through the atmosphere. Objects in the path of this electromagnetic pulse, called targets, scatter the electromagnetic energy. Some of that energy is scattered back toward the
The receiving antenna (which is normally also the transmitting antenna) gathers this back-scattered radiation and feeds it to a device called a receiver.

TRANSMITTER
DUPLEXER OBJECT CONTROL
ANTENNARECEIVER
Basic Structure of Radar System
CRT MONITOR
Film
Data Tapes
Data Processing & Storage
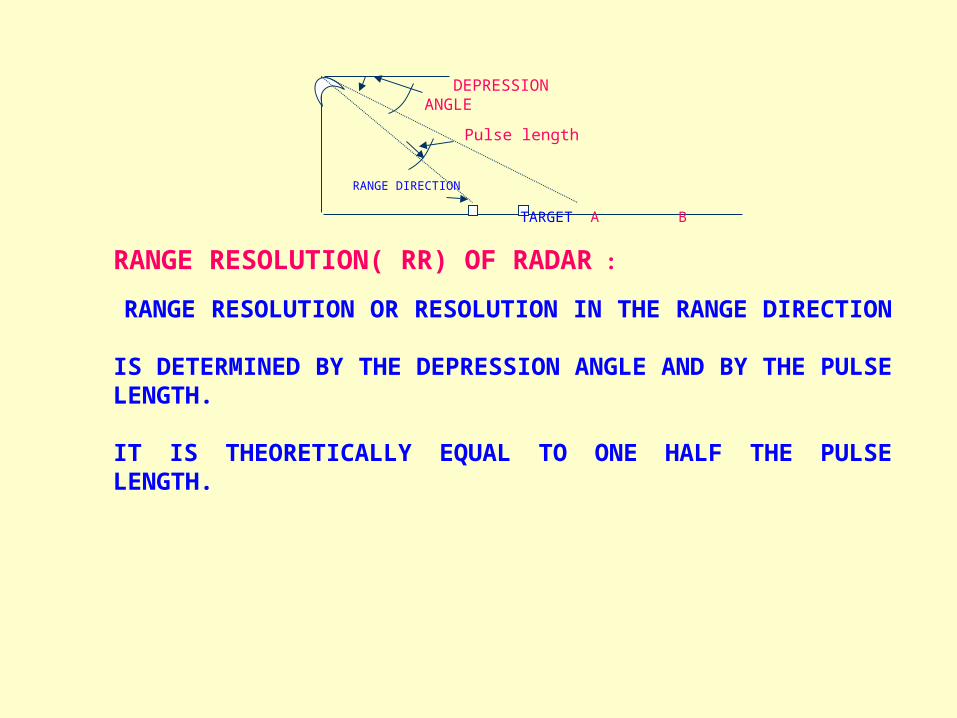
DEPRESSION ANGLE
Pulse length
RANGE DIRECTION
TARGET A B
RANGE RESOLUTION( RR) OF RADAR :
RANGE RESOLUTION OR RESOLUTION IN THE RANGE DIRECTION
IS DETERMINED BY THE DEPRESSION ANGLE AND BY THE PULSE LENGTH.
IT IS THEORETICALLY EQUAL TO ONE HALF THE PULSE LENGTH.

How Radar Works
A typical radar system consists of the following components:
(1) a pulse generator that discharges timed pulses of microwave/radio energy
(2) a transmitter
(3) a duplexer
(4) a directional antenna that shapes and focuses each pulse into a stream (5) Returned pulses that the receive antenna picks up and sends to a receiver that converts (and amplifies) them into video signals
(6) A recording device which stores them digitally for later processing and/or produces a real time analog display on a cathode ray tube (CRT) or drives a moving light spot to record on film.

RADAR CHARACTERISTICS : RADAR RECORDS MAY BE DIVIDED INTO FEATURES CHARACTERISTIC OF AN RADAR IMAGE . THESE ARE : 1.HIGHLIGHTS : CAUSED BY STRONG RADAR RETURNS. 2.SHADOW : NO ENERGY FROM TRANSMITTED PULSES REACH THESE AREAS 3.DIFFUSED : SIGNATURES WITH INTERMEDIATE GRAY TONES DENOTING IRREGULAR SURFACE.4.CORNER REFLECTORS : FORMED BY INTERSECTING PLANAR STRUCTURES. 5.SPECULAR SIGNATURES : NO TRANSMITTED ENERGY RETURNS TO THE ANTENNA AND A DARK SIGNATURE FORMS.
Light
Specular CORNER REFLECTION HIGHLIGHT
Diffused SHADOW
DARK GRAY SCALE


Elements of Interpretation Tone Size Shape Pattern Shadow Texture Location / Site Association Resolution Slope & Aspect

Red, Green Blue Display
R G B R G B R G B

1.Tone•Relative Brightness or Color of the Objects
•On Panchromatic imagery - Shades of Gray•On True / False Color Imagery - RGB/IHS
•For Vegetation Depends upon Aspect & Slope, soil changes, Season/Time etc.
•Depends upon Properties of the objects

2.Size •Spatial dimension of the object
3.Shape •General form, Configuration of the object
4.Pattern •Spatial arrangement of the surface features •Linear, Regular or Irregular – Manmade /Natural forest
5.Shadows •Due to Sun’s illumination angle, size and shape of the object
6.Texture •Frequency of tonal changes•Product of size, shape, tone, pattern shadow•Fine, Medium, Coarse, Rough
•Grass lands - Fine, Homogeneous young Forest - Medium to Coarse, Degraded Forest - Coarse
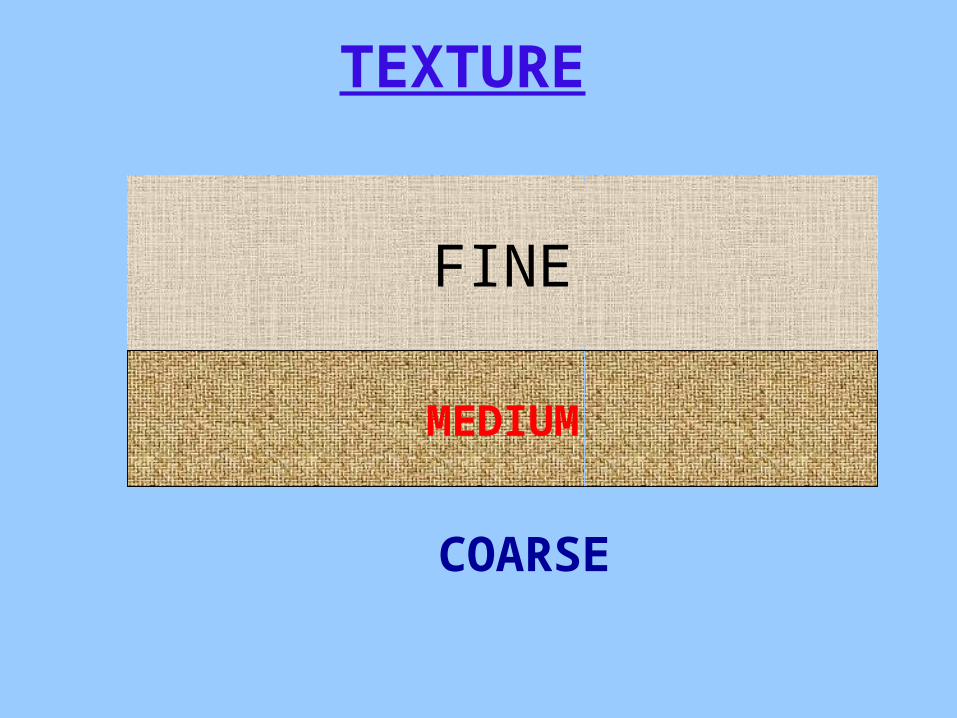
FINE
MEDIUM
TEXTURE
COARSE

7. Association •Occurrence of certain features in relation to other• Building and shadow
8.Location/Site •Geographic or Topographic location•Altitudinal variation
9.Resolution •Spatial, Spectral, Radiometric, Temporal
10.Aspect •Direction in which slope is facing
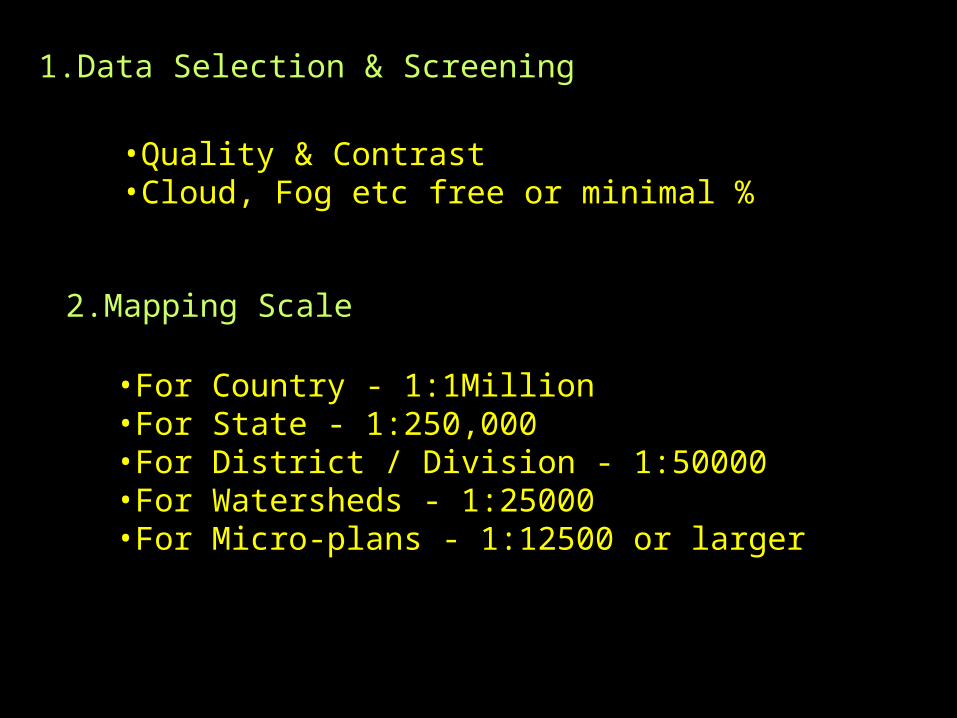
1.Data Selection & Screening
•Quality & Contrast•Cloud, Fog etc free or minimal %
2.Mapping Scale
•For Country - 1:1Million•For State - 1:250,000•For District / Division - 1:50000•For Watersheds - 1:25000•For Micro-plans - 1:12500 or larger

Ground Truthing•Process of establishing correlation between spectralsignatures and ground information
•Scene dependant
High contrast images - Less amountIf tonal & textural variations are high - More amount
•Utilized for calibrating the radiometers, Spectrometers etc.
•Probability Proportionate Stratified Random sampling
•Field visit and collection of ground information, ancillaryinformation and reference material for inaccessible areas
•Collection of spectral signatures for various representativeobjects
•Feeding the details to computer and Refinement of classification

• REAL TIME• SPATIAL LOCATIONS
AND EXTENTS OF FEATURES CAN BE COLLECTED ACURATELY
• CHEAPER• FASTER• DIFFERENT SCALES• EASY UPDATION• MORE ANALYTICAL
THEMES
ADVANTAGES OF REMOTE SENSING

1. Readily available at range of scales
2. Cheaper and more accurate than field surveys
3. Gives Synoptic view
4. Remote sensing data is a record of earth surface at one point in time
5. The radiation outside the human sensitivity range i.e.,UV, IR, MW etc., can be sensed through remote sensing
6. Stereoscopic view can be created and measured horizontally and vertically
7. Inaccessible areas can be mapped easily
Rationale for use of Remote Sensing data

Photogrammetry
• Photogrammetry is defined as the technique of obtaining reliable measurements of objects from photographs
• To make accurate measurements it is necessary to determine, as accurately as possible, photographic scale
Photographic Scale
• Scale defines the relationship between a linear distance on a vertical photograph and the corresponding actual distance on the ground
• Photographic scale indicates proportional distance
• Scale expressed as a representative fraction (RF) between the linear distance on the photo (numerator) and the corresponding distance on the ground (denominator)
• Example: 1/25,000 or 1:25,000 means that a length of 1 unit of measurement on the photo represents 25,000 units of measurement on the ground

Principles of Photogrammetry
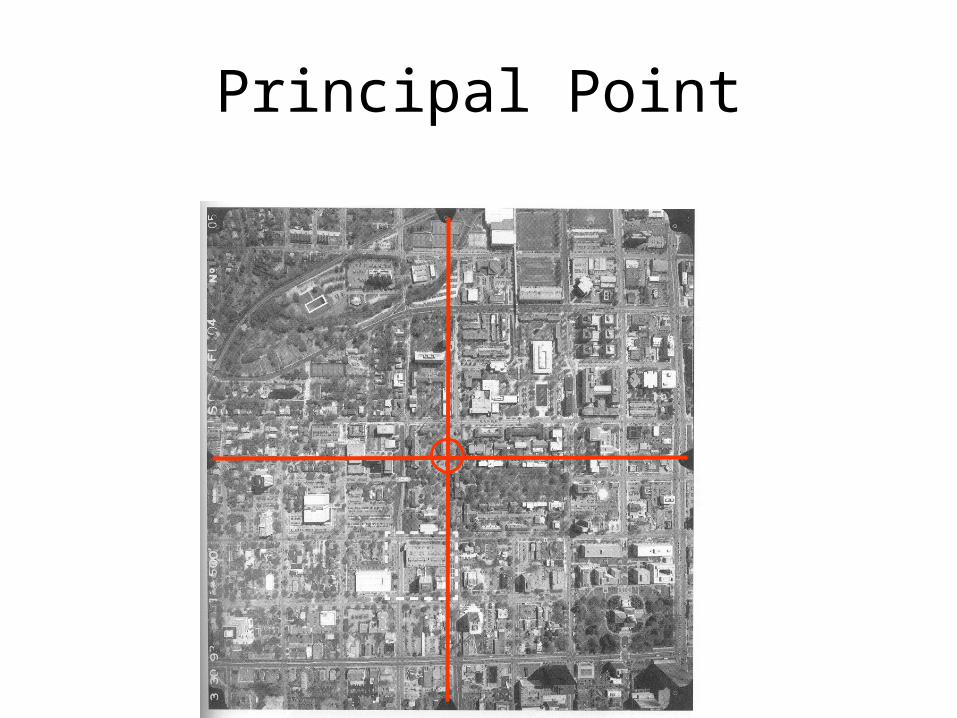
Principal Point


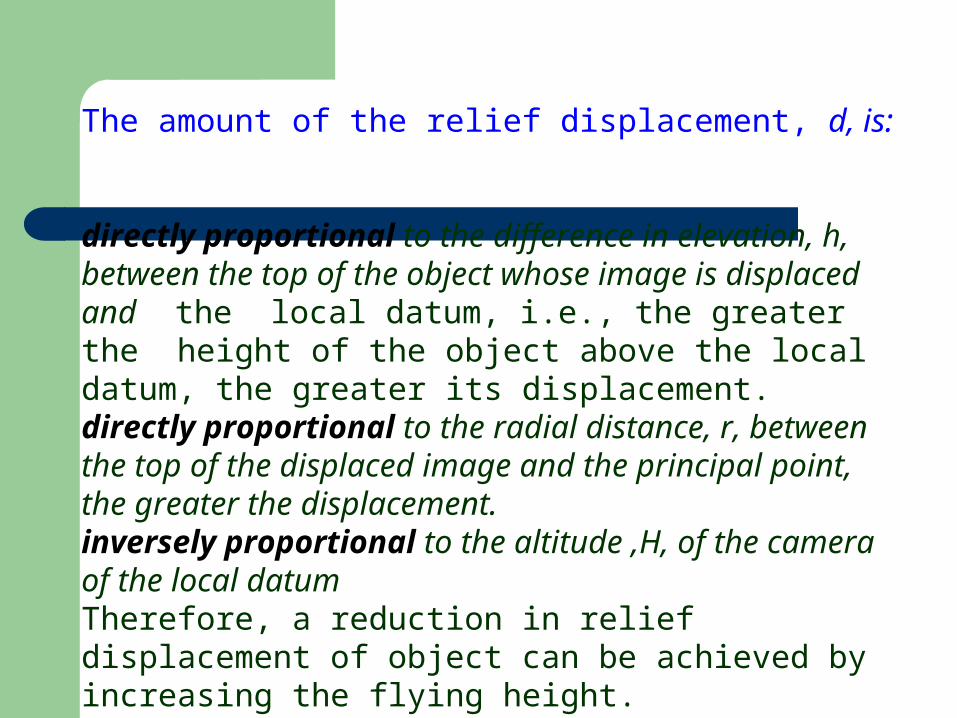
The amount of the relief displacement, d, is:
directly proportional to the difference in elevation, h, between the top of the object whose image is displaced and the local datum, i.e., the greater the height of the object above the local datum, the greater its displacement.directly proportional to the radial distance, r, between the top of the displaced image and the principal point, the greater the displacement.inversely proportional to the altitude ,H, of the camera of the local datumTherefore, a reduction in relief displacement of object can be achieved by increasing the flying height.

RESOURCESAT
SPECIFICATIONS

IRS-P6 (RESOURCESAT-1) is the most advanced
remote sensing satellite built by ISRO.
The tenth satellite of ISRO in IRS series, IRS-P6 , launched on Oct. 17, 2003 PSLV-C5
Sun Synchronous Orbit
Three cameras
RESOURCESAT (IRS-P6) sensors viz., LISS-3, LISS-4 and AWiFS are designed to provide monoscopic and stereoscopic data of varying resolutions. The geometric and spectral characteristics of the sensors are given.
The payloads will greatly aid crop/vegetation and integrated land and water resources related applications.

Sensor
Spatial Resn m
Steerablity
Swath
Km
Spectral Bands
RadiometricResn
LISS-3 23.5 No 140B2, B3, B4
& B57 bits
LISS-4
5.8
Yes
70B3 (Monochromatic)
7 bits
5.823 B2, B3 &
B4
AWiFS- A - B
70No
370B2, B3 &
B4 10 bits
70370
---Do---

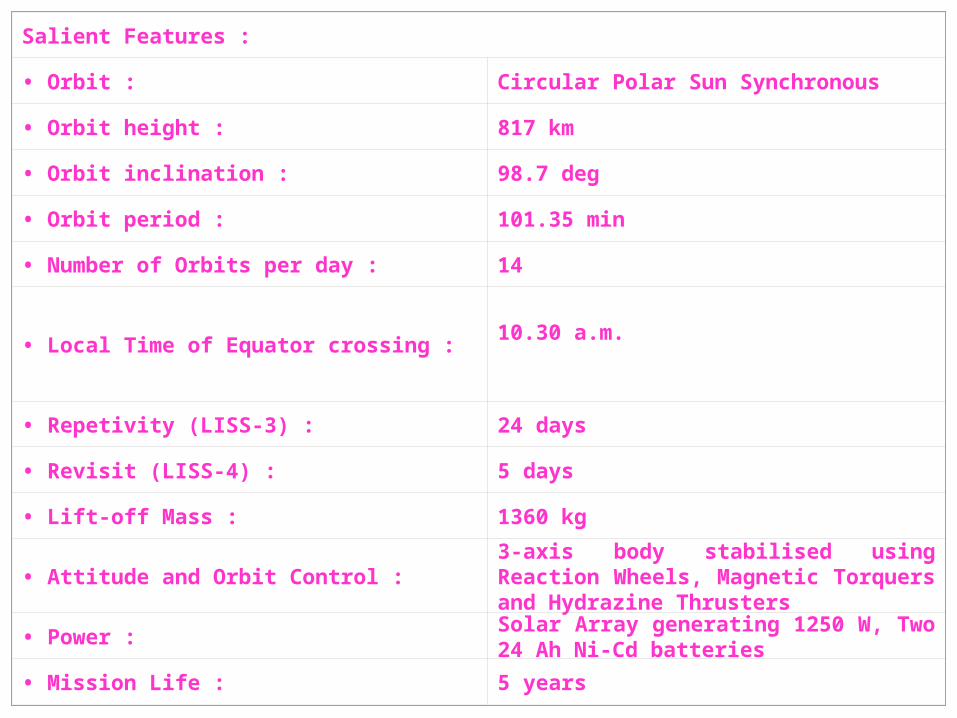
Salient Features :
• Orbit : Circular Polar Sun Synchronous
• Orbit height : 817 km
• Orbit inclination : 98.7 deg
• Orbit period : 101.35 min
• Number of Orbits per day : 14
• Local Time of Equator crossing :10.30 a.m.
• Repetivity (LISS-3) : 24 days
• Revisit (LISS-4) : 5 days
• Lift-off Mass : 1360 kg
• Attitude and Orbit Control :3-axis body stabilised using Reaction Wheels, Magnetic Torquers and Hydrazine Thrusters
• Power :Solar Array generating 1250 W, Two 24 Ah Ni-Cd batteries
• Mission Life : 5 years


IRS 1C/1D RESOURCESAT OCEANSAT
LISS III PAN WiFS LISS III LISS IV AWifs OCM(Ocean Colour Monitor)
No of Spectral bands
4 1 2 4 3 3 8
Spectral Bands (microns)
B2 0.52-0.59B3 0.62-0.68B4 0.77-0.86B5 1.55-1.70
0.50 -0.75 B3 0.62-0.68B4 0.77-0.86
0.52-0.590.62-0.680.77-0.86
0.52-0.59 0.62-0.680.77-0.86 1.55-1.70
0.52-0.59 0.62-0.680.77-0.86 1.55-1.70
0.402-0.422 0.433-0.4530.480-0.500 0.500-0.520 0.545-0.565 0.660-0.680 0.745-0.7850.845-0.885
Spatial Resolution(m)
23.5 for B2,B3,B4 and 70.5 for B5
Better than 10
188 23.5 5.8 56 360
Swath 142 km for B2, B3,B4 and 148 km for B5
70 km, nadir Steering Range ± 26°
774 km 141km 23.9(MX mode)70.3(PAN mode)
740 km 1420 km
Radiometric levels
128 64 128 7 bits 7 bits 10 bits

