future for rural iowa presented at 77 th annual soil management and land valuation conference may...
TRANSCRIPT

FUTURE FOR RURAL IOWA
Presented at 77th Annual Soil ManagementAnd Land Valuation Conference
May 19, 2004by Kenneth E. Stone, Professor Emeritus of Economics, ISU

SOME OF THE PROBLEMS

1. Retail Migration
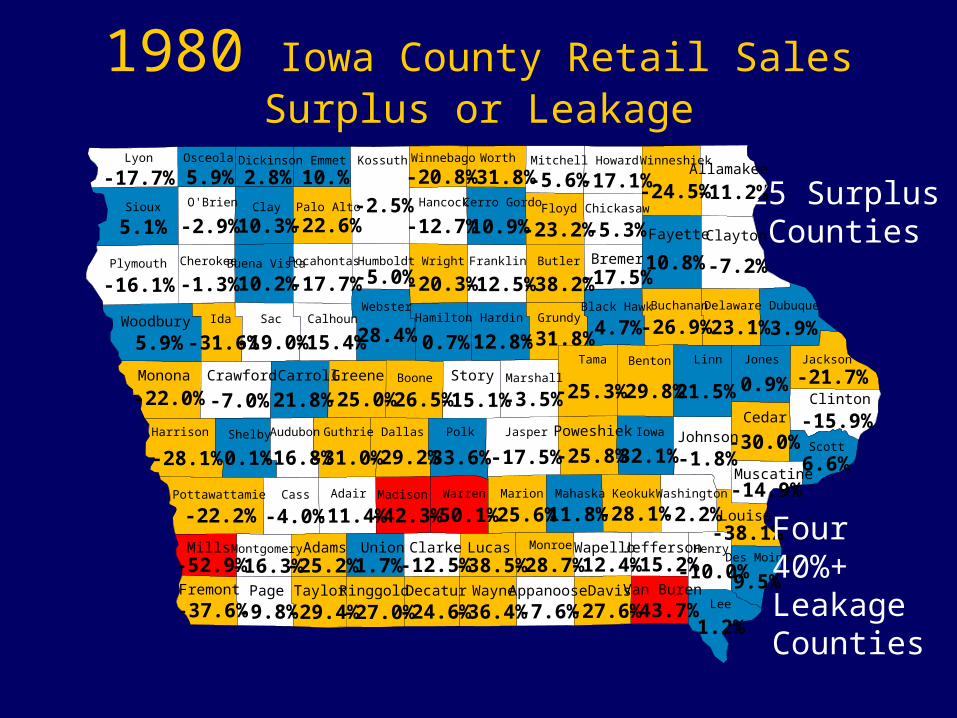
1980 Iowa County Retail Sales Surplus or Leakage
-2.5%
-22.2%
5.9%
-16.1%-7.2%
5.1%
10.8%
-17.5%
-25.3% 21.5%
28.4%
-29.8%
-28.1%
-24.5%
-7.0%-22.0%
-11.2%
-15.9%
-1.8%
-21.7%
-17.7%
-31.0%
3.9%
-30.0%
-28.1%
-25.8%
10.2%
-19.0%
-25.6%
-29.2%
12.8%
-12.5%
33.6%
-20.3%
-50.1%
10.9%
-26.9%
0.9%
-38.2%
-3.5%-15.1%
32.1%
-26.5%
10.3%
21.8%
0.7%
-1.3%
-17.7%
11.8%
0.1%
-25.0%
-23.1%-15.4%
-11.4%
-22.6%-2.9%
-2.2%
4.7%
-12.7%
-4.0% -42.3%
-27.0%
-23.2% -5.3%
1.2%-36.4% -7.6%
-31.8%
-24.6%-29.4% -27.6%-9.8%-37.6% -43.7%
6.6%
-17.1%-5.6%
-5.0%
-28.7%
-16.8%
-12.4% -15.2%
-14.9%
-17.5%
-10.0%1.7%-52.9% -38.5%-12.5%
-31.6%
-31.8%
-16.3% -25.2%9.5%
-20.8%
-38.1%
2.8%5.9% 10.% AllamakeeWinneshiekHowardMitchellWorthWinnebagoKossuthEmmetDickinsonOsceolaLyon
Sioux O'Brien Clay Palo Alto Hancock Cerro Gordo Floyd Chickasaw
Fayette Clayton
DubuqueDelawareBuchanan
Bremer
Black Hawk
Butler
GrundyHardin
FranklinWright
Hamilton
Humboldt
Webster
Pocahontas
CalhounSac
Buena VistaCherokee
IdaWoodbury
Plymouth
JacksonJonesLinnBentonTama
MarshallStoryBooneGreeneCarrollCrawfordMonona
Harrison Shelby Audubon Guthrie Dallas Polk Jasper Poweshiek Iowa Johnson
Muscatine
Cedar
Scott
Clinton
Louisa
WashingtonKeokukMahaskaMarionWarrenMadisonAdairCass
Mills Montgomery
Fremont Page Taylor
Adams Union
Ringgold Decatur
Clarke Lucas
WayneAppanoose
Monroe Wapello
Davis Van Buren
Jefferson Henry
Lee
Des Moines
Pottawattamie
25 SurplusCounties
Four40%+LeakageCounties

2001 Iowa County Retail Sales Surplus or Leakage
-59%-19%28%-37% -5%LYON OSCEOLA DICKINSON EMMET KOSSUTH WINNEBAGO WORTH MITCHELL HOWARD WINNESHIEK ALLAMAKEE
-24%
6%
5%
-36%-36%
-18%
-20%
-21%
-40% 28%
28%
-46%
-57%
-13%
-34%-45%
-24%
-12%
3%
-34%
-48%
-44%
16%
-57%
-66%
-27%
-13%
-44%
-28%
-49%
-17%
-44%
37%
-24%
-54%
27%
-40%
-18%
-59%
-8%-7%
-2%
-34%
46%
5%
-32%
-30%
-44%
-21%
-34%
-37%
-33%-60%
-30%
-40%-22%
-35%
18%
-51%
-11% -39%
-38%
-33% -36%
-10%-57% -25%
-58%
-45%-56% -44%-36%-17% -62%
26%
-34%-39%
-31%
-44%
-52%
10% 0%
-11%
-37%
-36%16%-60% -45%-29%
-41%
-22% -49%18%
-80%
CLAYTONFAYETTE
CHICKASAWFLOYDCERRO GORDOHANCOCK
WRIGHT FRANKLIN BUTLER BREMER
DUBUQUEDELAWAREBUCHANANBLACK HAWKGRUNDYHARDINHAMILTON
WEBSTER
HUMBOLDTPOCAHONTAS
PALO ALTOCLAY
BUENA VISTA
CALHOUNSACIDA
WOODBURY
PLYMOUTH
SIOUX O'BRIEN
CHEROKEE
MONONA CRAWFORD CARROLL GREENE BOONE STORY MARSHALL
TAMA BENTON LINN JONES JACKSON
CLINTON
SCOTT
CEDAR
MUSCATINE
LOUISA
DES MOINES
HENRY
LEE
JEFFERSON
VAN BURENDAVIS
WAPELLO
KEOKUK
IOWA JOHNSONPOWESHIEKJASPERPOLKDALLASGUTHRIEAUDUBONSHELBYHARRISON
CASS ADAIR MADISON WARREN
LUCAS MONROE
APPANOOSE
MARION MAHASKA
WAYNEDECATUR
CLARKEUNION
RINGGOLDTAYLOR
ADAMSMONTGOMERY
PAGEFREMONT
POTTAWATTAMIE
MILLS
WASHINGTON
17 SurplusCounties
(32) 40%+LeakageCounties

Population Over 50,000 Share of Total Iowa Retail Market
34%
36%
38%
40%
42%
44%
46%
48%
76 78 80 82 84 86 88 90 92 94 96 98 '00
% Market Share
Fiscal Year

Population Over 5,000 to 10,000 Share of Total Iowa Retail Market
11%
12%
13%
14%
76 78 80 82 84 86 88 90 92 94 96 98 '00
% Market Share
Fiscal Year

Population 1,000 to 2,500 Share of Total Iowa Retail Market
5%
6%
7%
8%
9%
10%
76 78 80 82 84 86 88 90 92 94 96 98 '00
% Market Share
Fiscal Year
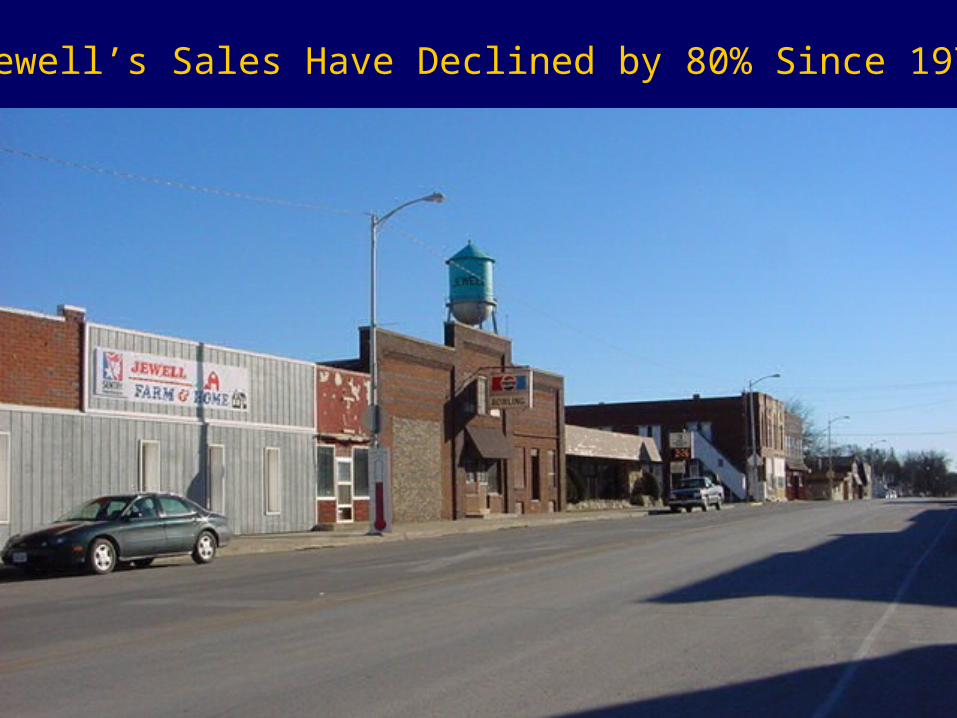
Jewell’s Sales Have Declined by 80% Since 1976
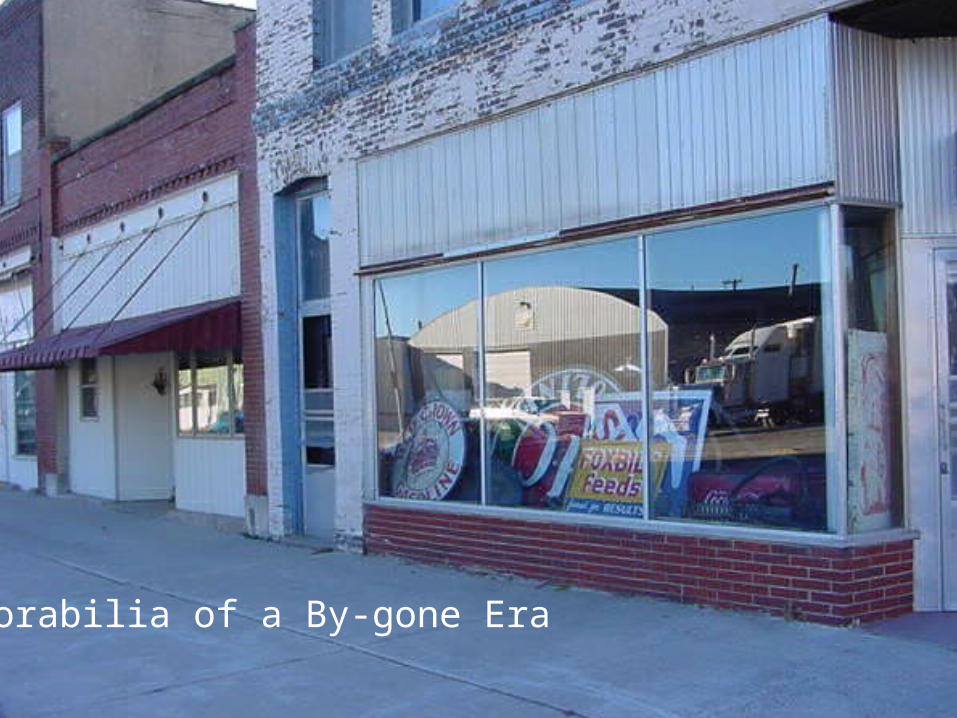
Memorabilia of a By-gone Era

EVENTS THAT CAUSED BIG CHANGES IN IOWA RETAIL

Population Changes

Rural PopulationIowa
1940 1950 1960 1970 1980 1990 20000
500
1000
1500
2000Thousands

Country Place Farm
Iowa’s Rural Population
Source: Dr. Willis Goudy, Census Services


Urban PopulationIowa
1940 1950 1960 1970 1980 1990 20000
500
1000
1500
2000Thousands

Urban PopulationIowa
1940 1950 1960 1970 1980 1990 20000
0.5
1
1.5
2Millions
50,000+ 10,000-49,999 2,500-9,999

Shopping Malls

Coral Ridge Mall-1.2 Million Square Feet, Approx. $250 Mil Per Year

Tanger Factory Outlet Mall-Approx. $100 Mil Per Year
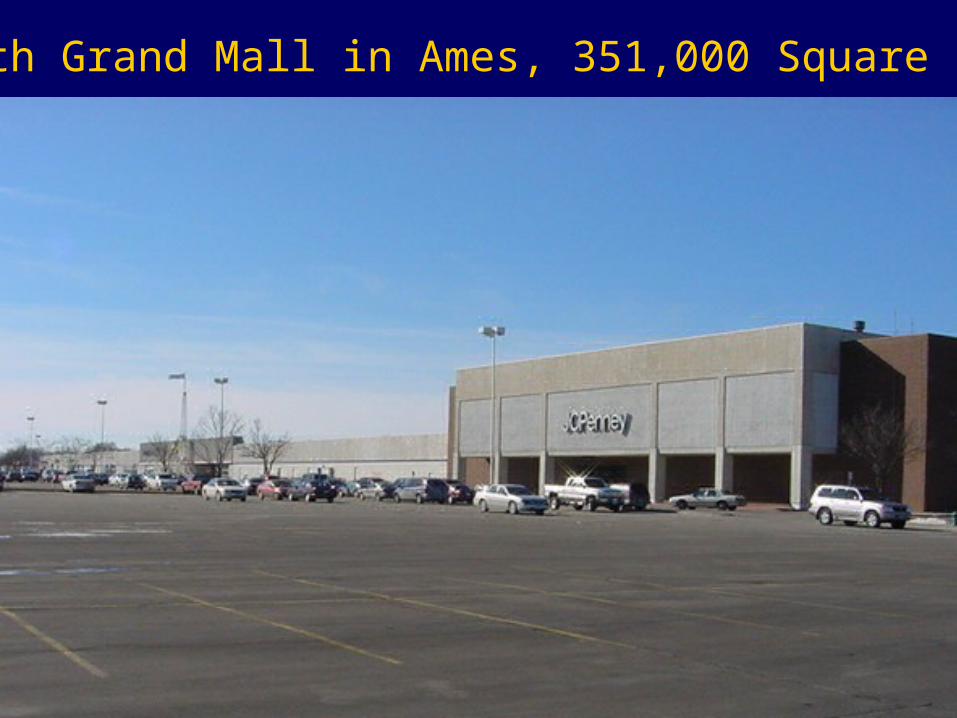
North Grand Mall in Ames, 351,000 Square Feet

Discount Department Stores

SUPER TARGET STORE IN ANKENY, IOWA, 240,000 SQUARE FEET

Wal*Mart Supercenter, 220,000 Sq. Ft., Ankeny, IA

BIG K MART AT AMES, IOWA

Big-Box Building Materials Stores

MENARD’S HOME IMPROVEMENT STORE IN ANKENY, IA

HOME DEPOT AT ANKENY, IOWA

LOWE’S HOME IMPROVEMENT AT AMES, IA

Ever Bigger Grocery Stores

CUB Food Store, Ames, IA, 65,000 Square Feet

HY VEE FOOD STORE LOCATED AT SITE OFFORMER K MART, 70,000 Square Feet
WHY IS RETAIL IMPORTANT?

The Multiplier Concept of Local Respending Patterns
Initial $1.00
of exports 40¢
respent locally
16¢ respent locally
6¢ respent locally
60¢ leakage
24¢ leakage
10¢ leakage
3¢ leakage
3¢ respent locally
2¢ leakage
1¢ respent locally
Initial impact: $1.00
$1.00 .40 .16 .06 .03 .02Full impact: $1.66

Trends of Different Types of Retail Businesses

DECLINING BUSINESSES

Men’s Apparel StoresChange 1976 to 1998
-76.9%
-66.6%
-30.8%
-100% -80% -60% -40% -20% 0%
Change in Sales PerFirm
Change in Numberof Firms
Change in TotalSales
Figures have been adjusted for inflation.
-209

Iowa Clothing StoresChange 1976 to 2002
-13.6%
-12.6%
-1.1%
-20% 0%
Change in Sales PerFirm
Change in Numberof Firms
Change in TotalSales
Figures have been adjusted for inflation.
-178

Iowa Drug StoresChange 1976 to 2002
-32.8%
-1.8%
-31.5%
-40% -20% 0%
Change in Sales PerFirm
Change in Numberof Firms
Change in TotalSales
Figures have been adjusted for inflation.
-12

CONSOLIDATING BUSINESSES

Iowa Department StoresChange 1976 to 2002
89.0%
-21.9%
142.0%
-80% -40% 0% 40% 80% 120% 160%
Change in Sales PerFirm
Change in Numberof Firms
Change in TotalSales
Figures have been adjusted for inflation.
-74

Iowa Grocery StoresChange 1976 to 2002
-18.7%
-50.3%
63.4%
-80% -60% -40% -20% 0% 20% 40% 60% 80% 100%
Change in Sales PerFirm
Change in Numberof Firms
Change in TotalSales
Figures have been adjusted for inflation.
-965
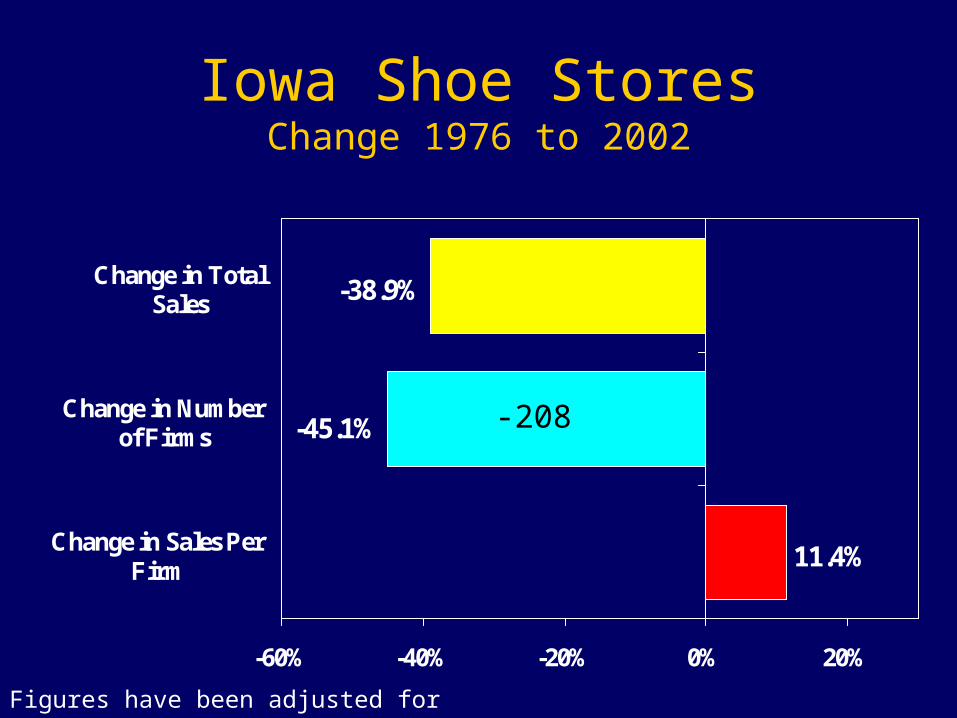
Iowa Shoe StoresChange 1976 to 2002
-38.9%
-45.1%
11.4%
-60% -40% -20% 0% 20%
Change in Sales PerFirm
Change in Numberof Firms
Change in TotalSales
Figures have been adjusted for inflation.
-208

Iowa Hardware StoresChange 1976 to 2002
-44.5%
-49.2%
9.3%
-60% -40% -20% 0% 20%
Change in Sales PerFirm
Change in Numberof Firms
Change in TotalSales
Figures have been adjusted for inflation.
-451

SATURATED BUSINESSES

Iowa Used Merchandise StoresChange 1976 to 2002
2.5%
104.0%
-49.8%
-80% -40% 0% 40% 80% 120%
Change in Sales PerFirm
Change in Numberof Firms
Change in TotalSales
Figures have been adjusted for inflation.
+1,085

Iowa Hobby, Toy, Craft StoresChange 1976 to 2002
439.0%
907.0%
-46.6%
-300% -100% 100% 300% 500% 700% 900% 1100%
Change in Sales PerFirm
Change in Numberof Firms
Change in TotalSales
Figures have been adjusted for inflation.
+3,178

Iowa FloristsChange 1976 to 2002
-10.6%
52.4%
-41.3%
-60% -40% -20% 0% 20% 40% 60% 80%
Change in Sales PerFirm
Change in Numberof Firms
Change in TotalSales
Figures have been adjusted for inflation.
+178

Iowa Jewelry StoresChange 1976 to 2002
-23.2%
6.5%
-27.8%
-40% -20% 0% 20%
Change in Sales PerFirm
Change in Numberof Firms
Change in TotalSales
Figures have been adjusted for inflation.
+29

Iowa Photo StudiosChange 1976 to 2002
81.2%
148.7%
-27.1%
-60% -20% 20% 60% 100% 140% 180%
Change in Sales PerFirm
Change in Numberof Firms
Change in TotalSales
Figures have been adjusted for inflation.
+531

Iowa Auto Parts StoresChange 1976 to 2002
27.9%
63.9%
-22.0%
-40% -20% 0% 20% 40% 60% 80%
Change in Sales PerFirm
Change in Numberof Firms
Change in TotalSales
Figures have been adjusted for inflation.
+539

Iowa Gift & Novelty StoresChange 1976 to 2002
90.7%
133.8%
-18.4%
-60% -20% 20% 60% 100% 140% 180%
Change in Sales PerFirm
Change in Numberof Firms
Change in TotalSales
Figures have been adjusted for inflation.
+625

Iowa Book & Stationery StoresChange 1976 to 2002
71.8%
99.7%
-14.0%
-40% -20% 0% 20% 40% 60% 80% 100% 120%
Change in Sales PerFirm
Change in Numberof Firms
Change in TotalSales
Figures have been adjusted for inflation.
+248

GROWING BUSINESSES

Iowa Building Maintenance FirmsChange 1976 to 2002
1648.0%
1227.0%
31.7%
0% 400% 800% 1200% 1600% 2000%
Change in Sales PerFirm
Change in Numberof Firms
Change in TotalSales
Figures have been adjusted for inflation.
+1,028

Iowa Auto Repair & Service FirmsChange 1976 to 2002
66.6%
41.2%
18.0%
0% 20% 40% 60% 80%
Change in Sales PerFirm
Change in Numberof Firms
Change in TotalSales
Figures have been adjusted for inflation.
+1,338

Iowa Beauty & Barber ShopsChange 1976 to 2002
20.1%
6.8%
12.5%
0% 10% 20% 30%
Change in Sales PerFirm
Change in Numberof Firms
Change in TotalSales
Figures have been adjusted for inflation.
+358

Iowa Eating & Drinking PlacesChange 1976 to 2002
24.6%
12.8%
10.5%
0% 10% 20% 30%
Change in Sales PerFirm
Change in Numberof Firms
Change in TotalSales
Figures have been adjusted for inflation.
+751

Winners and Losers for Small Towns

GROWING BUSINESSES IN IOWA TOWNSPopulation 1,000-2,499, 1987-1997
177.5
156
150
108.6
100
94
90.8
87.5
84.3
76.3
Hobby, Toy, Craft Stores
Veterinary Services
Music Stores
Cleaning & Maintenance
Equip. Rental & Leasing
Sporting Goods
General Construction
Book Stores
Used Merchandise
Plumbing & AC Sales
Type of Business
0 50 100 150 200
Percent Change

DECLINING BUSINESSES IN IOWA TOWNSPopulation1,000-2,499, 1987-1997
-47.6
-46.7
-37.5
-36.7
-35.7
-29.1
-23.8
-23.6
-22.2
-20
Variety Stores
Dry Cleaning Plants
Gasoline Stations
Women's Clothing Stores
Department Stores
Radio & TV Repair
Barber Shops
Grocery Stores
Shoe Stores
Hardware Stores
Type of Business
0-10-20-30-40-50-60
Percent Change

THRESHOLD LEVELS FOR SELECTED BUSINESSES IN IOWA, 2001
363
705
1,124
1,585
2,941
3,399
3,595
4,127
4,186
4,394
4,910
5,449
10,377
11,566
0 2,000 4,000 6,000 8,000 10,000 12,000 14,000
RESTAURANTS, TAVERNS, & BARS
USED MERCHANDISE STORES
SPORTING GOODS & BICYCLE SHOPS
LAWN, GARDEN, TREE, & LANDSCAPE SERVICE
GROCERY STORES
LUMBER & BUILDING MATERIALS DEALERS
FLORISTS
FURNITURE STORES
JEWELRY STORES
RETAIL NURSERIES, LAWN & GARDEN SUPPLY
DRUG STORES
HARDWARE STORES
SHOE STORES
DEPARTMENT STORES

ANOTHER MAJOR PROBLEM
2. Regional Inequities in Jobs

Iowa Per Capita Personal Income
$18,000
$20,000
$22,000
$24,000
$26,000
$28,000
$30,000
1980 1985 1990 1995 2000
US IowaNW NECentral SWSE
Source: Bureau of Economic Analysis

Iowa Average Earnings Per Job
$20,000
$22,000
$24,000
$26,000
$28,000
$30,000
$32,000
$34,000
$36,000
1980 1985 1990 1995 2000
U.S. IowaNW NECentral SWSE
Source: Bureau of Economic Analysis

Average Wage Per Job, 2000
$20,969
$24,564
$25,873
$24,702$21,648
$21,570
$20,231
$29,418
$21,969 $33,426
$26,018
$22,174
$20,337
$22,432
$22,633$19,231
$19,728
$25,148
$27,893
$18,477
$20,621
$19,337
$26,590
$21,724
$21,088
$25,716
$22,178
$20,021
$29,220
$26,930
$22,645
$23,405
$33,106
$24,872
$21,914
$24,654
$23,049
$21,434
$20,013
$26,175$25,824
$26,810
$25,577
$23,642
$21,341
$24,433
$22,142
$19,126
$22,027
$19,612
$22,309
$21,422$19,015
$22,134
$20,206$19,561
$21,277
$26,973
$25,713
$21,480 $21,176
$20,469
$22,185 $22,987
$26,219$18,718 $21,344
$24,461
$17,431$18,444 $21,316$23,352$24,732 $20,883
$28,414
$22,657$21,566
$22,875
$26,818
$19,624
$24,078 $27,978
$30,934
$23,678
$25,859$22,087$23,166 $22,368$22,088
$24,776
$20,583
$22,451$22,349$27,665
$19,724
$22,196
$22,368$21,169 $23,518LYON
SIOUX
PLYMOUTH
WOODBURY
MONONA
HARRISON
POTTAWATTAMIE
MILLS
FREMONT PAGE TAYLOR RINGGOLD DECATUR WAYNE APPANOOSE DAVIS VAN BUREN
LEE
DES MOINES
HENRYJEFFERSONWAPELLOMONROELUCASCLARKEUNIONADAMSMONTGOMERY
CASS ADAIR MADISON WARREN MARION MAHASKA KEOKUK WASHINGTON
LOUISA
MUSCATINE
SCOTT
CLINTON
JACKSONJONES
CEDAR
LINN
JOHNSON
BENTON
IOWA
TAMA
POWESHIEKJASPER
MARSHALLSTORY
POLKDALLAS
BOONEGREENE
GUTHRIEAUDUBON
CARROLLCRAWFORD
SHELBY
IDA SAC
CHEROKEE BUENA VISTA POCAHONTAS HUMBOLDT
KOSSUTH
CALHOUN
WEBSTER
HAMILTON HARDIN GRUNDY
BLACK HAWK BUCHANAN DELAWARE DUBUQUE
CLAYTON
ALLAMAKEEWINNESHIEK
FAYETTE
HOWARDMITCHELLWORTHWINNEBAGO
HANCOCK CERRO GORDOFLOYD CHICKASAW
BREMERBUTLER
FRANKLINWRIGHT
EMMET
PALO ALTO
DICKINSON
CLAY
OSCEOLA
O'BRIEN
2000 Average Wage Per Job75% of state average or below
Less than state average (at least 75% of state average)Greater than state average

Average Manufacturing Earnings Per Employee (in 2000 Constant Dollars)
$50,161
$43,813 $43,346
$42,695
$40,112
$46,705
$35,000
$37,000
$39,000
$41,000
$43,000
$45,000
$47,000
$49,000
$51,000
1980 1985 1990 1995 2000
U.S.Plains Iowa
Source: Bureau of Economic Analysis

Iowa Average Manufacturing Earnings Per Employee (in 2000 Constant Dollars)
$25,000
$30,000
$35,000
$40,000
$45,000
$50,000
$55,000
1980 1985 1990 1995 2000
U.S. IowaNW NECentral SWSE
Source: Bureau of Economic Analysis

Government Earnings as a Percent of Total Earnings, 1980-2000
15.5%
17.9%
16.6%
15.2%15.2%
15.9%
12%
13%
14%
15%
16%
17%
18%
19%
1980 1985 1990 1995 2000
U.S.Plains Iowa
Source: Bureau of Economic Analysis

Iowa Government Earnings as a Percent of Total Earnings, 1980-2000
10%
12%
14%
16%
18%
20%
1980 1985 1990 1995 2000
U.S. IowaNW NECentral SWSE
Source: Bureau of Economic Analysis

Average Net Farm Proprietor’s Income(in 2000 Constant Dollars)
$14,385
$10,972
$2,067
$13,571
$5,899
$20,591
$0
$5,000
$10,000
$15,000
$20,000
$25,000
1980 1985 1990 1995 2000
U.S.Plains Iowa
Source: Bureau of Economic Analysis

Iowa Average Net Farm Proprietor’s Income (in 2000 Constant Dollars)
-$5,000
$0
$5,000
$10,000
$15,000
$20,000
$25,000
$30,000
$35,000
1980 1985 1990 1995 2000
U.S. Iowa NWNE Central SWSE
Source: Bureau of Economic Analysis

2000 Farm Payments Per Capita
$3,080
$462
$303
$1,310$1,479
$1,302
$1,709
$795
$1,775 $131
$826
$1,389
$1,786
$1,338
$1,778$2,626
$1,078
$764
$175
$941
$3,456
$1,718
$270
$1,794
$2,142
$1,242
$1,300
$2,246
$465
$566
$1,536
$2,834
$45
$2,162
$381
$650
$1,485
$1,244
$1,782
$671$354
$1,452
$942
$1,516
$1,262
$1,714
$1,776
$2,147
$1,181
$2,178
$2,615
$1,838$2,521
$2,569
$2,723$1,907
$1,266
$193
$2,579
$1,715 $905
$2,139
$1,464 $1,933
$378$1,875 $556
$2,228
$969$2,096 $1,215$1,089$2,415 $1,272
$129
$2,099$2,086
$2,274
$879
$2,875
$334 $904
$429
$1,024
$918$824$1,053 $783$937
$2,410
$2,476
$1,320$2,911$318
$1,939
$1,281
$927$2,914 $1,881LYON
SIOUX
PLYMOUTH
WOODBURY
MONONA
HARRISON
POTTAWATTAMIE
MILLS
FREMONT PAGE TAYLOR RINGGOLD DECATUR WAYNE APPANOOSE DAVIS VAN BUREN
LEE
DES MOINES
HENRYJEFFERSONWAPELLOMONROELUCASCLARKEUNIONADAMSMONTGOMERY
CASS ADAIR MADISON WARREN MARION MAHASKA KEOKUK WASHINGTON
LOUISA
MUSCATINE
SCOTT
CLINTON
JACKSONJONES
CEDAR
LINN
JOHNSON
BENTON
IOWA
TAMA
POWESHIEKJASPER
MARSHALLSTORY
POLKDALLAS
BOONEGREENE
GUTHRIEAUDUBON
CARROLLCRAWFORD
SHELBY
IDA SAC
CHEROKEE BUENA VISTA POCAHONTAS HUMBOLDT
KOSSUTH
CALHOUN
WEBSTER
HAMILTON HARDIN GRUNDY
BLACK HAWK BUCHANAN DELAWARE DUBUQUE
CLAYTON
ALLAMAKEEWINNESHIEK
FAYETTE
HOWARDMITCHELLWORTHWINNEBAGO
HANCOCK CERRO GORDOFLOYD CHICKASAW
BREMERBUTLER
FRANKLINWRIGHT
EMMET
PALO ALTO
DICKINSON
CLAY
OSCEOLA
O'BRIEN
2000 Farm Payments Per CapitaLess than state per capitaGreater than state per capitaMore than twice state per capita

FUTURE FOR RURAL IOWA
• As global economy expands, perhaps ag will become truly profitable and less dependent on government payments
• Improvements in telecommunications (Internet) will expand markets for rural prople.

FUTURE FOR RURAL IOWA(Continued)
• Rural Iowa will have to come to grips with excess government. Will have to consolidate schools, court houses and other services.
• Local jurisdictions will have to pool resources with others and work as regions.

FUTURE FOR RURAL IOWA(Continued)
• Rural Iowa will have to continue to develop and promote its recreational and tourism strengths.
• Rural Iowa will have to vigorously promote and recruit younger families from urban areas on the basis of a better quality of life.

FUTURE FOR RURAL IOWA(Continued)
• Rural Iowa must capitalize on the benefits of technology. High speed internet should be omnipresent. Rural Iowans should be able to communicate with the world in the most modern way possible.
• We’ve got to find some way to attract and retail young people in order to reinvigorate the state.

FOR ADDITIONAL INFORMATION
Contact: Kenneth E. StoneProfessor Emeritus of
Economics2208 Van Buren Av.Ames, IA 50010
Phone: (515) 232-7766Fax: (515) 232-4127E-mail: [email protected]: www.econ.iastate.edu/retail