future of us banking
TRANSCRIPT
8/14/2019 Future of Us Banking
http://slidepdf.com/reader/full/future-of-us-banking 1/19
Bank Branch Growth Has Been Steady— Will It Continue?
Ronald L. Spieker
Draft FOB–2004–08.1
Future of Banking Study
F EDERAL D EPOSIT I NSURANCE C ORPORATION
8/14/2019 Future of Us Banking
http://slidepdf.com/reader/full/future-of-us-banking 2/19
Bank Branch Growth Has Been Steady – Will It Continue?
Ronald L. Spieker
Chief, Regional Programs Section
Division of Insurance and Research
Federal Deposit Insurance Corporation
The views expressed in this paper are those of the author, and are not necessarily those of the Federal Deposit Insurance Corporation.
8/14/2019 Future of Us Banking
http://slidepdf.com/reader/full/future-of-us-banking 3/19
Bank Branch Growth Has Been Steady – Will It Continue?
Introduction
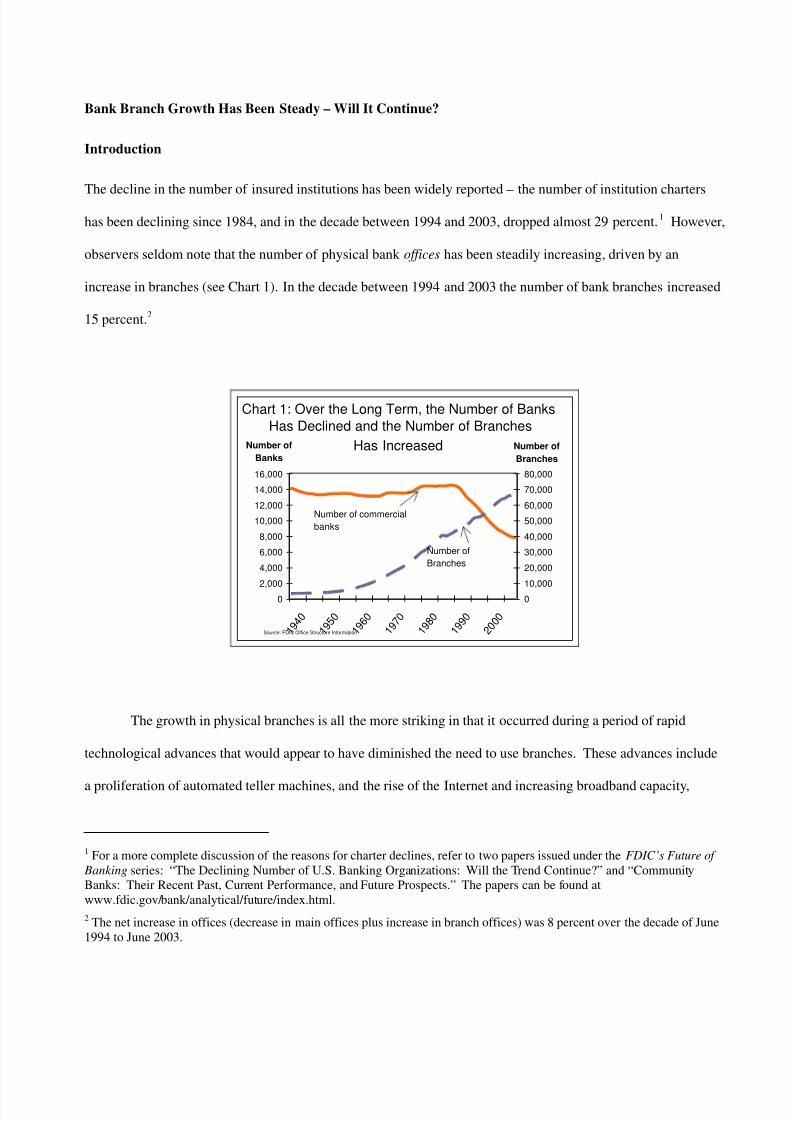
The decline in the number of insured institutions has been widely reported – the number of institution charters
has been declining since 1984, and in the decade between 1994 and 2003, dropped almost 29 percent.1 However,
observers seldom note that the number of physical bank offices has been steadily increasing, driven by an
increase in branches (see Chart 1). In the decade between 1994 and 2003 the number of bank branches increased
15 percent.2
0
2,000
4,000
6,000
8,000
10,000
12,000
14,000
16,000
1 9 4 0
1 9 5 0
1 9 6 0
1 9 7 0
1 9 8 0
1 9 9 0
2 0 0 0
Number of
Banks
0
10,000
20,000
30,000
40,000
50,000
60,000
70,000
80,000
Number of
Branches
Source: FDIC Office Structure Information
Number of
Branches
Number of commercial
banks
Chart 1: Over the Long Term, the Number of Banks
Has Declined and the Number of Branches
Has Increased
The growth in physical branches is all the more striking in that it occurred during a period of rapid
technological advances that would appear to have diminished the need to use branches. These advances include
a proliferation of automated teller machines, and the rise of the Internet and increasing broadband capacity,
1 For a more complete discussion of the reasons for charter declines, refer to two papers issued under the FDIC’s Future of
Banking series: “The Declining Number of U.S. Banking Organizations: Will the Trend Continue?” and “CommunityBanks: Their Recent Past, Current Performance, and Future Prospects.” The papers can be found atwww.fdic.gov/bank/analytical/future/index.html.
2 The net increase in offices (decrease in main offices plus increase in branch offices) was 8 percent over the decade of June1994 to June 2003.
8/14/2019 Future of Us Banking
http://slidepdf.com/reader/full/future-of-us-banking 4/19
2
which have enabled customers to bank on line. Moreover, legal changes and financial innovations have
intensified the competitive landscape by removing many of the traditional barriers between banks and other
financial service companies, allowing these companies to offer products and services typically provided through
bank offices, again seemingly reducing the need for physical bank branches. However, over time, bank branches
have proven to be a highly effective and profitable distribution channel, perhaps very simply because people
seem to like the convenience of bank branches. The ability to leverage branch networks to generate business has
helped distinguish banks in an extremely competitive financial services marketplace.
This paper investigates and reviews some of the reasons behind branching trends. The steady increase in
branching is due primarily to three factors: (1) changes in bank branching laws that led to structural shifts in
branching; (2) branching, when well executed, appears to improve performance; and (3) favorable economic and
demographic trends encourage branching in certain markets. Additionally, the paper will review some of the
more active markets and examine what branching trends may look like going forward.
Changes to Branch Banking Laws Contributed to the Rise of Multi-branch Institutions and the Overall
Increase in Branches
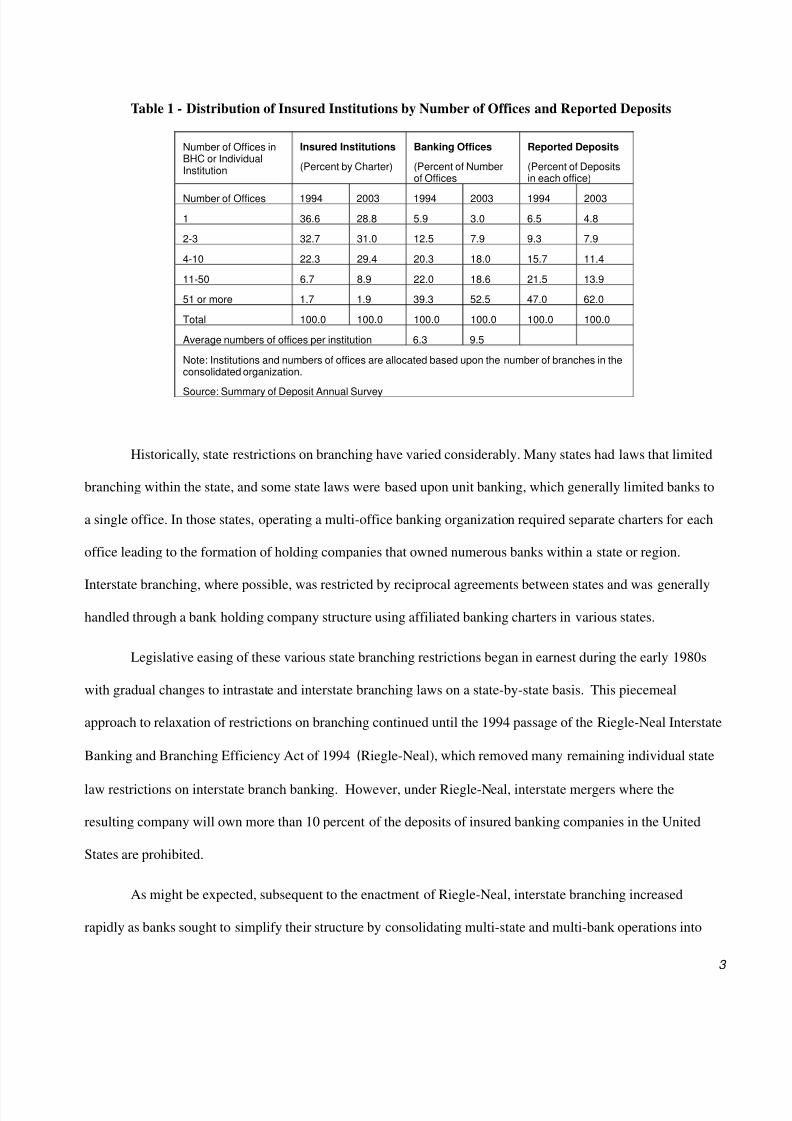
During the past decade, there has been a decline in the number and market share of one-office
institutions and an increase in the importance of multi-branch banks (see Table 1). For example, organizations
with 51 or more offices increased ownership from 39.3 percent of all offices holding about 47 percent of deposits
in 1994, to 52.5 percent of offices holding over 62 percent of deposits by June 2003. On average, the number of
physical offices per institution has increased from 6.3 to 9.5 over the last decade. A large part of this increase
was due to the process of collapsing multi-state and multi-bank organizations into more efficient structures in
response to relaxing of restrictions to branching.
8/14/2019 Future of Us Banking
http://slidepdf.com/reader/full/future-of-us-banking 5/19
3
Table 1 - Distribution of Insured Institutions by Number of Offices and Reported Deposits
Number of Offices inBHC or IndividualInstitution
Insured Institutions
(Percent by Charter)
Banking Offices
(Percent of Numberof Offices
Reported Deposits
(Percent of Depositsin each office)
Number of Offices 1994 2003 1994 2003 1994 2003
1 36.6 28.8 5.9 3.0 6.5 4.8
2-3 32.7 31.0 12.5 7.9 9.3 7.9
4-10 22.3 29.4 20.3 18.0 15.7 11.4
11-50 6.7 8.9 22.0 18.6 21.5 13.9
51 or more 1.7 1.9 39.3 52.5 47.0 62.0
Total 100.0 100.0 100.0 100.0 100.0 100.0
Average numbers of offices per institution 6.3 9.5
Note: Institutions and numbers of offices are allocated based upon the number of branches in theconsolidated organization.
Source: Summary of Deposit Annual Survey
Historically, state restrictions on branching have varied considerably. Many states had laws that limited
branching within the state, and some state laws were based upon unit banking, which generally limited banks to
a single office. In those states, operating a multi-office banking organization required separate charters for each
office leading to the formation of holding companies that owned numerous banks within a state or region.
Interstate branching, where possible, was restricted by reciprocal agreements between states and was generally
handled through a bank holding company structure using affiliated banking charters in various states.
Legislative easing of these various state branching restrictions began in earnest during the early 1980s
with gradual changes to intrastate and interstate branching laws on a state-by-state basis. This piecemeal
approach to relaxation of restrictions on branching continued until the 1994 passage of the Riegle-Neal Interstate
Banking and Branching Efficiency Act of 1994 (Riegle-Neal), which removed many remaining individual state
law restrictions on interstate branch banking. However, under Riegle-Neal, interstate mergers where the
resulting company will own more than 10 percent of the deposits of insured banking companies in the United
States are prohibited.
As might be expected, subsequent to the enactment of Riegle-Neal, interstate branching increased
rapidly as banks sought to simplify their structure by consolidating multi-state and multi-bank operations into
8/14/2019 Future of Us Banking
http://slidepdf.com/reader/full/future-of-us-banking 6/19
4
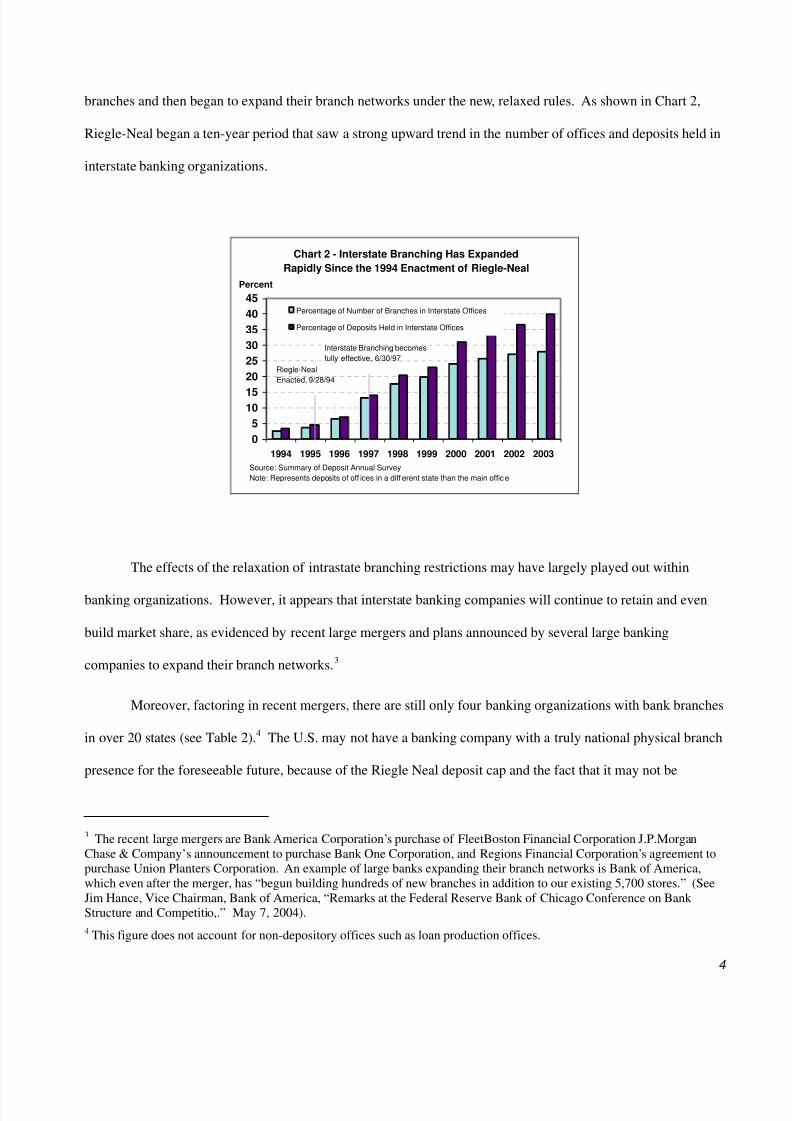
branches and then began to expand their branch networks under the new, relaxed rules. As shown in Chart 2,
Riegle-Neal began a ten-year period that saw a strong upward trend in the number of offices and deposits held in
interstate banking organizations.
Chart 2 - Interstate Branching Has Expanded
Rapidly Since the 1994 Enactment of Riegle-Neal
0
5
1015
20
25
30
35
40
45
1994 1995 1996 1997 1998 1999 2000 2001 2002 2003
Percent
Percentage of Number of Branches in Interstate Offices
Percentage of Deposits Held in Interstate Offices
Riegle-Neal
Enacted, 9/28/94
Interstate Branching becomes
fully effective, 6/30/97
Source: Summary of Deposit Annual Survey
Note: Represents deposits of off ices in a different state than the main office.
The effects of the relaxation of intrastate branching restrictions may have largely played out within
banking organizations. However, it appears that interstate banking companies will continue to retain and even
build market share, as evidenced by recent large mergers and plans announced by several large banking
companies to expand their branch networks.3
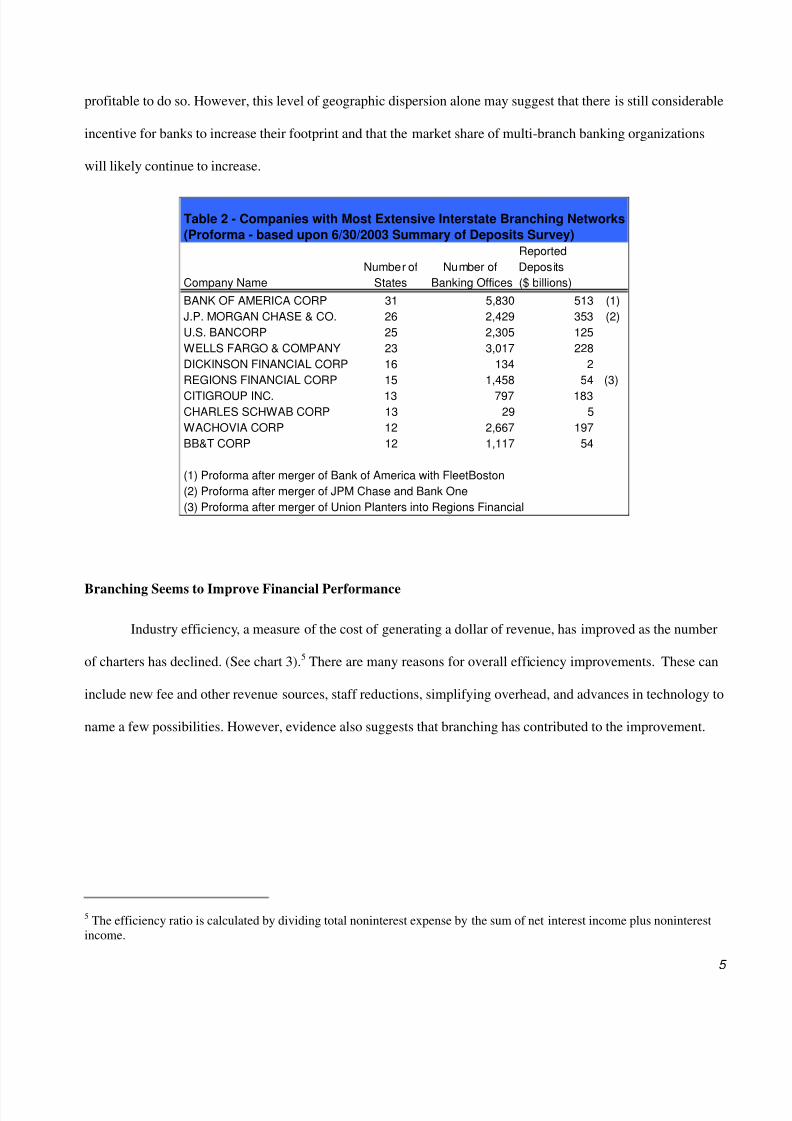
Moreover, factoring in recent mergers, there are still only four banking organizations with bank branches
in over 20 states (see Table 2).4 The U.S. may not have a banking company with a truly national physical branch
presence for the foreseeable future, because of the Riegle Neal deposit cap and the fact that it may not be
3 The recent large mergers are Bank America Corporation’s purchase of FleetBoston Financial Corporation J.P.MorganChase & Company’s announcement to purchase Bank One Corporation, and Regions Financial Corporation’s agreement topurchase Union Planters Corporation. An example of large banks expanding their branch networks is Bank of America,which even after the merger, has “begun building hundreds of new branches in addition to our existing 5,700 stores.” (SeeJim Hance, Vice Chairman, Bank of America, “Remarks at the Federal Reserve Bank of Chicago Conference on Bank Structure and Competitio,.” May 7, 2004).
4 This figure does not account for non-depository offices such as loan production offices.
8/14/2019 Future of Us Banking
http://slidepdf.com/reader/full/future-of-us-banking 7/19
5
profitable to do so. However, this level of geographic dispersion alone may suggest that there is still considerable
incentive for banks to increase their footprint and that the market share of multi-branch banking organizations
will likely continue to increase.
Table 2 - Companies with Most Extensive Interstate Branching Networks
(Proforma - based upon 6/30/2003 Summary of Deposits Survey)
Reported
Number of Number of Deposits
Company Name States Banking Offices ($ billions)
BANK OF AMERICA CORP 31 5,830 513 (1)
J.P. MORGAN CHASE & CO. 26 2,429 353 (2)
U.S. BANCORP 25 2,305 125
WELLS FARGO & COMPANY 23 3,017 228
DICKINSON FINANCIAL CORP 16 134 2
REGIONS FINANCIAL CORP 15 1,458 54 (3)
CITIGROUP INC. 13 797 183CHARLES SCHWAB CORP 13 29 5
WACHOVIA CORP 12 2,667 197
BB&T CORP 12 1,117 54
(1) Proforma after merger of Bank of America with FleetBoston
(2) Proforma after merger of JPM Chase and Bank One
(3) Proforma after merger of Union Planters into Regions Financial
Branching Seems to Improve Financial Performance
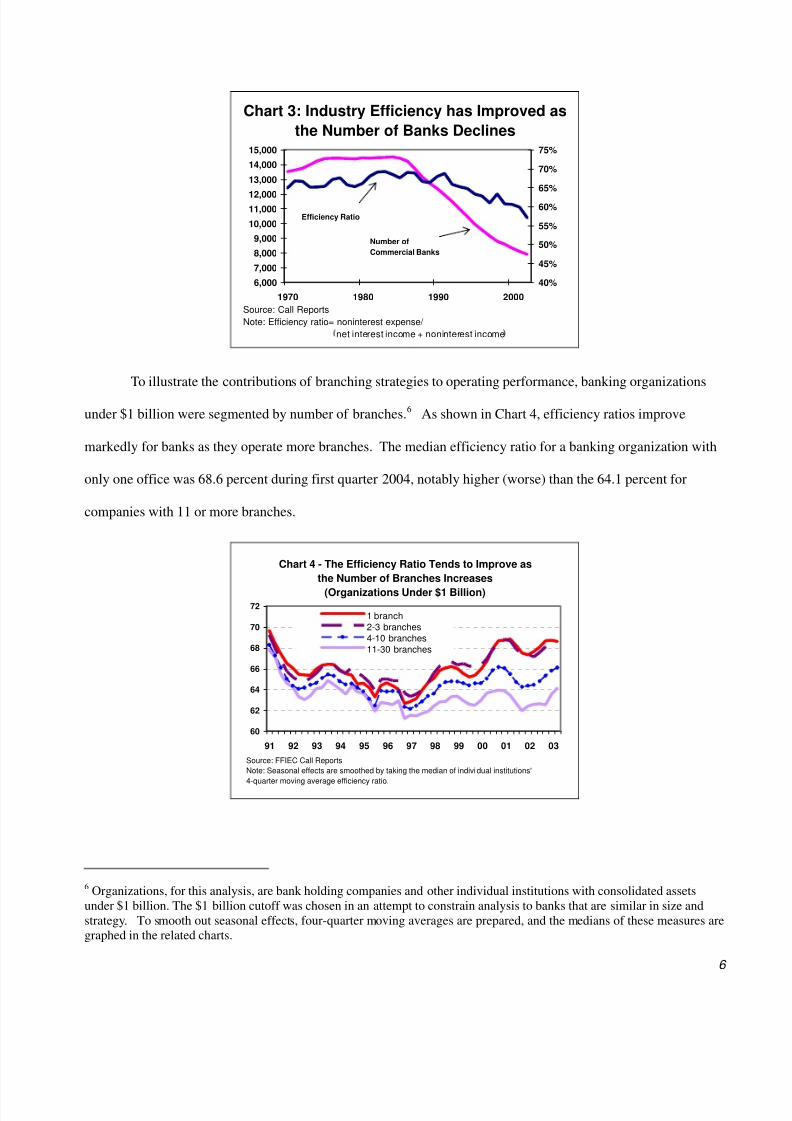
Industry efficiency, a measure of the cost of generating a dollar of revenue, has improved as the number
of charters has declined. (See chart 3).5 There are many reasons for overall efficiency improvements. These can
include new fee and other revenue sources, staff reductions, simplifying overhead, and advances in technology to
name a few possibilities. However, evidence also suggests that branching has contributed to the improvement.
5 The efficiency ratio is calculated by dividing total noninterest expense by the sum of net interest income plus noninterestincome.
8/14/2019 Future of Us Banking
http://slidepdf.com/reader/full/future-of-us-banking 8/19
6
6,000
7,000
8,000
9,000
10,000
11,00012,000
13,000
14,000
15,000
1970 1980 1990 2000
40%
45%
50%
55%
60%
65%
70%
75%
Number of
Commercial Banks
Efficiency Ratio
Source: Call Reports
Note: Efficiency ratio= noninterest expense/
net interest income + noninterest income
Chart 3: Industry Efficiency has Improved as
the Number of Banks Declines
To illustrate the contributions of branching strategies to operating performance, banking organizations
under $1 billion were segmented by number of branches.6 As shown in Chart 4, efficiency ratios improve
markedly for banks as they operate more branches. The median efficiency ratio for a banking organization with
only one office was 68.6 percent during first quarter 2004, notably higher (worse) than the 64.1 percent for
companies with 11 or more branches.
Chart 4 - The Efficiency Ratio Tends to Improve as
the Number of Branches Increases
(Organizations Under $1 Billion)
60
62
64
66
68
70
72
91 92 93 94 95 96 97 98 99 00 01 02 03
1 branch
2-3 branches
4-10 branches
11-30 branches
Source: FFIEC Call Reports
Note: Seasonal effects are smoothed by taking the median of indivi dual institutions'
4-quarter moving average efficiency ratio.
6 Organizations, for this analysis, are bank holding companies and other individual institutions with consolidated assetsunder $1 billion. The $1 billion cutoff was chosen in an attempt to constrain analysis to banks that are similar in size andstrategy. To smooth out seasonal effects, four-quarter moving averages are prepared, and the medians of these measures aregraphed in the related charts.
8/14/2019 Future of Us Banking
http://slidepdf.com/reader/full/future-of-us-banking 9/19
7
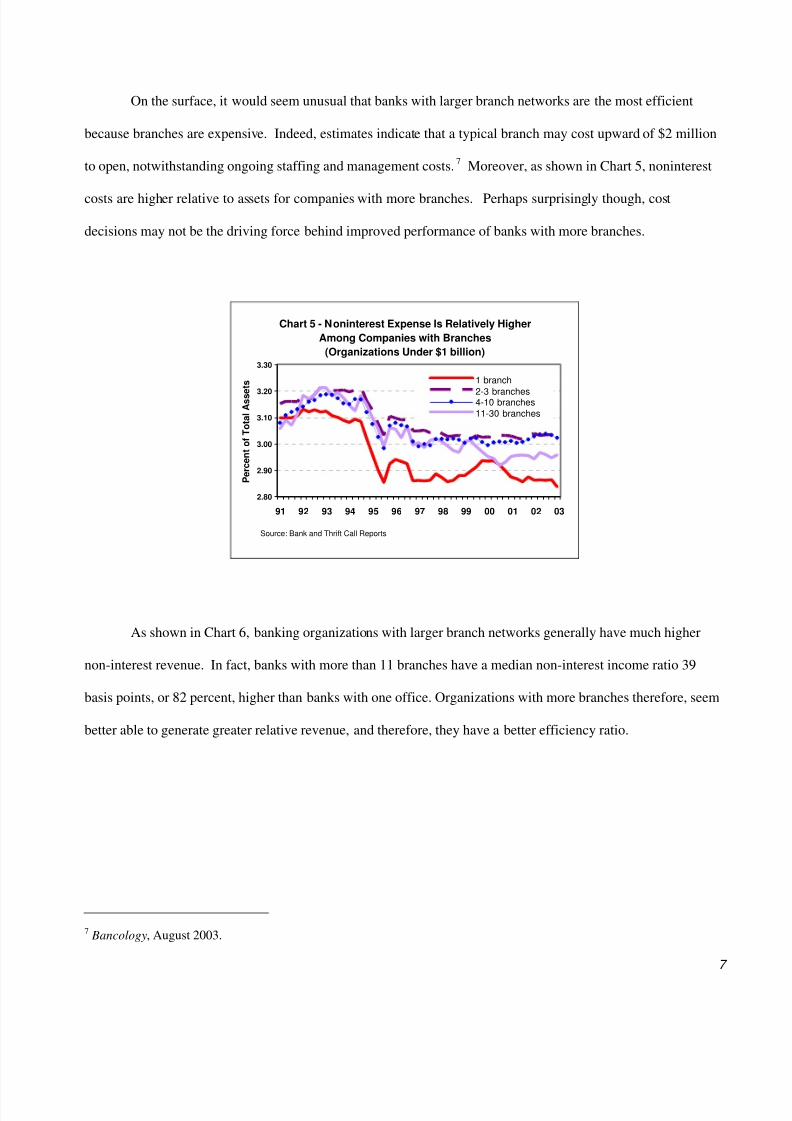
On the surface, it would seem unusual that banks with larger branch networks are the most efficient
because branches are expensive. Indeed, estimates indicate that a typical branch may cost upward of $2 million
to open, notwithstanding ongoing staffing and management costs.7 Moreover, as shown in Chart 5, noninterest
costs are higher relative to assets for companies with more branches. Perhaps surprisingly though, cost
decisions may not be the driving force behind improved performance of banks with more branches.
Chart 5 - Noninterest Expense Is Relatively Higher
Among Companies with Branches
(Organizations Under $1 billion)
2.80
2.90
3.00
3.10
3.20
3.30
91 92 93 94 95 96 97 98 99 00 01 02 03
P e r c e n t o f T o t a l A s s e
t s1 branch
2-3 branches4-10 branches
11-30 branches
Source: Bank and Thrift Call Reports
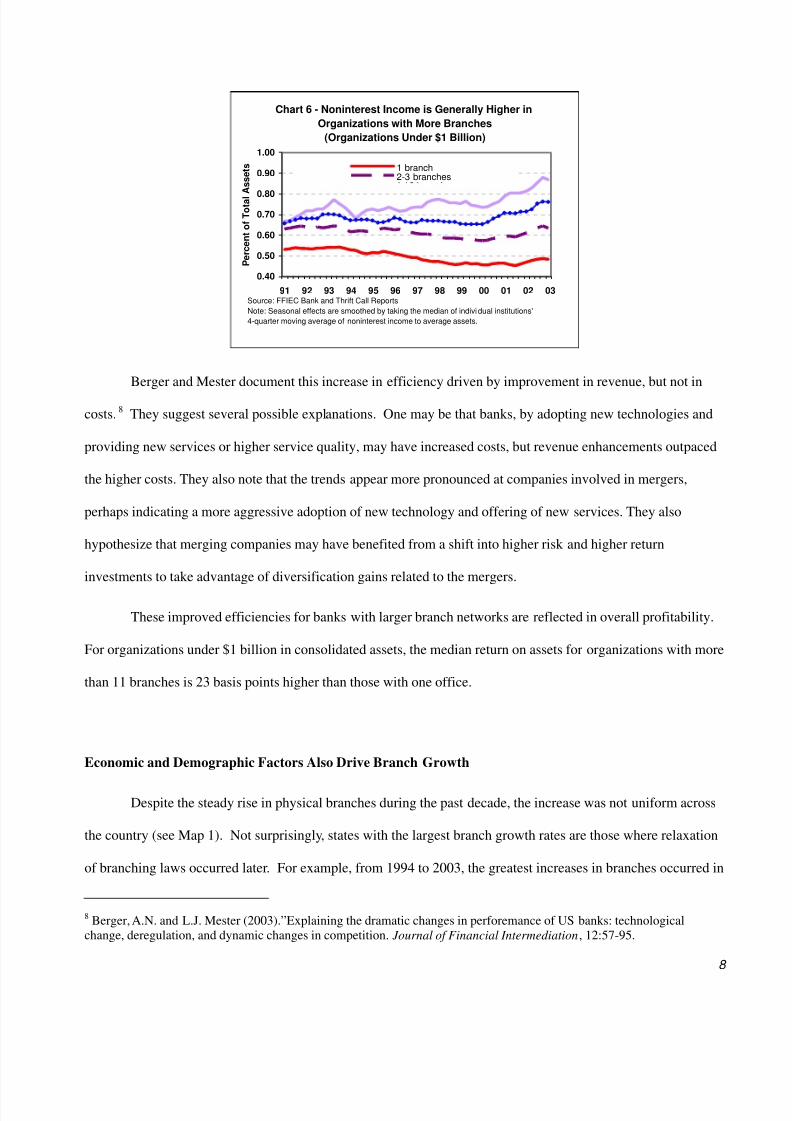
As shown in Chart 6, banking organizations with larger branch networks generally have much higher
non-interest revenue. In fact, banks with more than 11 branches have a median non-interest income ratio 39
basis points, or 82 percent, higher than banks with one office. Organizations with more branches therefore, seem
better able to generate greater relative revenue, and therefore, they have a better efficiency ratio.
7 Bancology, August 2003.
8/14/2019 Future of Us Banking
http://slidepdf.com/reader/full/future-of-us-banking 10/19
8
Chart 6 - Noninterest Income is Generally Higher in
Organizations with More Branches
(Organizations Under $1 Billion)
0.40
0.50
0.60
0.70
0.80
0.90
1.00
91 92 93 94 95 96 97 98 99 00 01 02 03
P e r c e n t o f T o t a l
A s s e t s 1 branch
2-3 branches
Source: FFIEC Bank and Thrift Call Reports
Note: Seasonal effects are smoothed by taking the median of indivi dual institutions'
4-quarter moving average of noninterest income to average assets.
Berger and Mester document this increase in efficiency driven by improvement in revenue, but not in
costs. 8 They suggest several possible explanations. One may be that banks, by adopting new technologies and
providing new services or higher service quality, may have increased costs, but revenue enhancements outpaced
the higher costs. They also note that the trends appear more pronounced at companies involved in mergers,
perhaps indicating a more aggressive adoption of new technology and offering of new services. They also
hypothesize that merging companies may have benefited from a shift into higher risk and higher return
investments to take advantage of diversification gains related to the mergers.
These improved efficiencies for banks with larger branch networks are reflected in overall profitability.
For organizations under $1 billion in consolidated assets, the median return on assets for organizations with more
than 11 branches is 23 basis points higher than those with one office.
Economic and Demographic Factors Also Drive Branch Growth
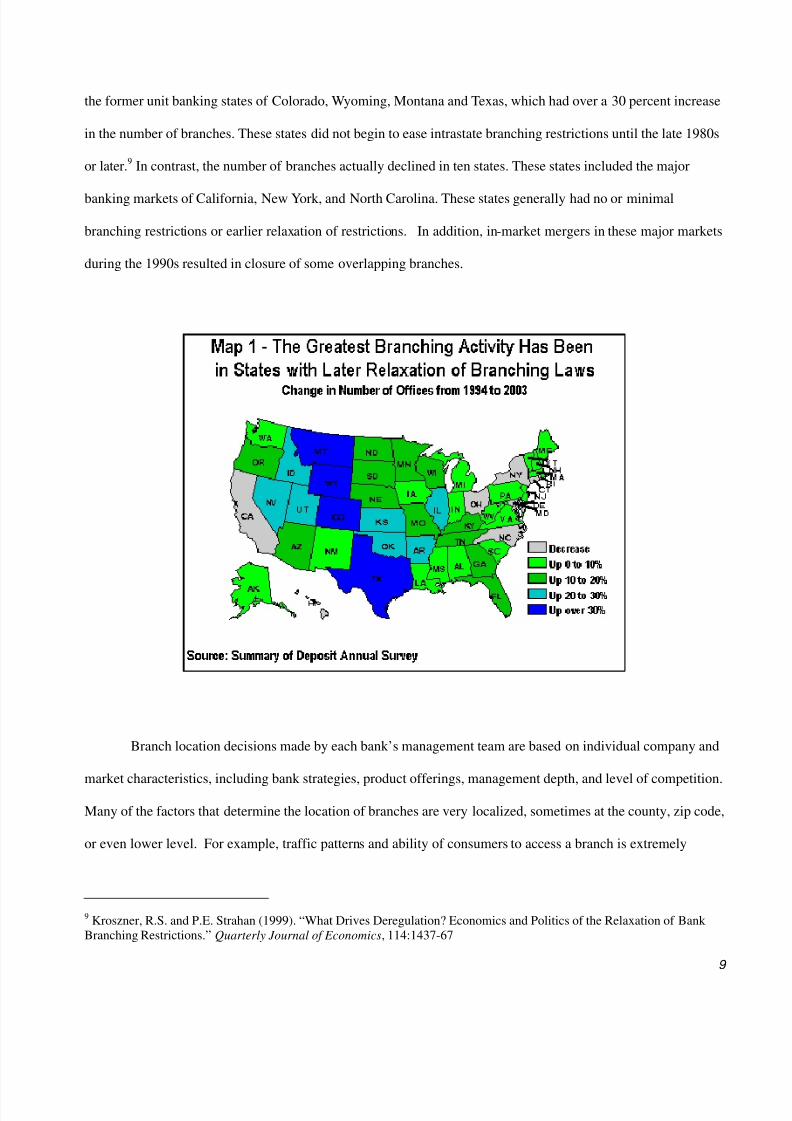
Despite the steady rise in physical branches during the past decade, the increase was not uniform across
the country (see Map 1). Not surprisingly, states with the largest branch growth rates are those where relaxation
of branching laws occurred later. For example, from 1994 to 2003, the greatest increases in branches occurred in
8 Berger, A.N. and L.J. Mester (2003).”Explaining the dramatic changes in perforemance of US banks: technologicalchange, deregulation, and dynamic changes in competition. Journal of Financial Intermediation, 12:57-95.
8/14/2019 Future of Us Banking
http://slidepdf.com/reader/full/future-of-us-banking 11/19
9
the former unit banking states of Colorado, Wyoming, Montana and Texas, which had over a 30 percent increase
in the number of branches. These states did not begin to ease intrastate branching restrictions until the late 1980s
or later.9 In contrast, the number of branches actually declined in ten states. These states included the major
banking markets of California, New York, and North Carolina. These states generally had no or minimal
branching restrictions or earlier relaxation of restrictions. In addition, in-market mergers in these major markets
during the 1990s resulted in closure of some overlapping branches.
Branch location decisions made by each bank’s management team are based on individual company and
market characteristics, including bank strategies, product offerings, management depth, and level of competition.
Many of the factors that determine the location of branches are very localized, sometimes at the county, zip code,
or even lower level. For example, traffic patterns and ability of consumers to access a branch is extremely
9 Kroszner, R.S. and P.E. Strahan (1999). “What Drives Deregulation? Economics and Politics of the Relaxation of Bank Branching Restrictions.” Quarterly Journal of Economics, 114:1437-67
8/14/2019 Future of Us Banking
http://slidepdf.com/reader/full/future-of-us-banking 12/19
10
important. Indeed, an analysis conducted by MarkeTech Systems International estimated that location
characteristics may explain 45 to 55 percent of deposit formation.10 While the current paper does not ascribe a
percentage of importance for factors driving branching decisions, it is clear from an examination of the most
active branching markets that economic vibrancy of a community and demographic patterns are very important.
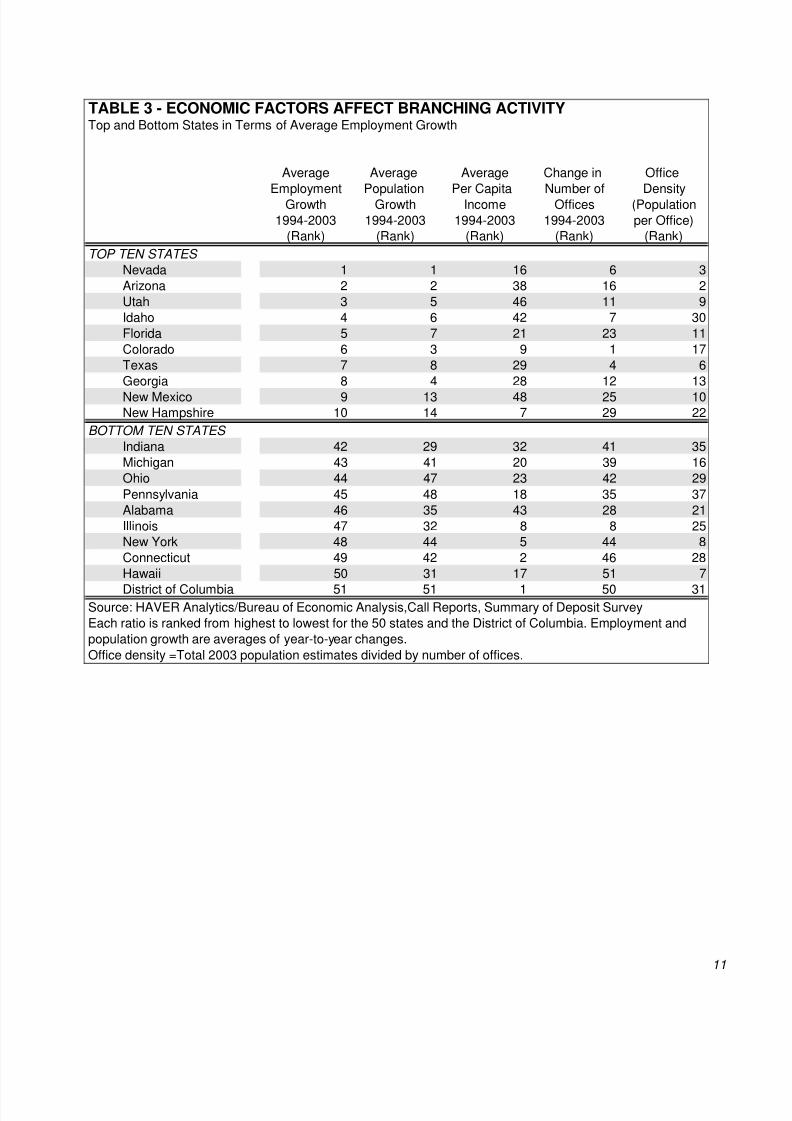
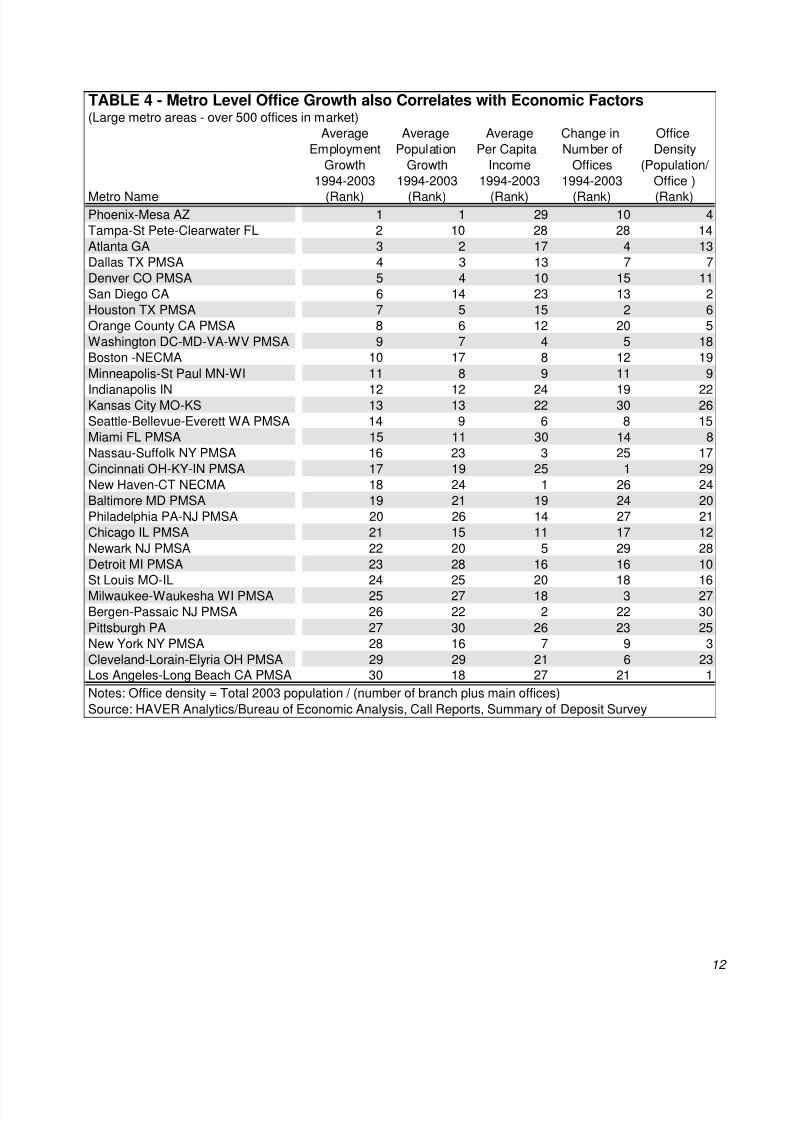
Table 3 shows the top and bottom states in terms of average employment growth for the years 1994 -
2003. Also included are rankings for population growth, per capita income levels, change in number of bank
offices, and population per office. Table 4 ranks large metropolitan markets using the same factors. As might be
expected, population growth appears to be strongly correlated with employment growth. Further, in general,
branching growth also tends to follow these two economic drivers. Interestingly, per capita income and the
density of offices (population per office) show a less clear relationship, though the strongest branch growth states
(and to some degree, the large metropolitan markets with strong growth) generally seem to have greater
population per office.
10 Hopson, Hal, and Stephen Rymers, “Predicting Branch Performance,” Banking Strategies, November/December 2003.
8/14/2019 Future of Us Banking
http://slidepdf.com/reader/full/future-of-us-banking 13/19
11
TABLE 3 - ECONOMIC FACTORS AFFECT BRANCHING ACTIVITYTop and Bottom States in Terms of Average Employment Growth
Average Average Average Change in OfficeEmployment Population Per Capita Number of Density
Growth Growth Income Offices (Population1994-2003 1994-2003 1994-2003 1994-2003 per Office)
(Rank) (Rank) (Rank) (Rank) (Rank)
TOP TEN STATES
Nevada 1 1 16 6 3Arizona 2 2 38 16 2Utah 3 5 46 11 9Idaho 4 6 42 7 30Florida 5 7 21 23 11Colorado 6 3 9 1 17Texas 7 8 29 4 6Georgia 8 4 28 12 13
New Mexico 9 13 48 25 10New Hampshire 10 14 7 29 22
BOTTOM TEN STATES
Indiana 42 29 32 41 35Michigan 43 41 20 39 16Ohio 44 47 23 42 29
Pennsylvania 45 48 18 35 37Alabama 46 35 43 28 21Illinois 47 32 8 8 25New York 48 44 5 44 8Connecticut 49 42 2 46 28Hawaii 50 31 17 51 7
District of Columbia 51 51 1 50 31Source: HAVER Analytics/Bureau of Economic Analysis,Call Reports, Summary of Deposit SurveyEach ratio is ranked from highest to lowest for the 50 states and the District of Columbia. Employment andpopulation growth are averages of year-to-year changes.
Office density =Total 2003 population estimates divided by number of offices.
8/14/2019 Future of Us Banking
http://slidepdf.com/reader/full/future-of-us-banking 14/19
12
(Large metro areas - over 500 offices in market)Average Average Average Change in Office
Employment Population Per Capita Number of DensityGrowth Growth Income Offices (Population/
1994-2003 1994-2003 1994-2003 1994-2003 Office )
Metro Name (Rank) (Rank) (Rank) (Rank) (Rank)Phoenix-Mesa AZ 1 1 29 10 4Tampa-St Pete-Clearwater FL 2 10 28 28 14Atlanta GA 3 2 17 4 13Dallas TX PMSA 4 3 13 7 7Denver CO PMSA 5 4 10 15 11San Diego CA 6 14 23 13 2Houston TX PMSA 7 5 15 2 6Orange County CA PMSA 8 6 12 20 5Washington DC-MD-VA-WV PMSA 9 7 4 5 18Boston -NECMA 10 17 8 12 19
Minneapolis-St Paul MN-WI 11 8 9 11 9
Indianapolis IN 12 12 24 19 22Kansas City MO-KS 13 13 22 30 26Seattle-Bellevue-Everett WA PMSA 14 9 6 8 15Miami FL PMSA 15 11 30 14 8Nassau-Suffolk NY PMSA 16 23 3 25 17Cincinnati OH-KY-IN PMSA 17 19 25 1 29New Haven-CT NECMA 18 24 1 26 24Baltimore MD PMSA 19 21 19 24 20Philadelphia PA-NJ PMSA 20 26 14 27 21Chicago IL PMSA 21 15 11 17 12
Newark NJ PMSA 22 20 5 29 28Detroit MI PMSA 23 28 16 16 10St Louis MO-IL 24 25 20 18 16Milwaukee-Waukesha WI PMSA 25 27 18 3 27Bergen-Passaic NJ PMSA 26 22 2 22 30
Pittsburgh PA 27 30 26 23 25New York NY PMSA 28 16 7 9 3Cleveland-Lorain-Elyria OH PMSA 29 29 21 6 23Los Angeles-Long Beach CA PMSA 30 18 27 21 1
Notes: Office density = Total 2003 population / (number of branch plus main offices)
Source: HAVER Analytics/Bureau of Economic Analysis, Call Reports, Summary of Deposit Survey
TABLE 4 - Metro Level Office Growth also Correlates with Economic Factors
8/14/2019 Future of Us Banking
http://slidepdf.com/reader/full/future-of-us-banking 15/19
13
Going Forward – Will the Pace of Branch Growth Continue?
Concerns have been voiced for some time about the high cost of branching and the potential over-
branching of certain markets, especially with the availability of alternative banking technology. For example, a
book published in 1996 predicted significant branch closings due to an increase in ATM, telephone, computer
and direct deposit services, indicating that “The expense of maintaining bank branches has increased while the
importance of branches to customers has declined.”11 Moreover, several recent articles have mentioned some
“hot” markets (for example, Chicago, New York City, and Texas), where banks are aggressively pursuing
branching strategies, in some cases suggesting these markets have become “overbranched.”12
However, despite technological advances that have made it easier to conduct financial services activities
without physically entering a bank branch, it seems that banking consumers like the convenience of bank
branches. Surveys conducted by the Federal Reserve Board indicate that the single most important factor
influencing a customer’s choice of banks is the location of the institution’s branches.13 While it would be
difficult to predict what consumer preferences for physical branches will be going forward, the general trends
suggest that branching will continue, at least in some markets.
As mentioned above, well-executed branching strategies, while costly, may improve overall operating
results. Given the very micro nature of branching decisions, it is not practical in this paper to review the
thousands of local markets to determine which may be conducive to branching activity. However, in a very
broad sense, given our state and large metropolitan area analysis, it seems reasonable that branching activity will
center around markets with strong population and employment growth.
11 Spiegel, John, Gart, Alan, and Gart, Steven, Banking Redefined: How SuperRegional Powerhouses are ReshapingFinancial Services. Page 462, 1996.
12 For example: Hallinan, Joseph, “As Banks Elbow for Consumers, Washington Mutual Thrives,” Wall Street Journal.November 6, 2003 and Thompson, Laura K., “Overbranched? No Stopping Texas Stampede,” The American Banker .March 11, 2004.
13 Olson, Governor Mark W., “Remarks at the Fortieth Annual Conference on Bank Structure and Competition, Sponsoredby the Federal Reserve Bank of Chicago, Chicago, Illinois.” May 6, 2004.

8/14/2019 Future of Us Banking
http://slidepdf.com/reader/full/future-of-us-banking 16/19
14
Going forward, other trends in the retail banking business will also have implications for the future pace of
branching, such as deposit growth and the overall attractiveness of the consumer sector. Nationwide, deposit
growth varied during the ten years ending June 30, 2003 (averaging 5.5 percent), with the strongest gains coming
after 2000. This trend was attributable, in part, to the decline in the equity markets. While the stock market is
currently volatile, the general trend and expectation is that when the stock market stabilizes and increases,
deposit growth tends to decline. Moreover, while the consumer sector has remained strong, particularly the
mortgage market and related business, it is uncertain whether retail banking will retain the same level of its
current attractiveness when interest rates rise or if other sectors replace the consumer as the driver of much of the
growth in the banking sector.
8/14/2019 Future of Us Banking
http://slidepdf.com/reader/full/future-of-us-banking 17/19
15
The FDIC’s Summary of Deposit Survey
Much of the data used in this report has been taken from the FDIC’s Summary of Deposits
(SOD) survey. Under this survey, as of June 30 each year, insured banks report to the FDIC
additions/changes to office structure. Savings associations report similar information to the
Office of Thrift Supervision. Each insured institution is required to update information on the
location and type of each of its banking offices, including deposit information. For the purposes
of the survey, to constitute a banking office, the customer must be able to open accounts, make
deposits and borrow money. This definition of office therefore excludes numerous other
business locations such as loan production offices, consumer credit offices and automated teller
machines where an insured institution provides more limited operations. However, even within
these limitations, the survey collects information on over 87,000 offices.
The SOD survey collects only limited financial information on individual offices, focusing on
deposits. For instance it does not collect other information such as loan volume or branch
income. Institutions have flexibility on how to allocate deposits to each office, but generally
deposits are assigned by the institution in a manner consistent to their internal reporting
practices. The institution may report deposits in any manner that logically reflects the deposit-
gathering activity. This can include: office of origination, the office where the deposit is most
active, the office assignment used to compensate branch managers or others, or the office closest
to the account holder’s address.
The SOD survey is widely used by banks, consumers and regulators for a variety of purposes.
Certainly it is a source of important information for consumers seeking to know whether their
bank office belongs to an FDIC- insured institution. Also, it provides important information for
anyone interested in deposit market share. For example, the banking agencies and the
Department of Justice use summary of deposit information as a source of information for
measuring market concentrations implications of mergers or other consolidations. The SOD
survey can be found at http://www2.fdic.gov/sod/ .
The 2004 Summary of Deposit Survey is now underway, with 2004 Results and related FDIC
analysis planned for release in October 2004.
8/14/2019 Future of Us Banking
http://slidepdf.com/reader/full/future-of-us-banking 18/19
References
Avery, Robert B. et al. 1997. Changes in the Distribution of Banking Offices. Federal
Reserve Bulletin, September 1997: 707-725.
Bancography. 2003. New Branch Survey Finds Costs Approaching $2 Million. Bancology 8, August 2003.
Berger, A.N., and Mester, L.J. 2003. Explaining the dramatic changes in performance of US banks: technological change, deregulation, and dynamic changes incompetition. Journal of Financial Intermediation 12 (2003): 57-95.
Critchfield, T. et al. 2004. Community Banks: Their Recent Past, Current Performance,and Future Prospects. Future of Banking Study FOB-2004-03.1. Federal DepositInsurance Corporation.
Dick, Astrid A., 2003. Market Structure and Quality: An Application to the BankingIndustry. Finance and Economics Discussion Series 2003-14. Federal ReserveBoard.
Dick, Astrid A., 2003. Nationwide Branching and its Impact on Market Structure, Qualityand Bank Performance. Finance and Economics Discussion Series 2003-35. FederalReserve Board.
Epley, Donald R. 2003. Measurement of Local Economic Growth as a Critical Part of Market Analysis. Real Estate Issues 28, no. 2.
First Manhattan Consulting Group. 2003. De Novo branching: Pathway to ProfitableGrowth? Value-Based Management white papers.
Hallinan, Joesph. (2003). As Banks Elbow for Consumers, Washington Mutual Thrives.Wall Street Journal, November 6, 2003.
Hopson, H, and Rymers, S. 2003. Predicting Branch Performance. BAI Banking
Strategies LXXIX, no. V (sidebar to Stoneman article).
Jones, K.D., and Critchfield, T. 2004. The Declining Number of U.S. BankingOrganizations: Will the Trend Continue? Future of Banking Study FOB-2004-02.1.Federal Deposit Insurance Corporation.
Kroszner, R.S., and Strahan, P.L. 1999. What Drives Deregulation? Economics andPolitics of the Relaxation of Bank Branching Restrictions. Quarterly Journal of
Economics 114:1437-67.
8/14/2019 Future of Us Banking
http://slidepdf.com/reader/full/future-of-us-banking 19/19
Olson, Governor Mark W. 2004. “Remarks at the Fortieth Annual Conference on Bank Structure and Competition, Sponsored by the Federal Reserve Bank of Chicago,Chicago, Illinois.” May 6, 2004
Radecki, Lawrence J. 1998.The Expanding Geographic Reach of Retail Banking
Markets. Federal Reserve Bank of New York Economic Policy Review 4, no 2.
Rhoades, Stephen A. 2000. Bank Mergers and Banking Structure in the United States,1980-1998. Staff Study 174. Federal Reserve Board.
Spiegel, J, Gart, A, and Gart, S. 1996. Banking Redefined: How SuperRegionalPowerhouses are Reshaping Financial Services. Page 462, 1996.
Stoneman, Bill. 2003. Site Selectivity. BAI Banking Strategies. LXXIX, no. V.
Thompson, Laura K. 2004. Overbranched? No Stopping Texas Stampede. American
Banker. March 11, 2004.