fy 2005 results and comments - banpu · pdf filejiteng paper mill, mengniu milk, ln heat...
TRANSCRIPT

1
FY 2005 results and commentsINVESTOR & ANALYST UPDATE
24th February 2006

2
DISCLAIMER
The views expressed here contain information derived from publicly available sources that have not been independently verified. No representation or warranty is made as to the accuracy, completeness or reliability of the information. Any forward looking information in this presentation has been prepared on the basis of a number of assumptions which may prove to be incorrect. This presentation should not be relied upon as a recommendation or forecast by Banpu plc. Nothing in this release should be construed as either an offer to sell or a solicitation of an offer to buy or sell shares in any jurisdiction.

3
1. Introduction
2. Focus: China CHP acquisition
3. Operational review
4. Commercial review
5. Financial review
4
1. Introduction
Chanin VongkusolkitChief Executive Officer

5
Record net income at Bt 5,565 m (up 53%)
Trubaindo mine came on-stream, 5mt expected in 2006
Second investment in Chinese coal sector: 40% of Hebi(1 mtpa being expanded to 1.8 mtpa)
Non-core divestments: YBB (calcium carbonate), APBH (oil-fired power), RSA (insurance), ATC stake to 3.7%
Some frustrating delays and slippage in some key operational targets
Highlights of 2005

6
Acquisition of niche co-generation business in China
Other promising acquisition projects under evaluation
Trubaindo first full year of production
BLCP first unit completion
Banpu team is stronger and more focused than ever before
Brief look at the year ahead
OpportunitiesChallenges
Indonesian coal export tax ($1.5/t on FOB prices of $30/t or more) ? [Unfortunate, but now seems likely]
Impact of softer coal prices and short term earnings outlook

7
Banpu regional snapshot: 2006
Indominco-Bontang
Jorong Kitadin-Embalut
LP-2 CMMC
Daning
Trubaindo
Coal mining operation
Coal mining project
Barasentosa
Bharinto
Power plant operation
Power plant project
RatchBLCP
Hebi
CHINA
THAILAND
INDONESIA
Bengbu*
Luannan*
Zouping*Zhengding*
* Share Purchase Agreement signed on February 9, 2006
Newly acquired operation

8
A new cash flow structure is evolving …
Recent cashflowstructure
Cashflow structure by 2008 (existing assets*)
Coal represents c.90% of pre-capex cash flows, over 70% from Indonesia
Coal Indonesia
Coal Thailand
Power, other
CONCEPTUAL & ILLUSTRATIVE ONLY
Coal Indonesia
Coal China
China Power
Thai Power
Coal represents about 2/3 of cashflows going forward with China gradually replacing Thailand
Power represents about 1/3 of pre-capex cashflows
* Nb. New acquisitions and investments could alter this expectation

9
The Banpu jigsaw puzzle is gradually taking shape !
Thailand
Indonesia
China
Other ?
Coal Power
Banpu’s long term strategy envisages a matrix of diversified coal-based energy businesses spanning several Asian countries.
But Banpu is working towards its strategic goals opportunistically, seizing value-creating opportunities as they arise.
Non-core divestments

10
2. Focus: China CHP acquisition
Chanin VongkusolkitChief Executive Officer

11
Deal summary
Banpu has acquired a coal-fired co-generation business in China from AEC (a US utility group) for US$84.3 million in cash
Business consists of four plants with total power capacity of 279MW and steam capacity of 1,000 tph
Plants benefit from favorable regulation, captive steam markets and priority dispatch for electricity
Deal should provide platform for further growth for Banpu in the Chinese coal-based energy sector

12
Production capacities of plants acquired
Plant name
Zhengding
Luannan
Zouping
Bengbu
Shareholding
100%
100%
70%
64%
Power capacity Steam capacity
49 MW
100 MW
50 MW
80 MW 440 tph
160 tph
240 tph
160 tph
CHP: ‘Combined Heat & Power’ (co-generation)

13
Electricity power consumptions (billion kWh)
Xinjiang
Gansu
Heilongjiang
Jilin
Liaoning
Taiwan
Tibet
Sichuan
Yunnan
GuangxiGuangdong
Fujian
Shandong
Hubei
Hunan Jiangxi
Hainan
Inner Mongolia
Ningxia
Qinghai
Hebei
Shanxi
Henan Anhui
Zhejiang
JiangsuShaanxi
Guizhou
Beijing
Luannan: Jing Jin Tang Grid
Zhengding: Hebei South Grid
Zouping: Shandong Grid
Bengbu: Anhui Grid
Northwest Grid
Tibet Grid
South Grid
Middle Grid EastGrid
North Grid
Northeast Grid
2004 2005
75.2 85.2
138.9 160.5
163.9 191.1
51.5 58.2
%
13%
16%
17%
13%

14
Off-take arrangements
Plant name
Zhengding
Luannan
Zouping
Bengbu
Power
Off-takers
Steam
Off-takers
Off-take
(GWh)
Off-take
(Mt)
255 0.76Hebei Power
PPA to 2022
N. China Power
PPA to 2015
ZP Power
PPA to 2021
Anhui Power
PPA to 2021
Industrial,
residential,
ZD Heat
Jiteng Paper Mill,
Mengniu Milk, LN Heat
Bengbu H&P
SPA to 2020
Xiwang (sugar),
Sanxing (oil)
SPAs to 2021-2
169 0.6620042005
20042005
518617
0.540.53
407372
1.270.83
515464
1.121.28
2003131
537
352
439
2003 0.67
0.35
0.59
1.49
231 2006f
481
378
343
2006f 0.67
0.54
1.20
1.00
15
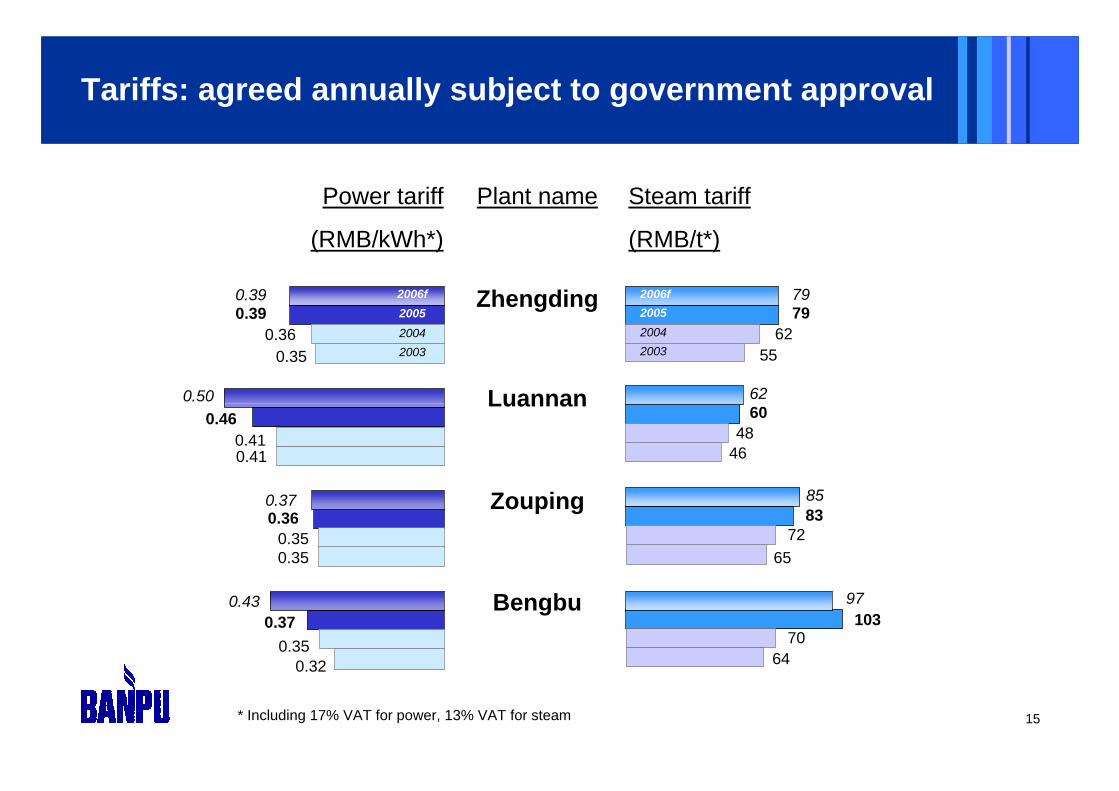
Tariffs: agreed annually subject to government approval
Plant name
Zhengding
Luannan
Zouping
Bengbu
Power tariff
(RMB/kWh*)
Steam tariff
(RMB/t*)
0.39
0.46
0.36
0.37
79
60
83
103
* Including 17% VAT for power, 13% VAT for steam
0.36
0.41
0.35
0.35
62
48
72
70
20042005
20042005
20030.35
0.41
0.35
0.32
2003 55
46
65
64
0.39 2006f
0.50
0.37
0.43
792006f
62
85
97

16
Coal sourcing and prices
ZhengdingShanxi Province
RMB 363 /t
Sources Prices 2005* CHP plant
LuannanHebei Province
RMB 441 /t
ZoupingShanxi Province
RMB 451 /t
BengbuAnhui Province
RMB 561 /t
70% of coal price changes** passed through to power and steam tariffs
** Subject to price movement of more than 5% in any 6m period; new regulations since May 2005* Average: mix of contract and spot price agreements; prices are for delivered coal, including transport costs to plants
Coal Consumption
2005* (Mt)
0.25
0.29
0.31
0.33

17
-
100
200
300
400
500
600
700
800
900
-
0.05
0.10
0.15
0.20
0.25
0.30
0.35
0.40
0.45
0.50
0.55
0.60
Comparison of average coal prices and power tariffs
2003 2004 2005 2006
Avg. coal price (RMB/t)
Avg. power tariff (RMB/kWh)
ZD: Zhengding
LN: Luannan
ZP: Zouping
BB: Bengbu
ZD LN ZP BB ZD LN ZP BB ZD LN ZP BB ZD LN ZP BB
Power tariffs (RHS)
Coal prices (LHS)
18
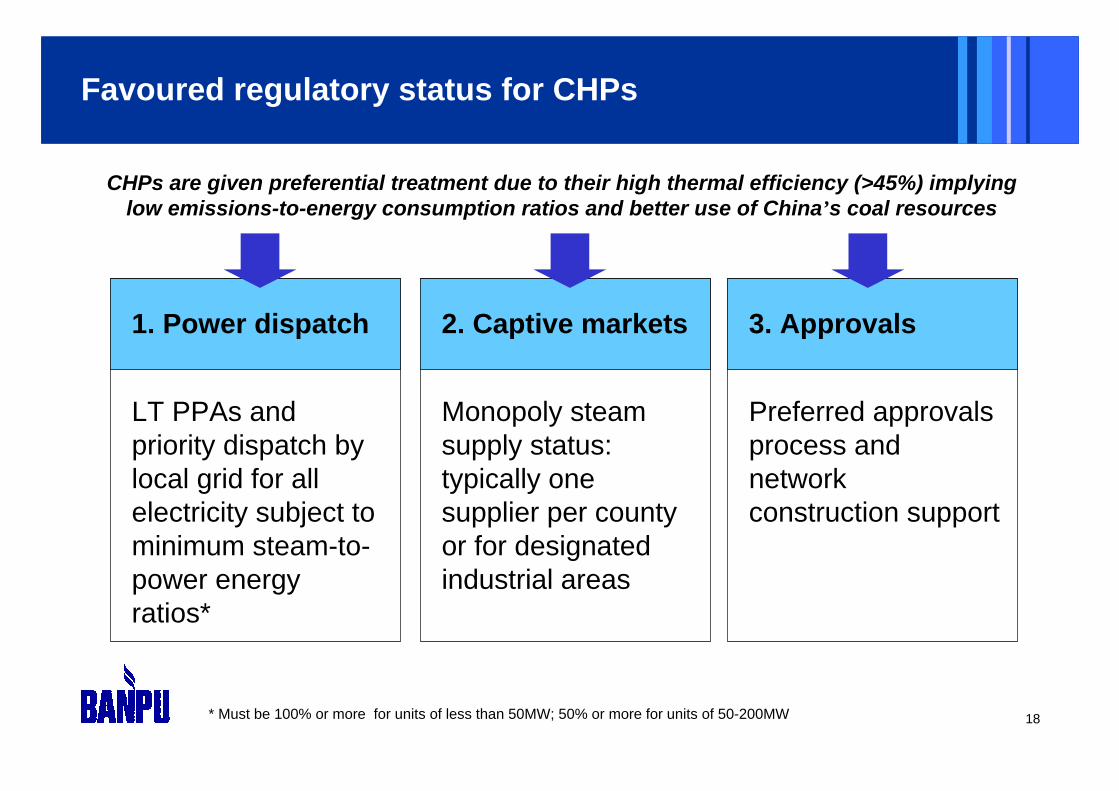
Favoured regulatory status for CHPs
1. Power dispatch
LT PPAs and priority dispatch by local grid for all electricity subject to minimum steam-to-power energy ratios*
CHPs are given preferential treatment due to their high thermal efficiency (>45%) implying low emissions-to-energy consumption ratios and better use of China’s coal resources
2. Captive markets
Monopoly steam supply status: typically one supplier per county or for designated industrial areas
3. Approvals
Preferred approvals process and network construction support
* Must be 100% or more for units of less than 50MW; 50% or more for units of 50-200MW

19
China CHP business: EBITDA summary (2005)
Zhengding100%
Luannan100%
Zouping70%
Bengbu64%
TotalOH
$5M
$10M
$15M
$20M
$25M
$3.7M
$10.2M
$7.0M
$2.9M
- $3.1M
$20.7M*
EBITDA
2005 ($M)
* Un-audited equity EBITDA figures

20
Integration of new management teams into Banpu (nb. existing management are highly qualified with extensive experience working to western professional standards)
Brownfield expansion of the existing plants (backed by high growth in new steam demand)
Improvement of plant operating efficiency
Refinancing opportunity
Work with local management to identify and secure further CHP acquisitions
Going forward …
Value
Creation
Plan

21
3. Operational review
Rawi CorsiriChief Operating Officer

22
Estimated 2006 production at 21m tonnes (exclud. China)
Indominco-Bontang8.2 mt
Jorong3.1 mt
Kitadin-Embalut1.6 mt
Thailand3.1 mt
Daning4 mt
(Banpu 12.5%)
Trubaindo5 mt
100% basis
Hebi1 mt(Banpu 40%)

23
Coal reserves increased to 260 million tonnes
218
2004Reserves
2005Reserves
2005production
Equity tonnes
Units: million tonnesBharinto:
+27
IMM E.Block: +17
Hebi: +14
260
(16)
Engineering studies
Acquisition

24
Coal production review and outlook
Indominco-BontangCV 6,500 kcal/kg
Lower output due to maintenance work at
Bontang port in 4Q051.9 1.8 1.8
1Q05 3Q05
SR 9.2:1 10.6:1
1Q 2Q 3Q
SR 9.5 7.2
.8
3Q
.8
1Q
SR 4.4
.8
2Q
3.7
Kitadin-EmbalutCV 6,000 kcal/kg
JorongCV 5,300 kcal/kg
LP-2 / CMMCCV 4,000 kcal/kg
2.2
4Q05
.3
4Q05
TrubaindoCV 6,950 kcal/kg
Slow production during the first year of operation
12.1:1
7.1
4.4
.9
4Q05Smooth production supported by strong
domestic sales
1Q
.1 .6
3Q
Strong output recovery during 2H05
Annual production was slightly better than plan
2Q
2Q05
.5 .4
1Q 2Q 3Q 4Q05
.4
4Q05
.5
.9.5 .7 .9
SR 5.5 6.2 6.7
SR 6.7
.5
2.2
1Q06F
.2
1Q06F
.7
1Q06F
.9
1Q06F
.9
1Q06F
11.2:1
8.0
5.4
2.8
8.5

25
CHINA
DANING
• Location: Shanxi province
• Investment: USD 32M (12.49% interest)
• Reserves : 75 Mt. Anthracite
• Production : 5 Mtpa
• Method : Underground longwall
• Market : Domestic power and fertilizerplants
• Logistics : Short – distance rail and truck
• Status : Operational
HEBI ZHONG TAI MINING CO. (HTZM)
• Location : Henan province
• Investment : USD 38M (40% interest)
• Reserves : 34Mt. Semi-anthracite
• Production : 1 Mtpa, expandable to 1.8 Mtpa by 2008
• Method : Underground longwall
• Market : Domestic power, steel mills,and fertilizer plants
• Status : Operational; Banpu to do equity account in 2Q06
China coal operations

26
China coal projects progress review
Daning - Longwall
Underground Mine

27
China coal projects progress review
Daning: Coal processing facilities

28
China coal projects progress review
Daning

29
China coal projects progress review
Hebi

30
BLCP plant progress view
• Location : Map Ta Put Industrial Estate
• Banpu % : 50%
• Capacity : 1,434 MW
• Fuel : Coal (approximately 3 mtpa)
• COD : Oct06 and Feb07(c. 700MW each unit)
Under constructionc. 93% completion*
Value
Development
Ship unloading facilities
9 Jan 06
Power plant
Stack
Boiler#1 Boiler#2
Coal stock yard
* As of January 31, 2006

31
Unloading port

32
Arrival of first coal shipment, cape size
11 February 2006
33
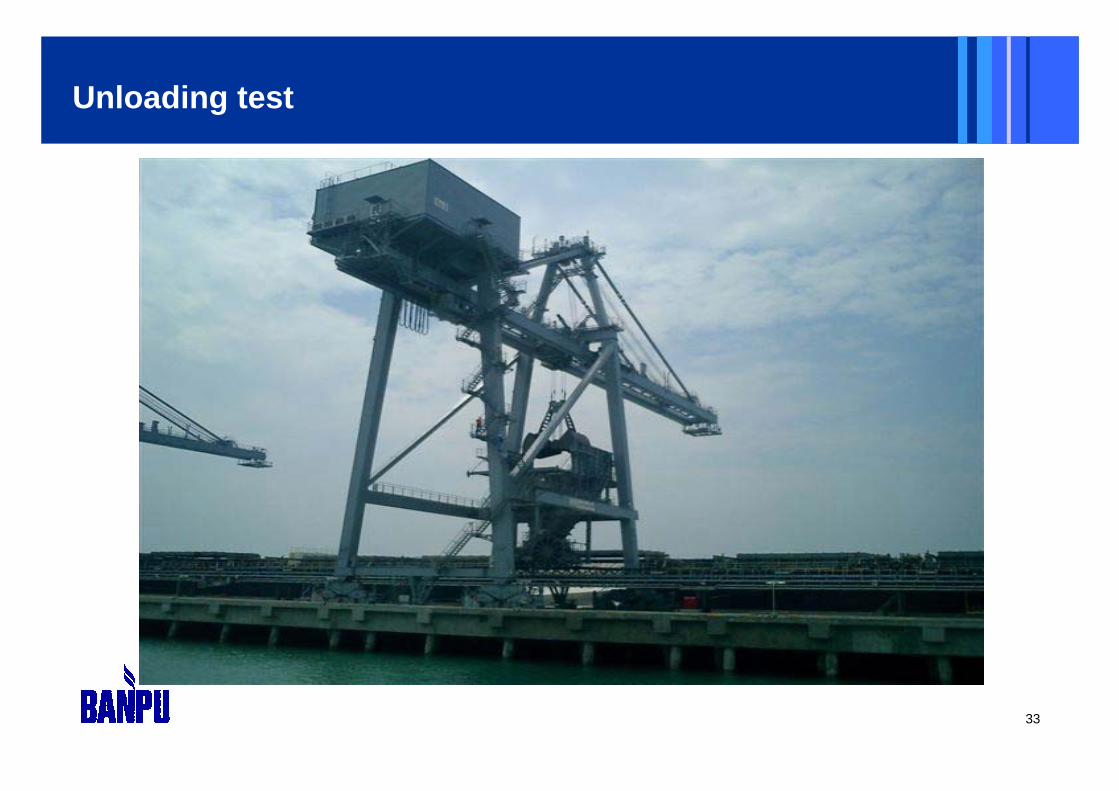
Unloading test

34
Unloading test

35
First coal pile on stockyard

36
4. Commercial review
Rawi CorsiriChief Operating Officer

37
10
20
30
40
50
60
1Q02
2Q02
3Q02
4Q02
1Q03
2Q03
3Q03
4Q03
1Q04
2Q04
3Q04
4Q04
1Q05
2Q05
3Q05
4Q05
1Q06
e
BJI
Weighted avg
Indominco
Average Selling Prices (ASP)
ASP 2005 : $35.2 per tonne (+37% YoY)
ASP 2006e : $34 per tonne (-3% YoY)US$/Tonne
Contracted sales
2006
Unpriced
Priced
39%
61%
BJI*
Feb 23th: $47.0
Note: *Barlow Jonker Index (BJI) based on CV 6,700 kcal/kg GAD from Australia to JapanSource: Barlow Jonker

38
Customer distribution
Philippines7%
Indonesia3%
Japan, Korea,
Taiwan, Hong Kong
53%
India5%
Italy12%
Thailand14%
Others6%
Coal sales by value: Bt 25bn in 2005
-
1.0
2.0
3.0
4.0
5.0
6.0
7.0
8.0
Thai mines
Jorong
Kitadin-Embalut
Indominco-Bontang
Trubaindo
Japa
n,
Kor
ea,
Taiw
an, H
K
Thai
land
Indi
a
Phi
lippi
nes
Indo
nesi
a
Italy
Oth
ers
Coal sales by volume: 17 Mt in 2005Mt
38%
32%
8%6%
6%5%5%

39
Major coal customers in 2005
Customer
SCC
ENEL
SCCC
Chubu
EPDC
Kowepo
Adani
TCC
TPIPL
Hoping
Coal & Oil
TNB
PLN Paiton
NPC Pagbilao
PLN Asam Asam
Country
Thailand - c
Italy - p
Thailand - c
Japan - p
Japan - p
Korea - p
India - g
Thailand - p
Thailand - c
Taiwan - p
India - g
Malaysia - p
Indonesia - p
Philippines - p
Indonesia - p
Coal MT
1.4 mt
1.3 mt
1.0 mt
0.9 mt
0.8 mt
0.7 mt
0.7 mt
0.6 mt
0.6 mt
0.6 mt
0.5 mt
c. 0.5 mt
0.4 mt
0.4 mt
0.3 mt
Starting 2H06

40
5. Financial review
Somruedee SomphongChief Financial Officer

41
25,046
12,331
17,062
2003 2004 2005
Sales revenues: coal business
Note : Revenues from other businesses (e.g. industrial minerals) are not included
Units: Bt. million
• 9% increase in sale volume
• 37% increase in selling price
+47%
Y on Y
42
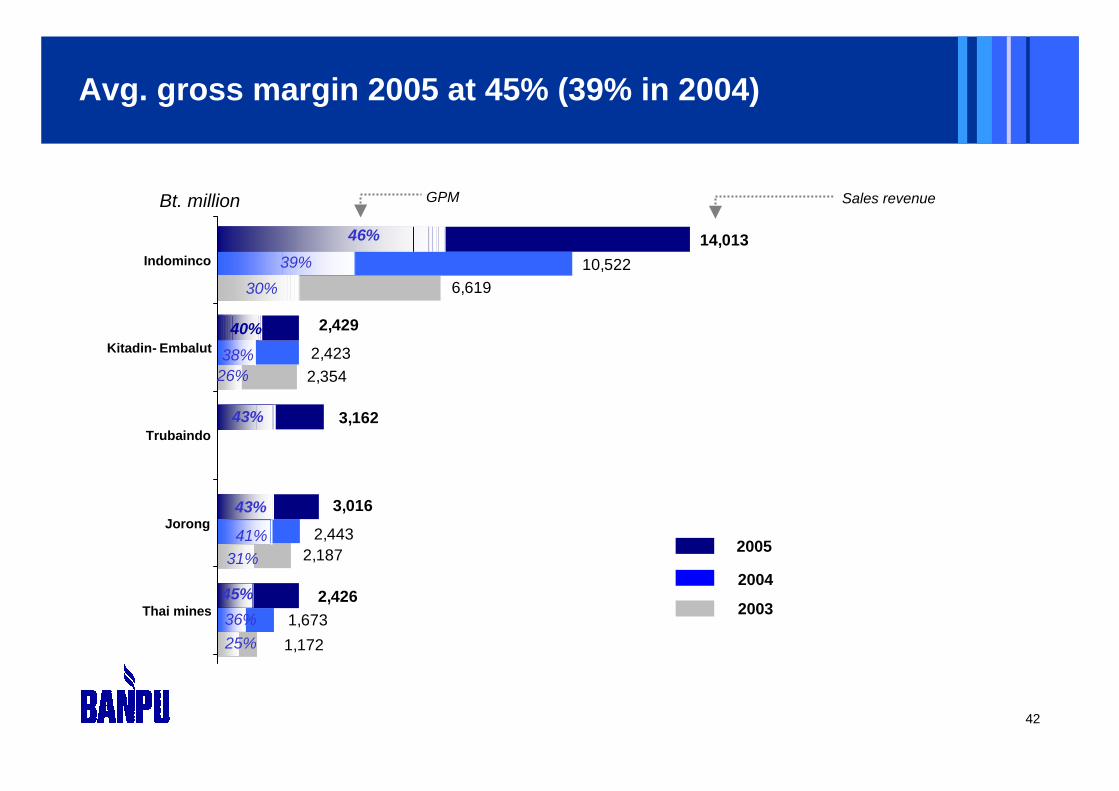
6,619
2,354
2,187
1,172
10,522
2,423
2,443
1,6732,426
3,016
3,162
2,429
14,013
Thai mines
Jorong
Trubaindo
Kitadin-Embalut
Indominco
Bt. million GPM Sales revenue
Thai mines
Jorong
Trubaindo
Kitadin- Embalut
Indominco
46%39%
30%
38%
43%
41%31%
45%36%25%
40%
26%
43%
2005
2004
2003
Avg. gross margin 2005 at 45% (39% in 2004)
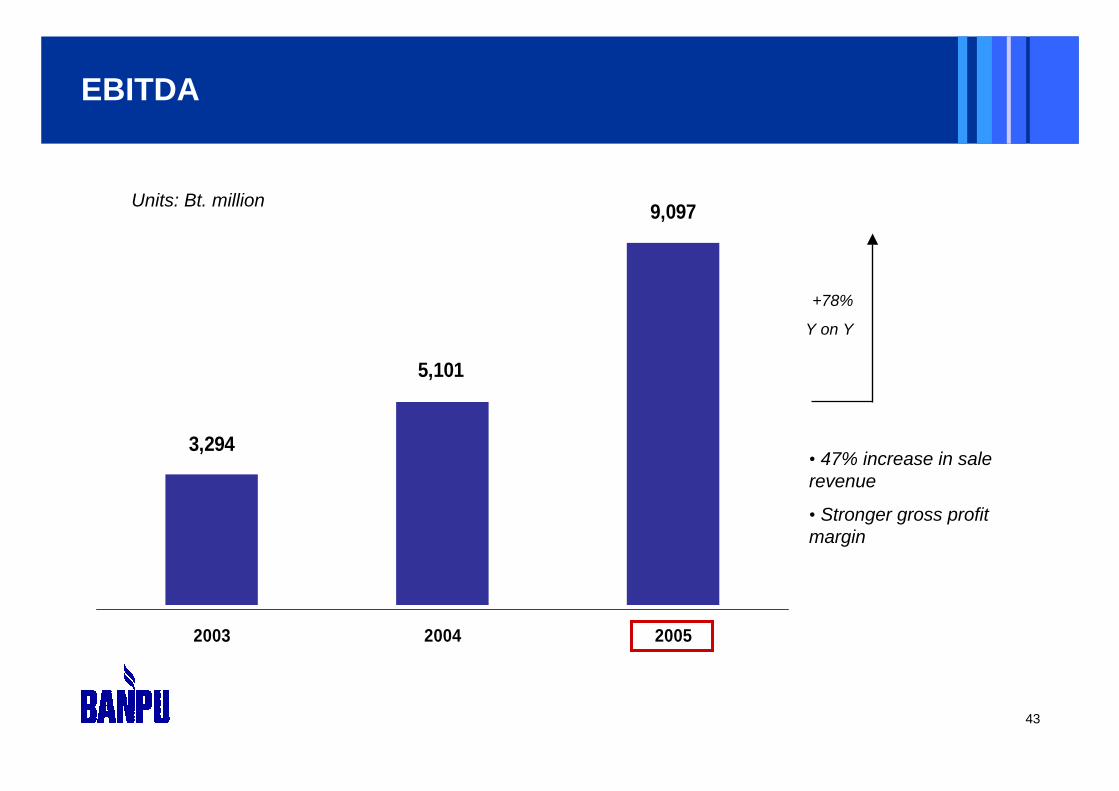
43
9,097
5,101
3,294
2003 2004 2005
Units: Bt. million
EBITDA
+78%
Y on Y
• 47% increase in sale revenue
• Stronger gross profit margin

44
Medium term (2005-08) CAPEX plans: $611million
Units: USD million
59
63
147
73
120
BLCPCoal ChinaCoal Indonesia
73
180
Committed Pre-feasibility ConceptualStatusCoal projects
Power projects
Indominco 12Trubaindo 47AACI 30Hebi 38
BLCP 147Peak 84
Bharinto 45Indominco 28
Indonesia 30China 120
China 30
The capital expenditure figures shown above are indicative only and do not include estimates for maintenance or sustaining capital expenditure. The figures shown in the ‘Conceptual’ column should be treated with extra caution and are likely to change as new projects are conceived, some are cancelled and as pre-feasibility analyses generate modified estimates of capital expenditure requirements.
Power China
84
358
Note: Spent in FY2005
30
30

45
0.34
0.250.240.230.24
0.56
2003 2004 1Q05 2Q05 3Q05 4Q05
Floating 9%
Fixed 91%
Strong balance sheet
Debt structureNet D/E (Times)
Net gearing (%)
As end of December 2005
36%
20% 20% 20% 20%25%

46
Dividend payments
55.54
2.6
3.5
4
2002 2003 2004 2005
Dividend per share (Bt)
(1H05)
(Special)
(2H05)

47
APPENDICES

48
China CHP business: ownership structure
Banpu Power Ltd
PPIC IEC
Zhengding Luannan Zouping Bengbu
100% 70%100%
90.9% 100%
64%
ShijiazhuangChengfeng Cogen Co.
Tangshan Peak Heat & Power Co Ltd
Zouping Peak Heat & Power Co Ltd
Anhui New Energy Heat & Power Co Ltd
Singapore co. China JV or WFOE co.

49
Zhengding - background
Zhengding CHP plant
49MW+160tph
Commenced operation 2000; expansion in 2004. Further expansion being studied
Ownership: 100%
WFOE* status
185 employees
Hebei Power accounts for 58% sales
Main industries in Zhengding County: tourism, furniture and food
Hebei Province facing power shortages in recent years. Shortages likely to remain.
* Wholly-Owned Foreign Enterprise
50
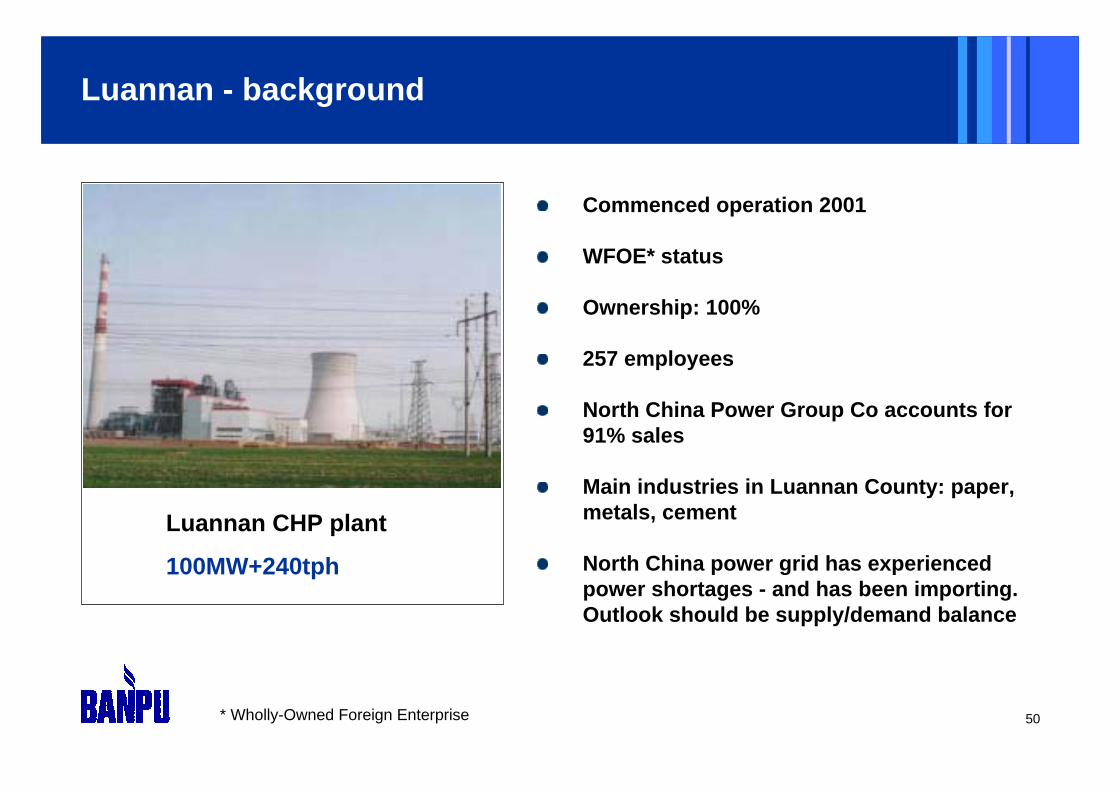
Luannan - background
Luannan CHP plant
100MW+240tph
Commenced operation 2001
WFOE* status
Ownership: 100%
257 employees
North China Power Group Co accounts for 91% sales
Main industries in Luannan County: paper, metals, cement
North China power grid has experienced power shortages - and has been importing. Outlook should be supply/demand balance
* Wholly-Owned Foreign Enterprise

51
Zouping - background
Zouping CHP plant
50MW+160tph
Commenced operation 2001. Expansion of 25MW currently under construction.
Ownership 70%
Company JV status; partner (30%) is Zouping County Power Co (‘ZP Power’)
253 employees
ZP Power accounts for 70% sales
Main industries in Zouping County: textiles (China’s No.1 textile area), agriculture
Power supply in Zouping County and Shandong Province is in surplus

52
Bengbu - background
Bengbu CHP plant
80MW+440tph
Commenced operation 1989. Expansion currently under consideration.
Ownership: 64%
Company JV: partners Bengbu H&P (30%), Transpacific Capital (6%)
707 employees
Anhui Power accounts for 64% sales
Main industries in Bengbu County: chemicals, agricultural product processing, glass, mechanical parts
Slight power shortage in Anhui Province

53
Bengbu - background
Bengbu CHP plant
Commenced operation 1989. Expansion currently under consideration.
Ownership: 64%
Company JV: partners Bengbu H&P (30%), Transpacific Capital (6%)
707 employees
Anhui Power accounts for 64% sales
Main industries in Bengbu County: chemicals, agricultural product processing, glass, mechanical parts
Slight power shortage in Anhui Province

54
China CHP business: financial summary (2005)
Plant name
Zhengding
Luannan
Zouping
Bengbu
Revenues
$ 16.8 M
$ 28.1 M
$ 26.9 M
$ 31.8 M
EBITDA
$ 3.7 M
$ 10.2 M
$ 7.0 M
$ 2.9 M
NPAT
$ 0.8 M
$ 6.1 M
$ 2.9 M
$ 0.2 M
External debt (YE)
$ 9.9 M
-
$ 3.7 M
$ 9.1 M

55
China CHP business: utilization hours (2005)
Plant name
Zhengding
Luannan
Zouping
Bengbu
Utilization (Hours)
6,482
5,857
8,700
7,334

56
Chinese power sector: key statistics 2005
Indicator
Total installed capacity
Of which:
Thermal
Hydro
Nuclear
Power generation
Of which:
Thermal
Hydro
Nuclear
2005
508.4 GW
384.1 GW
116.5 GW
6.9 GW
2,475 bn kWh
2,018 bn kWh
395 bn kWh
52 bn kWh
% increase y-o-y
14.9%
16.6%
10.7%
0.1%
12.8%
11.5%
19.4%
3.7%
Source: China Electricity Council

57
Chinese power sector: key statistics 2005 (continued)
Indicator
Hours of operation *
Thermal
Hydro
Nuclear
Power supply
Transmission loss
Coal efficiency*
Coal consumption*
2005
5,411 hrs
5,876 hrs
3,642 hrs
7,554 hrs
2,158 bn kWh
7.18%
374g/kWh
984 Mt
Increase y-o-y
-44 hrs
-115 hrs
180 hrs
-51 hrs
14.2%
-0.4%
-2g
Source: China Electricity Council * Plants over 6MW

58
Operating profit
Units: Bt. million
Sales revenues 7,189 5,400 -4% 33%Cost of sales (4,400) (3,004)Gross profit 2,789 2,396 -22% 16%GPM 39% 44%SG&A (1,266) (682)Royalty (667) (545)Equity income - Power (30) 59Dividend income - Power - -Other income 16 83EBIT 842 1,311 -64% -36%EBITDA 1,860 1,665 -39% 12%
4Q05 4Q04 QoQ % YoY %
7,508(3,923)
3,58548%(645)(850)
0 217
322,3403,033
3Q05

59
Units: Bt. million
EBIT 842 2,340 1,311 -64% -36%Interest expenses (166) (149) (93)Financial expenses (57) (62) (36)Income tax (core business) (181) (548) (250)Minorities (26) (72) (27)Net profit before extra items 412 1,509 906 -73%Non-recurring items* 499 390 571Income tax (non-core business) (164) (152)Unrealized gain on coal swap contract (3) (3) 24Bond redemption premium - - -Mining property expense (17) (19) (15)Net profit 727 1,724 1,227 -58% -41%FX translations (2) (41)Net profit 725 1,683 1,148 -57% -37%EPS (Bt/share) 2.66 6.19 4.22
Note: * Income from non-core assets and other non-operating expenses
4Q04 YoY %4Q05 3Q05 QoQ %
Net profit
-33%
(258)
(80)

60
Operating profit
Units: Bt. million
Sales revenues 25,208 46%Cost of sales (13,933)Gross profit 11,275 68%GPM 45%SG&A (2,935)Royalty (2,548)Equity income - Power (126) Dividend income - Power 457Other income 208EBIT 6,332 75%EBITDA 9,097 78%
2005 YoY %
17,227(10,525)
6,70239%
(2,003)(1,700)
(22) 413219
3,6095,101
2004

61
Units: Bt. million
EBIT 6,332 3,609 75%Interest expenses (509) (412)Financial expenses (220) (141)Income tax (core business) (1,480) (823)Minorities (186) (67)Net profit before extra items 3,936 2,166Non-recurring items* 2,563 1,904Income tax (non-core business) (738) (381)Unrealized gain on coal swap contract (8) 24Bond redemption premium - -Mining property expense (72) (61)Net profit 5,682 3,651 56%FX translations (117) (6)Net profit 5,565 3,645 53%EPS (Bt/share) 20.48 13.42
Note: * Income from non-core assets and other non-operating expenses
YoY %2005 2004
Net profit
82%

62
Banpu’s Resources & Reserves statement (100% basis)
--34.4-34.473.5-73.540.00Hebi Zhongtai
75.0110.073.9-73.9107.335.072.312.49Daning No. 1
300.81,037.2363.675.2288.41,220.6375.3845.2Total
32.838.832.812.320.538.80.738.194.99Barasentosa
-85.928.56.322.2218.482.5135.994.04Bharinto
Project
2.22.41.6-1.61.8-1.8100.00Payao
7.27.94.2-4.24.6-4.6100.00Lampang
67.2307.465.830.035.8305.7134.7171.085.49Trubaindo
21.0155.919.25.114.2153.751.0102.794.98Kitadin
62.4283.972.916.156.8275.371.5203.894.98Indominco
33.145.030.20.829.441.6-41.695.00Jorong
Mine operation
Total Reserves
Total Resources
Total Reserves
Probable Reserves
Proved Reserves
Total Resources
Indicated Resources
Measured Resources
As at 31 December 2004
As at 31 December 2005Interest
(%)Mine operation and project