fy 2010 results en - safran · fy 2010 earnings - february 24, 2011 2 safran fy 2010 highlights...
TRANSCRIPT

February 24, 2011
Full-Year 2010 Earnings
Jean-Paul HERTEMANCEO
Ross McINNESCFO
Safran

FY 2010 Earnings - February 24, 2011
2
Safran
FY 2010 Highlights
Jean-Paul HERTEMANCEO

FY 2010 Earnings - February 24, 2011
3
FY 2010 financial highlightsSolid operating leverage
Growing revenue with strongperformance in Defence and Security
FY 09 FY 10
10,448 10,760+3.0%
Recurring operating income at 8.2% of revenue highlighting good control
of cost base
FY 10
729878+20%
Higher net profit (group share) at €1.27 per share
FY 09restated
FY 10
395508+29%
Net cash positive. Driven by better-than-expected WC
and very strong operating CFFY 09 FY 10
(498)
24
+€522 M
Proposed 2010 dividend up 32% vs. 2009
FY 09 FY 10
0.38
0.50+32%
(€M) (€M) (€M)
(€)
(€M)
FY 09restated

FY 2010 Earnings - February 24, 2011
4
Key strategic business achievementsSuccessful launch of LEAP-X
Selected by COMAC C919 for an integrated powerplant (LEAP-X engine, nacelle, thrust
reverser and pylon)
CFM LEAP-X selected on A320neo and Safran selected for the nacelle of CFM-
powered A320neo
First 100 C919 orders (Hainan Airlines, China Eastern, China
Southern, GECAS, CDB Leasing)
Already 180 A320neo orders (Virgin, Indigo); engines yet to be awarded
LEAP-X

FY 2010 Earnings - February 24, 2011
5
Introducing a new advanced engine: LEAP-X
Provides superior performance vs. latest upgrade of CFM56Burn 15% less fuelProduce 15% less CO2 emissionProduce 50% less NOxReduce noise by up to 15 EPNdB (Effective Perceived Noise)
Market potential for re-engined variant: 18,000 engines4,000 A320neo aircraft2,000 C919 aircraft3,000 B737 aircraft
R&D investment for LEAP-X (incl. the nacelle)Total cash R&D of c.€1bn (Safran’s share for 2011-2016)
LEAP-XA new baseline turbofan engine to power future replacements
for current narrow-body aircraft
EIS in 2016
The successor of CFM56

FY 2010 Earnings - February 24, 2011
6
Key strategic business achievementsEmerging stronger from 2010
Acquiring new businesses in core businesses
Winning key contracts
Pending government approvals
1,175 long-range IR goggles order for French Army
Supply of full fuselage wiring system on A380 for the whole life
of the program
Team-up with COMAC to provide C919 wiring
systems
7-year contract for ID documents (electronic passports and national identity cards) for the Netherlands
Issued the 12-digit unique ID numbers for 1.5 million residents
in India
SuperJet100 now certified in Russia. Significant orders
from Interjet
FY 2010 Earnings - February 24, 2011
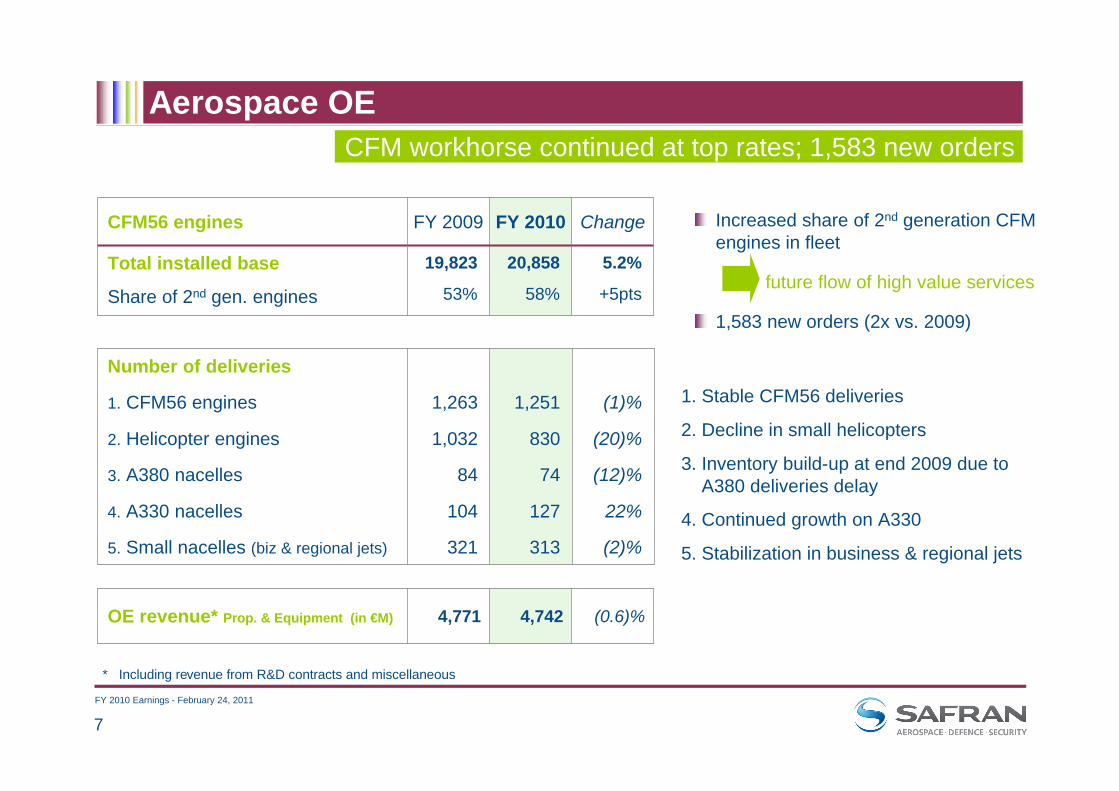
7
(1)%
(20)%
(12)%
22%
(2)%
1,251
830
74
127
313
1,263
1,032
84
104
321
Number of deliveries
1. CFM56 engines
2. Helicopter engines
3. A380 nacelles
4. A330 nacelles
5. Small nacelles (biz & regional jets)
Aerospace OE
20,858
58%
FY 2010
5.2%
+5pts
19,823
53%
Total installed base
Share of 2nd gen. engines
ChangeFY 2009CFM56 engines
(0.6)%4,7424,771 OE revenue* Prop. & Equipment (in €M)
Increased share of 2nd generation CFM engines in fleet
future flow of high value services
1,583 new orders (2x vs. 2009)
1. Stable CFM56 deliveries
2. Decline in small helicopters
3. Inventory build-up at end 2009 due to A380 deliveries delay
4. Continued growth on A330
5. Stabilization in business & regional jets
* Including revenue from R&D contracts and miscellaneous
CFM workhorse continued at top rates; 1,583 new orders
FY 2010 Earnings - February 24, 2011
8
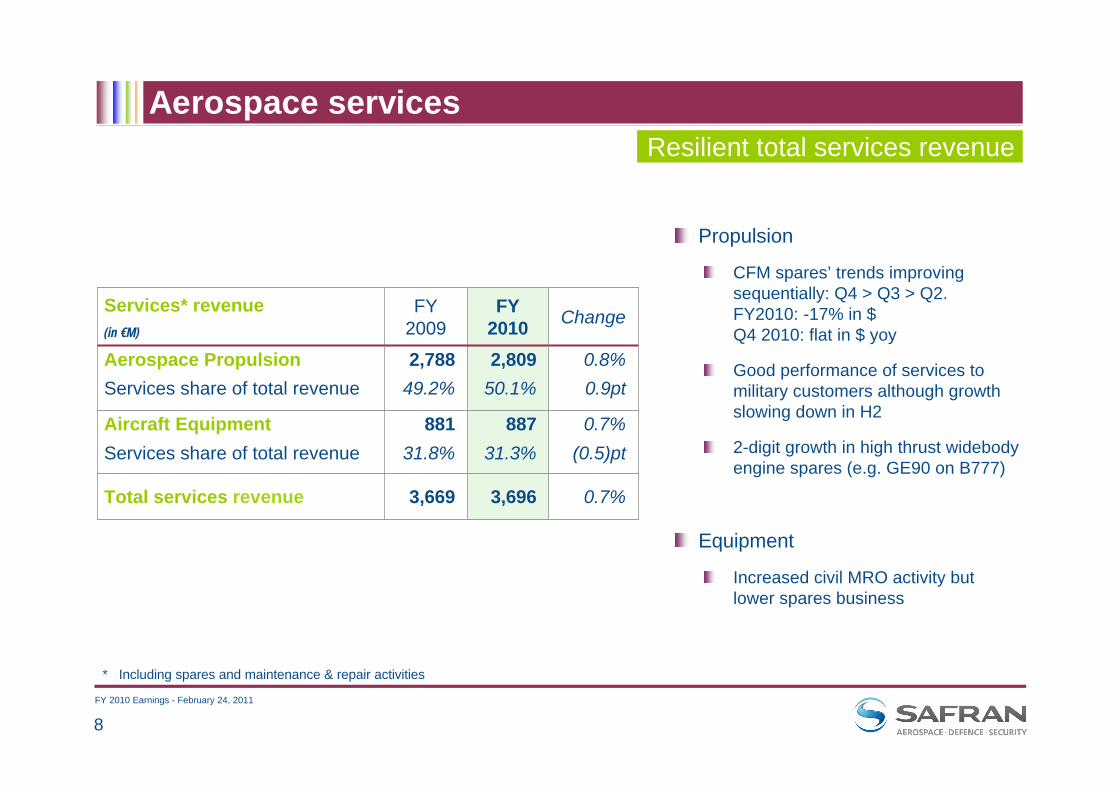
Propulsion
CFM spares’ trends improving sequentially: Q4 > Q3 > Q2.FY2010: -17% in $Q4 2010: flat in $ yoy
Good performance of services to military customers although growth slowing down in H2
2-digit growth in high thrust widebodyengine spares (e.g. GE90 on B777)
Equipment
Increased civil MRO activity but lower spares business
* Including spares and maintenance & repair activities
Aerospace services
0.7%3,6963,669Total services revenue
0.7%(0.5)pt
88731.3%
88131.8%
Aircraft EquipmentServices share of total revenue
2,80950.1%
FY 2010
0.8%0.9pt
2,78849.2%
Aerospace PropulsionServices share of total revenue
ChangeFY 2009
Services* revenue(in €M)
Resilient total services revenue

FY 2010 Earnings - February 24, 2011
9
Over 5-year backlog to date in CFM OEM (6,263 engines)9,500 engines yet to have their first shop visit
The aftermarket recovery has begun Outstanding fleet of CFM56 engines
CFM engines
0
5 000
10 000
15 000
20 000
82 83 84 85 86 87 88 89 90 91 92 93 94 95 96 97 98 99 00 01 02 03 04 05 06 07 08 09 10 11E
(Nom
bre
de m
oteu
rs C
FM)
20,000
15,000
10,000
5,000
0
Global CFM56 spare parts revenueBasis 100 - 9/11/2001Basis 100 - Sept. 2008
2009 2010 2011
60708090100110120130140
2002 2003 2004
After Lehman
After 9/11

FY 2010 Earnings - February 24, 2011
10
Organic and acquisition-driven growth Fast-paced development of Security
0
200
400
600
800
1000
1200
2007 2008 2009 2010
Revenue from acquisitions (Printrak, GE HLP)Restated revenue at 2008 perimeter (excluding Monetel activity) and excluding contract in Ivory Coast
Average reported growthCAGR2007-10 = ~21%
Average organic growth CAGR2007-10 = ~15%
Revenue (€M) - Security
1,041
904
695
481

FY 2010 Earnings - February 24, 2011
11
Optronics: continued growth driven by soldier protection & supported by order backlog (€1.2bn+)
Strong dynamics on export marketsSignificant contracts notified by DGA for the supply of 16,454 Felin systems and 1,175 new-generation long-range infrared binoculars (JIM LR2)
AvionicsContract notified by DGA at end-2009 for the supply of 3,400 AASM modularair-to-ground weapons Continued Research and Technology DGA funds for strategic navigation activitiesSuccess on export markets not limited to Rafale export sales
Safran focused on resilient defence niches
FY 2010 Earnings - February 24, 2011
12
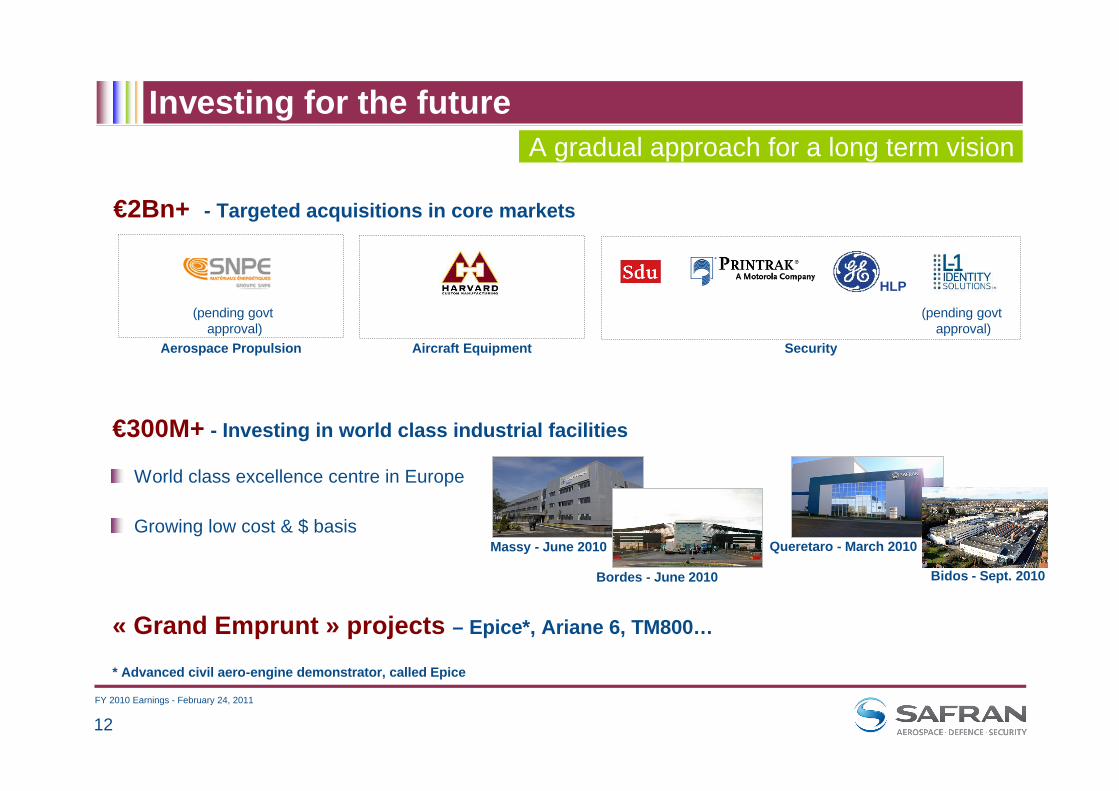
Investing for the futureA gradual approach for a long term vision
€2Bn+ - Targeted acquisitions in core markets
€300M+ - Investing in world class industrial facilities
HLP
Massy - June 2010
Bordes - June 2010
Queretaro - March 2010
(pending govtapproval)
Aerospace Propulsion Aircraft Equipment
(pending govtapproval)
Security
World class excellence centre in Europe
Growing low cost & $ basis
Bidos - Sept. 2010
« Grand Emprunt » projects – Epice*, Ariane 6, TM800…
* Advanced civil aero-engine demonstrator, called Epice

FY 2010 Earnings - February 24, 2011
13
Our M&A strategy pays off - successful, selective Proven track record
HLP
Recent acquisitions
Renewed a 7-year contract for ID documents for the Netherlands
Provider of fingerprinting technology for FBI’s Next generation ID program
Rationalisation
Reinforce our position in US aircraft and helicopters wiring systems (military & commercial)
Solid order intake in Explosive Detection Systems (TSA, Israel…)
XRD3500 system compliant with European ECAC Standard 3
Unmatched positions in North America with long-term contracts
Now fully integrated into ID business
Delivered 16% EBIT margin in 2010
Stable, strategic asset for France. Excellent long term visibility
Expected to deliver 15% EBIT margin in 2011
Delivered 22% EBIT margin in 2010
Expected run-rate cost synergies of appx. $30M (within 18 months after the closing)
Commercial success Delivering results
Value potential
+ to ++
+++
Transactions pending regulatory approvals

FY 2010 Earnings - February 24, 2011
14
Enhancing productivityContinued & lasting savings
Split of Safran+ gains by action in 2010
Optimize the supply chainSupporting suppliers switch to dollar and emerging zonesManaging the price rise in commodities (e.g. Nickel)World class new or revamped facilities
Lean manufacturing and improved productivityAcceleration of lean actions to reduce production costsEnhancing worker autonomy & involvement
Reduction of overhead expensesPooling of Purchasing teamsPooling of HR processes (e.g. payroll, hiring)
Improve marketing and accelerate services growthDynamic action plan to sell higher added-value & spares sales despite of the crisis
Reduction of structural cost
Sell better and accelerateservices growth
Lean manufacturing and product development
Optimize the Supply-Chain
Cost reduction
25%
16%
15%
44%

FY 2010 Earnings - February 24, 2011
15
Safran
Full-Year 2010 Results
Ross McINNESCFO

FY 2010 Earnings - February 24, 2011
16
All figures in this presentation represent Adjusted data (see “Additional Information” for bridge with consolidated accounts)
Safran’s consolidated income statement has been adjusted for the impact of:
purchase price allocations with respect to material business combinations. Since 2005, this restatement concerns the amortization charged against intangible assets relating to aeronautical programs that were revalued at the time of the Sagem-Snecma merger. With effect from the first-half 2010 interim financial statements, the Group has decided to restate the impact of purchase price allocations for all material business combinations (and not only those relating to the Sagem-Snecma merger). In particular, this concerns the amortization of intangible assets recognized at the time of the acquisition, and amortized over extended periods, justified by the length of the Group's business cycles;
the mark-to-market of foreign currency derivatives, in order to better reflect the economic substance of the Group's overall foreign currency risk hedging strategy:
revenue net of purchases denominated in foreign currencies is measured using the effective hedging rate, i.e., including the costs of the hedging strategy,the recognition of all mark-to-market changes on non-settled hedging instruments at the closing date is neutralized, including the “ineffective” portion with effect from the publication of the 2009 financial statements, given that the Group's hedging strategy includes optional hedging instruments and optimization measures combined with highly volatile market inputs used to mark to market.
Recurring operating incomeIt excludes income and expenses which are largely unpredictable because of their unusual, infrequent and/or material nature such as: impairment losses/reversals, capital gains/losses on disposals of operations and other unusual and/or material non operational items).
ForewordDefinitions

FY 2010 Earnings - February 24, 2011
17
FY 2009 restated income statement
3-3Share in profit from associates
69431663Profit from operations
0.990.94EPS (in €)39519376Net income – group share
(16)(2)(14)Minority interests(4)-(4)Profit (loss) from discontinued op.
(108)(10)(98)Income tax expense(174)-(174)Net financial income (expense)
6.6%6.3%% of revenues
(35)(35)Other non-current charges/income
7.0%6.7%% of revenues72931698Recurring operating income
10,44810,448Revenue
(i)(in Euro million)
FY 2009 restated
PPAFY 2009 reported
Income Statement
Full-year 2009 adjusted results which shall serve as a basis of comparison have been restated for:(i) Purchase price allocation entries impacts for major acquisitions (especially in the Security business).

FY 2010 Earnings - February 24, 2011
18
Fx volatility
Continued Fx volatility during FY 2010
Translation effect: foreign currencies translated into €⇒ Strong positive impact from $, AUD, BRL and CAD⇒ Impact on Revenue and Return on Sales
Transaction effect: mismatch between $ sales and € costs is hedged⇒ Mild negative impact from $ ⇒ Positive impact from other currencies ($/CAD, $/GBP)⇒ Impact on Profits
Mark-to-market effect⇒ €(275)M on fair value of financial instruments⇒ Impact on consolidated “statutory” accounts
Diverse impacts on P&L
Hedge rate
$ 1.44$ 1.42FY 2010FY2009
Average spot rate
$ 1.33$ 1.39FY 2010FY 2009
Spot rate
$ 1.34$ 1.44Dec. 31, 2010Dec 31, 2009

FY 2010 Earnings - February 24, 2011
19
Consolidated and adjusted income statements
PPA impacts -other business combinations
Amortization of intangible assets -
Sagem/Snecma
102
(3)
105
(54)
159
159
159
87843(15)(260)951Recurring operating income
(13)(13)Other non current operating income / expense
508251704207Parent
(20)(3)4(18)Minority interests
(5)(5)Profit (loss) from discontinuing operations
53328170230Profit (loss) from continuing operations
(173)(15)(90)(14)Income tax expense
99Income from associates
(168)275260(703)Net finance costs / income(136)(136)Other finance costs /income
4275260(531)Foreign exchange financial income (loss)
(36)(36)Cost of debt
86543(15)(260)938Profit (loss) from operations
(9,882)43(15)8(10,077)Other operating income / expense
10,760(268)11,028Revenue
Deferred hedging
gain (loss)
Re-measurement
of revenue
Adjusted consolidated
income statement
Business combinationsHedge accountingConsolidated
income statement
(In €M)
2010 reconciliation
FY 2010 Earnings - February 24, 2011
20
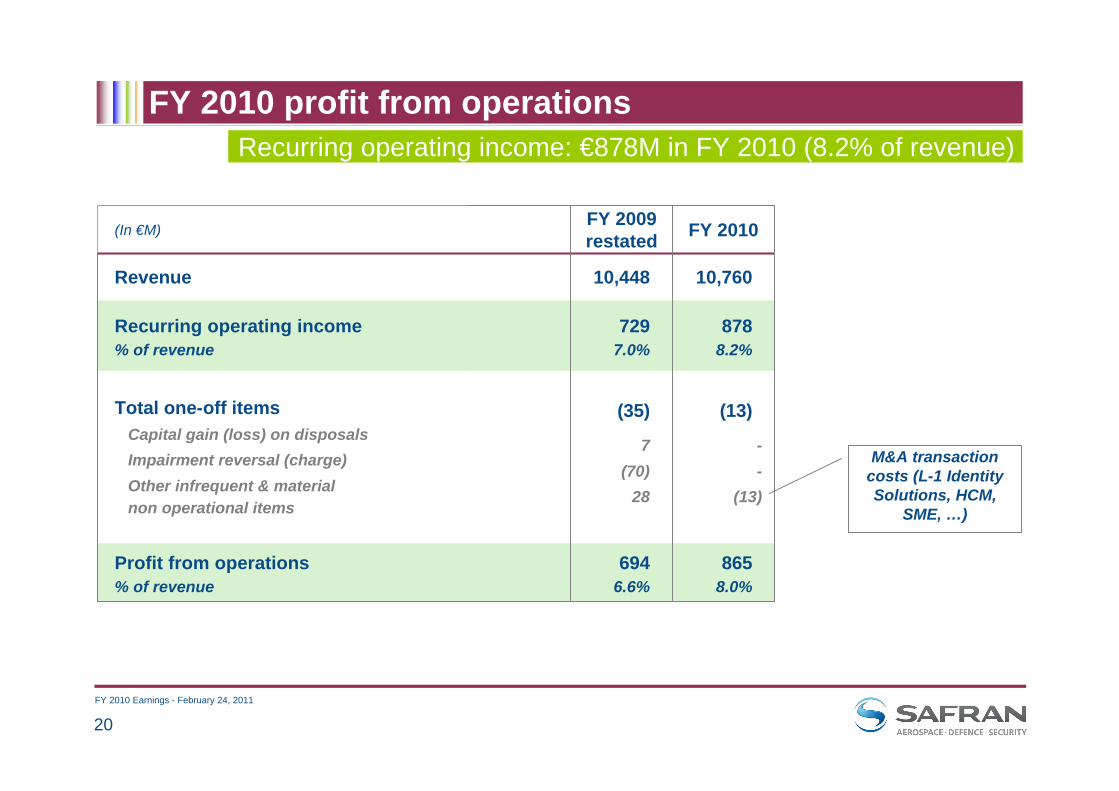
FY 2010 profit from operations
8658.0%
6946.6%
Profit from operations% of revenue
--
(13)
7(70)
28
Capital gain (loss) on disposalsImpairment reversal (charge)Other infrequent & material non operational items
(13)(35)Total one-off items
8788.2%
7297.0%
Recurring operating income% of revenue
10,76010,448Revenue
FY 2010FY 2009restated (In €M)
Recurring operating income: €878M in FY 2010 (8.2% of revenue)
M&A transaction costs (L-1 Identity Solutions, HCM,
SME, …)

FY 2010 Earnings - February 24, 2011
21
FY 2010 income statement
Of which cost of net debt of €(36)M
3760.94
(174)(98)
(4)(14)
3
6636.3%
6986.7%
10,448
FY 2009reported
5081.27
3950.99
Profit - group shareBasic EPS* (in €)
(168)(173)
(5)(20)
9
(174)(108)
(4)(16)
3
Net finance (cost) incomeIncome tax expenseProfit (loss) from discontinued op.Minority interestsShare in profit from associates
8658.0%
6946.6%
Profit from operations% of revenue
8788.2%
7297.0%
Recurring operating income% of revenue
10,76010,448Revenue
FY 2010FY 2009restated(In €M)
EPS growth of 28%
* Based on 399,552,920 shares
Effective tax rate of 25%

FY 2010 Earnings - February 24, 2011
22
FY 2010 revenue
Defence (optronics) and Security (detection) up
Mild decline in OE aerospace with resilient services
Favourable currency impact
Translation: positive impact $, AUD, BRL, CAD
Transaction: negative impact of $ ($1.44 in 2010 vs. $1.42 in 2009)
Changes in the scope of consolidation include:
8 months of MorphoDetection (GE HLP): €133M
3 months of MorphoTrak(Printrak): €8M
FY 2010Currency impact
FY 2010at constant FY 2009 perimeter
Acquisitions & activities newly consolidated
FY 2009
(In €M)
10,44810,344
10,563
(1.0)%organic
Organic variation
FY 2010 at constant
FY 2009 perimeter and exchange rate
(104)219
197
3.0% increase
+3.0%
10,760
FY 2010 Earnings - February 24, 2011
23
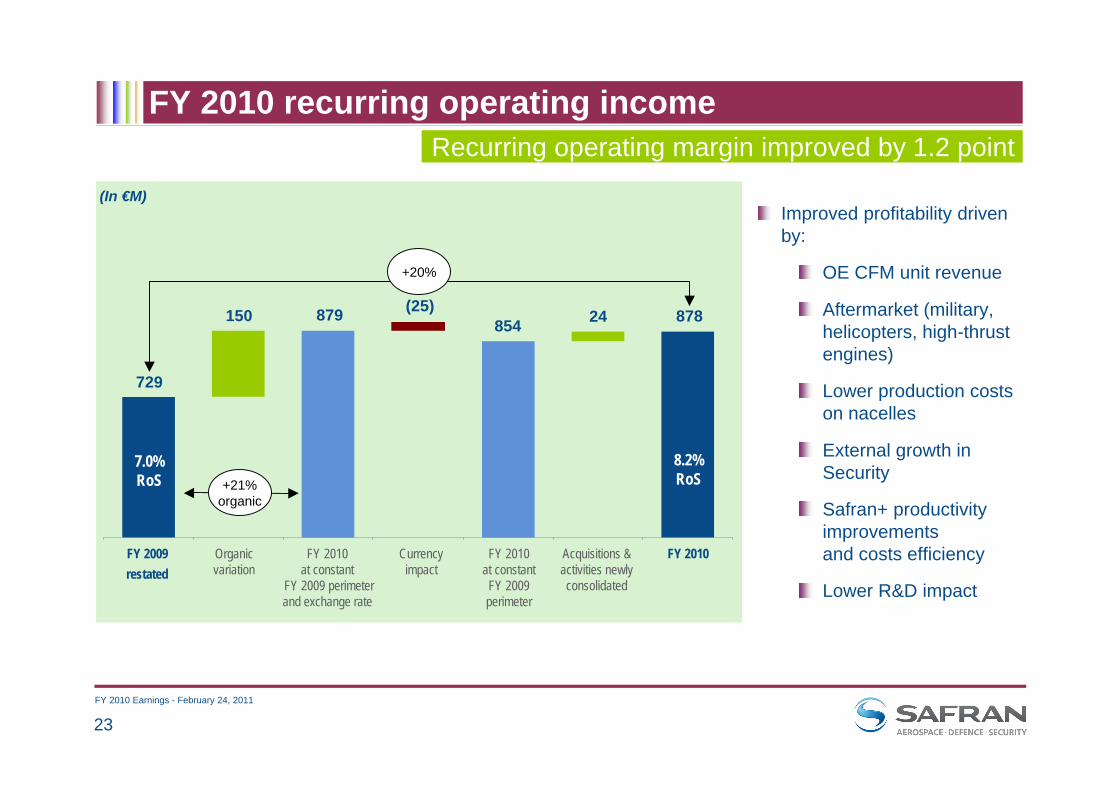
FY 2010 recurring operating income
Improved profitability driven by:
OE CFM unit revenue
Aftermarket (military, helicopters, high-thrust engines)
Lower production costs on nacelles
External growth in Security
Safran+ productivity improvements and costs efficiency
Lower R&D impact
Recurring operating margin improved by 1.2 point
FY 2010Currency impact
FY 2010at constant FY 2009 perimeter
Acquisitions & activities newly consolidated
FY 2009restated
(In €M)
729
879 854
+21%organic
Organic variation
FY 2010 at constant
FY 2009 perimeter and exchange rate
878150 (25) 24
7.0%RoS
8.2%RoS
+20%

FY 2010 Earnings - February 24, 2011
24
(3)179182Capitalized expenses
(50)458508Recorded as operating expenses
(0.7)pt5.9%6.6%% of revenue
(7.7)%637690Total self-funded R&D(before tax credit*)
ChangeFY 2010FY 2009(In €M)
(159)406565Ebit impact after R&D tax credit *
(133)530663Ebit impact before R&D tax credit *
(83)72155Amortisation / depreciation
(50)458508Recorded as operating expenses
ChangeFY 2010FY 2009(In €M)
Research & Development
R&D effort maintained with normative trend at 6 to 7% of revenue
Tailing off of R&D developmentson SJ100, A400M and B787
Increasing R&D developments on LEAP-X engine as well as A350 program
Tax credit* impact of €124M in 2010vs. €98M in 2009
* “Crédit Impôt Recherche” in France & Canada
R&D effort maintained, lower impact on EBIT
Of which €71M impairment charge on B787 in 2009

FY 2010 Earnings - February 24, 2011
25
Aerospace Propulsion
Mild decline in revenue
Growth in services for military, helicopters & high trust engines
Lower OE deliveries (military, helicopters, high trust engines)
Soft but improving CFM aftermarket
Growing profits despite CFM aftermarket softness
Aftermarket (military, high trust engines)
Impact of better OE CFM unit revenue
Productivity improvements
Slight adverse currency effect
R&D: tailing off of SaM146 and TP400; increasing efforts on LEAP-X
102145Capex (tangible assets)
9884Capitalized expenses
233252Recorded as opex
5.9%5.9%% of revenue
331336Total self-funded R&Dbefore tax credit
FY 2010FY 2009(In €M)
-29One-off items
+0.7pt11.8%11.1%% of revenue
5.6%663628Recurring operating income
11.8%
663
5,604
FY 2010
(1.2)%
Change
(3.1)%5,673Revenue
11.6%% of revenue
657Profit (loss) from op.
Organic Change
FY 2009restated(In €M)
Key figures

FY 2010 Earnings - February 24, 2011
26
Aircraft Equipment
Revenue back to growth
Driven by new programs (B787) and stabilization in business and regional jets segment
Offset by lower nacelle activity
1-month consolidation of HCM
Recovery plan delivering results
Drastic reduction of losses in nacelles (reached operating breakeven in Q4 2010)
A 380 : lower volumes, improved production costs, commercial agreement with Airbus
B 787 : higher volumes, commercial agreement with Boeing
Repair & Overhaul on landing systems
6186Capex (tangible assets)
4565Capitalized expenses
6780Recorded as opex
4.0%5.2%% of revenue
112145Total self-funded R&Dbefore tax credit
FY 2010FY 2009(In €M)
(2) (71)One-off items
+1.9pt4.5%2.6%% of revenue
74%12773Recurring operating income
4.4%
125
2,834
FY 2010
2.4%
Change
Flat2,767Revenue
ns% of revenue
2Profit (loss) from op.
Organic Change
FY 2009restated(In €M)
Key figures

FY 2010 Earnings - February 24, 2011
27
Defence
Over 30% growth in Optronics with a favourable volume/price impact on profits
Felin, long-range IR goggles, thermal cameras, …
Avionics: mild decline in revenue, impacting profits in flight control systems
Further incremental costs to put in place Safran Electronics
6735Capex (tangible assets)
1833Capitalized expenses
91113Recorded as opex
8.8%13.8%% of revenue
109146Total self-funded R&Dbefore tax credit
FY 2010FY 2009(In €M)
--One-off items
+3.6pts4.4%0.8%% of revenue
511%559Recurring operating income
4.4%
55
1,240
FY 2010
16.9%
Change
12.4%1,061Revenue
0.8%% of revenue
9Profit (loss) from op.
Organic Change
FY 2009restated(In €M)
Key figures
Of which €(35)M loss at completion on A400M
navigation systems in 2009

FY 2010 Earnings - February 24, 2011
28
(4) -One-off items
+2.8pts12.3%9.5%% of revenue
49%12886Recurring operating income
11.9%
124
1,041
FY 2010
15.2%
Change
(6.0)%904Revenue
9.5%% of revenue
86Profit (loss) from op.
Organic Change
FY 2009restated(In €M)
Security
Revenue and profit growth benefited from acquisitions (mainly detection)
Adverse impact in 2010 of anticipated lower revenue of Identification government contract in Ivory Coast now tailing off
Except Ivory Coast :
Organic revenue growth (+7%)
Very good performance for Identification (Albania, Mexico, Kazakhstan) and smart cards activities (volume, improved production costs)
Continued investment in India
MorphoDetection delivered results in line with initial targets
2818Capex (tangible assets)
18-Capitalized expenses
6763Recorded as opex
8.2%7.0%% of revenue
8563Total self-funded R&Dbefore tax credit
FY 2010FY 2009(In €M)
Key figures
FY 2010 Earnings - February 24, 2011
29
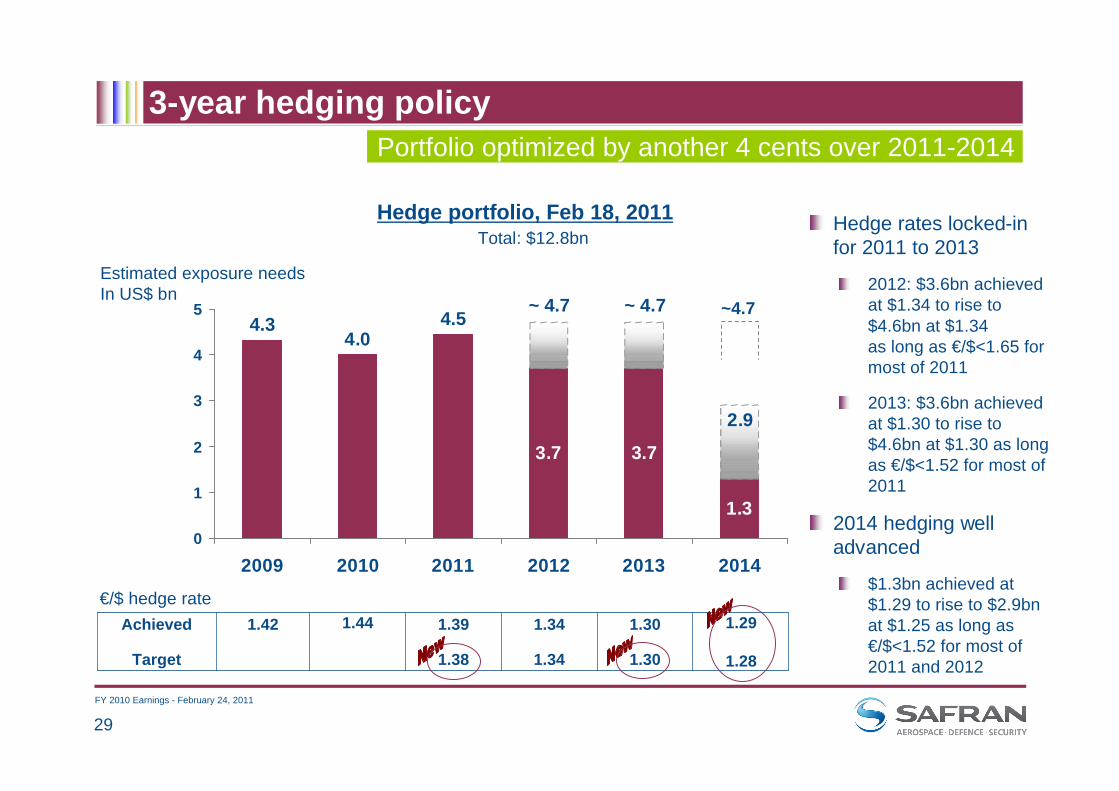
3-year hedging policy
Hedge portfolio, Feb 18, 2011
1.34
1.34
1.29
1.28
1.30
1.30
1.39
1.38
1.441.42Achieved
Target
Estimated exposure needsIn US$ bn
Hedge rates locked-in for 2011 to 2013
2012: $3.6bn achieved at $1.34 to rise to $4.6bn at $1.34as long as €/$<1.65 for most of 2011
2013: $3.6bn achieved at $1.30 to rise to $4.6bn at $1.30 as long as €/$<1.52 for most of 2011
2014 hedging well advanced
$1.3bn achieved at $1.29 to rise to $2.9bn at $1.25 as long as €/$<1.52 for most of 2011 and 2012
€/$ hedge rate
Portfolio optimized by another 4 cents over 2011-2014
Total: $12.8bn
1.3
3.7 3.7
~ 4.7 ~ 4.7
2.9
4.54.0
4.3
0
1
2
3
4
5
2009 2010 2011 2012 2013 2014
~4.7

FY 2010 Earnings - February 24, 2011
30
-100
-50
0
50
100
150
200
250
300
350
400
3-year hedging policy
An estimated cumulative €400M tailwind in EBIT over the next 4 years
Currency impact on profitability is around 2/3rd in Propulsion and 1/3rd in Equipment; non material for Defence and Security businesses
Estimated impact on recurring operating incomeof targeted €/$ hedge rates
Material tailwind in profitability expected over 2011-2014
102134
(44)
75
1.42
1.44
1.38
1.30
2009 2011E 2012E
1.34
2013E 2014E
108
1.28
2010
200
100
0
-100
EBIT impactvs. previousyear (in €M)
1.2
1.3
1.4
1.1
1.35
1.25
1.15
1.05
1
€/$hedge
rate
300
56

FY 2010 Earnings - February 24, 2011
31
Free Cash Flow
Excellent FCF generation
Strong cash receivables collection (including from the French MoD)
Tight control of capex
One-off cash impact
Commercial settlements with airframers
French Government stimulus package accelerated some tax credits
934818Free cash flow
(254)(292)Capex (intangible assets)
(271)(293)Capex (tangibles assets)
317361Change in Working capital
1,1421,042Cash from operating activities
5(1)Elimination of discontinued operations
16772Others
462576Depreciation, amortization and provisions
508395Adjusted net profit (loss)
FY 2010FY 2009 restated(in €M, at Dec. 31)
Cash from operations greater than recurring operating income

FY 2010 Earnings - February 24, 2011
32
(in €M)
(498)
317
Dividend
1,142(251)
Net cash position
Cash flow from operations is 1.30x EBIT
Dividend to parent holders was €152M (€0.38 per share)
€100M cash-out for the HCM acquisition
Net debt at Dec 31, 2009
Cash flowfrom ops
Others
Net cash at Dec 31, 2010
Change in WC
Tangible & Intangible
Capex
€934M Free Cash Flow
(161)
24
Preserving our financial flexibility
(525)
o/w €(100)M HCM acquisition

FY 2010 Earnings - February 24, 2011
33
Gross cash & debt
Credit line - €800M, undrawn, maturity Jan. 2012; no covenants
Credit line - €1,600M, undrawn, maturity Dec. 2015; subject to 1 covenant (net debt/EBITDA <2.5)
EIB loan (€300M) has been fully drawnMaturity 2020; subject to 2 covenants (net debt/EBITDA <2.5 and Gearing <1)
Available financing resources:Committed & undrawn = €2.4bn
Gross debt repayment schedule(Dec 31 , 2010)
301
568
1,182
<1 year 1 to 5 years >5 years
€1,250m
€1,000m
€750m
€500m
€250m
€0m
<1 year
The Group is adequately funded
FY 2010 Earnings - February 24, 2011
34
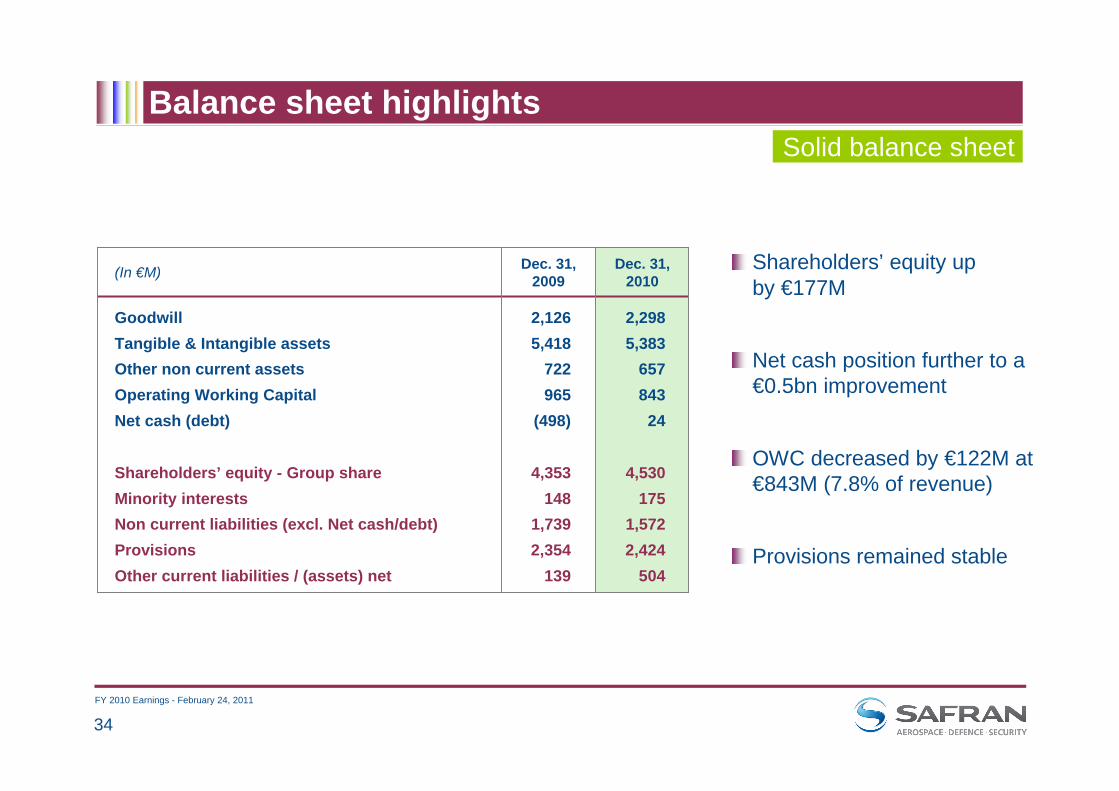
Balance sheet highlights
2,2985,383
657843
24
2,1265,418
722965
(498)
GoodwillTangible & Intangible assetsOther non current assetsOperating Working CapitalNet cash (debt)
4,530175
1,5722,424
504
4,353148
1,7392,354
139
Shareholders’ equity - Group shareMinority interestsNon current liabilities (excl. Net cash/debt)ProvisionsOther current liabilities / (assets) net
Dec. 31, 2010
Dec. 31, 2009(In €M) Shareholders’ equity up
by €177M
Net cash position further to a €0.5bn improvement
OWC decreased by €122M at €843M (7.8% of revenue)
Provisions remained stable
Solid balance sheet

FY 2010 Earnings - February 24, 2011
35
Customer financial guarantees
62110Provisions
66117Net exposure on these guarantees
61120Estimated value of pledges
127237Total guarantees
Dec. 31,2010
Dec. 31,2009(In $M)
Further decrease of total guarantees
Marginal Safran outstanding risk on Aircraft financing, representing less than 1% of Safran revenue on an annual basis
Further decrease of total guarantees reflecting a low level of request for manufacturers financing support
Outstanding risk of the portfolio covered by the conservative estimated value of the assets securing the financing and the provisions booked in Safran account

FY 2010 Earnings - February 24, 2011
36
2010 dividend
A proposal for a dividend payment of €0.50 at next Annual General Meeting on April 21, 2011
Approximately €200M cash disbursement in 2011
Ex-dividend date: April 26, 2011
Payment date: from April 29, 2011
Dividend per share(€)
Dividend distribution
(€M)167
104152
0.40
0.25
0.38
2007 2008 2009
0.50
c.200
2010
Highest dividend ever

FY 2010 Earnings - February 24, 2011
37
Safran
Outlook
Jean-Paul HERTEMANCEO

FY 2010 Earnings - February 24, 2011
38
As of Dec. 31, 2009
French State30.2%
Areva7.4%
Public38.1%
Treasury shares
4.2% Employees20.1%
Equity shareholdingFree float increased by 9.5 points in 2010
As of Dec. 31, 2010
French State30.2%
Areva2.0%
Public47.6%
Treasuryshares4.2%
Employees*16.0%
(*) of which 80% are available for sale

FY 2010 Earnings - February 24, 2011
39
Sustained traffic growth from 2010 and pickup in OE build rates for 2010/13
Aerospace fundamentals strengtheningThe civil aerospace recovery has breadth, strength and duration
Aircraft deliveries 2009-2013E
Short-medium range aircraft (A320, B737)CAGR 2010-13E = 3%
Long range aircraft (A330/340/350/380, B777/747…)CAGR 2010-13E = 12%
Commercial aviation passenger traffic (2000-2013E)
0
100
200
300
400
500
600
700
800
900
1000
2009 2010 2011E 2012E 2013E
RPK
(bill
ions
)#
airc
raft
Revenue Passenger per KilometreCAGR 2010-13E = 4.9%
2008 crisis severe enough to impact long term traffic (2 years of growth lost) but finally less severe than the 2001-03 period (almost 3 years of growth lost)
3000
3500
4000
4500
5000
5500
6000
2000 2001 2002 2003 2004 2005 2006 2007 2008 2009 2010 2011E 2012E 2013E
Opportunities for SafranExisting product base
and new programs

FY 2010 Earnings - February 24, 2011
40
2011 key assumptions
Civil aerospace aftermarket up 10-15%
Healthy rise in aerospace OE deliveries
Short term cautiousness specific to A380 and B787 programs
Increased R&D effort
• Includes spares and MRO• Driven by CFM and high-thrust engines
• Driven by A320, B737, B777, business andregional jets
• Aircraft equipment business linked to production & delivery rates
• Net impact of €50M+ on P&L and €200M+ in cash, notably for LEAP-X development
Growth in civil aerospace aftermarket and OE

FY 2010 Earnings - February 24, 2011
41
2011 outlook
Note: 2011 outlook does not include any contribution from L-1 Identity Solutions and SNPE Matériaux Energétiques
Revenue expected to increase by at least 5%at an estimated average spot rate of USD 1.33 to the Euro
Recurring operating income expected to increase by at least 20%at a targeted hedge rate of USD 1.38 to the Euro
Free cash flow expected to represent about a third* of the recurring operating income taking into account an expected increase in OWC and R&D investments
(*) An average of more than 50% across 2010-2011. 2010 FCF benefited from strong cash receivables ahead of 2011.

FY 2010 Earnings - February 24, 2011
42
Healthy prospects beyond 2011
Pick-up in build rates on the OE side and aftermarket growthOE to resume growth (A320/B737, B777, A380, B787, SJ100, bizjet…)Civil aftermarket revenue should grow at 2-digits for several years
Profitable growth in SecurityStrong demand for our technologyLong term target: 20% of revenue & mid-teen operating margins
Favourable hedge ratesGradual improvement through 2014
On-going Safran+ plan to enhance competitiveness and reduce overheads
2012 recurring operating margin well on the way to the 10% threshold

FY 2010 Earnings - February 24, 2011
43
Safran
Questions & Answers

FY 2010 Earnings - February 24, 2011
44
Safe harbor
Except for historical information, all other information in this presentation consists of forward-looking statements within the meaning of the US Private Securities Litigation Reform Act of 1995, as amended. These forward looking statements include statements regarding the future financial and operating results of Safran such as (i) expected revenue for full year 2011, (ii) expected profit from operations for the full year 2011 and iii) free cash flow for the full year 2011. Words such as "expects," "anticipates," "targets," "projects," "intends," plans," "believes," "estimates," variations of such words and similar expressions are intended to identify such forward-looking statements which are not statements of historical facts.These forward-looking statements are not guarantees of future performance and involve certain risks, uncertainties and assumptions that are difficult to assess. Therefore, actual outcomes and results may differ materially from what is expressed or forecasted in such forward-looking statements. These risks and uncertainties are based upon a number of important factors including, among others: our ability to operate effectively in a highly competitive industry with many participants; our ability to keep pace with technological advances and correctly identify and invest in the technologies that become commercially accepted; difficulties and delays in achieving synergies and cost savings; fluctuations in the aerospace market; exposure to the pricing pressures in the regions in which we sell; the pricing, cost and other risks inherent in long-term sales agreements; exposure to the credit risk of customers;reliance on a limited number of contract manufacturers to supply products we sell; the social, political and economic risks of our global operations; the costs and risks associated with pension and postretirement benefit obligations; the complexity of products sold; changes to existing regulations or technical standards; existing and future litigation; difficulties and costs in protecting intellectual property rights and exposure to infringement claims by others; compliance with environmental, health and safety laws; the economic situation in general (including exchange rate fluctuations) and uncertainties in Safran’s customers businesses in particular; customer demand for Safran’s products and services; control of costs and expenses; international growth; conditions and growth rates in the aerospace industry; and the impact of each of these factors on sales and income. For a more complete list and description of such risks and uncertainties, refer to Safran’s Document de Référence for the year ended December 31, 2009. Safran disclaims any intention or obligation to update any forward-looking statements after the distribution of this news release, whether as a result of new information, future events, developments, changes in assumptions or otherwise.
* Adjusted data
For forward looking statements

FY 2010 Earnings - February 24, 2011
45
Safran
Additional Information

FY 2010 Earnings - February 24, 2011
46
SME
Safran to acquire SNPE Matériaux EnergétiquesStrengthens the solid propulsion industry, a key to the long-term viability of European launch vehicles and missilesClosing expected in Q1 2011
Safran received specific guarantees concerning environmental liabilities due to past operationsUp to 40 years; up to €240M with a Safran contribution between 10 and 50%Covers third parties claims and closing of sitesWith a counter guarantee from the French government of up to €216M
Financial impact~ €270M cash-out~ €10M one-off restructuring & transaction costs in operating income (accounted for in one-off items)
Estimated 2011 annualized data2011E Sales: ~ €300M2011E EBITDA: ~ €45M
Creating a world leader in solid propulsion

FY 2010 Earnings - February 24, 2011
47
L-1 Identity Solutions
Transaction still pending final government approvals HSR terminated; L-1 shareholders approved the transactionCFIUS process still on-goingClosing expected in H1 2011
Subject to successful closing in 2011~ €780M cash-out~ €30M one-off restructuring & transaction costs in operating income (accounted for in one-off items)
Estimated 2011 annualized data2011E Sales: ~ $530M2011E EBITDA: ~ $100M (incl. cost synergies)
Creating a world leader in biometric solutions

FY 2010 Earnings - February 24, 2011
48
L-1: Creating a global leader in biometricsSafran to acquire the biometrics & enterprise access solutions, secure credentialing solutions and enrollment services businesses of L-1, a US-based leading global identity management provider
Transaction conditioned upon sale of L-1’s government consulting services (GCS) businesses to a third party and regulatory approvals
Significant step in the implementation of Safran’s strategy to develop as world leader in the field of mission critical high tech tier one players in the group’s three businesses: Aerospace, Defence and Security
Combination will provide an ideal platform to accelerate growth, notably in the U.S., and expand into new territories
Highly complementary businesses with a strong fit and compelling product, geography and client-mix
All-cash offer, fully financed with Safran’s existing cash on-hand
Accretive from year one with operating synergies

FY 2010 Earnings - February 24, 2011
49
L-1: A complementary technology approach
L-1 adds a suite of best of breed technologies that would enhance Safran’s (Morpho) own technology and product offering across a broad range of IDmanagement and Homeland Security applications
Main owned technologies
Ø AFIS software •Ø Secured printing •Ø Smart cards •Ø Explosive detection •
Ø Multimodal biometric platform •Ø Iris recognition •Ø Facial recognition •Ø Livescan and multi-biometric acquisition devices •
This will create a pool of technologies to enhance further security for state and local governments, aviation and other critical infrastructure

FY 2010 Earnings - February 24, 2011
50
L-1: Yielding significant operating synergies
Value creation drivers
Operating synergies
Cost synergies at different levels:Rationalisation of sitesInternational salesR&DOther support and operations
Safran will obtain hardware / software internally (rather than from 3rd parties) for Biometric equipment and blank documents for Secure Credentialing
Run-rate synergies expected to be fully
realized within 18 months from the
effective closing of the transaction
Approximately $30 M run-rate and not including likely top-line commercial synergies
Estimatedimpact ($M)
Sourcing synergies

FY 2010 Earnings - February 24, 2011
51
* Source : Ascend
Aerospace
79%
21%
1st CFM56 generation (-2, -3, -5A, -5C)
Dec. 31, 2009468 aircraft
2nd CFM56 generation (-5B, -7)
91%
9%
Dec. 31, 2010428 aircraft
Number of grounded planes powered by CFM56 engines Grounded CFM-equipped aircraft
represent 4% of the total CFM fleet
vs. 11% for the total active aircraft market*
A majority of B737NG returned to traffic
Some 2nd generation CFM A320 were back to lessors
40 CFM56 powered aircraft returned to service in FY 2010

FY 2010 Earnings - February 24, 2011
52
Global CFM spares revenue in $: -17% in 2010 vs. 2009Q4 flat vs. Q4 2009, but up 15% vs. Q3 2010
Airlines consume their inventory, delay shop visits & decrease scope of overhauls - optimizing their engine fleet
40 CFM56 powered aircraft returned to service
46% of CFM active fleet still to have their first shop visit (>67% of the 2nd generation engines)= 9,500 engines
Aerospace - CFM aftermarket
FY 2009
2,305
FY 2010CFM56 shop visits
(total worldwide)2,120
47%53% 52% 48%
Total -8.0%1st gen. CFM56 -8.4%2nd gen. CFM56 -7.6%
Shop visit numbers are estimates; these can be revised marginally as airlines finalise reports
1st gen. 1st gen.2nd gen. 2nd gen.
Improving CFM aftermarket

FY 2010 Earnings - February 24, 2011
53
Aircraft Equipment shipset
$4.5MPPPA350XWB
$5MPPPPB787
€7MPPPPA400M
$18-19MPPPA380
Equipmentshipset value
WiringWheelsbrakesMain LGNose LGNacelles

FY 2010 Earnings - February 24, 2011
54
Income taxAdjusted accounts
(in € millions)Profit (loss) before tax 523 706
Standard tax rate applicable to the parent company 34,43% 34,43%
Tax (expense) benefit at standard rate (180) (243)
Impact of permanent differences 6 (7)
Impact of research tax credit 34 46
Impact of reduced tax rates 15 30
Impact of unrecognized taxes (3) 16
Impact of tax adjustments 9 (16)
Impact of tax credits and other items 11 1
Current income tax benefit (expense) recognized in profit or loss (108) (173)
Effective taxe rate 20,66% 24,50%
31.12.2009 31.12.2010