fy 2011 results analyst briefing - telekom … · this presentation may not be copied or otherwise...
TRANSCRIPT

FY 2011 RESULTS
ANALYST BRIEFING
24 February 2012

This presentation is not and does not constitute an offer, invitation, solicitation or recommendation to subscribe for, or purchase, any securities
and neither this presentation nor anything contained in it shall form the basis of, or be relied on in connection with any contract or commitment or
investment decision.
This presentation has been prepared solely for use at this presentation. By your continued attendance at this presentation, you are deemed to
have agreed and confirmed to Telekom Malaysia Berhad (the “Company”) that: (a) you agree not to trade in any securities of the Company or its
respective affiliates until the public disclosure of the information contained herein; and (b) you agree to maintain absolute confidentiality
regarding the information disclosed in this presentation until the public disclosure of such information, or unless you have been otherwise
notified by the Company.
Reliance should not be placed on the information or opinions contained in this presentation or on its completeness. This presentation does not
take into consideration the investment objectives, financial situation or particular needs of any particular investor.
No representation or warranty, express or implied, is made as to the fairness, accuracy, completeness or correctness of the
information, opinions and conclusions contained in this presentation. None of the Company and its affiliates and related bodies corporate, and
their respective officers, directors, employees and agents disclaim any liability (including, without limitation, any liability arising from fault or
negligence) for any loss arising from any use of this presentation or its contents or otherwise arising in connection with it.
This presentation contains projections and “forward-looking statements” relating to the Company’s business and the sectors in which the
Company operates. These forward-looking statements include statements relating to the Company’s performance. These statements reflect the
current views of the Company with respect to future events and are subject to certain risks, uncertainties and assumptions. It is important to note
that actual results could differ materially from those anticipated in these forward looking statements. The Company does not undertake to inform
you of any matters or information which may come to light or be brought to the Company’s attention after the date hereof.
The forecasts and other forward-looking statements set out in this presentation are based on a number of estimates and assumptions that are
subject to business, economic and competitive uncertainties and contingencies, with respect to future business decisions, which are subject to
change and in many cases outside the control of the Company. The directors and officers of the Company believe that they have prepared the
forecasts with due care and attention and consider all best estimates and assumptions when taken as a whole to be reasonable at the time of
preparing the presentation. However, the Company’s forecasts presented in this presentation may vary from actual financial results, and these
variations may be material and, accordingly, neither the Company nor its directors or officers can give any assurance that the forecast
performance in the forecasts or any forward-looking statement contained in this presentation will be achieved. Details of the forecasts and the
assumptions on which they are based are set out in the presentation.
This presentation may not be copied or otherwise reproduced without the written consent of TM.
Disclaimer

Performance Overview
Financial review
Operating highlights
Concluding remarks
3

Key Highlights FY 2011 Achieved all Headline KPI’s for 2nd year
4
• Revenue growth of 4.1% vs. FY2010 to RM9.15bn
• Normalised EBITDA Margin at 33.5%
• Customer Satisfaction Measure 70
FY2011Headline KPI
FY2011 Achievement
2.5%
32%
4.1%
33.5%
>70
Broadband leadership continues:• Total customer base of over 1.9mn
•Over 230,000 Unifi customers activated, takeup rate >20%
• Internet & Multimedia Revenue grew >20% in FY2011• BAU Capex/Revenue improved to 12.4% compared to 12.8% last year
• Achieved 1.16mn premises passed with FY2011 HSBB Capex of RM1.4bn, lower than budgeted
• Final single-tier dividend of 9.8 sen per share•Proposed capital repayment of 30 sen per share via capital reduction

Key Operating Indicators
Key Highlights 4Q 2011
Financial Performance
Positive growth across the boardQoQ and YoY
4Q11 vs3Q11
5
Operating revenue grew by 5.4% QoQ and 5.5% YoY to RM2,447.2mn
- Revenue led by Internet & Multimedia, at 4.2% growth QoQ and
23.8% growth YoY
Normalised EBITDA up 0.6% QoQ and 1.5% YoY to RM808.1mn
Normalised PATAMI up 74.9% QoQ and 0.7% YoY to RM240.1mn
Broadband subscribership grew 2.8% QoQ and 12.3% YoY to 1.92mn customers.
TM Wifi hotspot zones increased by 14.4% QoQ and 80.3% YoY, to 19,799 sites
4Q11 vs4Q10

1.1
4.2
12.4
60.1%
10.6%
1.11.21.4
Cash Balance (RM bn) 2.1 3.5 3.5
2008
Capital Expenditure, excluding HSBB(RM bn)
Our capital management approach is guided by two major principles :
Striving to optimize capital productivity and ROIC
Creating shareholder value with strong commitment to dividend policy
1 TRS: Source Bloomberg2 After interim dividend paid in September 2011 (RM351mn), and final gross dividend 2010 & capital distribution paid in June 2011 (RM1,037.4mn)3 Normalised EBIT / Total Revenue
16.7 14.1
2009 2010
12.8
Focus on Shareholder Value CreationGrowing enterprise value through improving return on capital
1Total Return to Shareholder (TRS)
7.7% 42.9% 24.0%
EBIT Margin 10.8%10.9% 10.6%3
Capex / Revenue ratio( %)
6
FY2011
2

Performance Overview
Financial review
Operating highlights
Concluding remarks
7

Note: EBITDA Margin is calculated as percentage of EBITDA against Revenue + Other Operating IncomeFor Normalised EBITDA and Normalised PATAMI refer Slides 10 & 11
•Excludes FX (Gain )/Loss
RMmn
ReportedComments
(FY11 vs FY10)4Q11 3Q11
% Change QoQ
4Q10% Change
YoYFY11 FY10
% ChangeFY11 vs
FY10
Revenue 2,447.2 2,321.7 +5.4 2,320.6 +5.5 9,150.7 8,791.0 +4.1Higher Internet & Multimedia and Others revenue
Other Operating Income
37.0 27.8 +33.1 52.7 -29.8 120.9 152.9 -20.9 -
EBITDA 796.1 812.5 -2.0 758.6 +4.9 3,086.4 2,924.3 +5.5Higher revenue and lower operating cost
EBITDA margin 32.0% 34.6% -2.6pp 32.0% 0.0pp 33.3% 32.7% +0.6pp -
Normalised EBITDA 808.1 803.3 +0.6 795.9 +1.5 3,108.4 2,958.5 +5.1 -
Normalised EBITDA Margin
32.5% 34.2% -1.7pp 33.5% -1.0pp 33.5% 33.1% +0.4pp -
Depn & Amort. 535.9 580.7 -7.7 565.7 -5.3 2,128.0 1,995.8 +6.6Higher asset base and provisionfor asset write-off
Other Gains 5.5 278.3 -98.0 215.4 -97.4 286.5 373.3 -23.3 -
Net Finance Cost* 50.6 50.9 -0.6 57.9 -12.6 185.2 245.2 -24.5Better yield income and lower interest expense
FX (Gain) / Loss (14.4) 122.5 +111.8 15.8 +191.1 58.6 (303.7) -119.3USD strengthened vs. RM by 3.5%
Profit Before Tax 229.6 337.2 -31.9 334.8 -31.4 1,001.2 1,360.2 -26.4 -
PATAMI 598.3 302.2 +98.0 400.7 +49.3 1,191.0 1,206.5 -1.3Unrealised forex loss on USD debts nett of last mile tax incentive
Normalised PATAMI 240.1 137.3 +74.9 238.4 +0.7 634.8 563.7 +12.6 -
Group Results 4Q11 & FY2011
8

In RM mn 4Q11 3Q11 4Q10 FY11 FY10
Reported EBITDA 796.1 812.5 758.6 3,086.4 2,924.3
Non Operational
ESOS (Income) - net - - - - (5.0)
Loss on Sale of Assets 0.3 0.2 1.0 1.3 2.1
FX (Gain)/Loss on International trade Settlement
12.9 (9.4) 20.9 21.9 21.7
AFS Impairment/(Write back) – Receivables (1.2) - 15.4 (1.2) 15.4
Normalised EBITDA 808.1 803.3 795.9 3,108.4 2,958.5
Normalised EBITDA Margin 32.5% 34.2% 33.5% 33.5% 33.1%
Reported EBITDA Margin 32.0% 34.6% 32.0% 33.3% 32.7%
Normalised EBITDA
EBITDA is calculated as Total Revenue (Operating Revenue + Oth. Operating Income) less Operating Cost (Exc. Depreciation, Amortisation & Impairment).EBITDA Margin is calculated as percentage of EBITDA against Total Revenue
9
Improving margins due to higher operating revenue

In RM mn 4Q11 3Q11 4Q10 FY11 FY10
Reported PATAMI 598.3 302.2 400.7 1,191.0 1,206.5
Non Operational
ESOS (Income) - net - - - - (5.0)
FX (Gain)/Loss on International trade settlement
12.9 (9.4) 20.9 21.9 21.7
(Gain)/Loss on Sale of Assets and Investments* (5.2) (278.1) (214.4) (285.2) (371.2)
Unrealised FX (Gain)/Loss on Long Term loans (14.5) 122.6 15.8 58.5 (303.7)
Impairment of AFS receivables (1.2) - 15.4 (1.2) 15.4
Last Mile Tax Incentives for prior years (350.2) - - (350.2) -
Normalised PATAMI 240.1 137.3 238.4 634.8 563.7
Normalised PATAMI
* Comprise fair value (FV) changes of FVTPL (FV through P&L) investment and gain/loss on disposal for AFS (available for sale) investments, mainly due to disposal of Axiata shares (2010: Axiata & Measat)
10

22.3 23.0
20.4 18.0
18.9 19.8
11.6 11.3
5.6 6.3
5.7 6.1
4.3 4.40.7 0.8
FY10 FY11
Bad Debt
Marketing Expenses
Supplies & material
Maintenance Cost
Other operating cost
Manpower cost
Direct cost
Dep & Amortisation
Revenue = Operating Revenue + Other Operating Income
Cost % of Revenue1
Note: The classification of cost is as per financial reporting
(Please refer to Appendix for quarterly details & breakdown)
Cost/revenue ratios maintained YoY
1
11
RM mnRM mn
Total Cost / Revenue ( %)
RM8,015.4
89.6%
RM8,313.2
89.7%
FY 2011 vs. FY 2010•Higher Depreciation & Amortisationmainly due to higher asset base, provision for asset write-off nett of change of useful life impact
•Lower Direct Cost mainly due to lower domestic interconnect and international outpayment
•Higher Manpower cost mainly due to higher staff benefits
•Higher Maintenance Cost mainly due to NGN, new IP core maintenance contracts and equipment rental
•Higher Marketing Expenses mainly due to higher commissions in line with Unifi growth
% of Revenue

1,102 1,060
838 976
772 527
0
500
1,000
1,500
2,000
2,500
3,000
FY10 FY11
Access Core Network Support System*
511 401
308343
309 395
0
200
400
600
800
1000
1200
FY10 FY11Access Core Network Support System*
591 659
530633
463 132
0
200
400
600
800
1000
1200
1400
1600
1800
FY10 FY11
Access Core Network Support System*
Group Capital Expenditure
** Gross capex to be shared with Government equally1H2010 capex has been restated to include IPTV
Note: Government coinvestment treated as deferred income, to be amortisedprogressively to match against the depreciation of assets
*Include Application, Support System &Others (building, land improvement, moveable plants,application & other assets)
Capex/Revenue ratios continued to improve
12
Total Capex
HSBB Capex**
Note : BAU – Business As Usual
RM mn
2,712
1,584
30.8
BAU Capex
1,128
12.8
Capex / Revenue ( %)
1,424
1,139
12.4
2,563
28.0
15.618.0

30 June 11 31 Dec 10 30 June 11 31 Dec 10Return on Invested Capital 6.10% 6.03% Gross Debt to EBITDA 1.93 2.09
Return on Equity 8.65% 7.67% Net Debt/EBITDA 0.69 0.90
Return on Assets 4.65% 4.73% Gross Debt/ Equity 0.92 0.72
Current Ratio 1.65 1.62 Net Debt/ Equity 0.32 0.27
WACC 6.33% 6.58% Net Assets/Share (sen) 194.8 216.1
2
2 Based on Normalised PATAMI, comparative for Dec’10 is amended to be consistent with current year computation
31 Dec 11
Group Cash Flow & Key Financial Ratios
31 Dec 10
RM mn FY11 FY10
Cash & cash equivalent at start 3.488.0 3,490.2
Cashflows from operating activities 3,030.7 2,973.4
Cashflows from / (used-in) investing activities (1,338.0) (1,446.9)
Capex* 1,808.5 2,198.9
Cashflows from financing activities (962.5) (1,534.2)
Effect of exchange rate changes (5.6) 5.5
Cash & cash equivalent at end 4,212.6 3,488.0
Free cash-flow (EBITDA – Capex) 1,277.9 725.4
•net of HSBB grant received from Government (FY11 – RM754.5mn, FY10 - RM513.1mn)
Strong Balance Sheet to support futurebusiness requirements
1
Based on Normalised EBIT1
1
13
31 Dec 1031 Dec 11

Performance Overview
Financial review
Operating highlights
Concluding remarks
14

Voice41%
Data20%
Internet22%
Others17%
Voice44%
Data20%
Internet19%
Others17%
441 400506
1,521 1,597
4Q10 3Q11 4Q11 FY10 FY11
437519 541
1,653 2,001
4Q10 3Q11 4Q11 FY10 FY11
490 456 4831,754 1,819
4Q10 3Q11 4Q11 FY10 FY11
953 947 9173,863 3,734
4Q10 3Q11 4Q11 FY10 FY11
Group Total Revenue by Product
15
Data
RM mn
RM mn RM mn
Voice
Others
InternetFY11
FY10
RM mnRM mn
RM mn
RM9,151mn
RM8,791mn
-3.2%
-3.8% -3.3%
+4.2%
+23.8% +21.1%
+5.9%
-1.4% +3.7%
+26.5%
+14.7% +5.0%
Revenue growth driven by Internet, YoY growth >20%

Retail77%
Global10%
Wholesale9%
Others4%
115 98 93
338 343
4Q10 3Q11 4Q11 FY10 FY11
276215 256
915 845
4Q10 3Q11 4Q11 FY10 FY11
193 191 201
755 770
4Q10 3Q11 4Q11 FY10 FY11
585 629 639 2,264 2,459446 458 473
1,772 1,838358 370 368
1,4311,462
347 361 417
1,3161,433
4Q10 3Q11 4Q11 FY10 FY11
Consumer SME Enterprise Government
Retail79%
Global9%
Wholesale8%
Others4%
Group Total Revenue by Line of Business
16
FY11
FY10
RM9,151mn
RM8,791mn
* Others comprise revenue from Property Development, TM R&D, TMIM, UTSB and MKL
Retail Wholesale
RM mn
RM mnRM mn
RM mn
1,8971,8171,736
Note: Due to lower bandwidth sales
Global Others*
+19.1%
-7.2% -7.7%
6,7837,192
-5.1%
-19.1% +1.5%
+4.4%
+9.3% +6.0%
+5.2%
+4.1% +2.0%
Retail contribution to group revenue increases, led by Consumer & Govt

Net adds (in thousand)
1,212 1,261 1,311 1,393 1,417 1,425 1,393 1,374
273 280 285 287 291 296 314 3124 14 33 64 109 164 237
-
400
800
1,200
1,600
2,000
2,400
1Q10 2Q10 3Q10 4Q10 1Q11 2Q11 3Q11 4Q11
Residential Business UniFi
2,763 2,775 2,794 2,799 2,710 2,692 2,633 2,566
1,553 1,558 1,533 1,535 1,607 1,596 1,568 1,546
4 14 33 64 109 164 237
0
1,000
2,000
3,000
4,000
5,000
1Q10 2Q10 3Q10 4Q10 1Q11 2Q11 3Q11 4Q11Residential Business UniFi
In thousand
In thousand
-0.4%
+12.3%
-0.4%
1,485
+2.8%
4,316
Physical Highlights
Broadband Customer Growth
Fixed Line Customer Growth
WiFi Hotspot Zones
+80.3%
+14.4%
*Call Usage Only ** Streamyx Gross ARPU only ^ Streamyx Net ARPU
1,545
+60
4,337 4,341
+65
1,610
+103
1,713
4,367
Note: inclusive of NBI initiative
17
Broadband growth driven by Unifi
+59
1,772
4,381
ARPU (RM) 1Q10 2Q10 3Q10 4Q10 1Q11 2Q11 3Q11 4Q11
Fixed Line (DEL)* 35 35 35 34 33 34 34 34
Streamyx Broadband** 82 81 77 78 77^ 77^ 78^ 78^
1,830
+58
4,397
1,871
+41
4,365 4,349
+52
1,923
2,245 2,533 2,432
10,982 13,251 16,111 17,313 19,799
1Q10 2Q10 3Q10 4Q10 1Q11 2Q11 3Q11 4Q11

3,60312,456
28,771 55,15693,107
139,896 201,842
448
1,445
4,1258,385
15,912
24,47934,659
2Q10 3Q10 4Q10 1Q11 2Q11 3Q11 4Q11
Residential Business
UniFi – leading & shaping the future
18
UniFi update as at 22 February 2012
Delivered 1,179,000 premises passed covering 79 exchanges
HSBB ARPU as at 31 Dec 2011 is RM184
Unifi takeup continues to exceed expectations
Activated more than 283,000 customers - highest in Southeast Asia, Top 10 in Asia Pacific (source: FTTH Council Asia Pacific)
4,051
13,901
32,89663,541
+43.9%
+10
Net adds (in thousand)
109,019
+19 +31 +45
+618.9%
164,375
+55 +72
236,501
Signed HSBB Services Agreement with with 11 property developers to deploy HSBB network infrastructure and services to new housing developments
ARPU (RM) 1Q11 2Q11 3Q11 4Q11
Unifi (Blended) 188 186 184 184

Performance Overview
Financial review
Operating highlights
Concluding remarks
19

Key Takeaways
Financial Performance
Focus on Excellence
Shareholder Value
Broadband Champion
Customer-centricity
Achievement of all Headline KPIsRevenue growth of 4.1% vs. FY2010; KPI: 2.5% growthNormalised EBITDA margin of 33.5%; KPI: 32%• Internet & Multimedia revenue as main driver• Continuous focus on profitability and cost
Achievement of new Headline KPITRI*M index score of >70; KPI: 70• Strong commitment to delivering enhanced customer experience and quality improvement programmes
Continued operational improvementsHigher operating revenue, capex efficiency and better EBITDA marginHSBB rollout targets achieved – 1.16mn premises passed;
fastest rollout in region
Malaysia’s broadband champion1.92mn total broadband (Streamyx and Unifi) customersUnifi takeup rate at >20% (over 236,000 customers)• wider coverage, increased installation efficiencyHSBB a global success story
20
Commitment to create shareholder value• Total dividend payout of RM700mn (including interim dividend of RM350.6mn paid in September 2011)•Capital repayment of 30 sen per share by way of capital reduction totalling RM1.073bn
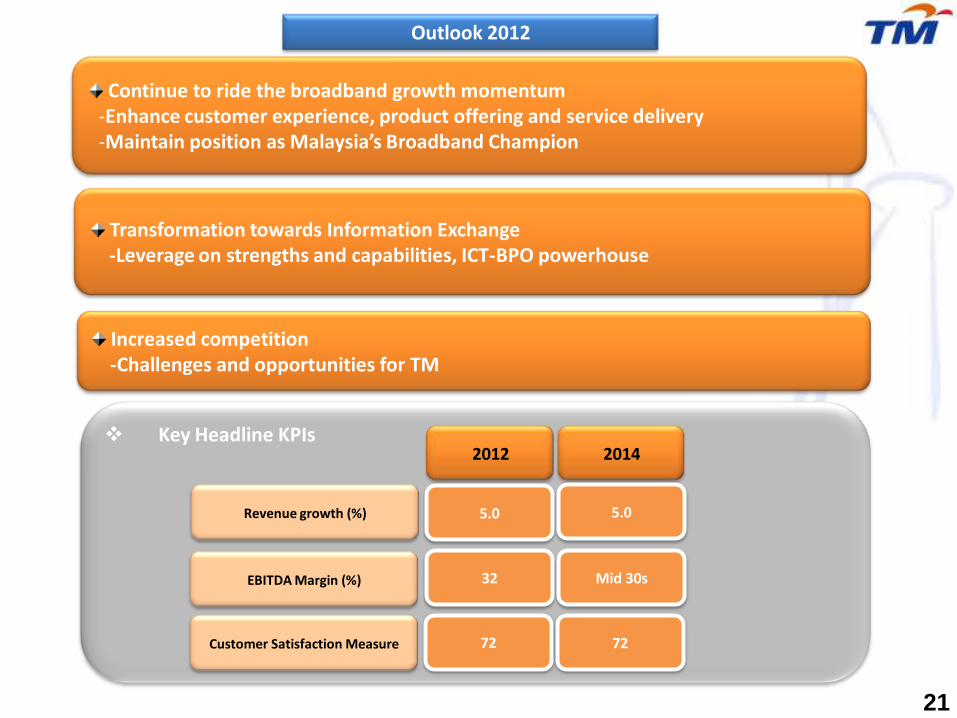
21
Increased competition-Challenges and opportunities for TM
Outlook 2012
Transformation towards Information Exchange-Leverage on strengths and capabilities, ICT-BPO powerhouse
Key Headline KPIs2012 2014
Revenue growth (%)
EBITDA Margin (%)
Customer Satisfaction Measure
5.0 5.0
32 Mid 30s
72 72
Continue to ride the broadband growth momentum-Enhance customer experience, product offering and service delivery-Maintain position as Malaysia’s Broadband Champion

Appendices

4Q11 3Q11 4Q10 FY11 FY10 FY11 vs FY10
Operating Revenue (RM mil) 2,447.2 2,321.7 2,320.6 9,150.7 8,791.0 -
Other Operating Income(RM mil)
37.0 27.8 52.7 120.9 152.9 -
Direct Costs % 16.8 18.0 19.4 18.0 20.4 Lower interconnect and international outpaymentRM mil. 417.3 423.4 460.1 1,665.9 1,825.4
Manpower % 19.1 19.5 20.9 19.8 18.9 Higher staff benefits, higher welfarefund paymentsRM mil. 475.4 458.3 497.2 1,838.4 1,692.9
Supplies & Materials % 6.7 5.9 7.4 6.1 5.7 Higher customer acquisition cost, customer projects and cable costRM mil. 165.9 139.5 176.0 570.1 514.1
Bad & Doubtful Debts % 0.8 0.3 0.8 0.8 0.7Higher trade bad debt at Consumer
RM mil. 19.8 6.8 18.3 72.8 66.9
Marketing Expenses % 5.2 4.7 3.7 4.4 4.3Higher commissions, lower A&P
RM mil. 129.7 109.7 87.8 407.7 385.7
Maintenance Cost % 7.4 6.9 5.1 6.3 5.6 Higher maintenance cost for NGN, new IP core maintance contracts, equipment rentalRM mil. 184.8 162.4 121.4 587.0 498.9
Other Operating Costs % 11.9 10.1 10.7 11.3 11.6
Lower building rentalRM mil. 295.2 236.9 253.9 1,043.3 1,035.7
Depreciation & Amortisation % 21.6 24.7 23.8 23.0 22.3 Higher asset base, new asset additions and asset impairmentRM mil. 535.9 580.7 565.7 2,128.0 1,995.8
Total (RM mil) 2,224.0 2,117.7 2,180.4 8,313.2 8,015.4 -
Total (%) 89.5 90.1 91.9 89.7 89.6 -
Cost % of Revenue
23

6,968.8
162.9
10,053.9
6,402.7
1,559.6
2,072.7
18.9
17,185.6
6,925.6
1,444.6
506.8
4,213.0
761.2
4,186.2
3,552.1
7.7
626.4
2,739.4
13,613.0
833.2
17,185.6
7,709.4
150.8
8,630.3
5,506.0
1,664.2
1,432.1
28.0
16,490.5
6,938.5
1,801.5
527.8
3,488.5
1,120.7
4,289.5
3,639.2
26.0
624.3
2,649.0
13,112.1
729.4
16,490.5
Shareholders’ Funds
Non-Controlling Interests
Deferred & Long Term Liabilities
Long Term Borrowings
Deferred Tax
Deferred Income
Derivative financial liabilities
Current Assets
Trade Receivables
Other Receivables
Cash & Bank Balances
Others
Current Liabilities
Trade and Other Payables
Short Term Borrowings
Others
Net Current Assets
Property Plant & Equipment
Other Non-Current Assets
RM MillionAs at 31 Dec 2011 As at 31 Dec 2010
Group Balance Sheet
24

3,177 3,081
871 982
1,637 1,982
1,4541,589
0
1,000
2,000
3,000
4,000
5,000
6,000
7,000
8,000
FY10 FY11
OthersInternetDataVoice
787 775 752
215 266 230
431514 535
394374 520
0
600
1200
1800
2400
4Q10 3Q11 4Q11
Others
Internet
Data
Voice
Consumer33%
SME26%
Enterprise21%
Government20%
Consumer34%
SME26%
Enterprise20%
Government20%
Total Revenue By Products
RM mn +4.4%
1,736
FY11
+9.3%
RETAIL
Revenue by ProductRevenue by Business Unit
FY10
Note: Total revenue is after inter-co elimination. Revenue of product is before inter-co elimination
RM mn
RM mn
RM7,192mn
RM6,783mn
25
RM mn +6.0%
6,7837,192
1,8171,897

256 224
566 597
65 85
0
200
400
600
800
1000
FY10 FY11
Others
Data
Voice
58 54 54
154 151 155
23 22 23
0
50
100
150
200
250
4Q10 3Q11 4Q11
Others
Data
Voice
ASP17%
MC83%
ASP16%
MC84%
MC : Malaysian CarrierASP : Application Service Provider
Others : Include internet
WHOLESALE
FY11
FY10
Note: Total revenue is after inter-co elimination. Revenue of product is before inter-co elimination 26
RM mn +2.0%
755 770
Revenue by ProductRevenue by Customer Segment
RM mn +5.2%
193
+4.1%
191 201

446 478
82 70
411 344
288
0
200
400
600
800
1000
1200
FY10 FY11
Others
Data
IRU Sales (Data)
Voice
111143 126
82 10 56
86
66
104
5
2
2
0
50
100
150
200
250
300
350
4Q10 3Q11 4Q11
Others
Data
IRU Sales (Data)
Voice
Africa & Middle East
6%America
13%
Europe10%
South Asia34%
North Asia17%
Oceania10%
Others10%
Africa & Middle East
9%
America7%
Europe11%
South Asia38%
North Asia14%
Oceania7%
Others14%
FY11
FY10
Others : Include internet
GLOBAL
Note: Total revenue is after inter-co elimination. Revenue of product is before inter-co elimination27
Revenue by RegionRevenue by Product
RM mn -7.7%
915845
RM mn +19.1%
276
-7.2%
215
256

THANK YOUAny queries please email to : [email protected]
•Investor Relations• Level 11 (South Wing)•Menara TM •JlnPantaiBharu •50672 Kuala Lumpur, Malaysia • Tel (603) 2240 4848/ 7366 / 7388