fy 2013-2017 a projection of city and school system · pdf file · 2016-01-26fy...
TRANSCRIPT

FY 2013-2017 A Projection of City and School System Finances

Agenda • Forecast Presentation
• Economy
• Current Formula Revenues
• School Forecast
• City Forecast
• Conclusion and Threats
• Ways to Modify the Forecast • Voting Software
2

Economy
3

Consumer Price Index
4
-1.0%
-0.5%
0.0%
0.5%
1.0%
1.5%
2.0%
2.5%
3.0%
3.5%
4.0%
4.5%
2002 2003 2004 2005 2006 2007 2008 2009 2010 2011 Proj
2012 Proj All Items Core CPI
Sources: Actual data from Bureau of Economic Analysis; Projections from Mesirow Financial Themes on the Economy
Projected

Consumer Confidence
90
50
0
20
40
60
80
100
120
140
160
Jul-9
9
Feb-
00
Sep
-00
Apr
-01
Nov
-01
Jun-
02
Jan-
03
Aug
-03
Mar
-04
Oct
-04
May
-05
Dec
-05
Jul-0
6
Feb-
07
Sep
-07
Apr
-08
Nov
-08
Jun-
09
Jan-
10
Aug
-10
Mar
-11
Oct
-11
Source: The Conference Board
5

Unemployment Rates
6
0.0%
2.0%
4.0%
6.0%
8.0%
10.0%
12.0%
2001 2002 2003 2004 2005 2006 2007 2008 2009 2010 2011 2012 2013 2014 2015 2016 2017 Calendar Year
Virginia Beach Hampton Roads Virginia United States Source: Bureau of Labor Statistics and the Congressional Budget Office

Virginia Beach Defense Spending
7
$0.0
$2.0
$4.0
$6.0
$8.0
$10.0
$12.0
$14.0
$16.0
2008 2009 2010 2011 2012 2013 2014 2015 2016 2017
Billi
ons
Fiscal Year
Projected

-10.0%
-5.0%
0.0%
5.0%
10.0%
15.0%
20.0%
25.0%
1984
1987
1990
1993
1996
1999
2002
2005
2008
2011
2014
2017
Fiscal Year
Real Estate Assessments
Six straight years of declining real estate values, a drop of 23.6% from 2010 to 2015
8

Economic Summary
• Unemployment remains high
• High business profits, but not hiring
• Inflation is rising
• Consumer confidence is unpredictable
• Stock market volatile
• Housing still declining
• Borrowing is tight
• Uncertainty 9

Formula Revenues These revenues are currently shared 51.3% to School System and 48.7% to the City
10

Real Estate Revenue
11
$300.0
$350.0
$400.0
$450.0
$500.0
$550.0
2008 2009 2010 2011 2012 2013 2014 2015 2016 2017
Mill
ions
Fiscal Year Real Estate - General Fund Delinquencies & Interest on Delinquent TIF's & SSD's Public Service
Projected
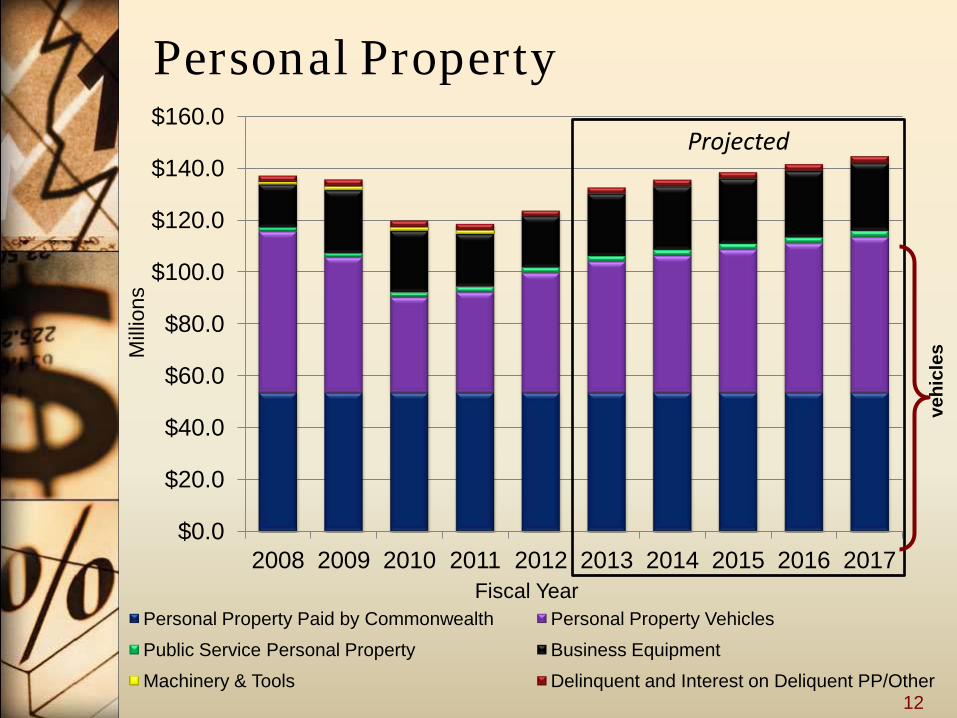
Personal Property
$0.0
$20.0
$40.0
$60.0
$80.0
$100.0
$120.0
$140.0
$160.0
2008 2009 2010 2011 2012 2013 2014 2015 2016 2017
Mill
ions
Fiscal Year Personal Property Paid by Commonwealth Personal Property Vehicles Public Service Personal Property Business Equipment Machinery & Tools Delinquent and Interest on Deliquent PP/Other
Projected
12
vehi
cles

General Sales Tax
$40.0
$44.0
$48.0
$52.0
$56.0
$60.0
$64.0
$68.0
2008 2009 2010 2011 2012 2013 2014 2015 2016 2017
Mill
ions
Fiscal Year
13

Utility Taxes (includes VA Telecommunications but not E911)
$10.0
$15.0
$20.0
$25.0
$30.0
$35.0
$40.0
2008 2009 2010 2011 2012 2013 2014 2015 2016 2017
Mill
ions
Fiscal Year
14

Business License Tax
$20.0
$25.0
$30.0
$35.0
$40.0
$45.0
$50.0
$55.0
$60.0
$65.0
2008 2009 2010 2011 2012 2013 2014 2015 2016 2017
Mill
ions
Fiscal Year
15

Cable Franchise Tax
$0.0
$2.0
$4.0
$6.0
$8.0
$10.0
$12.0
2008 2009 2010 2011 2012 2013 2014 2015 2016 2017
Mill
ions
Fiscal Year 16

School Forecast
17

Local Support Current Formula
$200.0
$240.0
$280.0
$320.0
$360.0
$400.0
$440.0
2008 2009 2010 2011 2012 2013 2014 2015 2016 2017
Mill
ions
Fiscal Year
Projected
18

Local Composite Index
0.3
0.35
0.4
0.45
2008 2009 2010 2011 2012 Fiscal Year
Virginia Beach State Average 19

Federal & State Revenue
$0.0
$50.0
$100.0
$150.0
$200.0
$250.0
$300.0
$350.0
$400.0
$450.0
2008 2009 2010 2011 2012 2013 2014 2015 2016 2017
Mill
ions
Fiscal Year
State Federal
Projected
20

Fees and Charges
$0.0
$10.0
$20.0
$30.0
$40.0
2008 2009 2010 2011 2012 2013 2014 2015 2016 2017
Mill
ions
Fiscal Year
21

Student Enrollment
60,000
64,000
68,000
72,000
76,000
80,000
School Year
22

School Salaries
$450.0
$470.0
$490.0
$510.0
$530.0
$550.0
2008 2009 2010 2011 2012 2013 2014 2015 2016 2017
Mill
ions
Fiscal Year
23

School VRS Rate
0.0%
6.0%
12.0%
18.0%
24.0%
30.0%
2008 2009 2010 2011 2012 2013 2014 2015 2016 2017 Fiscal Year
Projected
24

Health Insurance Costs and Percentage of Full-Time Salaries
25
$-
$20
$40
$60
$80
$100
$120
2008 2009 2010 2011 2012 2013 2014 2015 2016 2017
Milli
ons
10%
14%
16% 17% 18%
19%

School Operating Expenditures
$0.0
$20.0
$40.0
$60.0
$80.0
$100.0
$120.0
$140.0
$160.0
$180.0
$200.0
2008 2009 2010 2011 2012 2013 2014 2015 2016 2017
Mill
ions
Fiscal Year 26

School Debt Service
27
$35.0
$38.0
$41.0
$44.0
$47.0
$50.0
2008 2009 2010 2011 2012 2013 2014 2015 2016 2017
Mill
ions
Fiscal Year
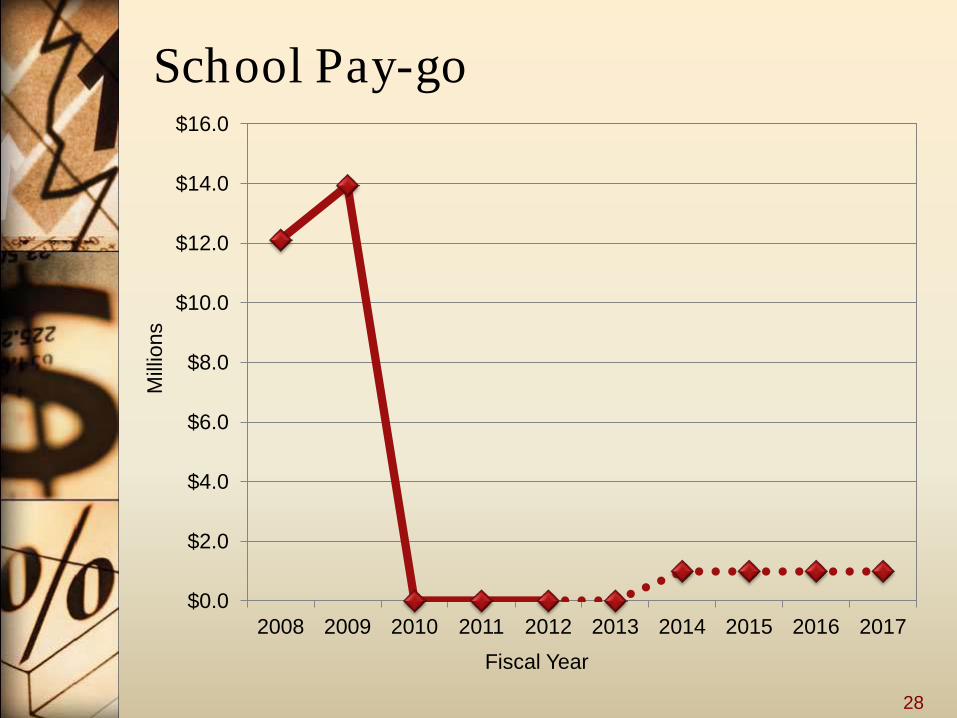
School Pay-go
28
$0.0
$2.0
$4.0
$6.0
$8.0
$10.0
$12.0
$14.0
$16.0
2008 2009 2010 2011 2012 2013 2014 2015 2016 2017
Mill
ions
Fiscal Year
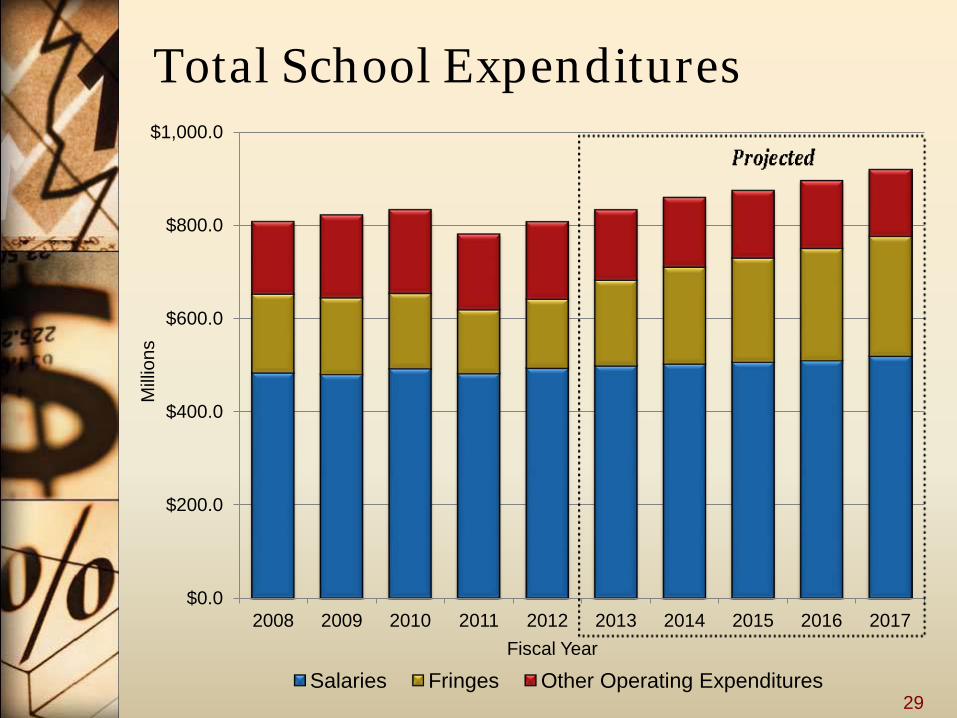
Total School Expenditures
$0.0
$200.0
$400.0
$600.0
$800.0
$1,000.0
2008 2009 2010 2011 2012 2013 2014 2015 2016 2017
Mill
ions
Fiscal Year
Salaries Fringes Other Operating Expenditures 29

School Forecast
$-49.3 m
$-67.8 m
30
$740
$760
$780
$800
$820
$840
$860
$880
$900
$920
$940
$960
2008 2009 2010 2011 2012 2013 2014 2015 2016 2017
Mill
ions
Revenue Expenditure

City Forecast
31

Formula Revenues City Portion
32
$210.0
$260.0
$310.0
$360.0
$410.0
$460.0
2008 2009 2010 2011 2012 2013 2014 2015 2016 2017
Mill
ions
Fiscal Year
Projected
Denotes the $9.2 million in RSF retained by City and replaced with School fund balance.

Automobile License Revenue
$0.0
$2.0
$4.0
$6.0
$8.0
$10.0
$12.0
$14.0
$16.0
2008 2009 2010 2011 2012 2013 2014 2015 2016 2017
Mill
ions
Fiscal Year 33

Cigarette Tax
$0.0
$2.0
$4.0
$6.0
$8.0
$10.0
$12.0
$14.0
$16.0
2008 2009 2010 2011 2012 2013 2014 2015 2016 2017
Mill
ions
Fiscal Year
34
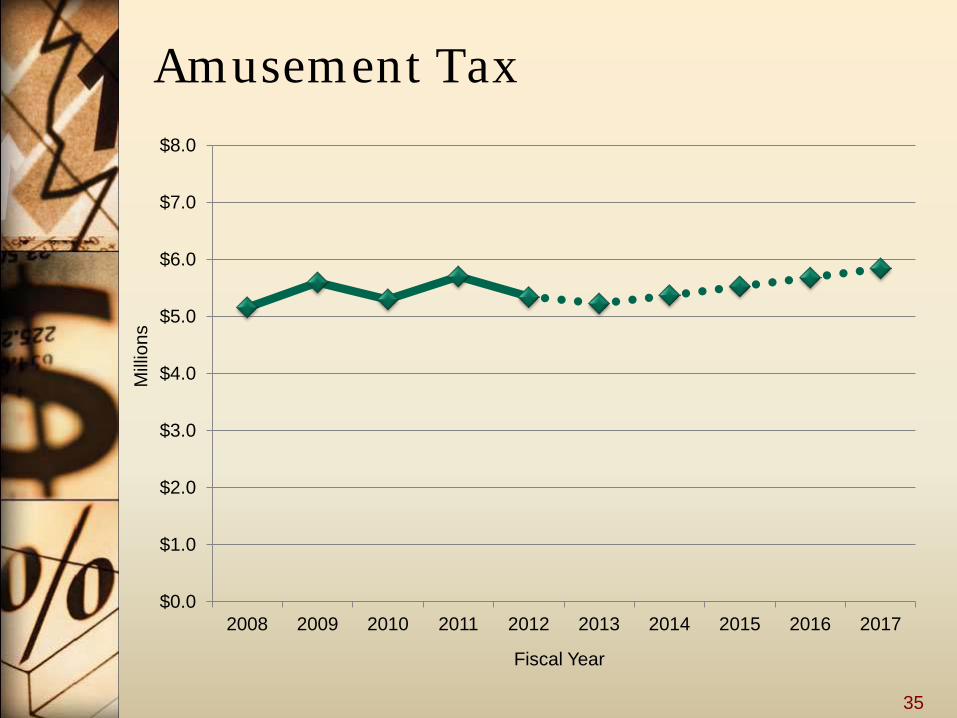
Amusement Tax
$0.0
$1.0
$2.0
$3.0
$4.0
$5.0
$6.0
$7.0
$8.0
2008 2009 2010 2011 2012 2013 2014 2015 2016 2017
Mill
ions
Fiscal Year
35
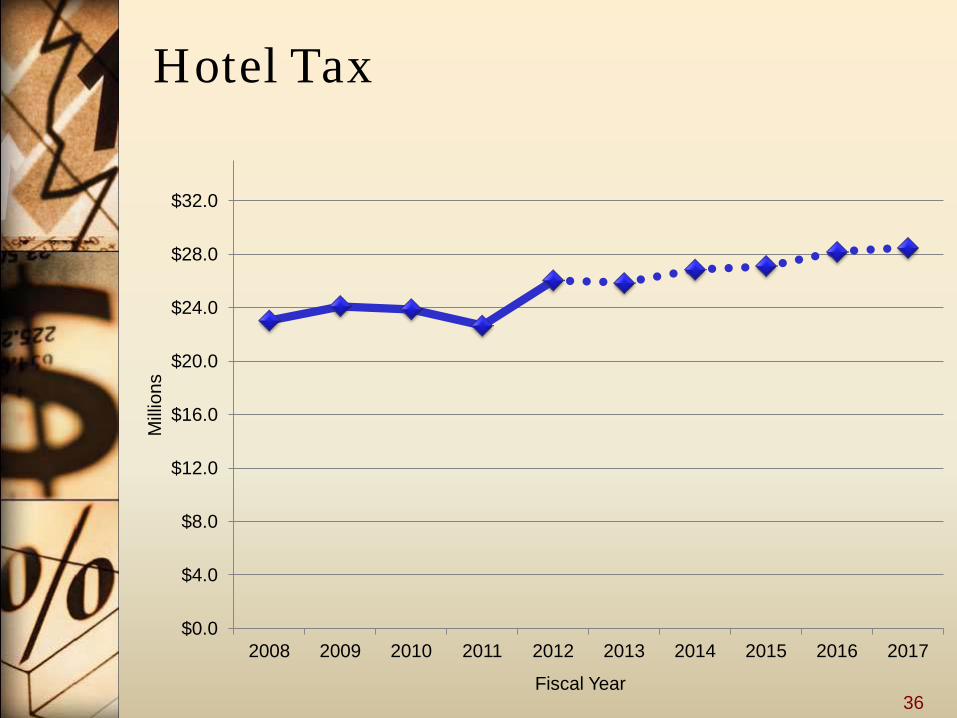
Hotel Tax
$0.0
$4.0
$8.0
$12.0
$16.0
$20.0
$24.0
$28.0
$32.0
2008 2009 2010 2011 2012 2013 2014 2015 2016 2017
Mill
ions
Fiscal Year 36

Restaurant Meals Tax
$0.0
$10.0
$20.0
$30.0
$40.0
$50.0
$60.0
$70.0
$80.0
2008 2009 2010 2011 2012 2013 2014 2015 2016 2017
Mill
ions
Fiscal Year
37

VA Telecommunications – E911
$0.0
$1.0
$2.0
$3.0
$4.0
$5.0
$6.0
$7.0
$8.0
2008 2009 2010 2011 2012 2013 2014 2015 2016 2017
Mill
ions
Fiscal Year
38

Other Local Taxes
$0.0
$2.0
$4.0
$6.0
$8.0
$10.0
$12.0
2008 2009 2010 2011 2012 2013 2014 2015 2016 2017
Mill
ions
Fiscal Year City Tax on Deeds City Tax on Wills Bank Net Capital
Projected
39
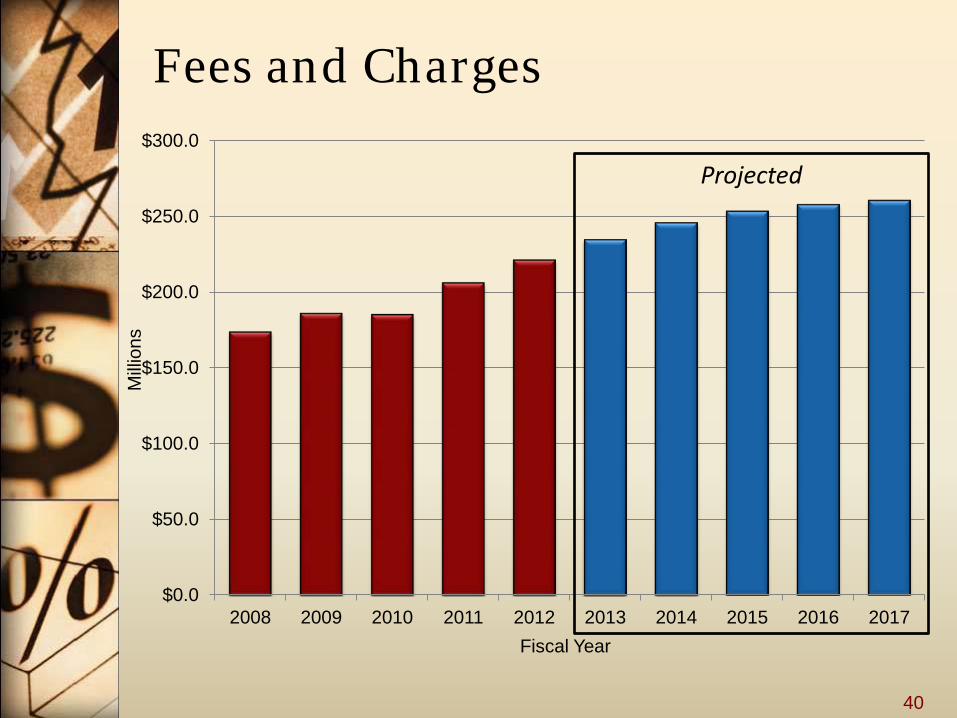
Fees and Charges
$0.0
$50.0
$100.0
$150.0
$200.0
$250.0
$300.0
2008 2009 2010 2011 2012 2013 2014 2015 2016 2017
Mill
ions
Fiscal Year
Projected
40
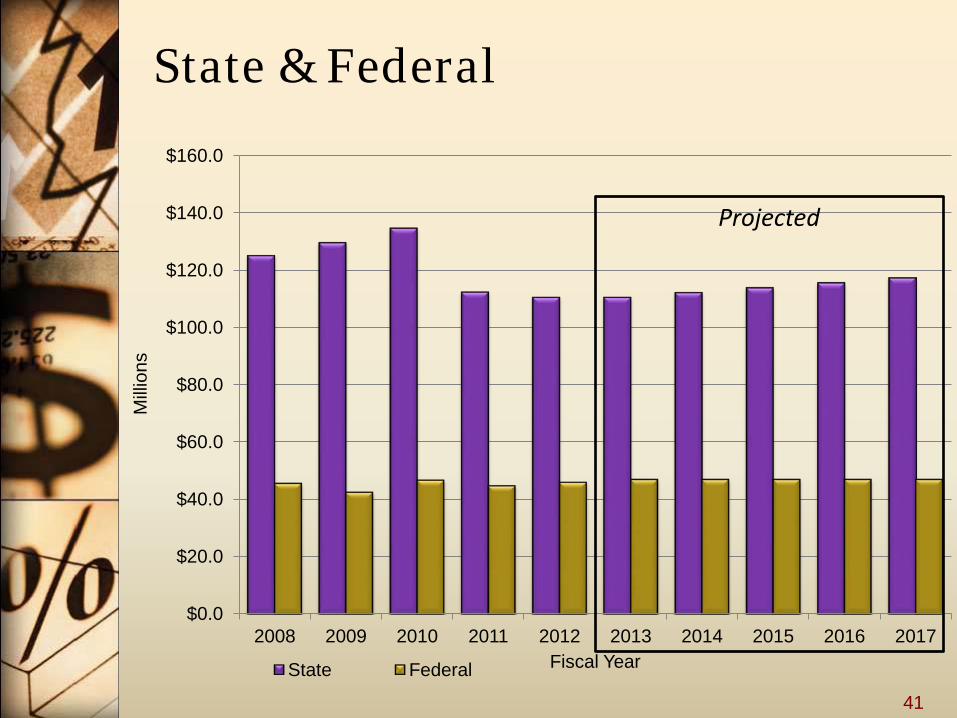
State & Federal
$0.0
$20.0
$40.0
$60.0
$80.0
$100.0
$120.0
$140.0
$160.0
2008 2009 2010 2011 2012 2013 2014 2015 2016 2017
Mill
ions
Fiscal Year State Federal
Projected
41
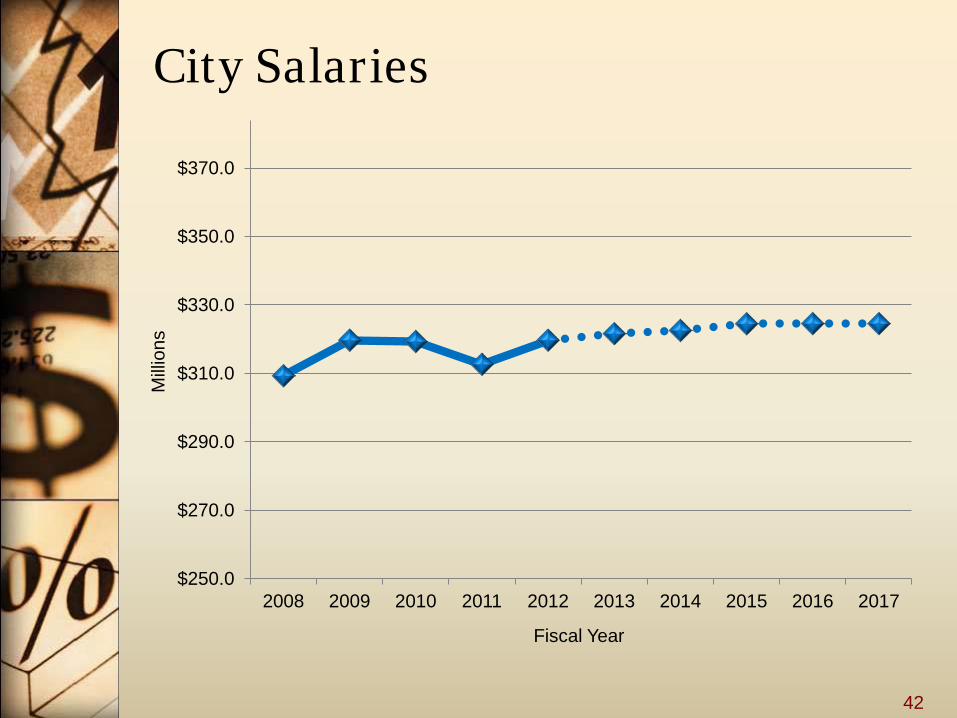
City Salaries
42
$250.0
$270.0
$290.0
$310.0
$330.0
$350.0
$370.0
2008 2009 2010 2011 2012 2013 2014 2015 2016 2017
Mill
ions
Fiscal Year
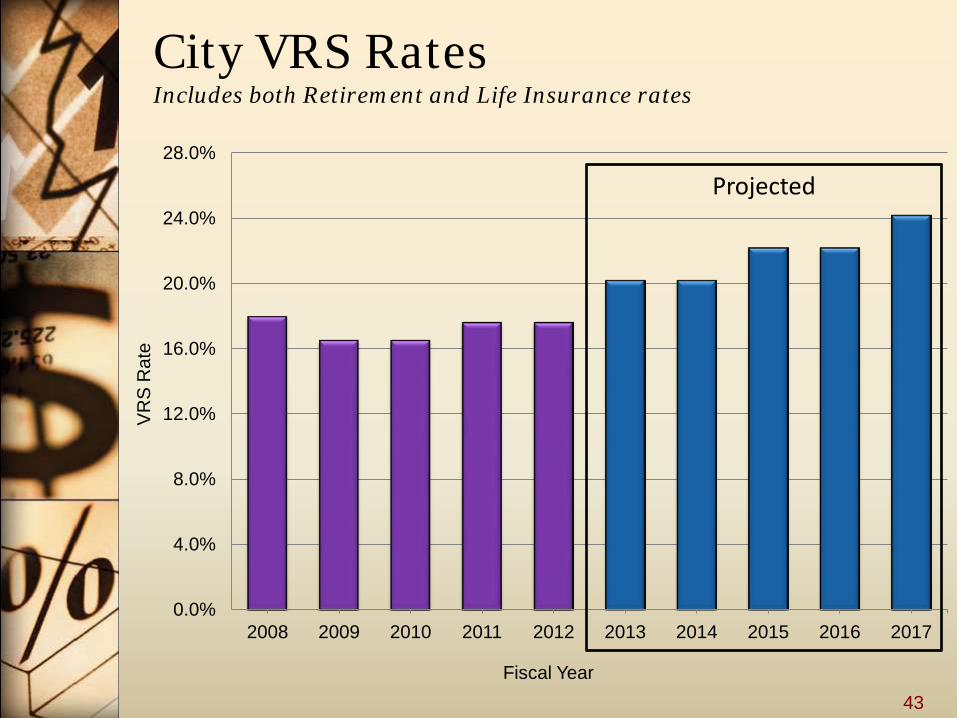
City VRS Rates Includes both Retirement and Life Insurance rates
0.0%
4.0%
8.0%
12.0%
16.0%
20.0%
24.0%
28.0%
2008 2009 2010 2011 2012 2013 2014 2015 2016 2017
VR
S R
ate
Fiscal Year
Projected
43

$0.0
$10.0
$20.0
$30.0
$40.0
$50.0
$60.0
$70.0
2008 2009 2010 2011 2012 2013 2014 2015 2016 2017
Mill
ions
Fiscal Year
Health Insurance Costs and Percentage of Full-Time Salaries
44
12.5%
15.1%
18.1%
19.7% 21.0%
22.6%

Risk Management
$0.00
$5.00
$10.00
$15.00
$20.00
$25.00
2008 2009 2010 2011 2012 2013 2014 2015 2016 2017
Mill
ions
Fiscal Year 45

SPSA Cost
$0.0
$5.0
$10.0
$15.0
$20.0
$25.0
2008 2009 2010 2011 2012 2013 2014 2015 2016 2017
Mill
ions
Fiscal Year
Estimated Solid Waste Tipping Fee - $125.00
Estimated Solid Waste Tipping Fee - $65.35
46

Debt Service All City debt excluding Schools
$0.0
$20.0
$40.0
$60.0
$80.0
$100.0
$120.0
$140.0
2008 2009 2010 2011 2012 2013 2014 2015 2016 2017
Mill
ions
Fiscal Year
Projected
47
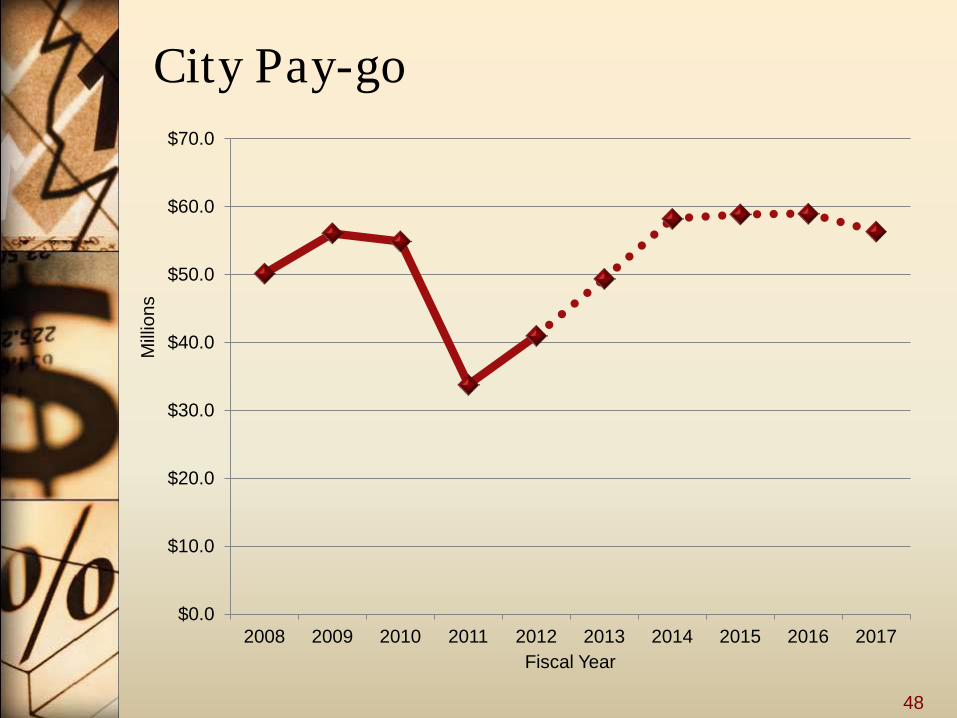
City Pay-go
48
$0.0
$10.0
$20.0
$30.0
$40.0
$50.0
$60.0
$70.0
2008 2009 2010 2011 2012 2013 2014 2015 2016 2017
Mill
ions
Fiscal Year
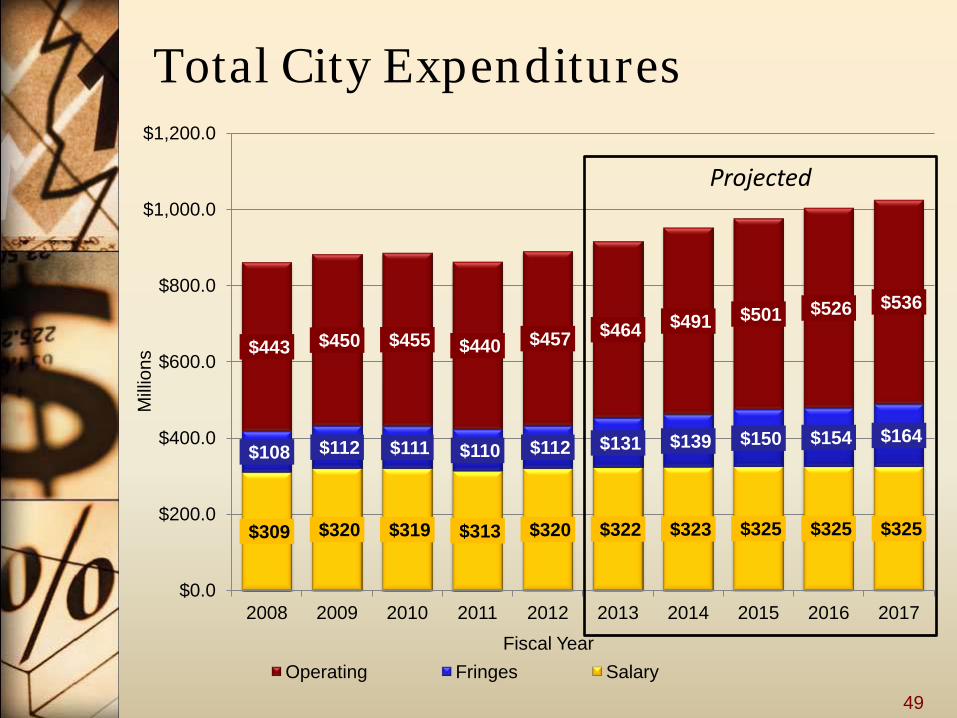
Total City Expenditures
$309 $320 $319 $313 $320 $322 $323 $325 $325 $325
$108 $112 $111 $110 $112 $131 $139 $150 $154 $164
$443 $450 $455 $440 $457 $464 $491 $501 $526 $536
$0.0
$200.0
$400.0
$600.0
$800.0
$1,000.0
$1,200.0
2008 2009 2010 2011 2012 2013 2014 2015 2016 2017
Mill
ions
Fiscal Year Operating Fringes Salary
49
Projected
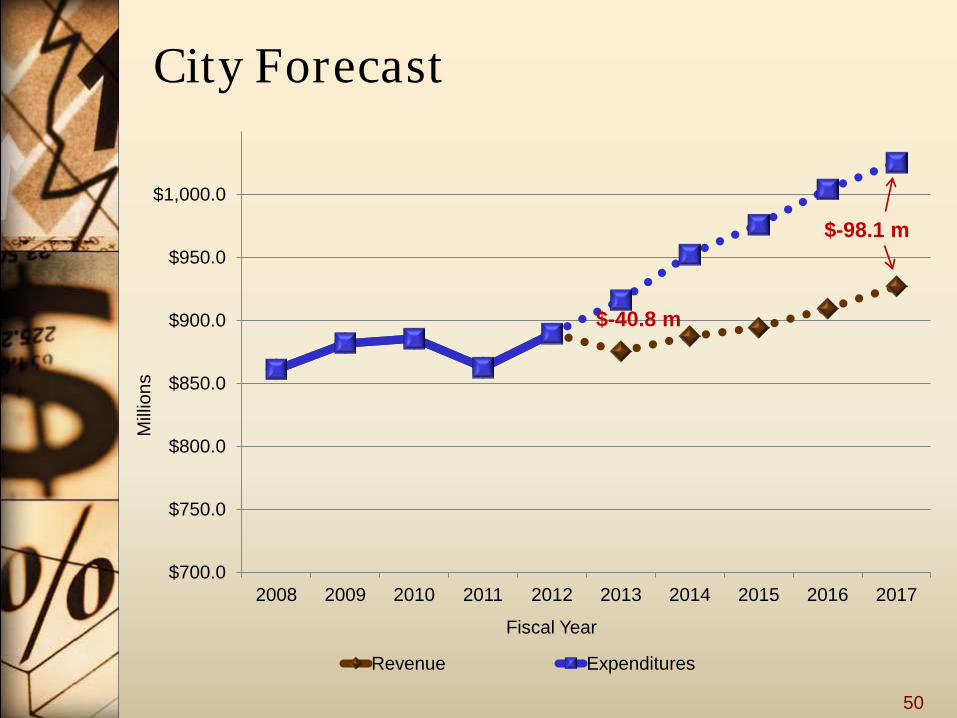
City Forecast
$700.0
$750.0
$800.0
$850.0
$900.0
$950.0
$1,000.0
2008 2009 2010 2011 2012 2013 2014 2015 2016 2017
Mill
ions
Fiscal Year
Revenue Expenditures
$-98.1 m
$-40.8 m
50

Conclusions & Threats
51

$-165.9 m
Combined Forecast
Projected
52
$1,550.0
$1,600.0
$1,650.0
$1,700.0
$1,750.0
$1,800.0
$1,850.0
$1,900.0
$1,950.0
$2,000.0
2008 2009 2010 2011 2012 2013 2014 2015 2016 2017
Mill
ions
Fiscal Year
Revenue Expenditure
$-90.1 m

Combined Deficit Drivers • The projected combined deficit for next year is
$90.1 million and grows to over $165.0 million by year 2017; however,
Driver (in millions) 2013 2014 2015 2016 2017 Projected Deficit $90.1 $132.3 $157.6 $168.5 $165.9 Less: Real Estate Loss $22.6 $35.7 $48.3 $48.3 $44.2 VRS Rates $26.3 $37.3 $54.5 $66.1 $84.0 Health Insurance $16.1 $38.3 $51.2 $60.5 $71.9 SPSA 0 $1.1 $1.1 $11.5 $11.5
Base Deficit $21.6 $15.5 ($3.2) ($23.4) ($51.7)
53

Real Estate Revenue
54
$250
$300
$350
$400
$450
$500
FY04 FY05 FY06 FY07 FY08 FY09 FY10 FY11 FY12 FY13 FY14 FY15 FY16 FY17
Mill
ions
$0.9
4
$0.9
7
$1.1
964
$1.0
239
$0.9
9
$0.8
9
$0.8
9
$0.8
9
$0.8
9
$0.8
9
$0.8
9
$0.8
9
$0.8
9
$0.8
9
$0.8
9
$1.0
0
$1.0
0
$1.0
0
$1.2
2
Note: This graph reflects the real estate taxes that are subject to the School Funding Formula and other dedications and does not include the amounts related to the TIFs and SSDs.
Gap FY 2011-12 Real Estate Revenue FY13: $21 million FY14: $34 million FY15: $46 million FY16: $46 million FY17: $42 million

Health Care Fund
No change in employer contribution in 5 years
Projected
55
$-
$50
$100
$150
$200
$250
2008 2009 2010 2011 2012 2013 2014 2015 2016 2017
Milli
ons
Claims GASB45 Revenue
Calendar Years

Combined VRS Rate Increases
56
0%
1%
2%
3%
4%
5%
6%
7%
2013 2014 2015 2016 2017
Schools City

Options to Address the Deficits
• Real Estate Revenue – Increase the rate to maintain current tax bills
– Reduce services to the community
– Process Improvement Steering Committee
• Health Care – Increase incentives to encourage healthy behavior
thereby reducing costs
– Cost shift to employees (coinsurance, copays, and premiums)
– Make substantial changes to the plan design (reduce coverage)
57
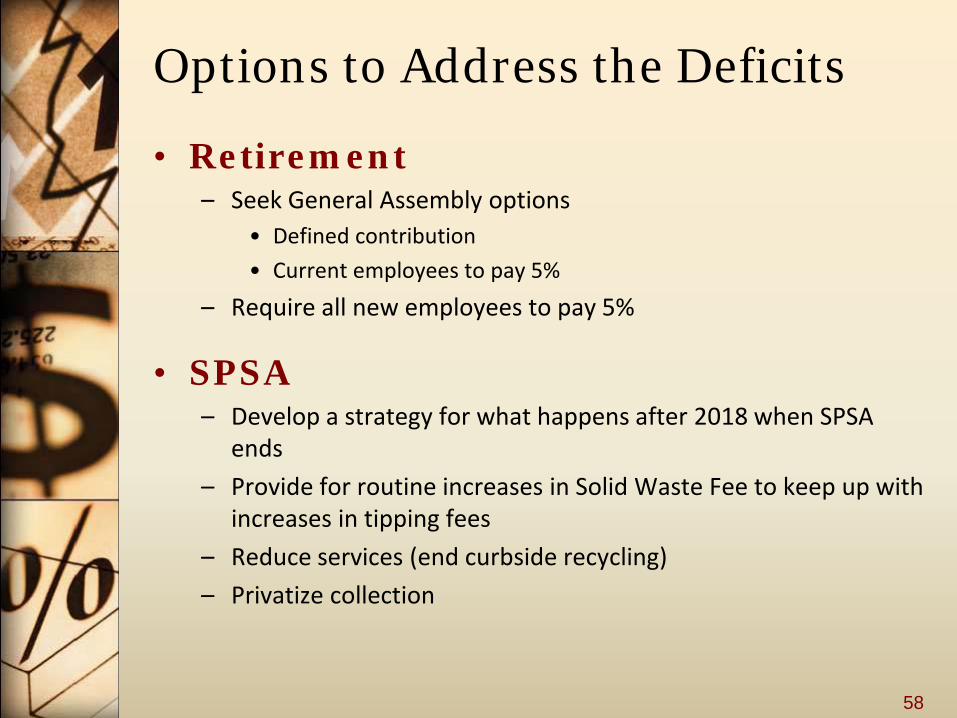
Options to Address the Deficits
• Retirement – Seek General Assembly options
• Defined contribution
• Current employees to pay 5%
– Require all new employees to pay 5%
• SPSA – Develop a strategy for what happens after 2018 when SPSA
ends
– Provide for routine increases in Solid Waste Fee to keep up with increases in tipping fees
– Reduce services (end curbside recycling)
– Privatize collection
58
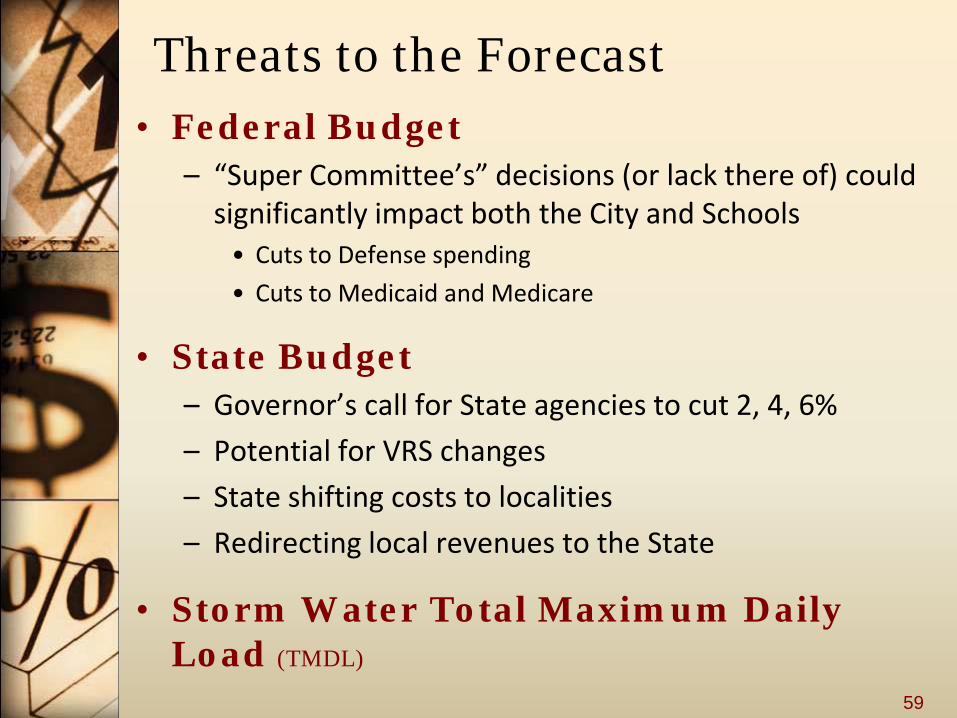
Threats to the Forecast • Federal Budget
– “Super Committee’s” decisions (or lack there of) could significantly impact both the City and Schools • Cuts to Defense spending
• Cuts to Medicaid and Medicare
• State Budget – Governor’s call for State agencies to cut 2, 4, 6%
– Potential for VRS changes
– State shifting costs to localities
– Redirecting local revenues to the State
• Storm Water Total Maximum Daily Load (TMDL)
59
Ways to Modify the Forecast Voting Software
60

Instant Voting • This voting system is anonymous .
• Wait until I say voting is open.
• Press the number on your keypad that corresponds to your answer (the keypad will turn on when you push the button).
• You can only select one answer.
• We will let you know when voting is closed.
• The results will display up here on the screen.
• We will use the results from the voting to modify the forecast.
61

Revenue Question:
Over the next 5 years do you believe the economy will:
62 1 2 3 4
0% 0%0%0%
1. Beat the forecast
2. Remain within forecast assumptions
3. Get worse
4. Unsure

Revenue Question:
25% of all our revenue comes from the State. Do you think that over the forecast period the State will:
1 2 3
0% 0%0%
1. Increase its financial commitment to Schools and the City
2. Same commitment to Schools and the City as shown in forecast
3. Reduce its financial commitment to Schools and the City
63

Revenue Question:
9% of all our revenue is Federal. Do you think that over the forecast period the Federal government will:
1 2 3
0% 0%0%
1. Increase its financial commitment to Schools and the City
2. Same commitment to Schools and the City as shown in forecast
3. Reduce its financial commitment to Schools and the City
64

Expenditure Question:
City and Schools continuously improve efficiency. Do you believe that they can continue to do so?
1 2 3
0% 0%0%
65
1. Easily, both can save an additional 1%
2. We should set a goal of reducing costs by 2%
3. No, while both should strive to remain efficient both have reached a point where choices among services would have to be made to reduce the budget

Expenditure Question:
Should the City and School system set aside funding to ensure compensation remains competitive?
1 2 3 4
0% 0%0%0%
66
1. No additional funding should be provided until the economy improves
2. Set aside 1% of total payroll each year of the forecast
3. Decrease funding for total compensation by 1% each year
4. Need to wait to see what service reductions may need to be made with the Budget

Expenditure Question:
Over the forecast period, VRS rates are anticipated to increase. Year 1 is somewhat set based on rates from VRS, but do you believe the growth in the out years is too …
67 1 2 3
0% 0%0%
1. Aggressive, VRS investments should help mitigate the increases.
2. Low given the unfunded status of pension liabilities.
3. Just about right.
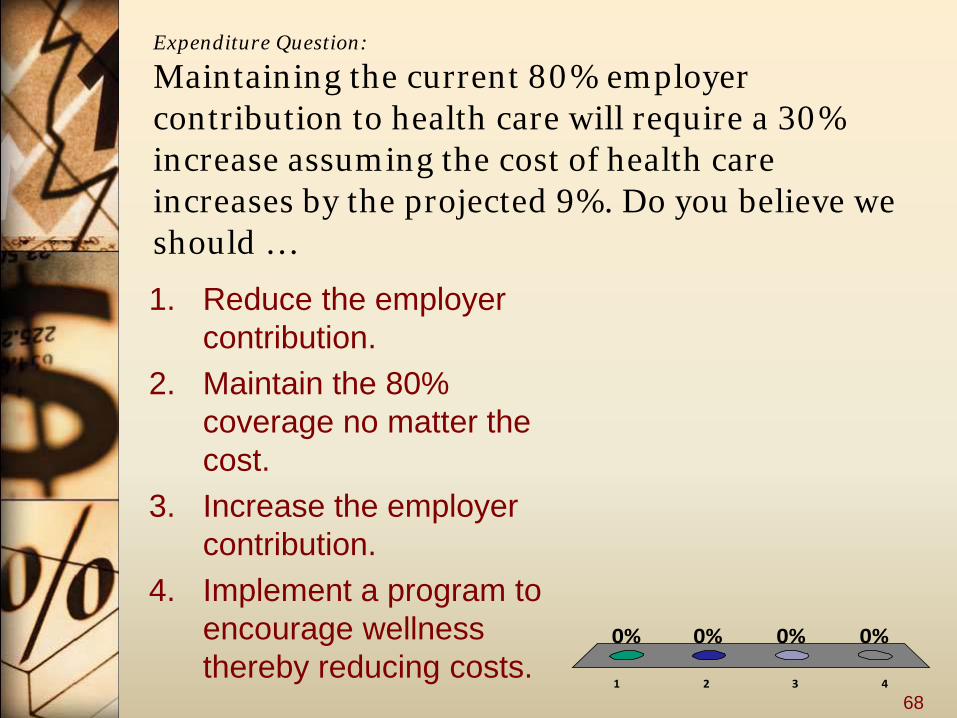
Expenditure Question:
Maintaining the current 80% employer contribution to health care will require a 30% increase assuming the cost of health care increases by the projected 9%. Do you believe we should …
68 1 2 3 4
0% 0%0%0%
1. Reduce the employer contribution.
2. Maintain the 80% coverage no matter the cost.
3. Increase the employer contribution.
4. Implement a program to encourage wellness thereby reducing costs.

Expenditure Question:
What single service is likely to experience the most increase in demand over the next 5 years and should be considered for increased funding?
69 1 2 3 4
0% 0%0%0%
1. Public Safety
2. Education K-12
3. Human Service programs
4. Infrastructure maintenance

Expenditure Question:
Overall, expenditures in the forecast are:
1 2 3 4
0% 0%0%0%
70
1. Too conservative to maintain quality of life and address critical issues. Expenditures need to increase more.
2. Just about right given where the economy is likely to be.
3. Too optimistic, we should be able to reduce expenditures by focusing on core services.
4. Unsure

Discussion Question:
The most significant threat to the financial position of the City and Schools in the next 18 months is:
1 2 3 4 5
0% 0% 0%0%0%
71
1. State budget reductions due to the slow economy and the loss of the stimulus funds
2. Reductions in Federal defense spending
3. State elimination of local funding streams (Business License(BPOL)
4. Health care costs
5. VRS retirement costs

Conclusion
• The economy is improving although very slowly.
• Federal and State budget reductions will affect programs and revenues, they are beyond our control.
72