fy 2015 results presentation 24 april 2016
TRANSCRIPT
FY 2015 Results Presentation
24 April 2016
2
Table of Contents
Section Page
Summary Financials 3
Group Outlook for 2016 4
Net Cash Position 5
Backlog Evolution and Segmentation 6
BESIX Group 9
Construction Materials and Industrial Property Portfolio 11
Legal Update 12
Appendix – Financial Statements 13
Summary Financials
3
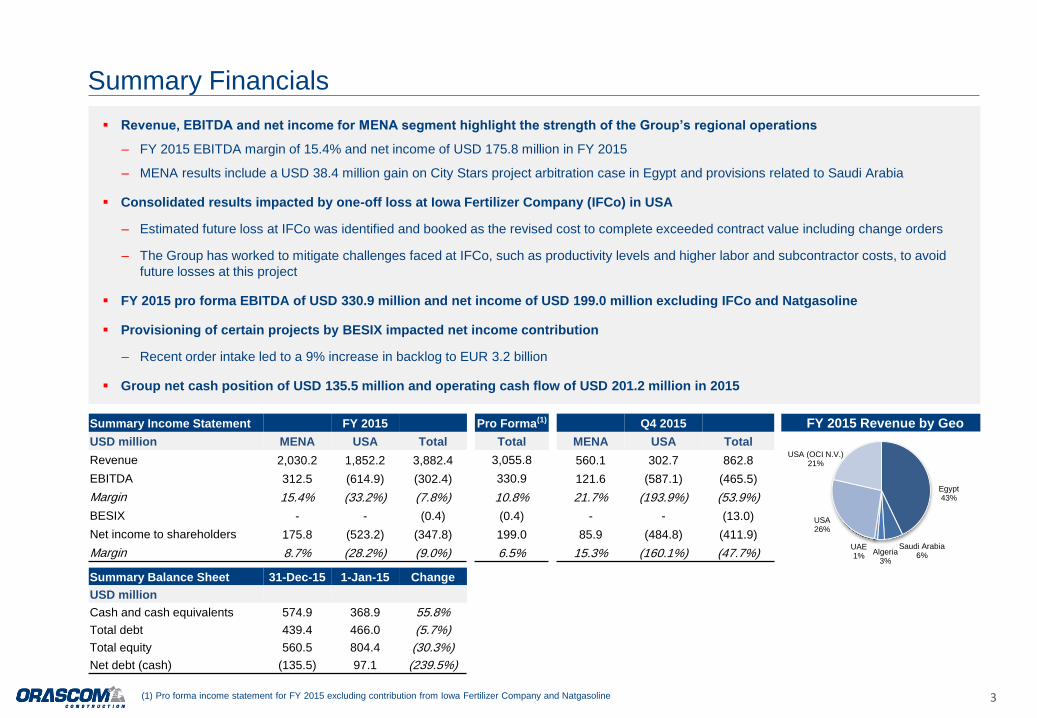
Revenue, EBITDA and net income for MENA segment highlight the strength of the Group’s regional operations
‒ FY 2015 EBITDA margin of 15.4% and net income of USD 175.8 million in FY 2015
‒ MENA results include a USD 38.4 million gain on City Stars project arbitration case in Egypt and provisions related to Saudi Arabia
Consolidated results impacted by one-off loss at Iowa Fertilizer Company (IFCo) in USA
‒ Estimated future loss at IFCo was identified and booked as the revised cost to complete exceeded contract value including change orders
‒ The Group has worked to mitigate challenges faced at IFCo, such as productivity levels and higher labor and subcontractor costs, to avoid
future losses at this project
FY 2015 pro forma EBITDA of USD 330.9 million and net income of USD 199.0 million excluding IFCo and Natgasoline
Provisioning of certain projects by BESIX impacted net income contribution
‒ Recent order intake led to a 9% increase in backlog to EUR 3.2 billion
Group net cash position of USD 135.5 million and operating cash flow of USD 201.2 million in 2015
(1) Pro forma income statement for FY 2015 excluding contribution from Iowa Fertilizer Company and Natgasoline
Summary Income Statement FY 2015 Pro Forma(1) Q4 2015
USD million MENA USA Total Total MENA USA Total
Revenue 2,030.2 1,852.2 3,882.4 3,055.8 560.1 302.7 862.8
EBITDA 312.5 (614.9) (302.4) 330.9 121.6 (587.1) (465.5)
Margin 15.4% (33.2%) (7.8%) 10.8% 21.7% (193.9%) (53.9%)
BESIX - - (0.4) (0.4) - - (13.0)
Net income to shareholders 175.8 (523.2) (347.8) 199.0 85.9 (484.8) (411.9)
Margin 8.7% (28.2%) (9.0%) 6.5% 15.3% (160.1%) (47.7%)
Summary Balance Sheet 31-Dec-15 1-Jan-15 Change
USD million
Cash and cash equivalents 574.9 368.9 55.8%
Total debt 439.4 466.0 (5.7%)
Total equity 560.5 804.4 (30.3%)
Net debt (cash) (135.5) 97.1 (239.5%)
FY 2015 Revenue by Geo
Egypt 43%
Saudi Arabia 6% Algeria
3%
UAE 1%
USA 26%
USA (OCI N.V.) 21%

Group Outlook for 2016
4
While the loss booked in USA has weighed on consolidated earnings, the Board of Directors and Management are pleased with the strong
performance of other major parts of the business and are confident in the Group’s ability to execute its long-term strategy
The Group expects significant improvement in EBITDA and net income in 2016 led by the continued strong performance in MENA as the Group
added high quality infrastructure work during 2015 and 2016 which will be partially executed in 2016
Accomplishments in 2015 include record execution of West Damietta and Assiut power plants in Egypt in under 8 months
Current backlog of USD 6.7 billion driven by USD 4.8 billion in new awards provides healthy revenue and profitability coverage
Project pipeline in Egypt to remain strong coupled with additional selective opportunities in other MENA markets. The Group is also focused on
further growing US backlog
Estimated future losses in the U.S. operation were identified and booked in 2015; the Group is actively mitigating potential future losses at IFCo
Return to profitability expected in Q1 2016 with estimated revenue of approximately USD 900 million and positive consolidated EBITDA

5
Net Cash Position as of 31 Dec 2015
USD million 31 Dec 2011 31 Dec 2012 31 Dec 2013 1 Jan 2015 31 Mar 2015 30 June 2015 30 Sept 2015 31 Dec 2015
Net debt 141 368 387 97 (26) 88 (153) (136)
EBITDA 291 15 48 N/A 38(1) 102(2) 163(3) (302)
Total equity 1,111 431 875 804 935 950 961 561
Net debt/equity 0.13 0.85 0.44 0.12 (0.03) 0.09 (0.16) (0.24)
Evolution of Net Debt
(1) Q1 2015 EBITDA; (2) H1 2015 EBITDA; (3) 9M 2015 EBITDA
Net cash position of USD 135.5 million at year-end 2015
Focus on maintaining capital structure that allows the Group to implement its growth strategy
Pre-Demerger Post-Demerger
$448 $428 $420 $369
$397
$476 $524
$575 $589
$796 $807
$466
$371
$564
$371
$439
31 Dec 11 31 Dec 12 31 Dec 13 1 Jan 15 31 Mar 15 30 June 15 30 Sept 15 31 Dec 15
Cash Total debt Net debt

$3.3
$4.9
$3.8
$5.8
$6.7
$2.7 $2.6
$1.2
$4.9 $4.8
2011 2012 2013 2014 2015
Backlog New Awards
Healthy Backlog Level Secures Future Profitability
Another Year of Quality Project Additions Increases Backlog 14% to USD 6.7 Billion
6 Note: Backlog excludes BESIX/JV’s accounted for under the equity method and intercompany work
The Group continues to target infrastructure and industrial projects in Egypt and other MENA markets
Focus on pursuing quality projects where the Group has a competitive edge and is confident in the source of funding
Expected sustained growth in US backlog to complement MENA operations
Backlog grew 14% y-o-y to USD 6.66 billion, providing healthy future revenue and profitability coverage level
Currently executing over 10,000 MW of combined cycle power projects in Egypt on an EPC + Finance basis where the foreign currency is
sourced by the client from abroad
‒ These projects represent 32% of total consolidated backlog and 66% of Egypt backlog
New awards of USD 4.8 billion is in line with strong levels achieved in FY 2014 as the Group signed USD 1.1 billion in Q4 2015
Strong new order intake by Weitz in FY 2015 as it signed USD 1.2 billion and maintained backlog size at 3.5x since acquisition in December
2012

Strategic Backlog Diversification
7
Backlog by Brand Backlog by Currency Benefits from EGP Devaluation
Note: Backlog breakdown as of 31 December 2015; backlog excludes BESIX/JV’s accounted for under the equity method and intercompany work
FCY & FCY-priced87.4%
EGP12.6%
87% of the Group’s total backlog is in FCY
or priced in FCY
‒ Only c.26% of backlog in Egypt is in EGP
‒ FCY and FCY-priced backlog outweigh
FCY costs in Egypt
The Group also incorporates cost escalation
clauses in the majority of Egypt contracts to
protect against potential cost inflationary
pressures
Egypt48.6%
Saudi Arabia10.1%
Algeria0.8%
USA21.4%
USA (OCI N.V.)15.6%
Rest of World3.5%
Public63.5%
Private20.9%
OCI N.V.15.6%
Infrastructure62.5%
Industrial20.7%
Commercial16.8%
Backlog by Geography Backlog by Sector Backlog by Client
Orascom75.7%
Weitz15.3%
Contrack Watts9.0%
2.5 2.8 2.1
2.8
4.2
0.7 0.9
0.8
1.3
1.4
1.2
0.9
1.5
1.0
2011 2012 2013 2014 FY 2015
OCI N.V. F&C Private Public
2.7
3.8 3.2
4.4 5.0
0.7
0.8
0.3
0.7
0.6
0.3
0.3
0.5
1.0
2011 2012 2013 2014 FY 2015
Weitz Contrack Watts Orascom
1.8 1.6 1.2 1.5
3.2 0.6
0.6 0.8
1.2
0.7
0.2 0.1 0.1
0.2
0.1
1.7 1.4
2.4
2.5
0.7
0.9
0.3
0.3
0.2
2011 2012 2013 2014 FY 2015
Rest of World USA Algeria Saudi Arabia Egypt
2.6 2.8 2.1
3.0
4.2
0.3
1.4
1.1
1.9
1.4
0.5
0.7
0.6
0.6
1.1
2011 2012 2013 2014 FY 2015
Commercial Industrial Infrastructure
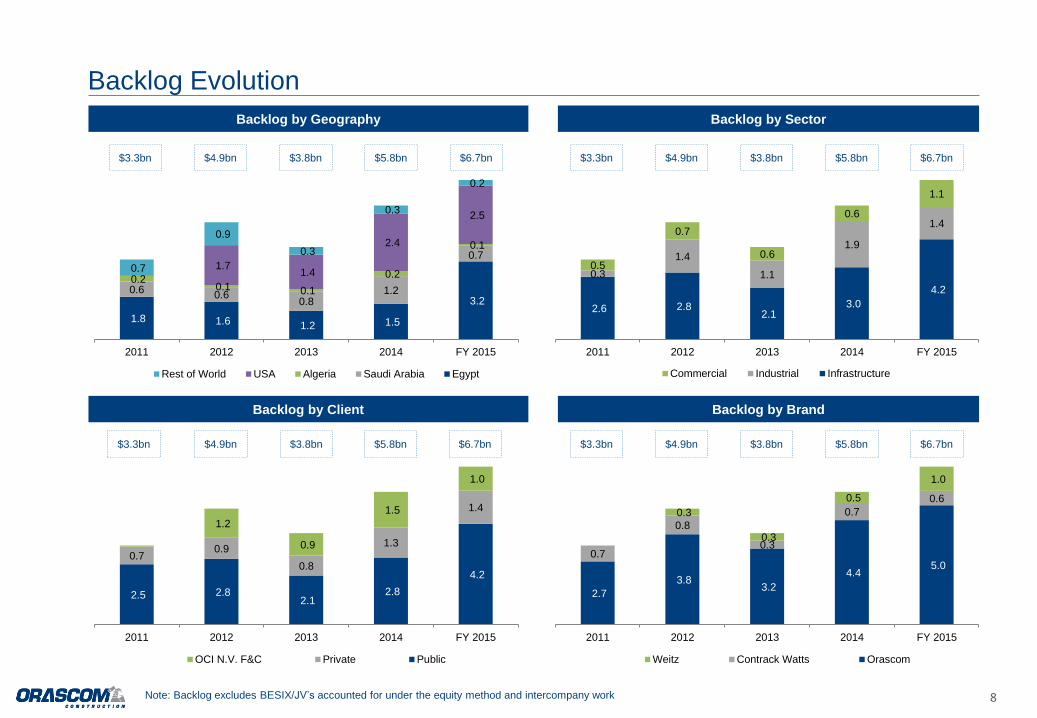
Backlog Evolution
8
Backlog by Geography
Backlog by Client
Backlog by Sector
Backlog by Brand
$3.3bn $4.9bn $3.8bn $5.8bn $6.7bn $3.3bn $4.9bn $3.8bn $5.8bn $6.7bn
$3.3bn $4.9bn $3.8bn $5.8bn $6.7bn $3.3bn $4.9bn $3.8bn $5.8bn $6.7bn
Note: Backlog excludes BESIX/JV’s accounted for under the equity method and intercompany work

9
BESIX: Backlog Grows 9% to EUR 3.2 Billion
Note: BESIX is recorded as an equity investment in OC’s financial statements
Standalone BESIX Backlog of EUR 3.2 Billion
57% of Backlog in MENA – 31 December 2015 Backlog Evolution (EUR billion)
Strong recent new order intake across a number of sectors and geographies is expected to reflect positively on future profitability
New projects in Europe include an underpass, a PPP marine project and a wastewater treatment plant
Recent awards in the Middle East include an LNG terminal in Bahrain, a major leisure/residential complex in UAE and airport work in Qatar
BESIX book value represents 51% of Orascom’s total equity value of USD 560.5 million
ADNOC Tower
Abu Dhabi, UAE
Belgium Pavilion Expo
Milan, Italy
Docks Bruxsel Mall
Brussels, Belgium
Radar Tower
Neetlje Jans, The Netherlands
Wheatstone LNG Jetty
Western Australia
2.42
3.12
3.59
3.07
2.72 2.96 2.96
3.29
2.96 3.23
0.0
0.5
1.0
1.5
2.0
2.5
3.0
3.5
4.0
2009 2010 2011 2012 2013 2014 1Q15 2Q15 3Q15 4Q15
Europe 41%
UAE 23%
Qatar 16%
Saudi Arabia 7%
Egypt 7%
Bahrain 4%
Other 2%

10
FY 2015 Pro Forma Financials & Backlog – Consolidating 50% of BESIX
USD million OC 50% of BESIX Pro Forma
Revenue 3,882.4 1,199.4 5,081.8
EBITDA (302.4) 25.0 (277.4)
Net Income(1) (347.4) (0.4) (347.8)
Net Debt (Cash) (135.5) (14.3) (149.8)
Backlog 6,662.3 1,751.0 8,413.3
New Awards 4,846.1 1,270.6 6,116.7
Note: BESIX is recorded as an equity investment in OC’s financial statements
(1) Net income attributable to shareholders; OC net income excludes contribution from BESIX
Pro Forma Backlog – 50% of BESIX
Provisioning of certain projects in MENA impacted BESIX’s profitability in FY 2015
The Group expects improved performance in 2016 and 2017 supported by quality new awards
OC received a dividend of USD 19.4 million from BESIX in 2015
BESIX at a net cash position of EUR 26 million as of 31 Dec 2015
Mall of Egypt
Orascom/BESIX JV
Grand Egyptian Museum
Orascom/BESIX JV
Egypt 39.9%
Other GCC 9.7% Saudi Arabia
9.5%
Algeria 0.6%
USA 29.3%
Europe 8.5%
Rest of World 2.4%
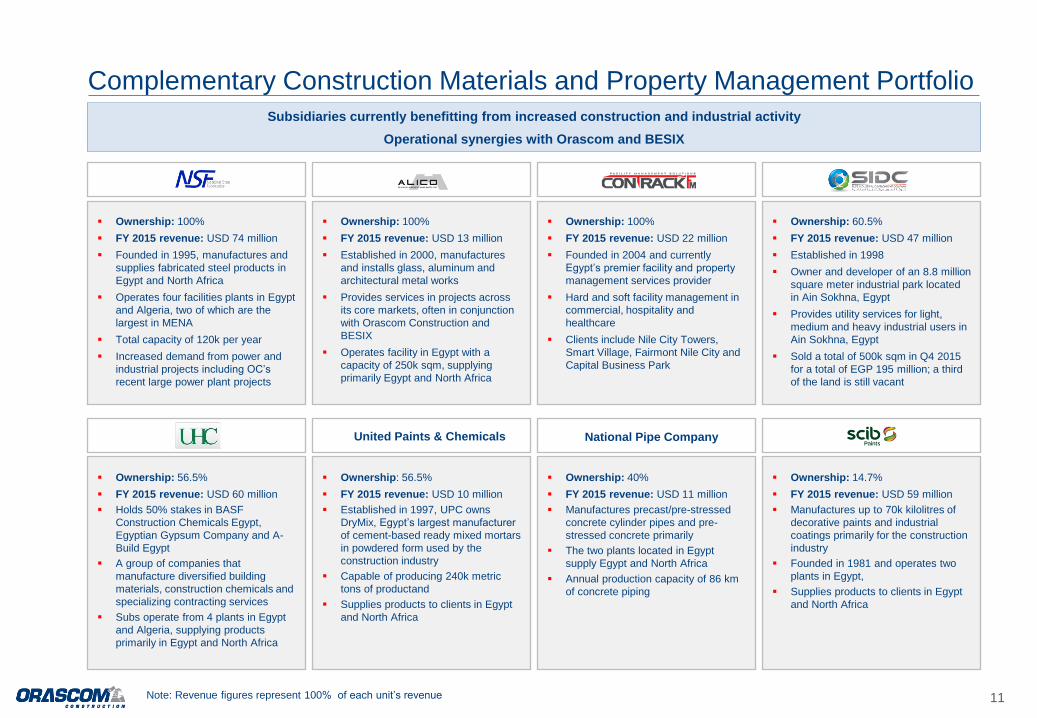
Complementary Construction Materials and Property Management Portfolio
Subsidiaries currently benefitting from increased construction and industrial activity
Operational synergies with Orascom and BESIX
11
Ownership: 100%
FY 2015 revenue: USD 74 million
Founded in 1995, manufactures and
supplies fabricated steel products in
Egypt and North Africa
Operates four facilities plants in Egypt
and Algeria, two of which are the
largest in MENA
Total capacity of 120k per year
Increased demand from power and
industrial projects including OC’s
recent large power plant projects
Ownership: 100%
FY 2015 revenue: USD 13 million
Established in 2000, manufactures
and installs glass, aluminum and
architectural metal works
Provides services in projects across
its core markets, often in conjunction
with Orascom Construction and
BESIX
Operates facility in Egypt with a
capacity of 250k sqm, supplying
primarily Egypt and North Africa
Ownership: 100%
FY 2015 revenue: USD 22 million
Founded in 2004 and currently
Egypt’s premier facility and property
management services provider
Hard and soft facility management in
commercial, hospitality and
healthcare
Clients include Nile City Towers,
Smart Village, Fairmont Nile City and
Capital Business Park
Ownership: 60.5%
FY 2015 revenue: USD 47 million
Established in 1998
Owner and developer of an 8.8 million
square meter industrial park located
in Ain Sokhna, Egypt
Provides utility services for light,
medium and heavy industrial users in
Ain Sokhna, Egypt
Sold a total of 500k sqm in Q4 2015
for a total of EGP 195 million; a third
of the land is still vacant
Ownership: 56.5%
FY 2015 revenue: USD 60 million
Holds 50% stakes in BASF
Construction Chemicals Egypt,
Egyptian Gypsum Company and A-
Build Egypt
A group of companies that
manufacture diversified building
materials, construction chemicals and
specializing contracting services
Subs operate from 4 plants in Egypt
and Algeria, supplying products
primarily in Egypt and North Africa
Ownership: 56.5%
FY 2015 revenue: USD 10 million
Established in 1997, UPC owns
DryMix, Egypt’s largest manufacturer
of cement-based ready mixed mortars
in powdered form used by the
construction industry
Capable of producing 240k metric
tons of productand
Supplies products to clients in Egypt
and North Africa
Ownership: 40%
FY 2015 revenue: USD 11 million
Manufactures precast/pre-stressed
concrete cylinder pipes and pre-
stressed concrete primarily
The two plants located in Egypt
supply Egypt and North Africa
Annual production capacity of 86 km
of concrete piping
Ownership: 14.7%
FY 2015 revenue: USD 59 million
Manufactures up to 70k kilolitres of
decorative paints and industrial
coatings primarily for the construction
industry
Founded in 1981 and operates two
plants in Egypt,
Supplies products to clients in Egypt
and North Africa
United Paints & Chemicals National Pipe Company
Note: Revenue figures represent 100% of each unit’s revenue
12
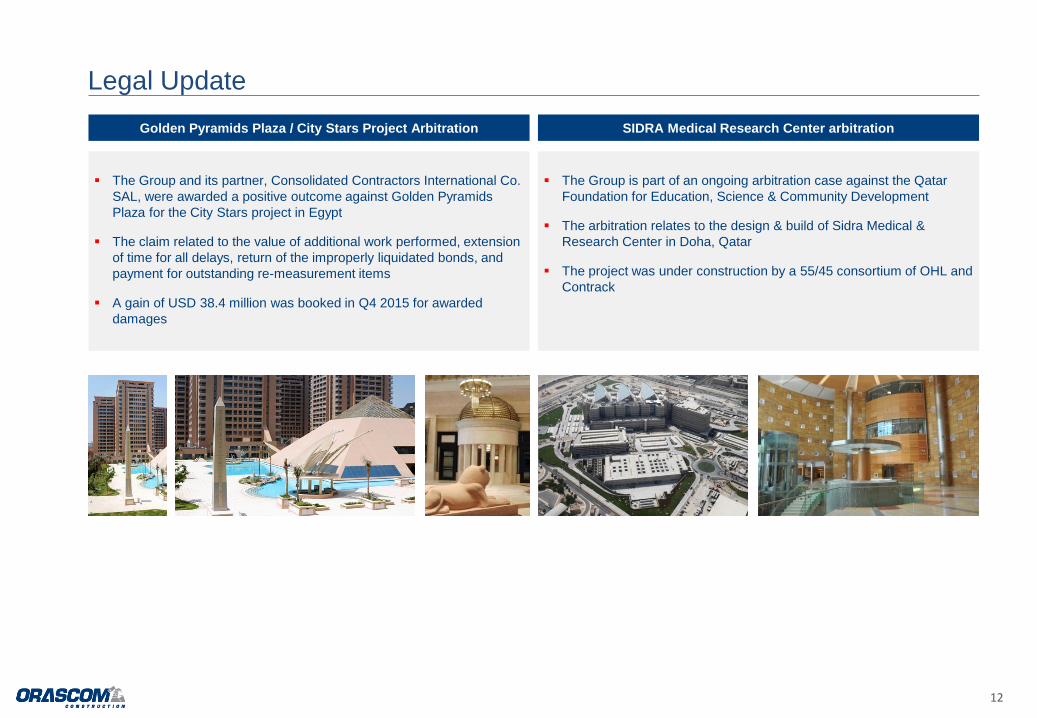
Legal Update
Golden Pyramids Plaza / City Stars Project Arbitration SIDRA Medical Research Center arbitration
The Group is part of an ongoing arbitration case against the Qatar
Foundation for Education, Science & Community Development
The arbitration relates to the design & build of Sidra Medical &
Research Center in Doha, Qatar
The project was under construction by a 55/45 consortium of OHL and
Contrack
SIDRA
City Stars
The Group and its partner, Consolidated Contractors International Co.
SAL, were awarded a positive outcome against Golden Pyramids
Plaza for the City Stars project in Egypt
The claim related to the value of additional work performed, extension
of time for all delays, return of the improperly liquidated bonds, and
payment for outstanding re-measurement items
A gain of USD 38.4 million was booked in Q4 2015 for awarded
damages
Appendix
Financial Statements

Income Statement
14
USD million FY 2015 Q4 2015
Revenue 3,882.4 862.9
Cost of sales (4,093.7) (1,305.5)
Gross profit (211.3) (442.6)
Margin (5.4%) (51.3%)
Other income 53.9 39.7
SG&A expenses (198.2) (73.4)
Results from operating activities (355.6) (476.3)
EBITDA (302.4) (465.5)
Margin (7.8%) (53.9%)
Financing income & expenses
Finance income 27.5 7.1
Finance cost (48.8) (0.8)
Net finance cost (21.3) 6.3
One-off net loss arising from a business
combination (12.2) 0.0
Income from associates (net of tax) 5.0 (12.6)
Profit before income tax (384.1) (482.6)
Income tax 49.7 78.4
Net profit (334.4) (404.3)
Profit attributable to:
Owners of the company (347.8) (411.9)
Non-controlling interests 13.4 7.6
Net profit (334.4) (404.3)
Revenue:
52% of FY 2015 revenue from MENA and 48% from USA
SG&A and Other Income:
SG&A includes USD 50 million provision; excluding this one-off
item, SG&A as a percentage of revenue is 3.8%
Other income includes a gain of USD 38.4 million for the positive
outcome of the arbitration case for the City Stars project in Egypt
EBITDA:
FY 2015 EBITDA margin of 15.4% in MENA highlights strength of
regional operations
Non-recurring negative impact from loss in USA
Income tax:
Deferred tax asset of USD 90 million related to USA loss
Net financing cost:
Finance income includes interest expense of USD 19.3 million and
USD 8.1 million FX gain in FY 2015
Finance cost includes USD 34.1 million interest cost and USD
14.7 million FX loss (mainly related to EUR translation)
Net income
FY 2015 MENA net income to shareholders of USD 175.8 million
at 8.7% margin
FY 2015 pro forma net income to shareholders of USD 199.0
million at 6.5% margin
FY 2015 Results Commentary
Note: FY 2015 figures are based on audited financials; full financial statements are available on the corporate website
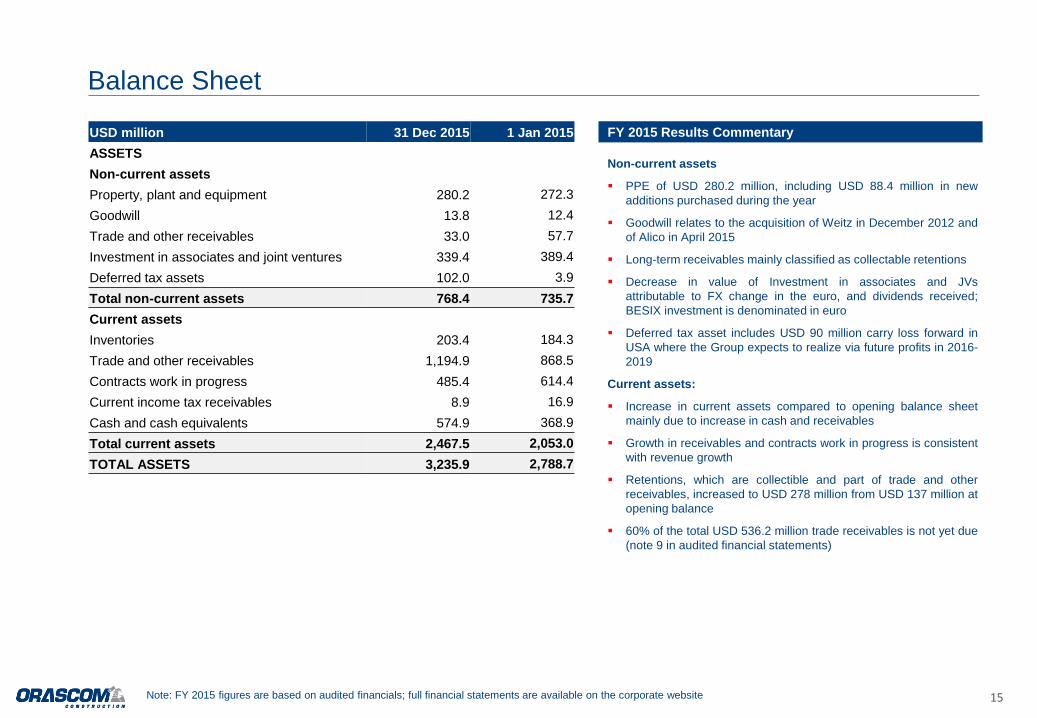
Balance Sheet
15 Note: FY 2015 figures are based on audited financials; full financial statements are available on the corporate website
USD million 31 Dec 2015 1 Jan 2015
ASSETS
Non-current assets
Property, plant and equipment 280.2 272.3
Goodwill 13.8 12.4
Trade and other receivables 33.0 57.7
Investment in associates and joint ventures 339.4 389.4
Deferred tax assets 102.0 3.9
Total non-current assets 768.4 735.7
Current assets
Inventories 203.4 184.3
Trade and other receivables 1,194.9 868.5
Contracts work in progress 485.4 614.4
Current income tax receivables 8.9 16.9
Cash and cash equivalents 574.9 368.9
Total current assets 2,467.5 2,053.0
TOTAL ASSETS 3,235.9 2,788.7
Non-current assets
PPE of USD 280.2 million, including USD 88.4 million in new
additions purchased during the year
Goodwill relates to the acquisition of Weitz in December 2012 and
of Alico in April 2015
Long-term receivables mainly classified as collectable retentions
Decrease in value of Investment in associates and JVs
attributable to FX change in the euro, and dividends received;
BESIX investment is denominated in euro
Deferred tax asset includes USD 90 million carry loss forward in
USA where the Group expects to realize via future profits in 2016-
2019
Current assets:
Increase in current assets compared to opening balance sheet
mainly due to increase in cash and receivables
Growth in receivables and contracts work in progress is consistent
with revenue growth
Retentions, which are collectible and part of trade and other
receivables, increased to USD 278 million from USD 137 million at
opening balance
60% of the total USD 536.2 million trade receivables is not yet due
(note 9 in audited financial statements)
FY 2015 Results Commentary
Balance Sheet
16
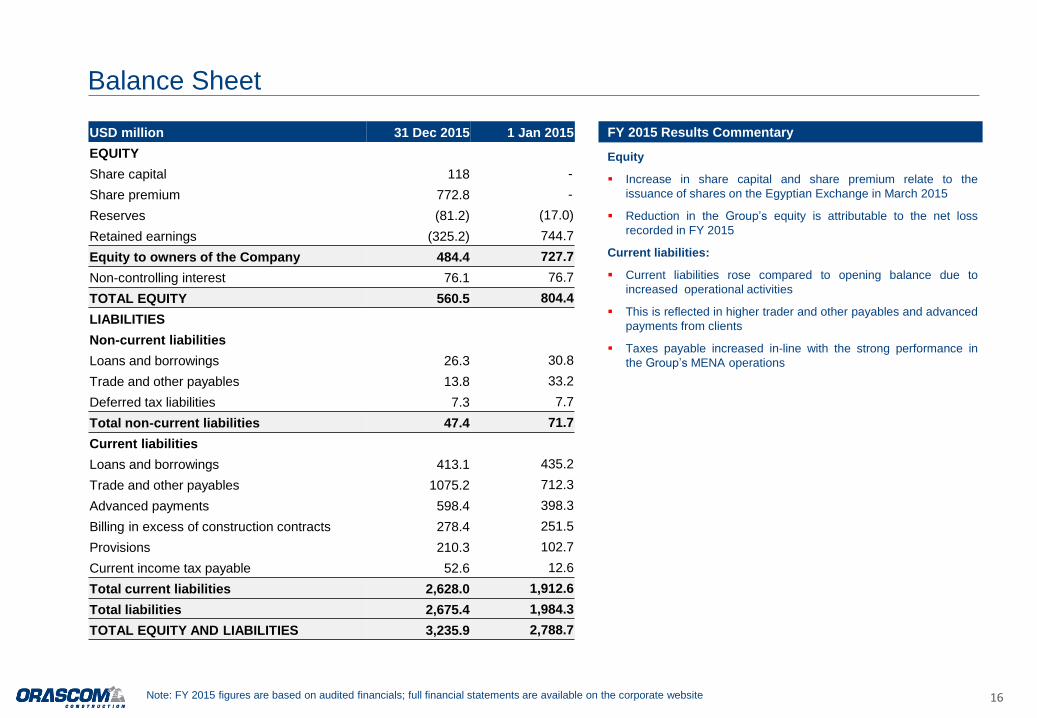
USD million 31 Dec 2015 1 Jan 2015
EQUITY
Share capital 118 -
Share premium 772.8 -
Reserves (81.2) (17.0)
Retained earnings (325.2) 744.7
Equity to owners of the Company 484.4 727.7
Non-controlling interest 76.1 76.7
TOTAL EQUITY 560.5 804.4
LIABILITIES
Non-current liabilities
Loans and borrowings 26.3 30.8
Trade and other payables 13.8 33.2
Deferred tax liabilities 7.3 7.7
Total non-current liabilities 47.4 71.7
Current liabilities
Loans and borrowings 413.1 435.2
Trade and other payables 1075.2 712.3
Advanced payments 598.4 398.3
Billing in excess of construction contracts 278.4 251.5
Provisions 210.3 102.7
Current income tax payable 52.6 12.6
Total current liabilities 2,628.0 1,912.6
Total liabilities 2,675.4 1,984.3
TOTAL EQUITY AND LIABILITIES 3,235.9 2,788.7
Equity
Increase in share capital and share premium relate to the
issuance of shares on the Egyptian Exchange in March 2015
Reduction in the Group’s equity is attributable to the net loss
recorded in FY 2015
Current liabilities:
Current liabilities rose compared to opening balance due to
increased operational activities
This is reflected in higher trader and other payables and advanced
payments from clients
Taxes payable increased in-line with the strong performance in
the Group’s MENA operations
FY 2015 Results Commentary
Note: FY 2015 figures are based on audited financials; full financial statements are available on the corporate website
Cash Flow Statement
17
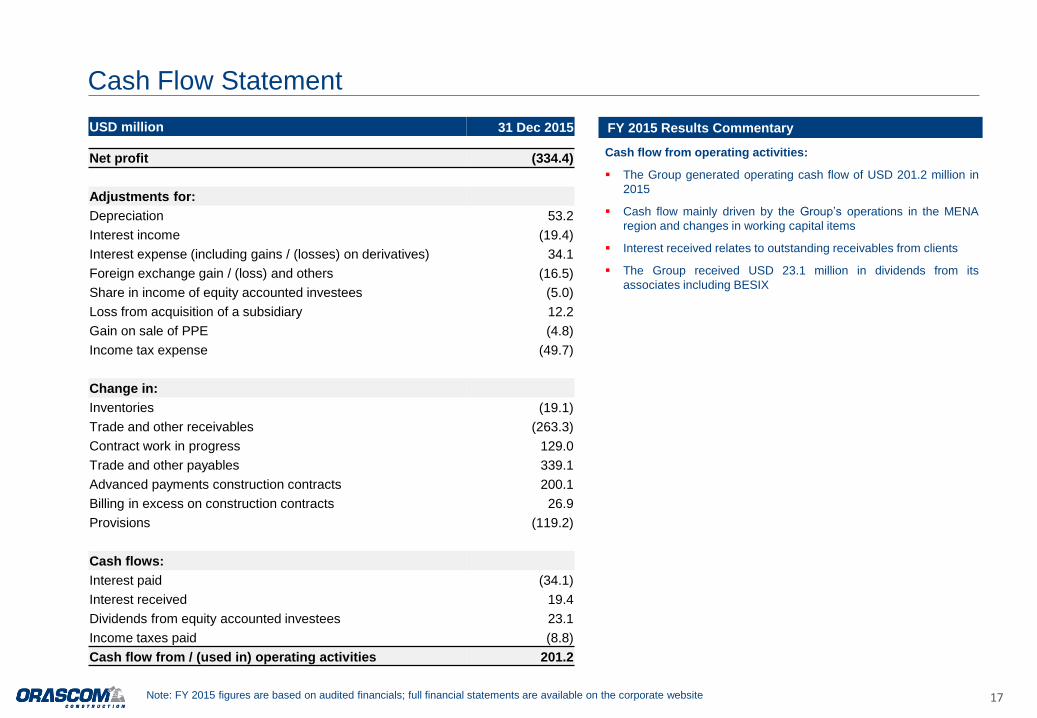
USD million 31 Dec 2015
Net profit (334.4)
Adjustments for:
Depreciation 53.2
Interest income (19.4)
Interest expense (including gains / (losses) on derivatives) 34.1
Foreign exchange gain / (loss) and others (16.5)
Share in income of equity accounted investees (5.0)
Loss from acquisition of a subsidiary 12.2
Gain on sale of PPE (4.8)
Income tax expense (49.7)
Change in:
Inventories (19.1)
Trade and other receivables (263.3)
Contract work in progress 129.0
Trade and other payables 339.1
Advanced payments construction contracts 200.1
Billing in excess on construction contracts 26.9
Provisions (119.2)
Cash flows:
Interest paid (34.1)
Interest received 19.4
Dividends from equity accounted investees 23.1
Income taxes paid (8.8)
Cash flow from / (used in) operating activities 201.2
Cash flow from operating activities:
The Group generated operating cash flow of USD 201.2 million in
2015
Cash flow mainly driven by the Group’s operations in the MENA
region and changes in working capital items
Interest received relates to outstanding receivables from clients
The Group received USD 23.1 million in dividends from its
associates including BESIX
FY 2015 Results Commentary
Note: FY 2015 figures are based on audited financials; full financial statements are available on the corporate website
Cash Flow Statement
18
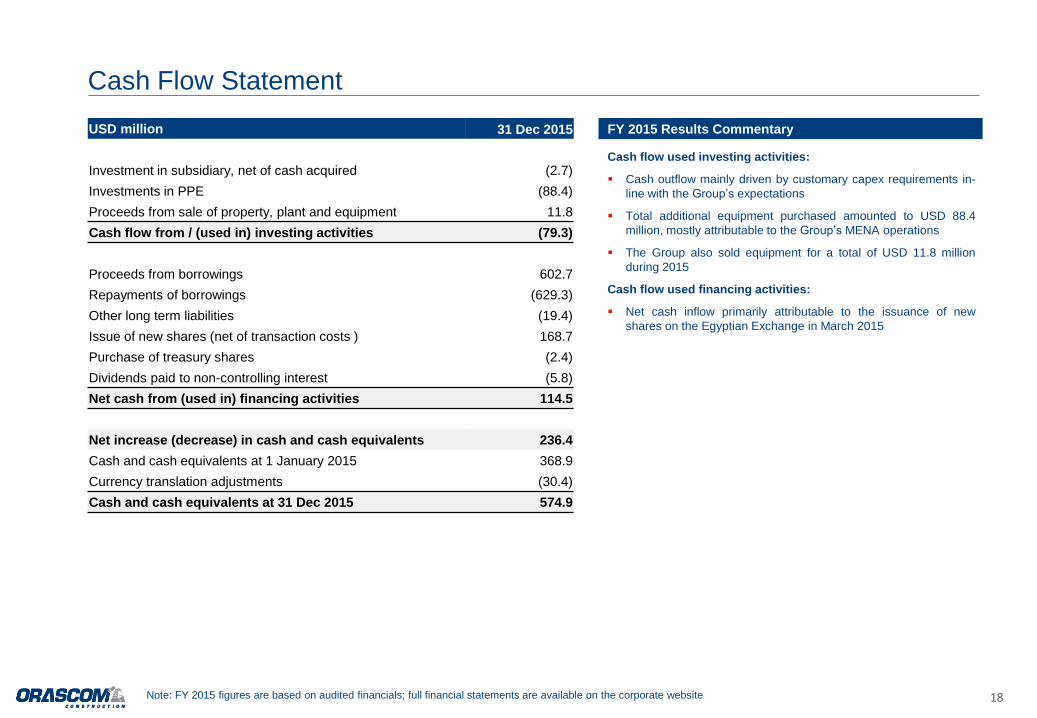
USD million 31 Dec 2015
Investment in subsidiary, net of cash acquired (2.7)
Investments in PPE (88.4)
Proceeds from sale of property, plant and equipment 11.8
Cash flow from / (used in) investing activities (79.3)
Proceeds from borrowings 602.7
Repayments of borrowings (629.3)
Other long term liabilities (19.4)
Issue of new shares (net of transaction costs ) 168.7
Purchase of treasury shares (2.4)
Dividends paid to non-controlling interest (5.8)
Net cash from (used in) financing activities 114.5
Net increase (decrease) in cash and cash equivalents 236.4
Cash and cash equivalents at 1 January 2015 368.9
Currency translation adjustments (30.4)
Cash and cash equivalents at 31 Dec 2015 574.9
Cash flow used investing activities:
Cash outflow mainly driven by customary capex requirements in-
line with the Group’s expectations
Total additional equipment purchased amounted to USD 88.4
million, mostly attributable to the Group’s MENA operations
The Group also sold equipment for a total of USD 11.8 million
during 2015
Cash flow used financing activities:
Net cash inflow primarily attributable to the issuance of new
shares on the Egyptian Exchange in March 2015
FY 2015 Results Commentary
Note: FY 2015 figures are based on audited financials; full financial statements are available on the corporate website
Important Notice and Disclaimer
This document has been provided to you for information purposes only. This document does not constitute an offer of, or an invitation to invest or deal
in, the securities of Orascom Construction Limited (the “Company”). The information set out in this document shall not form the basis of any contract
and should not be relied upon in relation to any contract or commitment. The issue of this document shall not be taken as any form of commitment on
the part of the Company to proceed with any negotiation or transaction.
Certain statements contained in this document constitute forward-looking statements relating to the Company, its business, markets, industry, financial
condition, results of operations, business strategies, operating efficiencies, competitive position, growth opportunities, plans and objectives of
management and other matters. These statements are generally identified by words such as "believe", "expect", “plan”, “seek”, “continue”, "anticipate",
"intend", "estimate", "forecast", "project", "will", "may" "should" and similar expressions. These forward-looking statements are not guarantees of future
performance. Rather, they are based on current plans, views, estimates, assumptions and projections and involve known and unknown risks,
uncertainties and other factors, many of which are outside of the Company's control and are difficult to predict, that may cause actual results,
performance or developments to differ materially from any future results, performance or developments expressed or implied from the forward-looking
statements.
The Company does not make any representation or warranty as to the accuracy of the assumptions underlying any of the statements contained herein.
The information contained herein is expressed as of the date hereof and may be subject to change. Neither the Company nor any of its controlling
shareholders, directors or executive officers or anyone else has any duty or obligation to supplement, amend, update or revise any of the forward-
looking statements contained in this document, whether as a result of new information, future events or otherwise, except as required by applicable
laws and regulations or by any appropriate regulatory authority.
Backlog and new contract awards are non-IFRS metrics based on management’s estimates of awarded, signed and ongoing contracts which have not
yet been completed, and serves as an indication of total size of contracts to be executed. These figures and classifications are unaudited, have not
been verified by a third party, and are based solely on management's estimates.

Contact Investor Relations: Hesham El Halaby [email protected] T: +971 4 318 0900 NASDAQ Dubai: OC EGX: ORAS
www.orascom.com