fy 2019 results february 4th, 2020 - corporate.ferrari.com...fy 2019 results february 4th, 2020 5...
TRANSCRIPT

1 FY 2019 Results February 4th, 2020
FY 2019 Results
February 4th, 2020

2 FY 2019 Results February 4th, 2020
SAFE HARBOUR STATEMENT
This document, and in particular the section entitled “2020 Guidance” contain forward-looking statements. These statements may include terms such as “may”, “will”, “expect”, “could”, “should”, “intend”, “estimate”, “anticipate”, “believe”, “continue”, “remain”, “on track”, “successful”, “grow”, “design”, “target”, “objective”, “goal”, “forecast”, “projection”, “outlook”, “prospects”, “plan”, “guidance” or similar terms. Forward-looking statements are not guarantees of future performance. Rather, they are based on the Group’s current expectations and projections about future events and, by their nature, are subject to inherent risks and uncertainties. They relate to events and depend on circumstances that may or may not occur or exist in the future and, as such, undue reliance should not be placed on them. Actual results may differ materially from those expressed in such statements as a result of a variety of factors, including: the Group’s ability to preserve and enhance the value of the Ferrari brand; the success of Ferrari’s Formula 1 racing team and the expenses the Group incurs for Formula 1 activities, as well as the popularity of Formula 1 more broadly; the Group’s ability to keep up with advances in high performance car technology and to make appealing designs for its new models; Group’s ability to preserve its relationship with the automobile collector and enthusiast community; changes in client preferences and automotive trends; changes in the general economic environment, including changes in some of the markets in which we operate, and changes in demand for luxury goods, including high performance luxury cars, which is highly volatile; competition in the luxury performance automobile industry; the Group’s ability to successfully carry out its growth strategy and, particularly, the Group’s ability to grow its presence in emerging market countries; the Group’s low volume strategy; reliance upon a number of key members of executive management, employees, and the ability of its current management team to operate and manage effectively; the performance of the Group’s dealer network on which the Group depend for sales and services; increases in costs, disruptions of supply or shortages of components and raw materials; disruptions at the Group’s manufacturing facilities in Maranello and Modena; the performance of the Group’s licensees for Ferrari-branded products; the Group’s ability to protect its intellectual property rights and to avoid infringing on the intellectual property rights of others; the ability of Maserati, the Group’s engine customer, to sell its planned volume of cars; continued compliance with customs regulations of various jurisdictions; the impact of increasingly stringent fuel economy, emissions and safety standards, including the cost of compliance, and any required changes to its products; the challenges and costs of integrating hybrid and electric technology more broadly into Group’s car portfolio over time; product warranties, product recalls and liability claims; the adequacy of its insurance coverage to protect the Group against potential losses; ability to ensure that its employees, agents and representatives comply with applicable law and regulations; ability to maintain the functional and efficient operation of its information technology systems, including our ability to defend from the risk of cyberattacks on our in-vehicle technology; the Group’s ability to service and refinance its debt; the Group’s ability to provide or arrange for adequate access to financing for its dealers and clients, and associated risks; labor relations and collective bargaining agreements; exchange rate fluctuations, interest rate changes, credit risk and other market risks; changes in tax, tariff or fiscal policies and regulatory, political and labor conditions in the jurisdictions in which the Group operates, including possible future bans of combustion engine cars in cities and the potential advent of self-driving technology; potential conflicts of interest due to director and officer overlaps with the Group’s largest shareholders and other factors discussed elsewhere in this document. The Group expressly disclaims and does not assume any liability in connection with any inaccuracies in any of the forward-looking statements in this document or in connection with any use by any third party of such forward-looking statements. Any forward-looking statements contained in this document speak only as of the date of this document and the Company does not undertake any obligation to update or revise publicly forward-looking statements. Further information concerning the Group and its businesses, including factors that could materially affect the Company’s financial results, is included in the Company’s reports and filings with the U.S. Securities and Exchange Commission, the AFM and CONSOB.

3 FY 2019 Results February 4th, 2020
2019 PERFORMANCE CONFIRMS STRONG MOMENTUM
Note:(1) Reconciliations to non-GAAP financial measures are provided in the Appendix
2019 record results met upgraded targets
Revenues up 10.1% and operating profitability up 14.0%. Adjusted diluted EPS(1) of €3.71 (+9.1%). Industrial free cash flow generation(1) of €675 million boosted by advances on the Ferrari Monza SP1 and SP2
Rewarding shareholders: €195 million of dividend distribution and share repurchase program of €387 million executed in 2019
Unveiled the Ferrari Roma in November to complete the 5 launches of the year
Finalized and announced Brand Diversification strategy
Brand Finance Global 500 names Ferrari as the world’s strongest brand for second consecutive year in 2020
2020 GUIDANCE UPGRADING PREVIOUS PLAN ACROSS ALL METRICS

4 FY 2019 Results February 4th, 2020
EXPANDING THE FAMILY OF FERRARISTI
2 NEW MODELS TO BE LAUNCHED IN 2020

5 FY 2019 Results February 4th, 2020
825
917
FY '18
FY '19
375
675
FY '18
FY '19
3,420
3,766
FY '18
FY '19
9,251
10,131
FY '18
FY '19
FY 2019 HIGHLIGHTS
Note: (1) Reconciliations to non-GAAP financial measures are provided in the Appendix (2) Refer to notes to the presentation in the Appendix
Results reflect IFRS 16 (first time adoption, simplified approach). Certain totals in the tables included in this document may not add due to rounding.
33.7%
32.6%
SHIPMENTS(2)
(UNITS)
+9.5%
NET REVENUES
(€M)
+10.1%
ADJUSTED EBITDA(1)
(€M and margin %)
+14.0%
INDUSTRIAL FREE CASH FLOW(1)
(€M)
+80.0%
+11.2%
ADJUSTED EBIT(1)
(€M and margin %)
*€17 million due to positive impact from IFRS 16 (first time adoption, simplified approach)
3.40
3.71
FY '18
FY '19
+9.1%
ADJUSTED DILUTED EARNINGS PER SHARE(1)
(€)
24.4%
24.1% 1,114
1,269*
FY '18
FY '19

6 FY 2019 Results February 4th, 2020
FY 2019 – SHIPMENTS(2)
Note: (2) (3) Refer to notes to the presentation in the Appendix
CONTROLLING GROWTH ACROSS GEOGRAPHIES
AMERICAS -3.3% (29% vs. 32% PY) EMEA +15.8%
(48% vs. 46% PY)
REST OF APAC +12.9% (15% vs. 14% PY)
MAINLAND CHINA,
HONG KONG AND
TAIWAN +20.3% (8% vs. 8% PY)
Total shipments increased by 880 units (+9.5% vs.
PY) supported by an 11.2% increase in V8 models
and a 4.6% one in V12 models:
Robust deliveries for the Ferrari Portofino and the
812 Superfast
Initial deliveries of the Ferrari Monza SP1 and SP2
as well as of the F8 Tributo in H2 2019
The 488 GTB and the 488 Spider concluded their
lifecycle, partially offset by the 488 Pista and the
ramp up of the 488 Pista Spider
Deliberate geographical rebalancing driven by
product phase-in pace and waiting lists
SHIPMENTS BY REGION(3)
(FY 2019 vs. FY 2018) SHIPMENTS BREAKDOWN
(FY 2019)
SPORT & SPECIAL SERIES 64%
ICONA <1%
GT 36%
V12 24%
V8 76%

7 FY 2019 Results February 4th, 2020
2,535 2,5362,876 2,926
284 284198 198506 508530 53895 95101 104
(86)3
340 22 6 61
FY 2018 FX hedges FY
2018
FY 2018 w/o FX
hedges
Cars and spare
parts
Engines Sponsorship,
commercial
and brand
Other FY 2019 at
constant
currency 2018
Change in FX
2018 vs. 2019
& FX hedges
FY 2019
FY 2019
Cars and spare parts Engines Sponsorship, commercial and brand Other
3,4203,766
(€M)
(4)
(5)
(6)
(7)
+13.4% -30.3% +4.3% +6.4%
3,705
(8)
3,423
NET REVENUES BRIDGE FY 2018 – 2019
Cars and spare parts: growth reflecting
volume increase of the 488 Pista and
488 Pista Spider, the Ferrari Portofino,
the 812 Superfast and the initial
deliveries of the F8 Tributo. Positive
contribution also from the Ferrari
Monza SP1 and SP2 and
personalization programs. This was
partially offset by lower sales of the 488
GTB and the 488 Spider, as well as prior
year shipments of LaFerrari Aperta and
the Ferrari J50.
Engines: reflecting lower shipments to
Maserati
Sponsorship, commercial and brand:
higher revenues from Formula 1 racing
activities
Currency: net positive impact from
translation, transaction and hedges,
mainly USD
+10.1%, +€346 million
+8.2%, +€282 million at constant currency(8)
Note: (4) (5) (6) (7) (8) Refer to notes to the presentation in the Appendix

8 FY 2019 Results February 4th, 2020
(€M)
Adj. EBITDA Adj. EBITDA at
Adj. EBITDA w/o FX hedges constant curr. 2019(8) Adj. EBITDA
1,114 1,117 1,222 1,269
32.6% 32.6% 33.0% 33.7%
828 870
(94) (20) (21)
825 3 99 78
47 917
Adj. EBIT FY
2018
FX hedges
FY 2018
Adj. EBIT FY
2018 w/o FX
hedges
Vol. Mix / Price Ind. Costs /
R&D
SG&A Other Adj. EBIT FY
2019 at
constant
currency 2018
Change in FX
2018 vs. 2019
& FX hedges
FY 2019
Adj. EBIT FY
2019
Margin
24.1%
Margin
24.4%
Margin
23.5%
Margin
24.2%
(8)
ADJ. EBIT BRIDGE FY 2018 – 2019(1)
Volume reflecting shipments increase
Mix / price performance due primarily to the initial deliveries of the Ferrari Monza SP1 and SP2 along with the impact of personalization programs, partially offset by a negative
range product mix as well as prior year shipments of LaFerrari Aperta and the Ferrari J50
Industrial costs / R&D grew mainly due to product innovation activities and Formula 1, higher operational startup expenses in connection with the introduction of new models as
well as higher depreciation and amortization of fixed assets
SG&A increased mainly due to new product launches as well as to support the Company’s organizational development
Other decreased due to lower engine sales to Maserati and other supporting activities
Note: (1) Reconciliations to non-GAAP financial measures are provided in the Appendix.
(8) Refer to notes to the presentation in the Appendix

9 FY 2019 Results February 4th, 2020
Industrial Free Cash Flow Change in Net Industrial Debt Industrial Free Cash Flow
(€M) (€M)
∆ vs. FY '18 +153 +168 +47 (68) +300 +300 (59) (287) +4 (63)
1,251
675
Adj. EBITDA
(Industrial
Activities, only)
FY 2019
∆ in working
capital,
provisions &
other
Cash interest &
Taxes
Capex Industrial FCF
FY 2019
176
(706)
(46) (370) (337)
December 31,
2018
Net Industrial
Debt
Industrial FCF Dividends FY 2019 Share
repurchases
Currency and
other
Lease liabilities
as per IFRS 16
December 31,
2019
Net Industrial
Debt
675
(195)
3
(387)
(63)
INDUSTRIAL FCF(1) AND NET INDUSTRIAL DEBT(1) BRIDGES DEC 31, 2018 – DEC 31, 2019
Note: (1) Reconciliations to non-GAAP financial measures are provided in the Appendix
(9) Refer to notes to the presentation in the Appendix
(9)
Strong collection of advances on the Ferrari Monza SP1 and SP2
Patent Box benefit
Phasing of some infrastructural investments between 2019 and 2020

10 FY 2019 Results February 4th, 2020
2020 GUIDANCE UPGRADING PREVIOUS PLAN ACROSS ALL METRICS
Note: (10) Calculated using the weighted average diluted number of common shares as of June 30, 2018
(11) Calculated using the diluted number of common shares as of December 31, 2019 (186,052 thousand)
2020 2020
(€B, unless otherwise stated) PLAN GUIDANCE
NET REVENUES >3.8 >4.1
>1.3 1.38-1.43~34% ≥34%
>0.9 0.95-1.0~24% ~24%
ADJ. DILUTED EPS (€) >3.40(10)
3.90-3.95(11)
IND. FCF >0.4 ≥0.4
ADJ. EBITDA (margin %)
ADJ. EBIT (margin %)
11 FY 2019 Results February 4th, 2020
APPENDIX

12 FY 2019 Results February 4th, 2020
NOTES TO THE PRESENTATION
1. Reconciliations to non-GAAP financial measures are provided in the
Appendix
2. Excluding the XX Programme, racing cars, Fuori Serie, one-off and pre-
owned cars
3. Shipments geographical breakdown
EMEA includes: Italy, UK, Germany, Switzerland, France, Middle East
(includes the United Arab Emirates, Saudi Arabia, Bahrain, Lebanon,
Qatar, Oman and Kuwait) and Rest of EMEA (includes Africa and the
other European markets not separately identified);
Americas includes: United States of America, Canada, Mexico, the
Caribbean and Central and South America;
Rest of APAC mainly includes: Japan, Australia, Singapore, Indonesia,
South Korea, Thailand and Malaysia
4. Includes the net revenues generated from shipments of our cars,
including any personalization revenue generated on these cars and
sales of spare parts
5. Includes the net revenues generated from the sale of engines to
Maserati and the revenues generated from the rental of engines to other
Formula 1 racing teams
6. Includes the net revenues earned by our Formula 1 racing team through
sponsorship agreements and our share of the Formula 1 World
Championship commercial revenues and net revenues generated
through the Ferrari brand, including merchandising, licensing
and royalty income
7. Primarily includes the interest income generated by our financial
services activities and the net revenues from the management of the
Mugello racetrack
8. The constant currency presentation eliminates the effects of changes in
foreign currency (transaction and translation) and of foreign currency
hedges
9. Net Industrial Debt redefined as Net Debt less Net Debt of Financial
Services Activities
10. Calculated using the weighted average diluted number of common
shares as of June 30, 2018
11. Calculated using the diluted number of common shares as of December
31, 2019 (186,052 thousand)

13 FY 2019 Results February 4th, 2020
Model / Year of delivery 2005 2006 2007 2008 2009 2010 2011 2012 2013 2014 2015 2016 2017 2018 2019 2020
SPORT RANGE
F430
F430 Spider
599 GTB Fiorano
458 Italia
458 Spider
F12berlinetta
488 GTB
488 Spider
812 Superfast
F8 Tributo
SF90 Stradale
812 GTS
F8 Spider
GRAN TURISMO RANGE
612 Scaglietti
California
FF
California 30
California T
GTC4Lusso
GTC4Lusso T
Portofino
Roma
STRONG TRACK-RECORD IN NEW MODELS INTRODUCTION Range models introduced or announced
14 FY 2019 Results February 4th, 2020
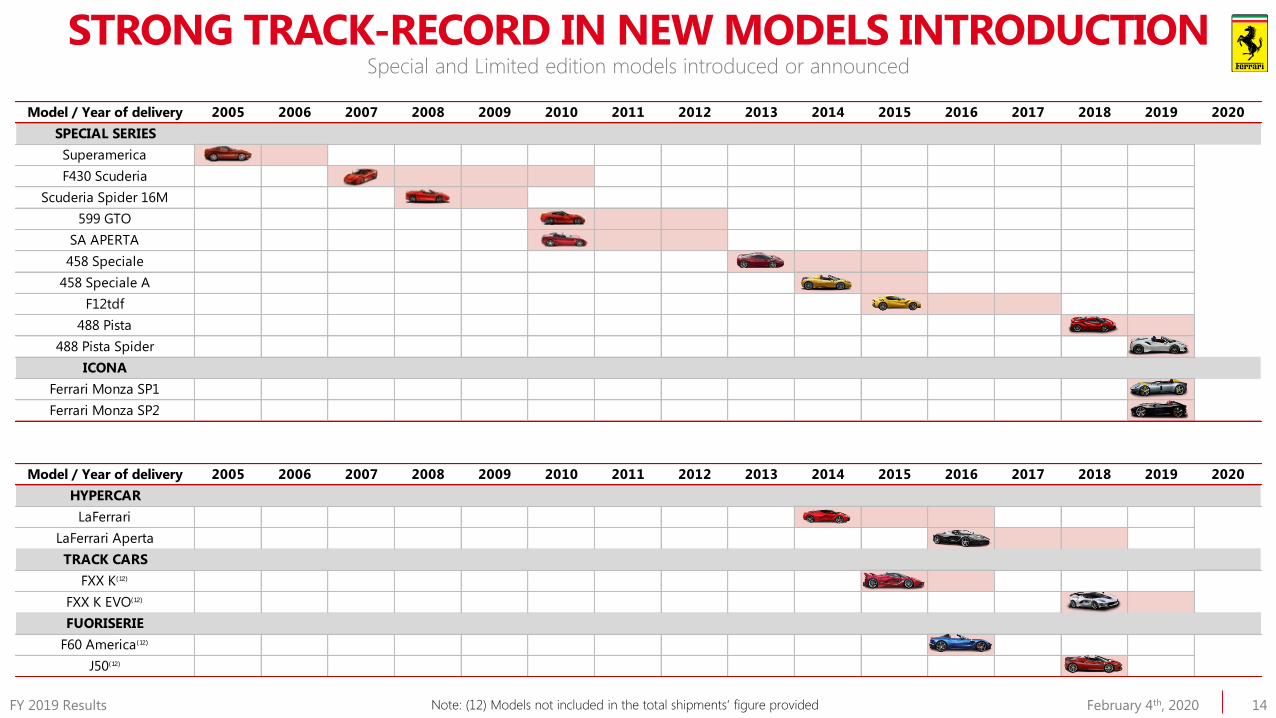
Model / Year of delivery 2005 2006 2007 2008 2009 2010 2011 2012 2013 2014 2015 2016 2017 2018 2019 2020
SPECIAL SERIES
Superamerica
F430 Scuderia
Scuderia Spider 16M
599 GTO
SA APERTA
458 Speciale
458 Speciale A
F12tdf
488 Pista
488 Pista Spider
ICONA
Ferrari Monza SP1
Ferrari Monza SP2
Model / Year of delivery 2005 2006 2007 2008 2009 2010 2011 2012 2013 2014 2015 2016 2017 2018 2019 2020
HYPERCAR
LaFerrari
LaFerrari Aperta
TRACK CARS
FXX K(12)
FXX K EVO(12)
FUORISERIE
F60 America(12)
J50(12)
STRONG TRACK-RECORD IN NEW MODELS INTRODUCTION Special and Limited edition models introduced or announced
Note: (12) Models not included in the total shipments’ figure provided

15 FY 2019 Results February 4th, 2020
4,2274,895
3,000
2,900
695
8361,329
1,5009,251
10,131
FY 2018 FY 2019
1,046
1,348
811
605
173 60
368 363
2,398 2,376
Q4 2018 Q4 2019
GROUP SHIPMENTS BY REGION(2)(3)
Note: (2) (3) Refer to notes to the presentation in the Appendix
Graphs not to scale.
-0.9%
Americas EMEA Mainland China, Hong Kong and Taiwan Rest of APAC
+302
+28.9%
-206
-25.4%
-113
-65.3%
-5
-1.4%
+668
+15.8%
-100
-3.3%
+141
+20.3.%
+171
+12.9%
+9.5%

16 FY 2019 Results February 4th, 2020
DEBT AND LIQUIDITY POSITION
Net Industrial Debt (€M)
(*) Not including lease liabilities
Certain totals in the tables included in this document may not add due to rounding
Gross Debt Maturity Profile(*) (€M) Cash and Marketable Securities (€M)
Net Industrial Debt (€M)
(€M) 2019 2018 2017 2016
Debt (2,090) (1,927) (1,806) (1,848)
Cash & Cash Equivalents (A) 898 794 648 458
Net Debt (1,192) (1,133) (1,158) (1,390)
Net Debt of Financial Services Activities (855) (763) (650) (700)
Net Industrial Debt (337) (370) (508) (690)
Undrawn Committed Credit Lines (B) 350 500 500 500
Total Available Liquidity (A+B) 1,248 1,294 1,148 958
At Dec. 31
(€M) 2019 2018 2017 2016
Euro 690 616 435 318
Chinese Yuan 110 73 62 58
US Dollar 63 50 88 16
Japanese Yen 12 24 26 37
Other Currencies 23 31 37 29
Total (€ equivalent) 898 794 648 458
(1,192)
(337)
(854)
December 31, 2019 Net Industrial Debt
Net Debt of Financial Services Activities
December 31, 2019 Net Debt
(1,192)
(337)
(855)
December 31, 2019
Net Industrial Debt
Net Debt of Financial
Services Activities
December 31, 2019
Net Debt
Cash Maturities
500385
150 150338
277
141
3233
371
777
141
417
150 150
2020 2021 2022 2023 2029 2031
Bond / Notes (USPP) US Securitizations Other Financial Liabilities

17 FY 2019 Results February 4th, 2020
Q4 '19 Q4 '18 €M FY '19 FY '18
253 236 Capital expenditures 706 639
102 102 of which capitalized development costs (13) (A) 330 318
136 131 Research and development
costs expensed (B)559 528
238 233 Total research and development (A+B) 889 846
46 30 Amortization of capitalized
development costs (C)140 115
182 161 Research and development costs as recognized
in the consolidated income statement (B+C)699 643
Certain totals in the tables included in this document may not add due to rounding
CAPEX AND R&D
Note: (13) Capitalized as intangible assets

18 FY 2019 Results February 4th, 2020
non-GAAP FINANCIAL MEASURES
Operations are monitored through the use of various non-GAAP
financial measures that may not be comparable to other similarly
titled measures of other companies.
Accordingly, investors and analysts should exercise appropriate
caution in comparing these supplemental financial measures to
similarly titled financial measures reported by other companies.
We believe that these supplemental financial measures provide
comparable measures of our financial performance which then
facilitate management’s ability to identify operational trends, as well
as make decisions regarding future spending, resource allocations
and other operational decisions.
Reconciliations are only provided to the most directly comparable
IFRS financial statement line item for Adjusted EBITDA, Adjusted EBIT
and Adjusted EPS diluted for historical periods, as the income or
expense excluded from these non-GAAP financial measures in
accordance with our policy are, by definition, not predictable and
uncertain.
Total Net Revenues, EBITDA, adj. EBITDA, EBIT and adj. EBIT at constant currency eliminate
the effects of changes in foreign currency (transaction and translation) and of foreign
currency hedges.
EBITDA is defined as net profit before income tax expense, net financial expenses and
depreciation and amortization. Adjusted EBITDA is defined as EBITDA as adjusted for
certain income and costs which are significant in nature, expected to occur infrequently,
and that management considers not reflective of ongoing operational activities.
Adjusted Earnings Before Interest and Taxes (“Adjusted EBIT”) represents EBIT as adjusted
for certain income and costs which are significant in nature, expected to occur
infrequently, and that management considers not reflective of ongoing operational
activities.
Adjusted net profit represents net profit as adjusted for certain income and costs (net of
tax effect) which are significant in nature, expected to occur infrequently, and that
management considers not reflective of ongoing operational activities.
Adjusted earnings per share diluted represents earnings per share as adjusted for certain
income and costs (net of tax effect) which are significant in nature, expected to occur
infrequently, and that management considers not reflective of ongoing operational
activities.
Net Industrial Debt is defined as total Debt less Cash and cash equivalents (Net Debt),
further adjusted to exclude the debt and cash and cash equivalents related to our financial
services activities (Net Debt of Financial Services Activities).
Free Cash Flow is defined as cash flows from operating activities less investments in
property, plant and equipment and intangible assets. Free Cash Flow from Industrial
Activities is defined as Free Cash Flow adjusted to exclude the operating cash flow from
our financial services activities (Free Cash Flow from Financial Services Activities).
non-GAAP financial measures

19 FY 2019 Results February 4th, 2020
Q4 '19 Q4 '18 €M, unless otherwise stated FY '19 FY '18
927 845 Net revenues 3,766 3,420
333 274 EBITDA 1,269 1,115
- - Adjustments - (1)
333 274 Adjusted EBITDA 1,269 1,114
328 271 of which Adj. EBITDA (Industrial Activities, only) 1,251 1,098
114 79 Amortization and depreciation 352 289
219 195 EBIT 917 826
219 195 Adjusted EBIT 917 825
10 8 Net financial expenses 42 23
209 187 Profit before taxes 875 803
43 (4) Income tax expense / (benefit) 176 16
20.8% n.m. Effective tax rate 20.2% 2.0%
166 191 Net profit 699 787
- - Adjustments - (142)
166 191 Adjusted net profit 699 645
0.90 1.01 Basic EPS (€) 3.73 4.16
0.90 1.00 Diluted EPS (€) 3.71 4.14
0.90 1.01 Adjusted Basic EPS (€) 3.73 3.41
0.90 1.00 Adjusted Diluted EPS (€) 3.71 3.40
Certain totals in the tables included in this document may not add due to rounding
KEY PERFORMANCE METRICS AND RECONCILIATIONS OF non-GAAP MEASURES
20 FY 2019 Results February 4th, 2020
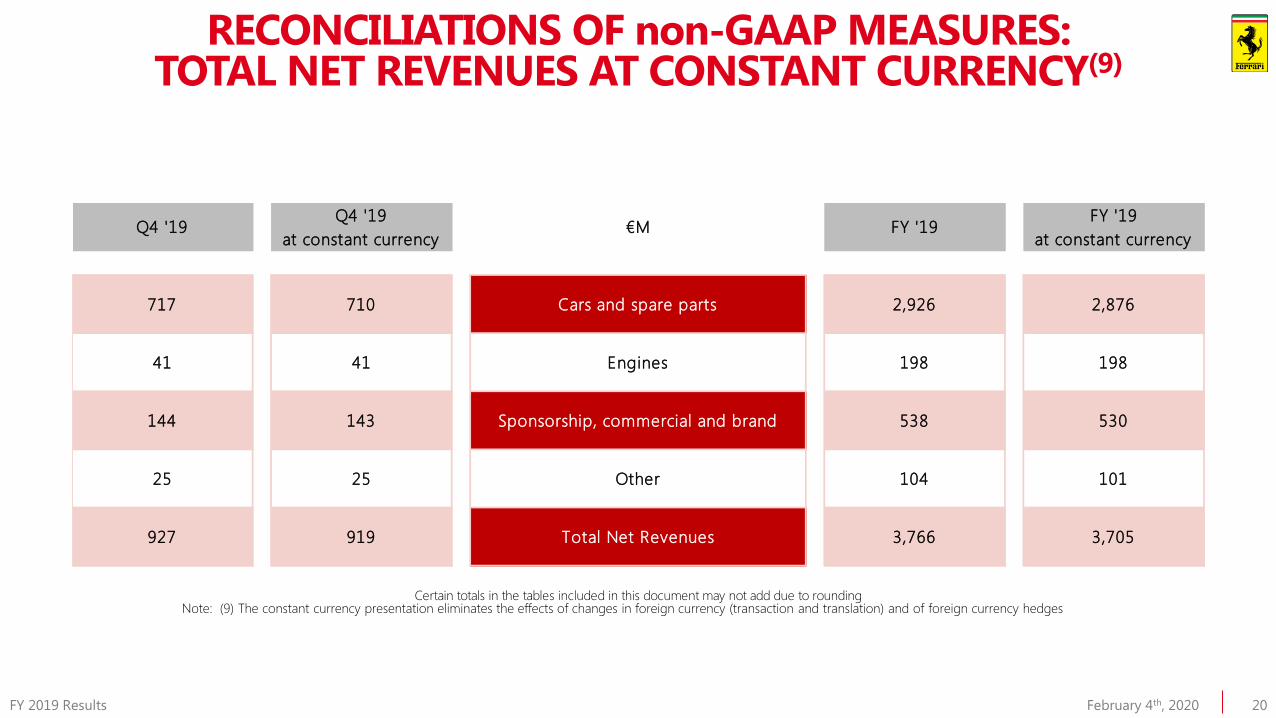
Q4 '19 FY '19
at constant currency at constant currency
717 710 Cars and spare parts 2,926 2,876
41 41 Engines 198 198
144 143 Sponsorship, commercial and brand 538 530
25 25 Other 104 101
927 919 Total Net Revenues 3,766 3,705
Certain totals in the tables included in this document may not add due to rounding
€MQ4 '19 FY '19
RECONCILIATIONS OF non-GAAP MEASURES: TOTAL NET REVENUES AT CONSTANT CURRENCY(9)
Note: (9) The constant currency presentation eliminates the effects of changes in foreign currency (transaction and translation) and of foreign currency hedges
21 FY 2019 Results February 4th, 2020
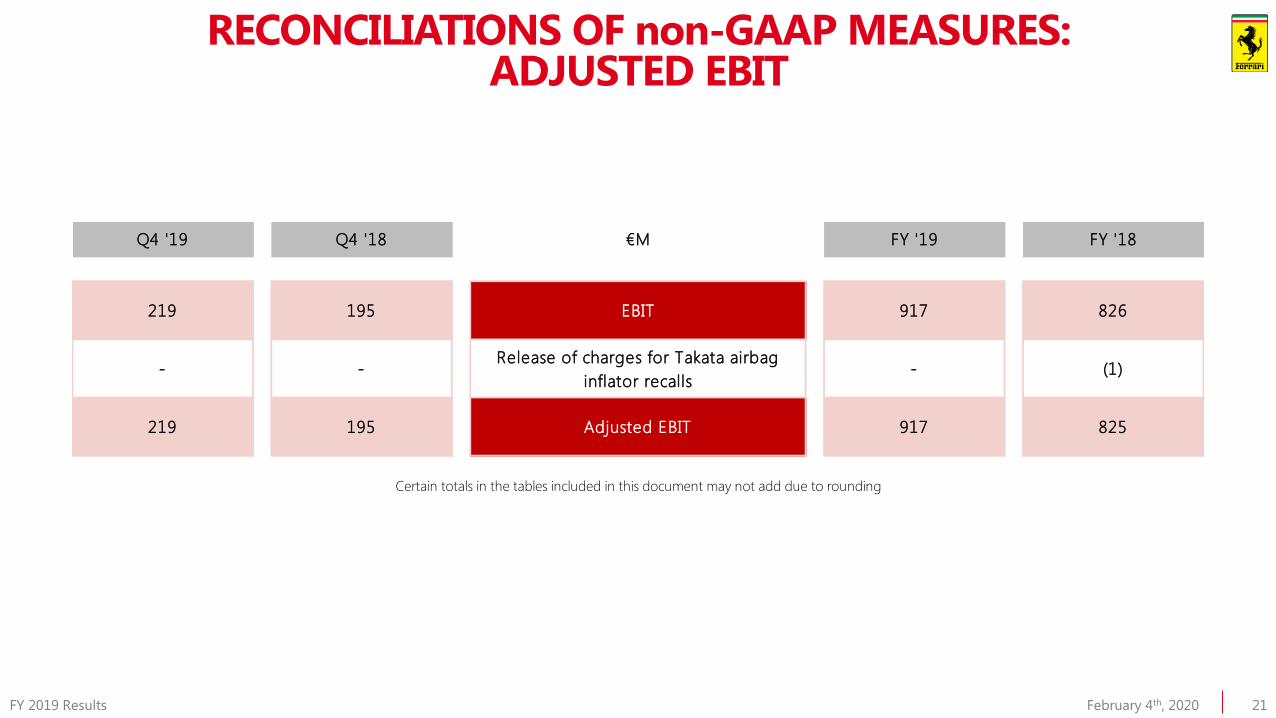
Q4 '19 Q4 '18 €M FY '19 FY '18
219 195 EBIT 917 826
- -Release of charges for Takata airbag
inflator recalls- (1)
219 195 Adjusted EBIT 917 825
Certain totals in the tables included in this document may not add due to rounding
RECONCILIATIONS OF non-GAAP MEASURES: ADJUSTED EBIT

22 FY 2019 Results February 4th, 2020
Q4 '19 Q4 '18 €M FY '19 FY '18
333 274 EBITDA 1,269 1,115
- -Release of charges for Takata airbag
inflator recalls- (1)
333 274 Adjusted EBITDA 1,269 1,114
Certain totals in the tables included in this document may not add due to rounding
RECONCILIATIONS OF non-GAAP MEASURES: ADJUSTED EBITDA

23 FY 2019 Results February 4th, 2020
Q4 '19 Q4 '18 €M FY '19 FY '18
166 191 Net profit 699 787
- -Patent Box benefit
for the period 2015-2017- (141)
- -Release of charges for Takata airbag
inflator recalls (net of tax effect)- (1)
166 191 Adjusted net profit 699 645
Certain totals in the tables included in this document may not add due to rounding
RECONCILIATIONS OF non-GAAP MEASURES: ADJUSTED NET PROFIT

24 FY 2019 Results February 4th, 2020
Q4 '19 Q4 '18 €M, unless otherwise stated FY '19 FY '18
167 190 Net profit attributable to owners
of the Company696 785
185,492 188,294 Weighted average number of common
shares (thousand)186,767 188,606
0.90 1.01 Basic EPS (€) 3.73 4.16
186,260 189,081
Weighted average number of common
shares for diluted earnings per common
share (thousand)
187,535 189,394
0.90 1.00 Diluted EPS (€) 3.71 4.14
Certain totals in the tables included in this document may not add due to rounding
BASIC AND DILUTED EPS
Note: For the three and twelve months ended December 31, 2019 and 2018 the weighted average number of common shares for diluted earnings per share was increased to take into consideration
the theoretical effect of the potential common shares that would be issued under the Company’s equity incentive plans (assuming 100 percent of the related awards vested).

25 FY 2019 Results February 4th, 2020
Q4 '19 Q4 '18 € per common share FY '19 FY '18
0.90 1.01 Basic EPS 3.73 4.16
- -Patent Box benefit
for the period 2015-2017- (0.74)
- -Release of charges for Takata
airbag inflator recalls (net of tax effect)- (0.01)
0.90 1.01 Adjusted EPS 3.73 3.41
0.90 1.00 Diluted EPS 3.71 4.14
- -Patent Box benefit
for the period 2015-2017- (0.74)
- -Release of charges for Takata
airbag inflator recalls (net of tax effect)- (0.01)
0.90 1.00 Adjusted diluted EPS 3.71 3.40
Certain totals in the tables included in this document may not add due to rounding
RECONCILIATIONS OF non-GAAP MEASURES: ADJUSTED EPS

26 FY 2019 Results February 4th, 2020
Q4 '19 Q4 '18 €M FY '19 FY '18
357 315 Cash flow from operating activities 1,306 934
(253) (236)Investments in property, plant and
equipment and intangible assets(706) (639)
104 79 Free Cash Flow 600 295
(12) (32)Free Cash Flow from Financial Services
Activities(75) (80)
116 111 Free Cash Flow from Industrial
Activities(14)675 375
Certain totals in the tables included in this document may not add due to rounding
RECONCILIATIONS OF non-GAAP MEASURES: FREE CASH FLOW AND FREE CASH FLOW
FROM INDUSTRIAL ACTIVITIES
Note: (14) Free Cash Flow from Industrial Activities for the three and twelve months ended December 31, 2018, include Euro 1 million of quick refund to shareholders due to eligibility for withholding exemption

27 FY 2019 Results February 4th, 2020
RECONCILIATIONS OF non-GAAP MEASURES: NET INDUSTRIAL DEBT
€M December 31, 2019 December 31, 2018 December 31, 2017 December 31, 2016
Debt 2,090 (1,927) (1,806) (1,848)
of which: Lease liabilities as per IFRS 16
(simplified approach)60 - - -
Cash and cash equivalents 898 794 648 458
Net Debt (1,192) (1,133) (1,158) (1,390)
Net Debt of Financial Services Activities (855) (763) (650) (700)
Net Industrial Debt (337) (370) (508) (690)
Certain totals in the tables included in this document may not add due to rounding