fy 2016 results - constructeur automobile français · fy 2016 results 23 february 2017 . ... net...
TRANSCRIPT

FY 2016 RESULTS 23 February 2017

DISCLAIMER
This presentation does not constitute an offer to sell, or a solicitation of an offer to buy, PEUGEOT SA
(“Company”) shares.
This presentation may contain forward-looking statements. Such forward-looking statements do not
constitute forecasts regarding the Company’s results or any other performance indicator, but rather trends
or targets, as the case may be. These statements are by their nature subject to risks and uncertainties as
described in the registration document filed with the French Autorité des Marchés Financiers (AMF). These
statements do not reflect future performance of the Company, which may materially differ.
The Company does not undertake to provide updates of these statements.
More comprehensive information about PSA Group may be obtained on the Group website (www.groupe-
psa.com), under Regulated Information.
2

Recurring Operating Margin*
Automotive Division
Worldwide Unit Sales** (in millions)
Free Cash Flow (€bn)
2016***
6% 3.15 + 2.7
** Assembled Vehicles, CKDs and vehicles under license
* Recurring operating income related to Revenue - Detail in attachment *** FCF for Sales & Manufacturing companies
* Recurring Operating Income related to Revenue ** Assembled Vehicles, CKDs and vehicles under license - Detail in attachment *** FCF for Sales & Manufacturing companies
2014 2015 2016
1.8
5.4
8.1
2014 2015 2016
0.2%
5.0% 6.0%
2014 2015 2016
2.9 3.0
3.15
-2.8%
2013
2013
2.8
2013
-1.0
For the 3rd year in a row : ROI UP, Volumes UP, Positive FCF
Worldwide Unit Sales**
(in millions)
Cumulated Free Cash Flow (€bn) Since end 2013
Recurring Operating Margin*
Automotive Division
MINDSET CHANGE
MERITOCRACY COMPETITIVE
MINDSET
BUSINESS
SENSE
ROADMAP FOR PROFITABLE GROWTH
5

SUSTAINABLE PERFORMANCE - OPERATIONAL OUTLOOK IMPROVED
* Recurring Operating Income related to Revenue ** At constant (2015) exchange rates
6
Deliver 10% Group Revenue growth by 2018** vs 2015,
and target additional 15% by 2021**
Deliver over 4.5% Automotive Recurring Operating Margin*
on average in 2016-2018, and target 6% by 2021
AUTOMOTIVE RECURRING OPERATING MARGIN GROUP REVENUE
average over 2016-2018
>4.5% by 2021
6% by 2018** vs 2015
+10% by 2021** vs 2015
+25%

FINANCIAL
RESULTS
7

FINANCIAL RESULTS : NET INCOME GROUP SHARE x 2
2015 2016 Change
Revenue 54,676 54,030 (646)
Recurring Operating Income 2,733 3,235 502
% of revenue 5.0% 6.0%
Non–recurring operating income and (expenses) (757) (624) 133
Operating income 1,976 2,611 635
Net financial income (expenses) (642) (268) 374
Income taxes (706) (517) 189
Share in net earnings of companies at equity* 437 128 (309)
Net result from operations to be continued in partnership* 137 195 58
Consolidated net income / (loss) 1,202 2,149 947
Net income, Group Share 899 1,730 831
In million Euros
8 * see detail in attachments

2015 2016
GROUP REVENUE : +2.1 % AT CONSTANT EXCHANGE RATES
In million Euros
Group*
+1.6 % +2.7 % +2.1 %
Faurecia Automotive Division
2015 2016 2015 2016
37,514
54,676 54,030
18,770 18,710
37,066
-1.2% -1.2% -0.3%
At constant
Exchange
Rates**
9 * Breakdown in attachment
** At constant (2015) exchange rates

AUTOMOTIVE REVENUE ANALYSIS
2015 2016
Product
Mix FX Others*
Volume &
Country Mix Price
-3.8% +2.0% -1.5% -0.1%
37,066
Sales to
Partners
variation: -1.2%
In million Euros
+2.3%
37,514
+0.0%
10 * accounting treatment of buy-back commitment, short term rental

Total ConsolidatedWorldwide Sales*
Europe China& SE Asia
Middle East& Africa**
Latin America India & Pacific Eurasia
CONSOLIDATED WORLDWIDE SALES*
2015
2016
+5.8% +3.6% +112.8% -16.0% +17.1% -16.4% -12.6%
Volumes*
2,973 3,146
1,864 1,930
736 618
180 157 184
12 10 24 20
384
In thousands of units
* Assembled vehicles, CKDs and vehicles under license
** o/w 233 kunits sold under Peugeot license in 2016 following the final JV agreement signed with Iran Khodro on 21 June 2016

2015 20162015 20162015 2016
GROUP RECURRING OPERATING INCOME & MARGIN
In million Euros
Group* Faurecia Automotive Division
1,871
2,733
3,235
830
970
2,225
+18%
12 * Breakdown in attachment
+19%
+17%
5.0% Margin
6.0% Margin
6.0% Margin
5.2% Margin
5.0% Margin
4.4% Margin

AUTOMOTIVE RECURRING OPERATING INCOME ANALYSIS
(255)
Market Demand
Input Costs*
Forex & Other
+59
Product Mix
+365
Price & Product
Enrichment
(838)
Market Share/
Country Mix
+89
Production & Procurement*
SG&A Expenses
+625
R&D* Others
+238
Operating Environment
(448)
Performance
+802
+331
2015 2016
(51) (209)
+1,871
+2,225
In million Euros
13
* IAS 36 on Automotive Division impact: -€102M in 2016, registered on production & procurement, R&D and input costs
2015 20162015 20162015 2016
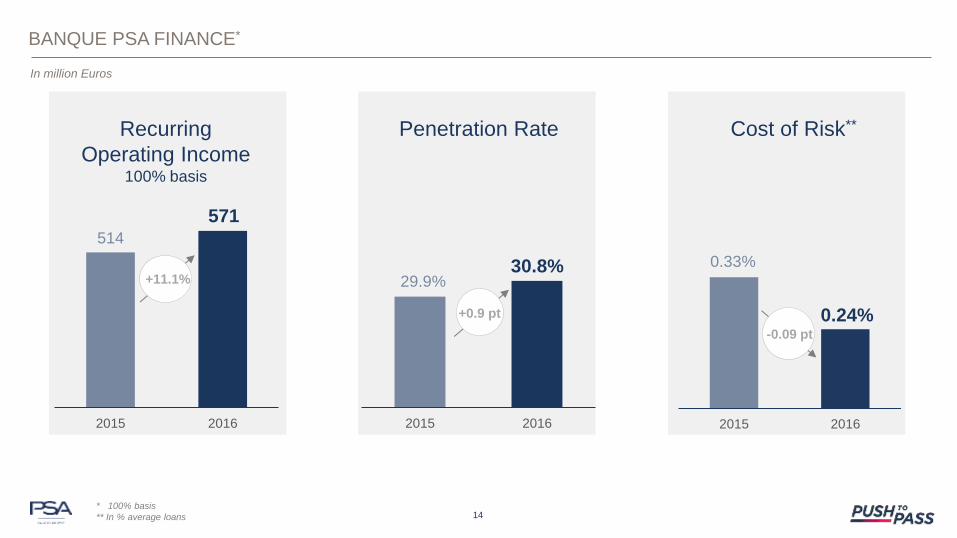
514
571
30.8% 0.33%
0.24%
BANQUE PSA FINANCE*
29.9%
Recurring
Operating Income 100% basis
Penetration Rate Cost of Risk**
In million Euros
+11.1%
+0.9 pt
-0.09 pt
14 * 100% basis
** In % average loans

2015 20162015 2016 2015 2016
18,770 18,710
970
FAURECIA
830
Net Financial Position*:
(475) M€
1,011
191
-0.3%
+17%
x 5.3
In million Euros
Revenue Recurring Operating
Income Free Cash Flow
15 * End December 2016
5.2% Margin
4.4% Margin

CASH FLOW ANALYSIS*
+4,560 o/w Faurecia
(1,026)
(2,673)
o/w Faurecia
(389)**
Cash Flow
Trade Receivables
Trade Payables
Other Change in WCR
Capex & Capitalised R&D
BPF Dividends
Inventories Restruct. Others***
Auto End 2015
Net Financial Position
Net Financial Position
(631) +5,097 +434 (445)
+6,813 o/w Faurecia
(475)
End 2016
Free Cash Flow : +2,698
(365) +291 +389
Faurecia Auto
Faurecia Auto
In million Euros
+156
16
Change in working capital : +471
* Manufacturing and Sales Companies
** Including €604M from Faurecia Automotive Exteriors sale
*** Including warrants exercised (+ € 330 M), operations held for sale (-€255M), conversion differences (-€196M) & dividends to Faurecia minority interests (-€123M)
16

RIGHTSIZED INVENTORIES
243 307
107
99
End 2015 End 2016
406
350
Independent dealership inventory
Group inventory
In thousands of new vehicles*
17 * World figures excluding China

OUTLOOK
2017 Market Outlook Operational Outlook
CHINA
+ 5%
EUROPE
stable
LATIN AMERICA
stable
RUSSIA
stable
Deliver over 4.5% Automotive Recurring
Operating Margin* on average
in 2016-2018, and target 6% by 2021
Deliver 10% Group Revenue growth
by 2018** vs 2015,
and target additional 15% by 2021**
18 * Recurring Operating Income related to Revenue
** At constant (2015) exchange rates

PUSH TO PASS
HIGHLIGHTS
19

20
A COMPETITIVE TEAM TO CHALLENGE BENCHMARKS
DIGITAL BOOSTER
PSA GROUP 2021
FROM TURNAROUND TO PROFITABLE SUSTAINABLE GROWTH
A CUSTOMER DRIVEN TRANSFORMATION
A MOBILITY PROVIDER For a lifetime customer relationship
A GREAT CAR MAKER With cutting edge efficiency

A GREAT CAR MAKER
C U T T I N G E D G E E F F I C I E N C Y
CORE MODEL
& TECHNO
STRATEGY
QUALITY
FIRST
BRAND
POWER
CORE
EFFICIENCY
NEW
FRONTIERS
21

Push to Pass Roadmap
-23 -20
-16 -12
-4
2013 2014 2015 2016 2018 2021
Industrial Right-First Time-Through(3) vs benchmark
QUALITY FIRST – UNCOMPROMISING ATTITUDE
1st
2nd
2 cars among
7 finalists RV New 3008 +10 pts vs previous 3008 at launch
Top 5 - Customer satisfaction
(1)
(2)
22
PRODUCTS
SERVICES Push to Pass Roadmap
- 18 - 16
- 14 - 13
- 7
2013 2014 2015 2016 2018 2021
Aftersales customer recommendation(4)
vs benchmark
0
0
(1) Aftersales - Source : J.D. Power survey published mid 2016
(2) New vehicles - Source : External & Internal Survey
(3) Source : internal wordlwide average in points vs benchmark
(4) Source : internal customer feedback in points vs benchmark

2
14 23
31 1
1
2
H1 H2 H1 H2
CORE MODEL STRATEGY – PRODUCT BLITZ ON TRACK
Cumulated local launches across 6 regions
Rich product momentum as planned
Cumulated regional launches
Vehicles sold to partners
2016 2017
7 global core models launched by end 2017 Out of 34 planned over 2016 - 2021
31 regional launches by end 2017 Out of 121 planned over 2016 - 2021
C-SUV B-SUV
Peugeot 5008
Peugeot Expert Citroën Jumpy
Peugeot 3008
Citroën C3
23
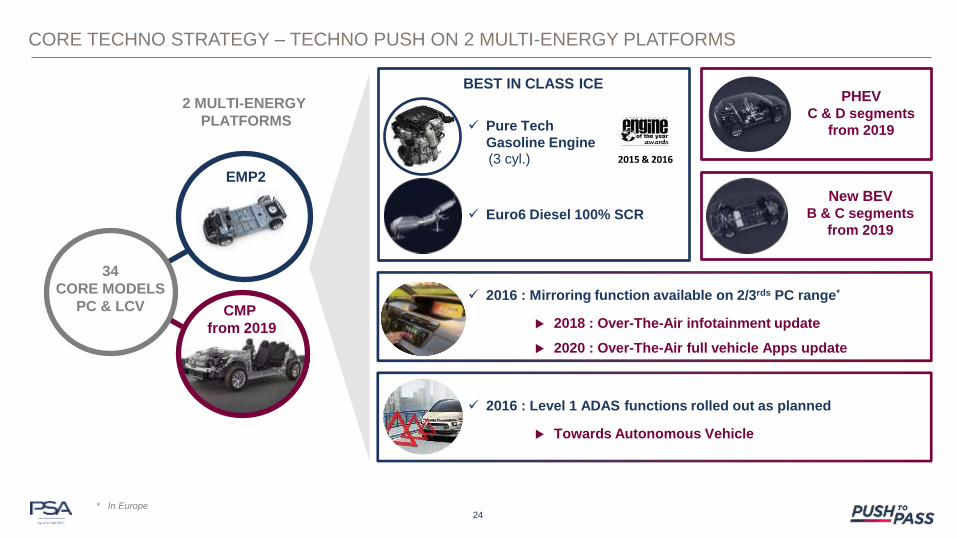
New BEV B & C segments
from 2019
2016 : Level 1 ADAS functions rolled out as planned
Towards Autonomous Vehicle
PHEV C & D segments
from 2019
HATCH
SEDAN
BEST IN CLASS ICE
2015 & 2016
2016 : Mirroring function available on 2/3rds PC range*
2018 : Over-The-Air infotainment update
2020 : Over-The-Air full vehicle Apps update
Euro6 Diesel 100% SCR
(3 cyl.)
2 MULTI-ENERGY
PLATFORMS Pure Tech
Gasoline Engine
CORE TECHNO STRATEGY – TECHNO PUSH ON 2 MULTI-ENERGY PLATFORMS
24 * In Europe
EMP2
34
CORE MODELS
PC & LCV CMP
from 2019
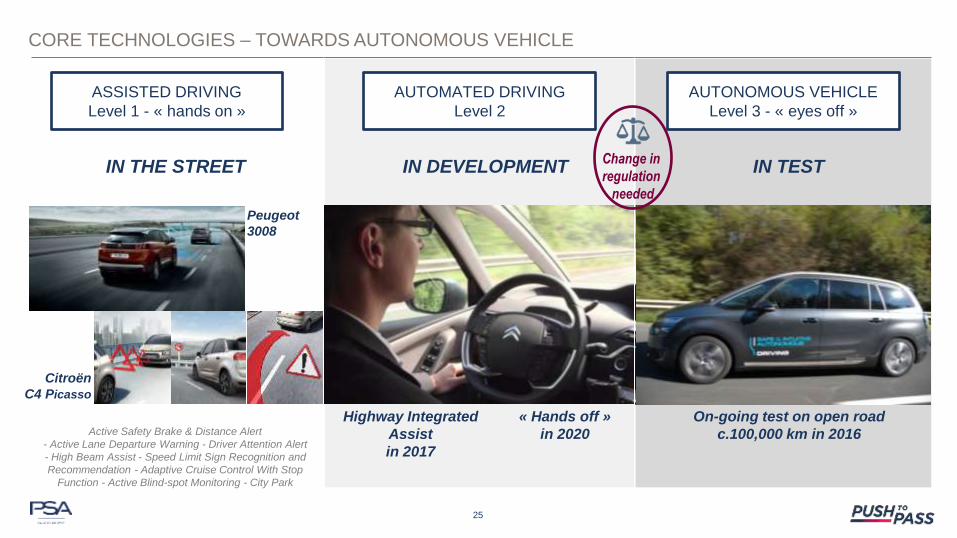
CORE TECHNOLOGIES – TOWARDS AUTONOMOUS VEHICLE
AUTOMATED DRIVING
Level 2
Active Safety Brake & Distance Alert
- Active Lane Departure Warning - Driver Attention Alert
- High Beam Assist - Speed Limit Sign Recognition and
Recommendation - Adaptive Cruise Control With Stop
Function - Active Blind-spot Monitoring - City Park
On-going test on open road
c.100,000 km in 2016
ASSISTED DRIVING
Level 1 - « hands on »
Peugeot
3008
AUTONOMOUS VEHICLE
Level 3 - « eyes off »
IN THE STREET IN TEST IN DEVELOPMENT
Highway Integrated
Assist
in 2017
« Hands off »
in 2020
25
Citroën
C4 Picasso
Change in
regulation
needed

CORE TECHNOLOGIES – ELECTRIC VEHICLES BLITZ FROM 2019
From dedicated
products & architectures…
…towards a full range of vehicles built on
2 MULTI-ENERGY PLATFORMS
C.80% ELECTRIFIED CORE MODELS
BY 2023**
2016 EV
Registrations +67 %*
26 * BEV registrations in 2016 vs 2015 in Europe
** out of 34 core models incl. LCVs - electrified (PHEV / BEV)
2016 EV
market +5 %*

Production cost savings in Europe €/veh. over 2015 - 2018, including Euro6
2015 Cum.2015-2016
Cum.2015-2018
211 256
467
700
On track
2015 2016 Bench OEM's
12.0%
11.4% 11.0%
Wages to revenue ratio
Automotive division*
ON TRACK TO REACH PUSH TO PASS TARGETS
€ 1.2 bn FIXED COST REDUCTION over 2014-2016
CORE EFFICIENCY – OUR DNA
27 * Automotive division excluding own dealer network

-2.4%
-0.1%
Actual
New Push to Pass target
2015 2016 2017-2021
Pricing Power Europe vs Benchmark
-1.0%
+1.0%
-6.5%
2013
Pricing Power : mid term target reached
28

3.0%
4.4%
2016
CITROËN - THE PEOPLE MINDED BRAND PRODUCT OFFENSIVE LAUNCHED
2017-2021
Pricing Power Europe vs Benchmark
Actual
New Push to Pass Target
Pricing Power : mid term target reached
+5.0%
+3.0%
2015
29

DS – UNIQUE AVANT-GARDE EXPERIENCE FROM PARIS
PAVING THE WAY FOR NEW GENERATION OF PRODUCTS
Pricing Power : mid term target reached
-7.9%
-3.9%
2015 2016
Pricing Power Europe vs Benchmark
Actual figures
New Push to Pass targets
2017 - 2021
-4.0%
-2.0%
2013
-13.7%
30

EUROPE – FIT FOR GROWTH
Consolidated Sales ('000)
1,864
1,930
Market Share
11.5% 10.8%
2015 2016
BUILD PROFITABLE GROWTH
Leverage pricing power on new vehicles
Iconic vehicles Peugeot 3008 : 88 kunits orders & 84% on highest levels
Citroën C3 : 57 kunits orders & c.50% on highest level
Orders in pipeline up : +12.2% orders end Jan. 2017(4)
Manufacturing efficiency on track Plant modernization program
STRONG PERFORMANCE
Record ROI (2)
X 2nd in market share in 2016 (1)
1st in LCVs with 18.9% market share
CO2 Leadership 102.4 g/km (3)
Manufacturing efficiency: +9%
Peugeot 5008 GT – launch from H1 2017
(1)
31
(1) Europe 30 (PC+LCV)
(2) since IFRS First Time Application (2004)
(3) average 2016 – Europe 30
(4) Orders PC+LCV end January 2017 vs end January 2016
ROI
Market Share
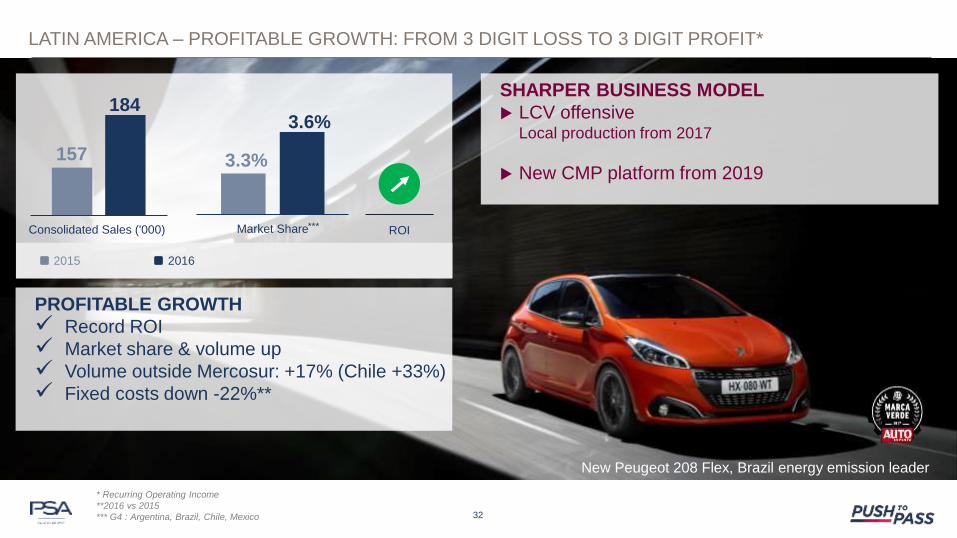
3.3%
3.6%
* Recurring Operating Income
**2016 vs 2015
*** G4 : Argentina, Brazil, Chile, Mexico
LATIN AMERICA – PROFITABLE GROWTH: FROM 3 DIGIT LOSS TO 3 DIGIT PROFIT*
Consolidated Sales ('000)
157
184
2015 2016
SHARPER BUSINESS MODEL
LCV offensive Local production from 2017
New CMP platform from 2019
PROFITABLE GROWTH
Record ROI
Market share & volume up
Volume outside Mercosur: +17% (Chile +33%)
Fixed costs down -22%**
New Peugeot 208 Flex, Brazil energy emission leader
***
32
ROI

Market Share
2.8% 2.1%
Consolidated Sales ('000)
736
618
2015 2016
5 SUV’S LAUNCHED IN 18 MONTHS
Peugeot 4008 from end 2016
22 kunits orders in 2 months / 40% upper
versions
Peugeot 5008 from H1 2017
2 Citroën SUV’s & 1 DS SUV by 2018
ASEAN
CAPSA
Brand construction on track
Purchasing efficiency :10%
Investing in new generation of vehicles
DPCA
X Market Share
DPCA Op. Margin 7.0%**
Cost Reduction -6.2% vs 2015
*
33
ROI
CHINA & SE ASIA – TARGET CONFIRMED : 10% MARGIN BY 2021
* China and South East Asia
** 2016 – based on Recurring Operating Income
– Kick off plant by 2018
– Partnership in Vietnam in 2017

Market Share
0.8% 0.7%
Consolidated Sales ('000)
12
10,5
2015 2016
TACKLING NEW FRONTIERS
New LCV launches
Mid size LCV locally produced from 2018
Operate in new countries
Georgia, Belarus, Kazakhstan
**
34
ROI
EURASIA – BREAK-EVEN TARGET IN 2017 CONFIRMED
* 2016 vs 2015
** G4 : Russia, Ukraine, Belarus, Kazakhstan
SITUATION IS SOUND
Automotive ROI up* and close to break-even
Fixed costs down* -40%
Profitable growth in Ukraine : sales +65%*
Profitable LCV business

Market Share
3.2%
7.2%
Consolidated Sales ('000)
180
384
2015 2016
STRATEGY ROLLING OUT : 70% Local
production
2 industrial JV in Iran : 1st vehicle produced in
2017
Morocco: plant building on track
Local industrial partnerships : Nigeria, Ethiopia,
Kenya, Tunisia…
Renewed adapted offer : Mid-life Peugeot 301,
Citroën C-Elysée, launch of one-ton Pick-up
***
35
ROI
LEVERAGING STRENGTHS
Automotive ROI UP*
Peugeot, Citroën and DS in Iran :
233 ku Peugeot sales under license in Iran
First Citroën & DS imports
Peugeot back in Pick-up segment
* 2016 vs 2015
** o/w 233 kunits sold under Peugeot license in 2016 following the final JV agreement signed with Iran Khodro on 21 June 2016
*** 60 countries, including : Algeria, Iran, Israel, Morocco, Tunisia, Turkey, South Africa,
MIDDLE EAST & AFRICA – PROFITABLE GROWTH !
**

36
MIDDLE EAST & AFRICA – ROLLING INDUSTRIAL START IN IRAN
2
INDUSTRIAL
JVs
6
MODELS
2
PETROL
ENGINES
1
PLATFORM B & C
segments
JV with Iran Khodro
2018
JV with SAIPA
From 2018
3 cyl. 4 cyl.
H1 2017 H1 2018

Market Share
0.2% 0.2%
Consolidated Sales ('000)
24 20
2015 2016
INDIA : FULL ECOSYSTEM BY 2021
Long-term partnership with the CK BIRLA Group
to produce and sell vehicles and components
To be Indian in India
Building a full ecosystem, from R&D to aftersales
**
37
ROI
PACIFIC : MIXED PERFORMANCE IN 2016
Automotive ROI up*
Profitable growth in Japan - sales up 22%*
Citroen & DS volumes up
Successful launch : C4 Cactus
Australia turnaround plan for 2017
* 2016 vs 2015
** including : Australia, Japan & South Korea,
INDIA PACIFIC – AHEAD OF PLAN IN INDIA : PARTNERSHIP SIGNED

SUSTAINED PRODUCT OFFENSIVE
Reinforce European leadership
7 Midsize Van versions in 2017 (incl. PC)
New frontiers product offensive
Pick-up first launch in 2017
Eurasia & Latin America from end 2017
Next generation of e-LCV
38
VOLUMES AND PROFIT UP
Worldwide Sales up 5%
1st Group in Europe with 18.9% market share
1st in Compact Vans with 31.3% segment
share
3rd in Large Vans with 15.6% segment share
Midsize Van renewed offer - segment share up
11.8% in Q4 vs 9.2% in Q3
LIGHT COMMERCIAL VEHICLE – PRODUCT OFFENSIVE

39
A COMPETITIVE TEAM TO CHALLENGE BENCHMARKS
DIGITAL BOOSTER
PSA GROUP 2021
FROM TURNAROUND TO PROFITABLE SUSTAINABLE GROWTH
A CUSTOMER DRIVEN TRANSFORMATION
A MOBILITY PROVIDER For a lifetime customer relationship
A GREAT CAR MAKER With cutting edge efficiency

A G R E A T C A R M A K E R FOR A LIFETIME CUSTOMER RELATIONSHIP
A MOBILITY PROVIDER
ENLARGE OUR CUSTOMER BASE
CUSTOMER
INSIDE MULTI-BRAND
AFTERMARKET
USED CARS
NEW
CUSTOMERS
CONNECTED
AND
MOBILITY
SERVICES
NORTH
AMERICA
10 YEAR
PROJECT
HASSLE
FREE
MOBILITY
40

c.160 000 entries booked
in Europe
34 countries by end 2017
Online products and services results
Online aftersales appointments Connected vehicles
Proactive maintenance service
4.7/5
A semless customer journey
A personalised relationship
c.70 000 customers
8.1/10 satisfaction rate
89% service recommendation
Co-creative process A seamless customer journey
Selling online
2 countries launched Brazil Nov. 2016
UK Jan. 2017
5 countries by end 2017
CUSTOMER INSIDE – BOOST CUSTOMER SATISFACTION WITH DIGITAL SERVICES
41

MULTI-BRAND AFTERMARKET – STRONG ENABLERS TO BUILD PROFITABLE GROWTH
+10% Sales by 2018**
5 13
Mister Auto markets
2015 2016 2021
14
2017
10,000
Parc Coverage*
95%
Euro Repar Car Service Repairers
16 67 140
Spare parts distribution Hubs
2,100
20
2,645 >4,000
* Parc coverage per country after implementation of the Eurorepar & Independent aftermarket (IAM) offer
** versus 2015
Multi-brand
References
c.44,000
ROI & Turnover
UP**
42
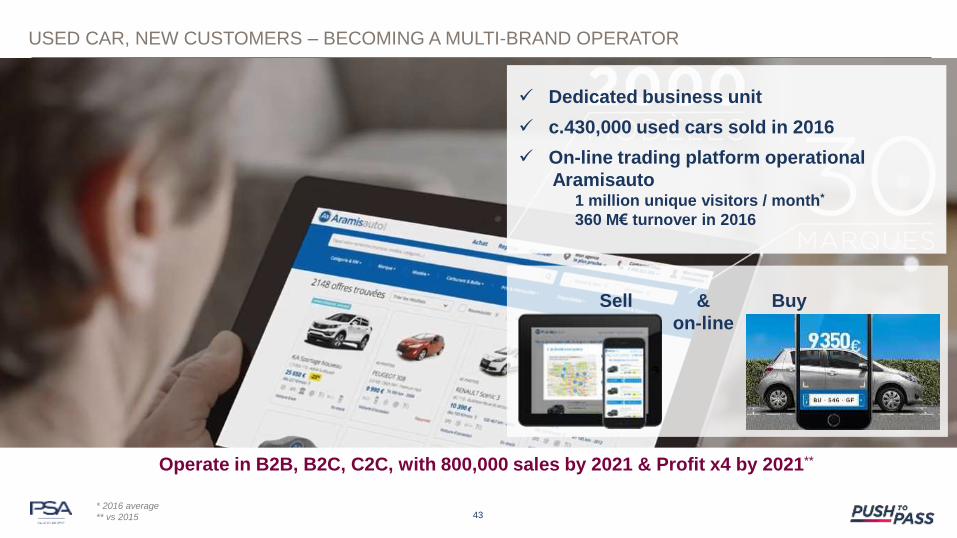
USED CAR, NEW CUSTOMERS – BECOMING A MULTI-BRAND OPERATOR
Dedicated business unit
c.430,000 used cars sold in 2016
On-line trading platform operational
Aramisauto 1 million unique visitors / month*
360 M€ turnover in 2016
Operate in B2B, B2C, C2C, with 800,000 sales by 2021 & Profit x4 by 2021**
Sell & Buy
on-line
43 * 2016 average
** vs 2015
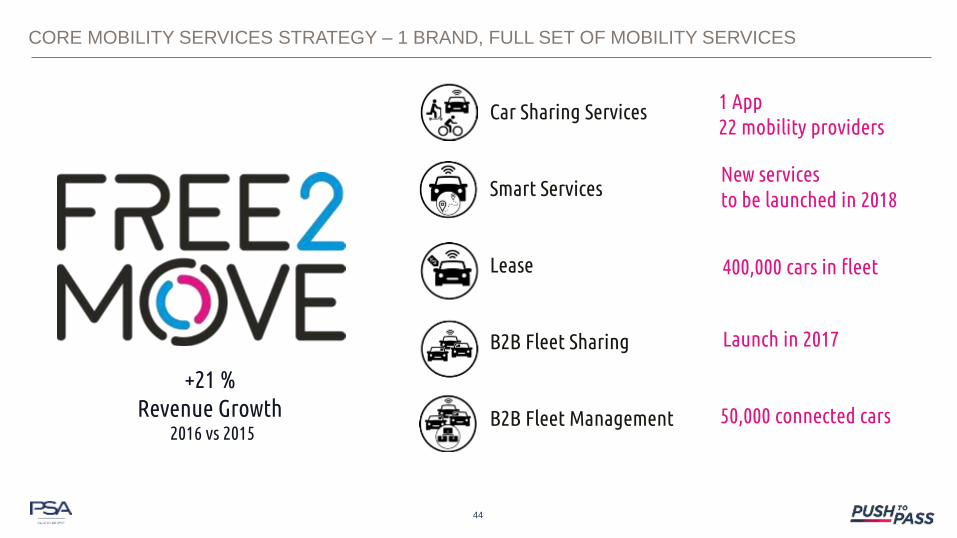
CORE MOBILITY SERVICES STRATEGY – 1 BRAND, FULL SET OF MOBILITY SERVICES
Car Sharing Services
Smart Services
Lease
B2B Fleet Sharing
B2B Fleet Management
+21 % Revenue Growth
2016 vs 2015
1 App
22 mobility providers New services
to be launched in 2018
400,000 cars in fleet
Launch in 2017
50,000 connected cars
44

CAR SHARING – ONE SINGLE APP FOR ALL MOBILITY CUSTOMER NEEDS
Madrid,
45K reg. users
Bordeaux & Lyon, Los Angeles
6K reg. users
France & more,
300K reg. users
Canada & France,
48K reg. users
France,
170K reg. users
1 SINGLE APP Launched in Feb. 2017
MOBILITY SERVICES ENRICHMENT By end 2017
GEOGRAPHIC DEPLOYMENT By end 2017
& more to come …
150,000 USERS
4.2/5 & more to come …
22 mobility providers
16 cities in 5 countries
45

DEDICATED BUSINESS UNIT FOR HIGHER EFFICIENCY
46
HASSLE FREE MOBILITY – ON TRACK TO BECOME A MULTI-BRAND LEASER
* Leasing penetration rate in PSA Group B2B sales
PROFIT +€100M by 2021 vs 2015
22% 20% 20%
23% 27%
2014 2015 2016 2017 2018
Lease penetration rate*
LEASE BUSINESS
OPPORTUNITY
Forecast
TOWARDS AN INTEGRATED MULTI-BRAND LEASER
Multi-Brand
offer
Single Brand
offer
Sub-contracting management All services management
Independent
Leasers
Traditional
captive
G10 Geographic
roll-out H2 2017 H1 2017
2018

NORTH AMERICA – 1st STEP: MOBILITY SERVICES PROVIDER
CAR SHARING B2C
starting in Los Angeles
with
Dedicated team on the ground
47
CAR SHARING C2C
with

FOCUS ON EXECUTION AND STAY OPEN TO STRATEGIC OPPORTUNITIES
PROFITABLE GROWTH :
PERFORMANCE MATTERS
MORE THAN SIZE
GROWTH AS A REWARD
OF A JOB WELL DONE

ATTACHMENTS
50

CONSOLIDATED WORLDWIDE SALES
Units* 2015 2016 Change
Europe**
Peugeot Citroën DS Total PSA
1,056,103 731,141
76,733 1,863,977
1,102,230 762,576 65,452
1,930,258
+4.4% +4.3%
-14.7% +3.6%
China & South East Asia Peugeot Citroën DS Total PSA
412,271 302,198
21,479 735,948
351,904 250,297 16,151
618,352
-14.6% -17.2% -24.8% -16.0%
Latin America Peugeot Citroën DS Total PSA
99,261 56,613
1,204 157,078
122,639 60,196 1,072
183,907
+23.6% +6.3%
-11.0% +17.1%
Eurasia Peugeot Citroën DS Total PSA
6,538 5,374
88 12,000
5,626 4,758
106 10,490
-13.9% -11.5% +20.5% -12.6%
India-Pacific Peugeot Citroën DS Total PSA
18,457 4,143 1,189
23,789
13,977 4,452 1,457
19,886
-24.3% +7.5%
+22.5% -16.4%
Middle East & Africa***
Peugeot Citroën DS Total PSA
117,093 61,472
1,642 180,207
323,084 58,662 1,743
383,489
+175.9% -4.6% +6.2%
+112.8%
Total Assembled vehicles and CKD’s Peugeot Citroën DS Total PSA
1,709,723 1,160,941
102,335 2,972,999
1,919,460 1,140,941
85,981 3,146,382
+12.3% -1.7%
-16.0% 5.8%
* Assembled Vehicles, CKDs and vehicles under license ** Europe = EU + EFTA + Albania + Croatia + Kosovo + Macedonia + Serbia *** o/w 233 kunits sold under Peugeot license in 2016 following the final JV agreement signed with Iran Khodro on 21 June 2016
51

GROUP REVENUE BY DIVISION
In million Euros 2015 2016 Change
Automotive 37,514 37,066 (448)
Faurecia 18,770 18,710 (60)
Other businesses and eliminations* (1,608) (1,746) (138)
Group Revenue 54,676 54,030 (646)
* Including remaining activities of Banque PSA Finance 52

GROUP RECURRING OPERATING INCOME BY DIVISION
* Including remaining activities of Banque PSA Finance
In million Euros 2015 2016 Change
Automotive 1,871 2,225 354
Faurecia 830 970 140
Other businesses and eliminations* 32 40 8
Group Recurring Operating Income 2,733 3,235 502
53

BANQUE PSA FINANCE*
* 100% basis
In million Euros 2015 2016 Change
Revenue 1,601 1,405 (196)
Net banking revenue 1,065 1,026 (39)
Cost of risk (in % of average loans) 0.33% 0.24% -0.09pt
Recurring Operating Income 514 571 57
Penetration rate 29.9% 30.8% +0.9pt
Number of new contracts (lease and financing) 731,701 767,848 36,147
54

FAURECIA
In million Euros 2015 2016 Change
Revenue 18,770 18,710 (60)
Recurring Operating Income 830 970 140
% of revenue 4.4% 5.2%
Consolidated net income 503 706 203
Free Cash Flow 191 1,011 820
Net Financial Position (1,026) (475) 551
55

PARTNERSHIPS
In million Euros 2015 2016 Change
50% Dong Feng Motor company Partnership 350 242 (108)
50% Changan Partnership (50) (292) (242)
50% Chinese Financial JV 11 14 3
50% Banque PSA Finance JVs 112 181 69
Other 14 (17) (31)
Share in net earnings of companies at equity 437 128 (309)
100% Banque PSA Finance businesses to be continued in partnership
65 21 (44)
Faurecia Automotive Exteriors 72 174 102
Net result from operations held for sale or to be continued in partnership
137 195 58
56

FINANCIAL SECURITY
In million Euros 31 December
2015
31 December
2016 Change
Cash and Cash Equivalents 10,465 11,576 1,111
Financial Investments 352 110 (242)
Current & non current financial assets 535 1,088 553
TOTAL Cash & Financial assets 11,352 12,774 1,422
Lines of Credit (undrawn) – excluding Faurecia 3,000 3,000 -
Lines of Credit (undrawn) – Faurecia 1,200 1,200 -
TOTAL Financial Security 15,552 16,974 1,422
57

DEBT MATURITY PROFILE – PRIORITY TO REDUCE FINANCING COSTS
519 721
507
78 109 40
529 600
40
32
132
705
705
2017 2018 2019 2020 2021 2022 2023 2033
Faurecia: €700M 7 years 3.625% bond
issue successfully priced
on March 16, 2016
Faurecia: €490M December 2016 bond fully
redeemed on April 12, 2016
PSA Group: €500M 7 years 2,375% bond
issue successfully priced on April 8, 2016
PSA Group: €496M tendered on bonds
2017, 2018 and 2019 redeemed
on June 22, 2016
In million Euros
Gross debt* in nominal value - End 2016
Faurecia Others
* Excluding BPF, undrawn credit-line short term liabilities & other adjustments 58
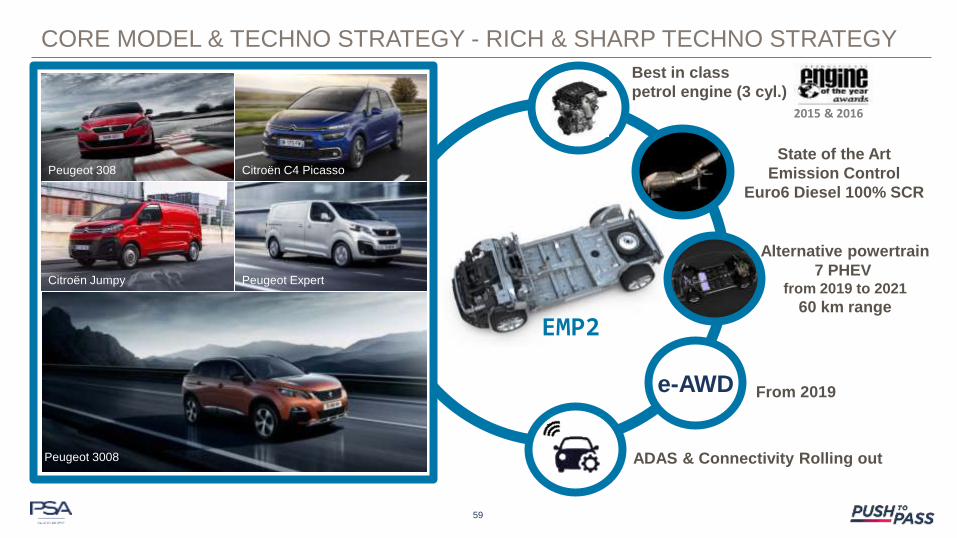
CORE MODEL & TECHNO STRATEGY - RICH & SHARP TECHNO STRATEGY
e-AWD
Best in class
petrol engine (3 cyl.)
State of the Art
Emission Control
Euro6 Diesel 100% SCR
From 2019
ADAS & Connectivity Rolling out
EMP2
Alternative powertrain
7 PHEV from 2019 to 2021
60 km range
2015 & 2016
Peugeot 308 Citroën C4 Picasso
Citroën Jumpy Peugeot Expert
Peugeot 3008
59

CORE MODEL & TECHNO STRATEGY - RICH & SHARP TECHNO STRATEGY
Best in class
petrol engine (3 cyl.)
State of the Art
Emission Control
Euro6 Diesel 100% SCR
ADAS & Connectivity
Rolling out from 2019
e-CMP
4 BEV from 2019 to 2021
450 km range
CMP
2015 & 2016
SUV
HATCH
SEDAN
60