fy 2018 - introduction - v3 › documents › prior year budgets › operating budget … ·...
TRANSCRIPT


FY 2018 Budget Documents
Governor Raimondo’s FY 2018 Executive Summary is the first of eight documents that contain the summaries of revenue and expenditures on a statewide, functional, and departmental basis and also presents statewide expenditure data by category or object of expenditure. This same data is presented in the Budget in more detail by program. The Executive Summary contains special reports on Education Aid and State Aid to provide a historical perspective on these state expenditures and also contains a "Budget Primer" which is intended to assist the reader of the budget documents in understanding the budget process in Rhode Island. Specific recommendations for FY 2018 for the departments are presented in this document, as well as the five-year financial projection as provided by law. Further detail is provided in the Technical Appendix. The Budget consists of four volumes that provide an overview of state expenditures, as well as an in-depth presentation of the State Budget by program. The financial data presented for state agencies in The Budget for the past two fiscal years (FY 2015 and FY 2016) is generally derived from the appropriation accounting and receipt accounting files of the State Controller, as of the time of year-end closing. In the case of the accounts under the jurisdiction of The Office of Postsecondary Education, these columns reflect independently audited records. The financial data for state agencies for the current fiscal year is from the enacted budget, modified in some cases to reflect recommended supplemental appropriations or withdrawals, revised expenditure estimates by category of expenditure or program, and revised estimates of federal grant awards or restricted receipts. In this document, the general revenue balance forward is included at the account level. The proposed changes to the enacted FY 2017 budget are included in the financial data by program for FY 2017. Totals and subtotals often appear to be inaccurate by small amounts or may disagree by small amounts with other budget and financial documents; this is due to differences in rounding procedures. The annual Appropriations Act is the absolute reference for state appropriation amounts. The Budget also contains both narrative descriptions of Rhode Island’s quasi-public agencies, authorities and entities, which are component units of state government for financial reporting purposes, and presents financial data provided by these entities. The Budget Office requests that quasi-public agencies and authorities submit information in the format used by the agency; no attempt is made to conform the financial presentation of the agencies data. In most cases, the FY 2017 and FY 2018 information has not been officially approved by the entities' governing bodies. The FY 2018 Budget reports performance measurements for most programs, as required by legislative mandate to develop performance measurements for use in the budget process. Measurements are provided after each agency personnel supplement page. The Budget document provides information relating to personnel costs by program. The Capital Budget contains information on the Governor's recommended capital improvement plan and contains individual project expenditures as well as contains the debt service component relating to capital improvements and any "pay-as-you-go" capital, which is financed from current revenues. The Budget as Enacted will be prepared after final enactment by the 2018 General Assembly.


Executive Summary Table of Contents
Page Introduction ................................................................................................................................................... 1 Overview .................................................................................................................................................... 13
The Economy .............................................................................................................................................. 18 General Revenues, Restricted Receipts and Pass Through Revenues ....................................................... 23 All Sources .................................................................................................................................................. 31 All Expenditures .......................................................................................................................................... 32 Expenditure Summary................................................................................................................................. 33 Personnel Summary .................................................................................................................................... 37 Capital Budget ............................................................................................................................................. 45 General Government ................................................................................................................................... 52 Department of Administration ...................................................................................................... 55 Department of Business Regulation .............................................................................................. 63 Executive Office of Commerce ..................................................................................................... 66 Department of Labor and Training ............................................................................................... 72 Department of Revenue ................................................................................................................. 76 Legislature ..................................................................................................................................... 80 Office of the Lieutenant Governor ................................................................................................ 82 Secretary of State ........................................................................................................................... 83 Office of the General Treasurer ..................................................................................................... 86 Board of Elections ......................................................................................................................... 89 Rhode Island Ethics Commission ................................................................................................. 90 Executive Department ................................................................................................................... 91 Commission for Human Rights ..................................................................................................... 92 Public Utilities Commission .......................................................................................................... 93 Health and Human Services ........................................................................................................................ 95 Executive Office of Health and Human Services ......................................................................... 98 Department of Children, Youth and Families ............................................................................. 102 Department of Health .................................................................................................................. 106 Department of Human Services .................................................................................................. 109 Department of Behavioral Healthcare, Developmental Disabilities and Hospitals ................... 114 Governor’s Commission on Disabilities ..................................................................................... 118 Commission on the Deaf and Hard of Hearing .......................................................................... 119 Office of the Child Advocate ...................................................................................................... 120 Office of the Mental Health Advocate ........................................................................................ 120
Education ................................................................................................................................................... 122 Department of Elementary and Secondary Education ................................................................ 124 Public Higher Education ............................................................................................................. 131 Rhode Island Council on the Arts ............................................................................................... 137 Rhode Island Atomic Energy Commission................................................................................. 138 Rhode Island Historical Preservation and Heritage Commission .............................................. 139
Public Safety ............................................................................................................................................. 141 Attorney General ......................................................................................................................... 145 Department of Corrections .......................................................................................................... 148 Judicial Department ..................................................................................................................... 156 Military Staff ............................................................................................................................... 161 Emergency Management Agency ............................................................................................... 164 Department of Public Safety ....................................................................................................... 165 Office of the Public Defender ..................................................................................................... 170

Page Natural Resources ..................................................................................................................................... 172 Department of Environmental Management ............................................................................... 175 Coastal Resources Management Council .................................................................................... 180 Transportation ........................................................................................................................................... 182
Appendix A - Schedules General Revenue Budget Surplus Statement ..................................................................................... A-1 Expenditures from All Funds ............................................................................................................. A-2 Expenditures from General Revenues ............................................................................................... A-4 Expenditures from Federal Funds ...................................................................................................... A-6 Expenditures from Restricted Receipts .............................................................................................. A-8 Expenditures from Other Funds ....................................................................................................... A-10 Full-Time Equivalent Positions ....................................................................................................... A-12 General Revenues as Recommended ............................................................................................... A-14 Changes to FY 2017 Enacted Revenue Estimates ........................................................................... A-15 Changes to FY 2018 Adopted Revenue Estimates .......................................................................... A-16 General Revenue Changes to Adopted Estimates ........................................................................... A-17 Other Revenue Enhancements ......................................................................................................... A-19 Appendix B - Changes to FY 2017 Changes to FY 2017 General Revenue Budget Surplus .................................................................... B-1 Changes to FY 2017 Enacted Agency General Revenue Expenditures ........................................... B-2 Changes to FY 2017 Enacted General Revenue Expenditures ....................................................... B-19 Appendix C – Aid to Cities and Towns Formula Aid to Cities and Towns ...................................................................................................... C-1 Summary of Formula Aid to Cities and Towns ................................................................................. C-3 Fiscal Year 2017 Enacted State Aid to Cities and Towns ................................................................. C-4 Fiscal Year 2017 Enacted Pass Through Aid to Cities and Towns ................................................... C-5 Fiscal Year 2017 Revised State Aid to Cities and Towns ................................................................. C-6 Fiscal Year 2017 Revised Pass Through Aid to Cities and Towns ................................................... C-7 Change in Formula Aid – FY 2017 Revised vs. FY 2017 Enacted .................................................. C-8 Changes in Pass Through and All Aid – FY 2017 Revised vs. FY 2017 Enacted ........................... C-9 Fiscal Year 2018 Proposed State Aid to Cities and Towns ............................................................. C-10 Fiscal Year 2018 Proposed Pass Through Aid to Cities and Towns ............................................... C-11 Change in Formula Aid – FY 2018 vs. FY 2017 Revised .............................................................. C-12 Changes in Pass Through and All Aid – FY 2018 vs. FY 2017 Revised ....................................... C-13 Appendix D – Aid to Schools Education Aid to Local Units of Government ................................................................................... D-1
Appendix E – Statewide Personnel Supplement .................................................................................. E-1 Appendix F – Five-Year Financial Projection FY 2018 – FY 2022 Overview ........................................................................................................ F-1 General Revenue Out-year Estimates FY 2018 – FY 2022 ............................................................ F-8 General Revenue Out-year Estimates .............................................................................................. F-9 General Revenue Out-year Estimates Percent Changes ................................................................ F-10 General Revenue Expenditure Estimates ...................................................................................... F-11 General Revenue Out-year Planning Values ................................................................................. F-12
Appendix G – The Budget Process The Budget Process: A Primer ...................................................................................................... G-1

Executive Summary


Introduction
Governor Raimondo’s FY 2018 Budget focuses on building on our strong momentum and creating a better Rhode Island for working families and businesses. The State’s economy continued to make progress in 2016. Rhode Island created 5,800 jobs last year, and the unemployment rate fell to its lowest point since the beginning of the Great Recession. Economic progress continues in large part due to the programs and initiatives set in motion in previous budgets. However, more work needs to be done in order to create and support economic growth that can benefit our cities and towns, businesses and hard-working families. The State must continue to make smart investments, not just in our economic programs, but in Rhode Islanders. That means we must continue to focus on increasing accessibility to education, attracting high-paying jobs and building a better quality of life for our residents. The Governor’s FY 2018 Budget is built around five main themes:
Middle Class Relief
Helping Working Families
Strengthening the Economy
Protecting Health and Safety
Prioritizing Fiscal Responsibility Following these themes, the Governor submits a balanced budget that includes increased funding for elementary, secondary, and higher education; continues a commitment to workforce development efforts; invests in economic growth and innovation; supports working Rhode Islanders through a minimum wage increase; promotes the fiscal health of our cities and towns; and, for the third straight year, includes no broad-based tax increases. The budget also makes progress in closing the structural deficit. The FY 2018 Budget closes an estimated shortfall of $184.5 million, which was based on preliminary revenue and expenditure projections. Additional estimated revenues, offset by increased costs as determined by the November Revenue and Caseload Estimating Conferences, resulted in the projected deficit for FY 2018 decreasing to $66.2 million. The Governor’s recommended budget closes this shortfall through a combination of increased revenue – primarily from the receipt of sales tax on qualifying Internet transactions – and expenditure reductions, primarily in the Medicaid program. The FY 2018 Budget continues to focus on both holding down costs and creating economic growth. As a result, the projected FY 2021 deficit drops 42 percent from last year’s estimate, from $332.6 million to $192.6 million.
1

Introduction
Middle Class Relief Access to Affordable Higher Education The State will guarantee two years of free tuition and fees for Rhode Island students at any of the three Rhode Island public universities. All 2017 Rhode Island high school graduates who enroll full-time at the Community College of Rhode Island will be eligible beginning in the fall of 2017. Those students who enroll at Rhode Island College or the University of Rhode Island will receive a scholarship for tuition and fees for their junior and senior years. Students will be required to stay on track toward finishing their degrees on time to remain eligible. By 2020, 71 percent of Rhode Island’s jobs will require an associate’s degree or higher. Yet only slightly more than 40 percent of Rhode Islanders presently meet that benchmark. While almost 90 percent of Rhode Island’s high school seniors express an intention to attend an institution of higher education, less than two-thirds actually do. This program will ensure students have the opportunity to compete in the job markets of the future by keeping college affordable and accessible. The State will provide funds for implementation and additional investments at each of the colleges to ensure that students are supported along the path to graduation. After applying all federal and institutional financial aid sources, the cost to the state will be:
$10.0 million in FY18 ($3.0 million for scholarships at CCRI, $6.0 million for Promise Preparedness Grants to the three institutions, and $1.0 million for implementation costs)
$13.0 million in FY19 ($6.0 million for scholarships at CCRI, $6.0 million for Promise Preparedness Grants to the three institutions, and $1.0 million for implementation costs)
$18.0 million in FY20, ($6.0 million for scholarships at CCRI, $12.0 million for scholarships at RIC and URI)
$30.0 million in FY21, and annually thereafter ($6.0 million for scholarships at CCRI, $24.0 million for scholarships at RIC and URI)
For recent graduates, the Governor continues the Wavemaker Fellowship program. The Wavemaker program provides loan forgiveness for recent graduates pursuing careers and starting businesses in technology, engineering, design and other key sectors. Motor Vehicle Property Tax Fairness Rhode Island’s municipal motor vehicle excise tax (the “car tax”) totaled about $215.4 million in FY 2016, making up approximately 9 percent of total local tax revenues. This tax has two central issues. First, Rhode Island has some of the highest average car tax rates in the country. Second, the valuation process does not always accurately reflect the true values of each car, leading to taxes being paid on car values that exceed the actual worth of the car. The Governor proposes that vehicles’ assessed values be reduced by 30 percent – moving from “clean retail” to an approximation of “average trade-in value.” This change will more fairly reflect the actual value of taxpayers’ cars, and will bring us closer to alignment with valuation methodologies used by Connecticut and Massachusetts.
2

Introduction
This change will reduce total car tax bills by about $58.0 million in calendar year 2018. A hypothetical driver in Cranston who owns a 2010 Honda Civic with a book value of $12,000 will see her annual car tax bill reduced from $488 under the current system to about $335 – a savings of $153. The State will reimburse the municipalities for the decrease in revenue. Helping Working Families While the economy has been improving, these benefits are not distributed equally across society. These initiatives are designed to give families a firmer footing as parents progress in their careers and children progress in school – so everyone may benefit from economic growth. Enhanced Quality of Life Despite recent improvements in the State’s unemployment rate and economic outlook, too many Rhode Islanders still struggle to make ends meet. In 2015, the Governor and the General Assembly provided help to working families by increasing the State’s minimum wage from $9.00 per hour to $9.60 per hour, effective January 1, 2016. In 2016, the Governor proposed an increase in the State’s minimum wage to $10.10, but the General Assembly did not enact this proposal. Massachusetts’ minimum wage currently stands at $11.00 per hour after an increase from $10.10 on January 1, 2017. Connecticut’s minimum wage also recently increased, to $10.10 from $9.60 effective on January 1, 2017. The Governor recommends increasing Rhode Island’s minimum wage to $10.50 per hour, effective October 1, 2017. Increasing the minimum wage to $10.50 will result in a small FY18 fiscal impact (approximately $120,000) to the Department of Environmental Management, which employs a number of seasonal minimum wage workers. The Governor proposes a number of other initiatives to support Rhode Island workers, including:
Performance-based Quality Incentive for Child Care Assistance – This proposal would allocate $1 million to create enhanced reimbursement rates for child care providers who offer higher quality care. While Rhode Island generally provides ample access to child care, the current rate structure provides no incentive for providers to improve the quality of their programs.
Abolish Apprenticeship Fees – This proposal would eliminate fees associated with registered apprenticeships in Rhode Island. Currently, both sponsors ($120/yr.) and registered apprentices ($24/yr.) are required to pay annual fees. The fee removal would help incentivize employers, particularly non-trade employers, to establish apprenticeship programs.
Increase Penalties for Labor Law Violations – Many penalties have either not been adjusted at all or have been eliminated over time. This article would enhance labor law enforcement efforts by increasing or restoring such penalties. Based on penalties assessed over the past few fiscal years and based on caseload numbers, this initiative would generate approximately $850,000 in general revenue and restricted receipt funds.
3

Introduction
K-12 Education Rhode Island needs to provide a first-class education so students are prepared for high-paying jobs in some of the industries the State hopes to attract and expand. The State has committed to increased resources for public education by adopting a funding formula that reimburses school districts according to their needs. For FY 2018, the budget includes an additional $45.4 million for municipalities, allowing local schools to advance the educational opportunities of students throughout the state. In addition, this budget proposes a number of initiatives to improve K-12 education and to achieve the Governor’s Third Grade Reading Goal to double the number of third graders reading at grade level by 2025. Investments include:
Increase Early Childhood Learning – The budget increases funding for this categorical to leverage federal grants for a total of $6.0 million. The funding will allow additional investment in early childhood development programs that support cognitive growth in children and lay the groundwork for future academic success.
Make ELL Categorical Funding Permanent – Last year, $2.5 million was added to municipal K-12 funding to support English Language Learners (ELLs) and the additional expenses generated by those programs. The funding was set to expire in FY 2018, and Rhode Island is one of only four states in the country that does not have permanent ELL funding.
Kindergarten Entry Profile – The budget provides $200,000 in technology and training to start a program that analyzes children’s abilities and academic potential at the kindergarten level in order to further guide early childhood education policy, inform educational interventions by LEAs and leverage Rhode Island’s significant investment in early learning.
The budget continues the State’s commitment to the Pathways in Technology (P-TECH) program, which connects high schools, community colleges and businesses. The program allows qualifying high school students to pursue a five- or six-year path to a high school diploma, an associate's degree, and ultimately a job. Together with industry partners, the program provides skills development and access to mentors, internship opportunities and employment. These partnerships create reliable pipelines of talented, trained workers. Strengthening the Economy In addition to generating a pool of skilled workers, this budget proposes other actions designed to make it easier and cheaper to do business in Rhode Island, to attract advanced industries to invest here, and to help existing businesses grow and thrive. Promoting Advanced Manufacturing
Manufacturing Investment Tax Credit – $3.25 million is used to enhance the existing investment tax credit, with a focus on manufacturers buying equipment and adding jobs. The credit is refundable and transferrable, and will apply to companies registered as S-corps or without a sufficient tax liability. This will particularly appeal to new or small manufacturing companies contemplating significant capital investments in equipment.
4

Introduction
Job-Ready Workforce Labor Stimulus Program (JWLS) – $2.0 million is allocated toward a job incentive program with a focus on advanced manufacturing. The program would create a competitive award for manufacturers and other companies expanding employment in Rhode Island. The credit will encourage new training and development initiatives at these firms, while helping to offset the often substantial local property tax burden faced by these companies.
Davies Manufacturing – Designates $3.65 million to the state-run Davies Career and Technical School for upgrading facilities around advanced manufacturing. These include welding facilities, advance shop floor, and updated technology and infrastructure to prepare the next generation of manufacturing workers.
Innovation Voucher – Expands successful research and development incentive program from $1.5 million to $2.5 million with an added focus on manufacturing R&D. Vouchers can be used as: support for the commercialization of a new product, process, or service; access to scientific, engineering and design expertise; technological development and exploration; or scaling innovative ideas to market development.
Polaris Technical Assistance – An additional $300,000 (for a total of $550,000) of funding, allowing Polaris to provide LEAN training, facility layout and other programming to help manufacturers succeed. Polaris provides group and individual trainings for operators, shares expertise, and promotes manufacturing statewide.
Business Attraction and Economic Development Job growth has been strong in Rhode Island over the last year, including a number of high-profile companies announcing they were moving to Rhode Island or expanding here. In large part, these corporate changes were due to the financial incentives established in the last two budgets. The Administration continues its commitment to these incentives in the proposed FY 2018 Budget:
First Wave Closing Fund – Moves $1.5 million to the fund from a one-time fund balance already at Commerce to bring the fund back to $12 million. It provides state economic development officials with flexibility when working with businesses interested in locating to or expanding in Rhode Island. The First Wave Closing Fund provides last-dollar financing for projects that are catalytic in nature and of significant economic benefit to the state.
Air Services Development Fund – Adds $500,000 to the Fund, which provides incentives to airlines that launch new routes or increase service to T.F. Green Airport. Having more direct routes and convenient service times is a factor in corporate decisions to move to Rhode Island.
I-195 Development Fund – Provides $10.1 million from one-time debt service changes to resupply the fund since $19.5 million was recently obligated in business attraction deals. The fund is designed to catalyze development and attract anchor employers and institutions to the I-195 land.
Rebuild RI – Maintains funding for Rebuild RI at $20.0 million a year to ensure all credits are funded over the life of the program. The program supports high-return catalytic real estate development projects
5

Introduction
that encourage construction and other job creation. Previously, Rhode Island had no broad-based real estate development tax credits. The Rebuild RI real estate tax credit leverages private funds to spur real estate development.
Local Agriculture and Seafood Act – Increase funding for the small grant program by $100,000 to allow more small businesses in the food sector to receive development grants. Every dollar is matched more than 1:1 by private sources.
The budget also maintains the State’s commitment to Real Jobs RI, a demand-driven workforce and economic development initiative. The program ensures that Rhode Island employers have the talent they need to compete and grow while providing targeted education and skills training to Rhode Island workers. Real Jobs Partnerships convene industry employers, key stakeholders and groups in alliances to address business workforce demands. Customer-Oriented Services and Regulations In addition to providing economic development incentives and tax relief, Rhode Island can improve the business climate by reducing the time, resources and confusion generated by unnecessary regulatory red tape. Following the Governor’s Executive Orders on regulatory reform (Executive Order 15-07) and Lean Government (Executive Order 15-09), the state has made efforts to streamline professional licensing at the Department of Health, shortened application timelines at the Department of Environment Management, and reduced unemployment insurance processing times at the Department of Labor and Training, among others. The new revisions to the state’s Administrative Procedures Act (APA) require regulatory agencies to reconsider all of their regulations and put those that remain relevant into an online, searchable code of state regulations. This budget recommends additional investments to streamline bureaucracy and improve our regulatory environment, including:
Policy Fellows to Implement the New (APA) Requirements – Policy fellows will assist the Office of Regulatory Reform and the Secretary of State’s Office in reviewing every existing regulation and creating an online, indexed, and searchable code of state regulations. These improvements will make state regulations more accessible to business and others who interact with government, compiling all relevant information in a user-friendly format.
Technical Assistance Grants – Adds $250,000 to the budget for grants that will encourage economic development in four to six cities and towns by funding technical expertise to help cities and towns improve zoning processes and streamline local permitting processes; thereby reducing costs, wait times and barriers to development.
Reduce Permit Time – Two Environmental Scientists are added to the Office of Water Resources to reduce permit and compliance time and work toward reduction of storm water and other pollution in our waterways.
Division of Motor Vehicles Staff – Eight staff are added to the Department of Revenue, Division of Motor Vehicles to improve wait times for companies and citizens while at the DMV.
6

Introduction
Protecting Health and Safety State government plays a key role in fostering a safe and healthy environment for all Rhode Islanders. Targeted investments in public safety, environmental protection, and public health can improve residents’ quality of life and make the state more attractive to visitors and businesses. The Governor’s budget includes programs to prevent crime, upgrade recreation facilities, and support the health and well-being of seniors and children. Criminal Justice Reform Governor Raimondo has emphasized the need for criminal justice reform to end the cycle of incarceration and recidivism while improving the safety of Rhode Islanders. Executive Order 15-11 and Executive Order 15-14 established the Justice Reinvestment Working Group and the Overdose Prevention and Intervention Task Force. Supported by the Council of State Governments’ Justice Center and coordinated with the U.S. Justice Reinvestment Initiative, the working groups adopted a data-driven approach to justice reform. The recommendations are supported by the following investments:
Domestic Violence Intervention – The addition of $100,000 would be used to address two goals: 1) train program facilitators and staff on evidence-based treatments outlined by the Batterers Intervention Program Standards Oversight Committee to reduce instances of intimate partner domestic violence; and 2) to subsidize participation costs for indigent participants.
Public Defender Mental Health Program – Funding of $185,000 would provide resources for a mental health program at the Public Defender’s Office. The program would include a pre-arrest diversion program that would ensure better access to mental health public services while reducing the strain on health care systems, first responders, the Judiciary and the Department of Corrections.
Corrections Mental Health Professionals – Adding $410,000 to improve mental health services at the Adult Correctional Institutions (ACI) by funding new clinical social workers and improving discharge planning for prisoners with behavioral health issues. Maximum Security is estimated to have 64 mentally ill inmates, and current resources are inadequate.
Recovery Housing – This pilot would use $200,000 to establish 60 beds for individuals with behavioral health care issues and criminal justice histories in 10 recovery houses. Recovery housing provides a stable living environment that is free of alcohol and illegal drug use. Longitudinal studies of peer-run recovery homes have demonstrated that people connected to recovery housing have significantly better outcomes in alcohol and drug use, arrests, psychiatric symptoms and employment.
The Governor’s FY 2018 Budget continues to fund $500,000 for a Pay for Success program to increase employment and reduce recidivism for formerly incarcerated individuals. The program will provide skills development and employment training, while fostering access to transitional jobs and permanent employment. Pay for Success programs allow states to invest in promising programs and pay service providers only after certain outcomes have been achieved, thereby minimizing taxpayer risk and encouraging better results.
7

Introduction
Supporting Seniors
Home Health and Developmental Disability (DD) Worker Raises – The Governor proposes investing $11.0 million in combined state and federal funds to raise the wages of home-care and DD workers. Home-care workers will see a raise of roughly 7 percent and DD workers will see a raise of roughly 5 percent. For home- and community-based placements to be successful, the State must have a robust provider network and support system. To build this capacity, workers with the right skills must be paid enough to fill these jobs.
Targeted Programs for the Low-Income Elderly and Disabled – Proposes using $300,000 on piloting a program to provide free 10-trip tickets for some individuals who were previously able to ride without paying a fare. As of February 1, 2017, RIPTA will no longer offer passes for free rides to the low-income elderly and disabled population. In place of free passes, RIPTA will offer discount cards which entitle holders to ride for 50 cents per ride. This program will supplement the discount cards.
Recreation, Health, and Environment Public health, recreation and protecting the environment are intertwined. Not only do these improvements allow the public to live longer and happier lives, but they make Rhode Island a more attractive place for visitors and residents. Investments in these areas include:
Streamline Lead Authority – The budget proposal would consolidate authority and funding for the Lead Poisoning Prevention program at the Department of Health in place of the current bifurcated structure at DOH and at the Housing Resources Commission. Lead-based paint in Rhode Island’s relatively old housing stock is the most common source of lead exposure for children. High blood lead levels are associated with learning disabilities and other cognitive problems.
Increase Cigarette Tax – Increasing the cigarette tax to $4.25 a pack would generate $8.7 million. According to the Campaign for Tobacco-Free Kids, an increase in cigarette prices reduces youth smoking rates.
Outdoor Recreation Council Proposal – In December 2016, the Outdoor Recreation Council issued a
report on how healthy living could be improved in Rhode Island. In the report, and reflected in this budget, a portion of the additional cigarette tax revenue would be placed in a fund to be disbursed by a stakeholder group composed of state, municipal and non-governmental representatives. Disbursements totaling $2,500,000 would go to:
o Local recreation matching grants o State and local recreation programming o Recreation capital funding and maintenance o Park staffing and administration
Tobacco Cessation Funding – $500,000 of the Cigarette Tax increase would be used to fund anti-smoking media campaigns, targeted cessation efforts and policy work related to reducing tobacco use.
8

Introduction
Conservation Districts – Adds $50,000 to restore funding for regional conservation districts that used to be funded from Community Service Grants.
Volvo Ocean Race – A one-time payment of $775,000 is added in the budget to support infrastructure around the Volvo Ocean Race at Fort Adams State Park. The race will be held in spring 2018. In 2015, an economic impact study found that the race brought $47.7 million in revenue back to Rhode Island.
Electric Vehicle Grant – Creates a $250,000 fund to continue the highly successful DRIVE program, which provides incentives to purchasers of electric vehicles. The program will provide rebates of up to $2,500 per vehicle.
Prioritizing Fiscal Responsibility The Administration has sought to prioritize fiscal responsibility and good government reforms in order to fund its investments to improve the lives of all Rhode Islanders. The budget includes substantial efficiency improvements to existing programs. In addition, it aims to shift funding away from inefficient programs and toward those which have shown clear results and demonstrated success. Medicaid Reforms Medicaid continues to be a major budget driver for the State. The state’s Reinventing Medicaid initiative continues to promote and foster health care innovation designed to achieve the Triple Aim of a healthier population, a better patient experience of care and lower costs. This budget builds upon the reform initiatives enacted in fiscal years 2016 and 2017, which aim to save more than $39.0 million without cutting benefits or eligibility for any Rhode Islanders. We must continue to invest in rebalancing the state’s health care system. This budget maintains Reinventing Medicaid initiatives while adding additional reforms, including:
Healthy Aging Initiative – The budget proposes modifying the State’s Integrated Care Initiative (ICI) to remove members who have spent substantial time in a nursing home. The ICI is designed to improve care management for certain Medicaid members. However, the State saves substantial administrative fees by moving these patients out of the ICI. A substantial portion of this savings is reinvested in initiatives to rebalance the state’s long-term care system.
Rate Changes for Medicaid Providers and Managed Care – The budget proposes freezing rates for hospitals, nursing homes and the administrative portion of Medicaid managed care organization payments. In addition, the budget proposes a 1 percent rate cut for hospitals, beginning January 1, 2018, reducing Upper Payment Limit payments to hospitals by 50 percent, and eliminating supplemental Graduate Medical Education payments. These changes will continue to incentivize health care providers to shift care out of high-acuity settings where appropriate.
Increase Children’s Health Account Attachment Point – The budget proposes increasing the attachment
point for the Children’s Health Account. The account funds certain health care services for children who
9

Introduction
are not covered by private insurance. Contributions from private insurance companies cover this cost. However, the contributions do not fully cover the cost of providing these services through Medicaid.
Improve Program Integrity – The State will work to more quickly and thoroughly identify Medicaid members who have alternative coverage available or who have moved out of state and are therefore no longer eligible for coverage.
Additional Organizational Efficiency Initiatives In addition to reforms at Medicaid, the Administration has aggressively looked for opportunities to find efficiencies in existing programs:
Eleanor Slater Hospital Reorganization – As a result of census reductions at the Training School, the budget proposes consolidating certain DCYF youth detention populations at the Training School. This consolidation will allow BHDDH to move individuals from the forensic psychiatric population at Eleanor Slater Hospital into the safer and more clinically appropriate Assessment Center building. This move will generate substantial savings while improving or maintaining the quality of services for all populations involved.
DCYF System of Care Reprocurement – As part of the comprehensive reforms at the Department of Children, Youth, and Families, the Department has worked to reprocure many of the services it provides for children. The reprocurement is designed to allow the department substantial flexibility in service utilization, depending on its actual requirements. Through the reprocurement, the department was able to reduce spending in areas of low need and reinvest savings into new services designed to help find a permanent home for children more quickly.
Public Safety Consolidation – The Emergency Management Agency is merged into the Department of Public Safety to provide a single, consolidated agency focused on protecting Rhode Island. A civilian head of the new department is added to oversee policy and management across all divisions of the department as in most other states.
Fiscal Improvements
Remote Seller Sales Tax Collection – Collecting $34.7 million more in sales tax revenue by adding tools to enforce existing law and collect sales tax revenue from companies without a presence in the state. These are mostly e-commerce companies that have been undercutting local brick-and-mortar stores by avoiding sales taxes. As more purchases move online this change is critical to ensure a level playing field for Rhode Island businesses.
Worker's Comp Outsourcing – Savings of $1.25 million by engaging a private manager for worker’s compensation that can better manage claims, provide more robust worker safety programs, and focus on enabling more injured employees to return to work.
10

Introduction
Fraud Detection and Prevention – Continues the Fraud Detection and Prevention Initiative with an additional $3.5 million in savings in FY 2018. The initiative uses technology, data matching, and enhanced oversight to detect and prevent fraud across executive branch departments. Departments include: Office of Health and Human Services, Department of Labor & Training, Department of Business Regulation, and the Division of Taxation.
e-Procurement – $350,000 in FY18 savings from implementing a modern online procurement system. The current purchasing process is a multi-system, highly manual process for vendors, DOA, agencies and municipalities. It allows vendors to bid electronically at any time, including outside of business hours on nights and weekends. Currently, only mail/walk-in options are available.
Keep Fully Funding PILOT – Adding $3.2 million to Payment in Lieu of Taxes (PILOT) program to offset the municipal property tax losses of nonprofit and government property owners. Fully funded at 27 percent of assessed property taxes on eligible tax exempt properties.
State Personnel Modernization The state’s personnel system, in many instances, is governed by archaic laws, which create barriers to efficiencies in state operations and limit growth opportunities for state employees. The state needs thoughtful and targeted personnel reform to attract top talent, control rising costs, provide more opportunities and options for employees, and create a government that is flexible, innovative, and responsive to Rhode Islanders. The budget includes legislative proposals to provide state government with greater flexibility in hiring and managing personnel. Deficit Reduction The FY 2018 budget closes an estimated shortfall of $66.2 million, up from the FY 2017 deficit of $49.5 million the state faced one year ago. An economic slowdown in the first quarter of calendar year 2016 and reliance on FY 2016 revenue to fund FY 2017 contributed to the somewhat higher deficit. The Governor’s budget successfully closes the projected FY 2018 deficit of $66.2 million through a combination of expenditure reductions, new revenues, and transfers and other operating changes. The Governor’s budget also significantly reduces projected out-year deficits. Compared to FY 2017 projections the FY 2018 budget shrinks the projected FY 2019 deficit by 36 percent from $234 million to $151 million. Decreases in later years are also substantial, with the FY 2020 deficit declining 32 percent and FY 2021 dropping 42 percent.
11

Introduction
$193
$234
$272
$333
$151
$184 $193 $194
$0
$50
$100
$150
$200
$250
$300
$350
FY 2018 FY 2019 FY 2020 FY 2021 FY 2022
Millions ($)
Structural DeficitFY 2017 forecast & FY 2018 forecast
FY 2017 Deficit Forecast FY 2018 Deficit Forecast
These declines are mostly attributable to four reasons. First, growth in the second and third quarters of calendar year 2016 was strong – leading to a strong November revenue estimate and economic strong economic growth projections for later years. Second, the planned opening of the Tiverton Casino and delays in Massachusetts gaming has improved the revenue forecast for gaming in Rhode Island. Also, FY 2018 is the last year of projected substantial (over $40 million) increases to the K-12 funding formula. Finally, the addition of remote seller sales tax revenue helps improve sales tax revenue growth rates. While more work remains to be done, the Governor’s recommended FY 2018 budget continues to make progress in closing Rhode Island’s structural deficit.
12

Overview
The FY 2018 Recommended Budget addresses a projected operating deficit of nearly $184.5 million, while investing in key areas to improve the State’s overall financial outlook. The FY 2018 Budget reflects ongoing improvements in the State’s overall financial condition over the past several years. FY 2016 closed with a surplus of $167.8 million, representing the seventh year in a row the State has closed with a strong surplus. The following outlines the FY 2017 Revised and the FY 2018 Recommended Budgets as proposed by Governor Raimondo on January 19, 2017. Investment in Growth The Raimondo Administration aims to rebalance state expenditures by constraining consumption-oriented spending – for example, health care and benefits programs – and increasing investments such education and workforce training, economic development, and infrastructure. The enacted FY 2017 budget included a Medicaid reform proposal to reduce consumption while increasing funds for economic development and education. As seen in the charts on this page, the FY 2018 budget continues the shift toward investment, specifically elementary and secondary education, higher education, and economic development. Total investment in these three areas climbed from 37.0 percent of general revenue expenditures in FY 2016 to 38.2 percent in FY 2018. At the departmental level, funding for the Department of Education (including school aid to cities and towns) climbed from 30.0 percent of general revenue spending in FY 2016 to 30.6 percent in FY 2018. Funding for the Office of Postsecondary Education and the three institutions of higher education increased from 5.1 percent in FY 2016 to 6.0 percent in FY 2018. Finally, funding for the Executive Office of Commerce and Department of Business Regulation decreases from 1.9 percent of general revenue spending in FY 2016 to 1.6 percent in FY 2018, as most one-time resources for certain economic development initiatives are no longer available.
13
Overview
FY 2018 Recommended Budget: Governor Raimondo recommends an all funds budget totaling $9,248.1 million for FY 2018, an increase of $47.5 million, or 0.5 percent, from the FY 2017 Revised Budget of $9,200.5 million. Of the $47.5 million increase, there is an increase of $92.3 million in general revenue and $5.5 million in other funds, with reductions in federal funds of $16.3 million and in restricted receipts of $33.0 million. Of the $9,248.1 million budget, $3,792.7 million, or 41.0 percent, is from general revenue; $3,081.8 million or 33.3 percent is from federal funds; $2,099.7 million, or 22.7 percent, is from other sources; and $273.8 million, or 3.0 percent, is from restricted or dedicated fee funds. The Governor’s FY 2018 Recommended Budget includes 15,067.4 authorized full-time equivalent (FTE) positions, which is 31.5 FTE positions greater than what is included in the Governor’s FY 2017 Revised Budget Plan and 114.8 FTE positions more than what was included in the FY 2017 Enacted Budget. Recommended FY 2018 general revenue funding of $3,792.7 million represents an increase of $109.0 million, or 3.0 percent, over the FY 2017 enacted budget of $3,683.7 million, and is 2.5 percent higher than the FY 2017 revised budget proposed by the Governor ($3,700.4 million). Recommended FY 2018 federal funding of $3,081.8 million represents an increase of $124.8 million, or 4.2 percent, over the FY 2017 enacted budget, but is $16.3 million below the FY 2017 Revised budget ($3,098.1 million). Other funds and operating transfers increase from $2,040.9 million in the FY 2017 enacted budget to $2,099.7 million in the FY 2018 Budget. FY 2017 Revised Budget: Governor Raimondo recommends a revised all funds budget totaling $9,200.5 million for FY 2017, an increase of $261.8 million, or 2.9 percent, from the FY 2017 Enacted Budget of $8,938.7 million. Of this total, $3,700.4 million, or 40.2 percent, is from general revenue, $3,098.1 million, or 33.7 percent, is from federal funds, $2,095.2 million, or 22.8 percent, is from other sources, and $306.8 million, or 3.3 percent, is from restricted or dedicated fee funds. The Governor’s FY 2017 Revised Budget includes 15,035.9 authorized FTE positions, which is 83.3 FTE positions higher than included in the FY 2017 Enacted Budget. Recommended FY 2017 general revenue funding of $3,700.4 million represents a net increase of $16.7 million, or 0.5 percent, from the FY 2017 enacted budget of $3,683.7 million, and is 4.7 percent higher than the FY 2016 actual expenditure ($3,547.9 million). Federal funds increase from $2,957.1 million in the FY 2017 enacted budget to $3,098.1 million in the revised FY 2017 budget. Other funds increase from $2,040.9 million in the FY 2017 Enacted Budget to $2,095.3 million in the revised FY 2017 budget.
14
Overview
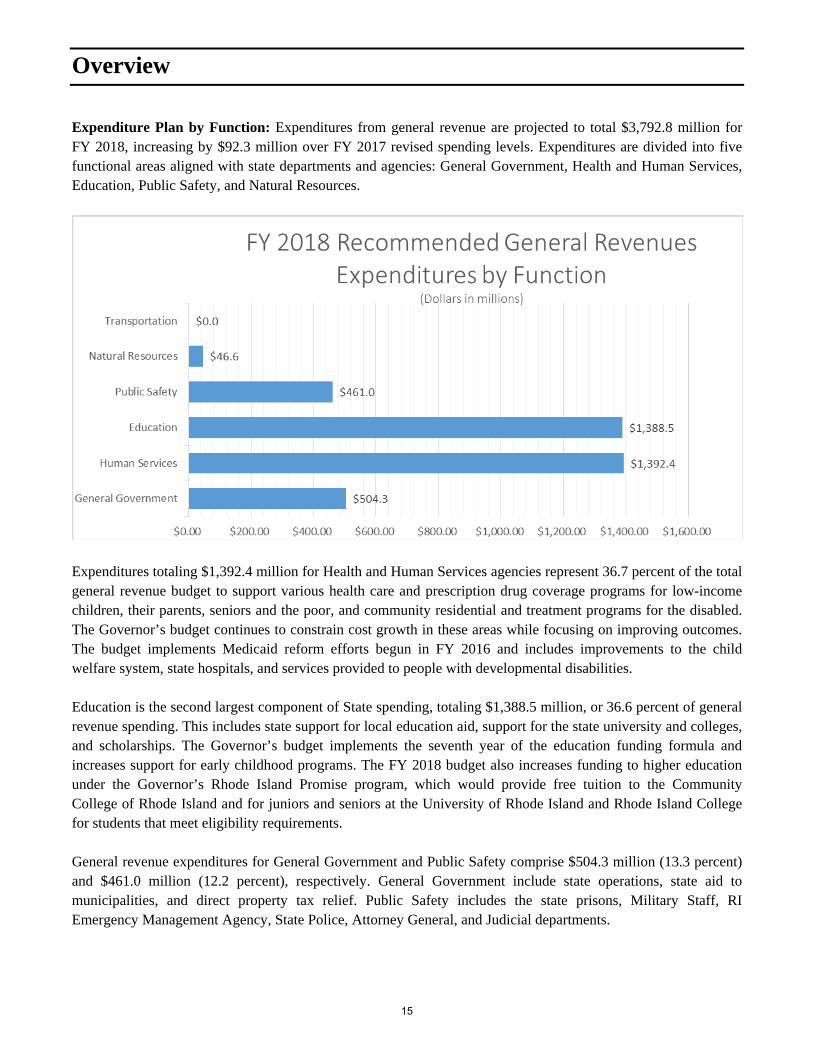
Expenditure Plan by Function: Expenditures from general revenue are projected to total $3,792.8 million for FY 2018, increasing by $92.3 million over FY 2017 revised spending levels. Expenditures are divided into five functional areas aligned with state departments and agencies: General Government, Health and Human Services, Education, Public Safety, and Natural Resources.
Expenditures totaling $1,392.4 million for Health and Human Services agencies represent 36.7 percent of the total general revenue budget to support various health care and prescription drug coverage programs for low-income children, their parents, seniors and the poor, and community residential and treatment programs for the disabled. The Governor’s budget continues to constrain cost growth in these areas while focusing on improving outcomes. The budget implements Medicaid reform efforts begun in FY 2016 and includes improvements to the child welfare system, state hospitals, and services provided to people with developmental disabilities. Education is the second largest component of State spending, totaling $1,388.5 million, or 36.6 percent of general revenue spending. This includes state support for local education aid, support for the state university and colleges, and scholarships. The Governor’s budget implements the seventh year of the education funding formula and increases support for early childhood programs. The FY 2018 budget also increases funding to higher education under the Governor’s Rhode Island Promise program, which would provide free tuition to the Community College of Rhode Island and for juniors and seniors at the University of Rhode Island and Rhode Island College for students that meet eligibility requirements. General revenue expenditures for General Government and Public Safety comprise $504.3 million (13.3 percent) and $461.0 million (12.2 percent), respectively. General Government include state operations, state aid to municipalities, and direct property tax relief. Public Safety includes the state prisons, Military Staff, RI Emergency Management Agency, State Police, Attorney General, and Judicial departments.
15

Overview
Finally, general revenue expenditures for Natural Resources comprise $46.6 million, or 1.2 percent of total general revenue funding. The Natural Resources function includes the Department of Environmental Management and the Coastal Resources Management Council. Transportation expenditures are financed by dedicated gasoline taxes and are not a component of general revenue spending. Expenditures by Category: General revenue expenditures are also sorted into eight categories to group similar types of expenditures across departments. The largest general revenue categories are grants, local aid and personnel. Grants and assistance expenditures total $1,250.9 million, comprising 33.0 percent of total general revenue spending in FY 2018. Local aid expenditures of $1,118.7 million represent 29.5 percent of total spending, which includes fully funding the seventh year of the school aid formula. Personnel expenditures and contracted services of $974.0 million represent 25.7 percent of the budget. Operating expenditures total $141.6 million, or 3.7 percent of the budget; and capital expenditures, including debt service, and operating transfers total $307.5 million, or 8.1 percent of the total general revenue budget.
Expenditures on grants and benefits represent $1,250.9 million, or 33.0 percent of general revenue spending in FY 2018. More than 90.0 percent of these expenditures occur in the Health and Human Services function. In FY 2016 and FY 2017, Governor Raimondo’s budget included substantial Medicaid reforms to control costs and deliver better health outcomes to Rhode Islanders. Partly from implementing those changes, the share of general revenues spent on grants and benefits declined from 33.6 percent of the FY 2017 revised budget to 33.0 percent in FY 2018. Local aid represents $1,118.7 million of general revenue spending in FY 2018, or 29.5 percent. The largest component of local aid is education aid, totaling $1,038.4 million. General revenue funding for local education
16

Overview
aid increases by $45.5 million in FY 2018 over the FY 2017 revised funding level. The Governor’s budget provides $42.5 million for year seven of the K-12 education funding formula, as well as $1.1 million more in categorical funding for early childhood programs. The Governor recommends changes to local K-12 education aid in FY 2018 arising from proposals of the Fair Funding Formula Working Group established in late 2016 to review the existing formula. It continues to fund an English Language Learners weighting component to the formula and adjusts the allocation of funds to school districts and charter schools to reflect local costs and conditions. These investments increase the total share of local aid from 29.0 percent in FY 2017 to 29.5 percent in FY 2018. The third-largest category, personnel and contracted services, includes $974.0 million in FY 2018, or 25.7 percent of general revenue expenditures. In recent years, the state has taken steps to control personnel costs. As a result, personnel costs have decreased as a percentage of general revenue budget by 0.3 percent to 25.7 percent in FY 2018 from 26.0 percent in FY 2017. The chart below demonstrates the Administration’s continued focus on shifting resources from consumption to investment. Local aid has increased from 28.8 percent of general revenue spending in FY 2016 to 29.5 percent in FY 2018, driven by additional funding for local education. Personnel expenditures decreased from 25.9 percent of general revenues in FY 2016 to 25.7 percent in FY 2018. Meanwhile, spending on grants and benefits declined from 34.0 percent of general revenues in FY 2016 to 33.0 percent in FY 2018.
17

The Economy
Introduction The consensus economic forecast, adopted twice a year at the Revenue Estimating Conference (REC), establishes forecasted growth rates for a variety of national and state-level economic indicators. State-level indicators include: total employment; personal income; wage and salary growth; dividends, interest, and rent; and the unemployment rate. National indicators include: the Consumer Price Index for all urban consumers (CPI-U), the interest rate for ten-year U.S. Treasury notes, and the interest rate for three-month U.S. Treasury bills. The three REC conferees — the State Budget Officer, House Fiscal Advisor, and Senate Fiscal Advisor — use the economic indicators to estimate state revenues for the current year and the budget year. The indicators are also used to inform the state’s out-year forecasts.
Economic Forecast During testimony for the November 2016 REC, IHS Markit economists presented forecasts for the U.S. and Rhode Island economies. The Rhode Island Department of Labor and Training (DLT) presented current state employment and labor force trends. The REC conferees adopted the economic forecast through a consensus process, informed by the testimony provided to the conferees. The updated economic forecast made changes to the consensus outlook adopted at the May 2016 REC. IHS Markit economists predicted that national real GDP growth will increase to 2.2 percent in both 2017 and 2018 after its slow-down from 2.6 percent in 2015 to 1.4 percent in 2016. The U.S. economy continued its seventh year of expansion. The fourth quarter of calendar year 2016 saw personal consumption, fixed investment, and government spending increase. Consumer spending, which comprises two-thirds of the U.S. economy, led the end-of-year expansion. IHS Markit testimony identified a number of positive forces that have impacted consumer spending, keeping it relatively stable throughout the country’s recession recovery period. The positive forces include employment growth, rising disposable income, mild inflation, and very low interest rates. Throughout the recovery period, individual consumers have also lowered personal debt levels and increased savings. However, there are also negative forces impeding consumer spending, including sluggish wage gains, high student debt burdens, and precautionary saving. Throughout 2016, the country has also seen a negative impact on net exports resulting from the strength of the U.S. dollar against other currencies. This has impaired the manufacturing industry’s competitive position in international markets and is likely to be a drag on significant economic growth. IHS Markit anticipates that the Federal Reserve will raise interest rates as labor markets tighten and core inflation approaches 2.0 percent. Specific to the Rhode Island economy, IHS Markit testimony noted a modest growth trajectory for Rhode Island as payrolls expanded by 5,300 jobs year over year for September 2016. Administrative support and accommodations/food service jobs contributed the largest gains at 1,400 and 2,900, respectively. However, growth in these job sectors is not anticipated to spur significant economic growth overall, as jobs in these categories typically have lower-than-average wages. Positions with higher-than-average wages in the finance and professional, scientific and technical sectors experienced weak growth, as did manufacturing jobs, likely related to the strength of the dollar. Healthcare payrolls were down year over year, with reports of hospital layoffs, lower revenues, and lower reimbursement rates. Rhode Island continues to have very slow population growth; the state’s birthrate is lower than the national average, which monotonically impacts labor force growth estimates. While there has been steady growth
18
The Economy
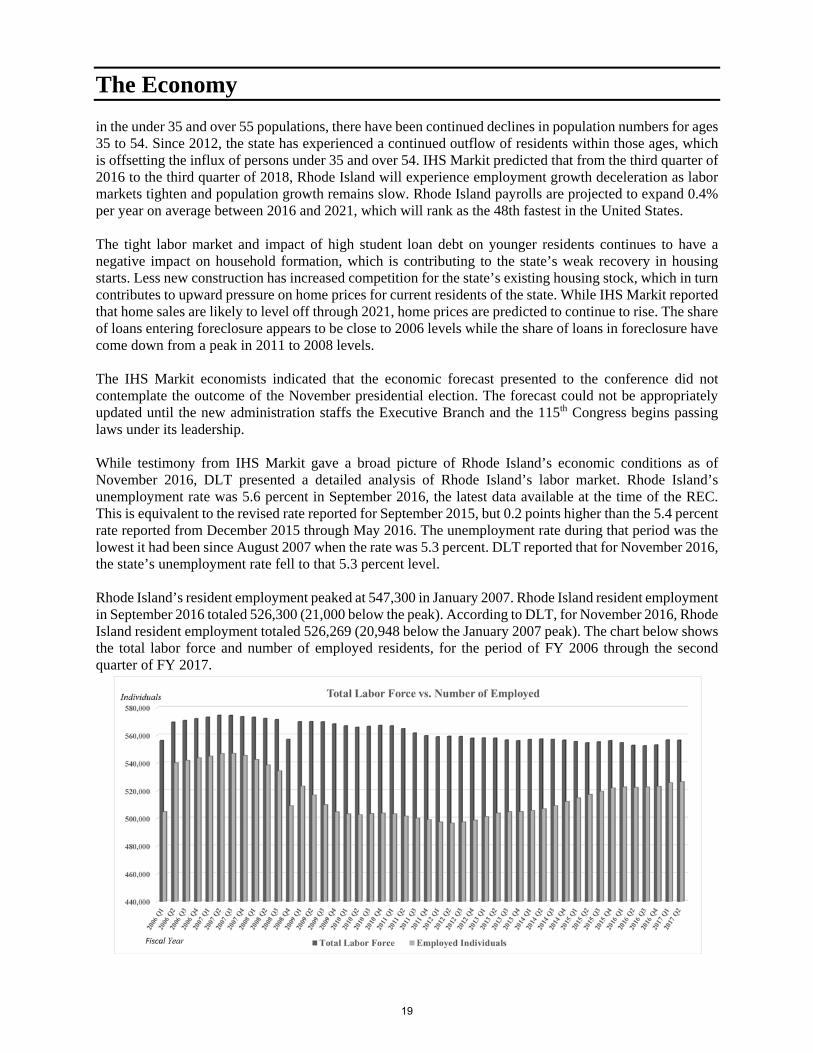
in the under 35 and over 55 populations, there have been continued declines in population numbers for ages 35 to 54. Since 2012, the state has experienced a continued outflow of residents within those ages, which is offsetting the influx of persons under 35 and over 54. IHS Markit predicted that from the third quarter of 2016 to the third quarter of 2018, Rhode Island will experience employment growth deceleration as labor markets tighten and population growth remains slow. Rhode Island payrolls are projected to expand 0.4% per year on average between 2016 and 2021, which will rank as the 48th fastest in the United States. The tight labor market and impact of high student loan debt on younger residents continues to have a negative impact on household formation, which is contributing to the state’s weak recovery in housing starts. Less new construction has increased competition for the state’s existing housing stock, which in turn contributes to upward pressure on home prices for current residents of the state. While IHS Markit reported that home sales are likely to level off through 2021, home prices are predicted to continue to rise. The share of loans entering foreclosure appears to be close to 2006 levels while the share of loans in foreclosure have come down from a peak in 2011 to 2008 levels. The IHS Markit economists indicated that the economic forecast presented to the conference did not contemplate the outcome of the November presidential election. The forecast could not be appropriately updated until the new administration staffs the Executive Branch and the 115th Congress begins passing laws under its leadership. While testimony from IHS Markit gave a broad picture of Rhode Island’s economic conditions as of November 2016, DLT presented a detailed analysis of Rhode Island’s labor market. Rhode Island’s unemployment rate was 5.6 percent in September 2016, the latest data available at the time of the REC. This is equivalent to the revised rate reported for September 2015, but 0.2 points higher than the 5.4 percent rate reported from December 2015 through May 2016. The unemployment rate during that period was the lowest it had been since August 2007 when the rate was 5.3 percent. DLT reported that for November 2016, the state’s unemployment rate fell to that 5.3 percent level. Rhode Island’s resident employment peaked at 547,300 in January 2007. Rhode Island resident employment in September 2016 totaled 526,300 (21,000 below the peak). According to DLT, for November 2016, Rhode Island resident employment totaled 526,269 (20,948 below the January 2007 peak). The chart below shows the total labor force and number of employed residents, for the period of FY 2006 through the second quarter of FY 2017.
19

The Economy
According to testimony provided by DLT, Rhode Island employment increased by 5,300 jobs between September 2015 and September 2016.
Sector Jobs Change Sector Jobs Change
Leisure & Hospitality 3,300 Information (300) Professional & Business Services 1,500 Government 300 Manufacturing 500 Education and Health Services - Other Services 200 Construction 100 Trade, Transportation, & Utilities 200
Financial Activities (500) Total Non-Farm Jobs Change 5,300 DLT expects to see revisions to the June 2016 job numbers reported by the Bureau of Labor Statistics (BLS). The IHS Markit economic forecast incorporates upward revisions to BLS data for forecasted numbers, but uses current BLS total employment numbers for historical figures. As a result, it is likely that the growth rates contained in the forecasts that follow will be revised as historical employment figures are also revised. The November 2016 Consensus Economic Forecast Employment is usually used to gauge the cyclical status of a state’s economy. In FY 2016, total non-farm employment increased by 1.1 percent over FY 2015. In FY 2017, non-farm employment is expected to increase by 0.9 percent to 491,900 jobs. Over the FY 2017 through FY 2022 period, Rhode Island’s economy is expected to add 9,000 jobs. The adopted forecast assumes employment growth will slow from 0.5 percent in FY 2018 to 0.2 percent in FY 2021. For FY 2022, the forecast includes a slight increase in employment growth to 0.4 percent. The employment forecasts adopted at the November 2016 REC were revised downward by an average of 0.45 percentage points for FY 2017 through FY 2020, when compared to the forecast adopted at the May 2016 REC. The unemployment rate is projected to increase slightly from 5.5 percent in FY 2016 to 5.6 percent in FY 2017. It is expected to trend downward, falling to 5.4 percent in FY 2018, and to 5.3 percent in FY 2019 and FY 2020. The unemployment rate anticipated for FY 2018 would be the lowest in nine years. However, it will still be 0.5 percentage points higher than the 4.9 percent rate achieved when the economy peaked in FY 2007. Personal income growth is expected to be 3.0 percent in FY 2017, which is a slight decrease from FY 2016’s 3.4 percent growth over FY 2015. The November 2016 REC’s estimates for personal income growth show a positive upward trend from FY 2018 through FY 2020, peaking at 4.3 percent growth in FY 2019 and FY 2020, before a decrease in year-over-year growth to 4.1 percent for FY 2021 and FY 2022. The adopted estimates for FY 2017 and FY 2018 personal income growth are below the adopted estimates from the May 2016 REC for the same period. The projection includes personal income growth stronger than what was anticipated for the FY 2019 through FY 2021 period by the forecast adopted by the May 2016 REC. The FY 2017 projected growth rate for personal income is down 0.7 percentage points from the adoption of 3.7 percent by the May 2016 REC. For FY 2018, the adopted November 2016 REC personal income growth estimate is also 0.4 percentage points below the 4.4 percent growth rate that was adopted in May 2016. Based on the November 2016 REC, the personal income growth rate is expected to fall to 4.1 percent in FY 2021 and FY 2022.
20

The Economy
The November 2016 REC consensus estimates of 2.6 percent growth in FY 2017 for dividends, interest and rents indicates a modest increase over FY 2016 growth, which was 2.3 percent over FY 2015. Growth for FY 2018 is estimated to be 3.2 percent above FY 2017 levels, with growth rates of 5.2 percent for FY 2019 and 5.5 percent for FY 2020, before falling to 4.4 percent in FY 2012 and again to 3.6 percent in FY 2022. The November 2016 REC consensus wage and salary income growth was lower in FY 2016 relative to the projected growth adopted in May 2016 by 1.2 percentage points. For FY 2017 the November 2016 REC growth rate for wages and salaries was revised downward by 0.6 percentage points, while growth for FY 2018 was revised upwards by 0.2 percentage points when compared to the forecast adopted in May 2016. Wage and salary income growth is expected to remain flat at 4.2 percent year over year from FY 2019 through FY 2021, before increasing by 0.2 of a percentage point. The CPI-U is anticipated to increase to 1.9 percent in FY 2017 from 0.7 percent in FY 2016. In FY 2018 the growth in the CPI-U is expected to climb to 2.5 percent before increasing to 2.6 percent in FY 2020. The forecast of CPI-U growth decelerates to 2.4 percent in FY 2021 and FY 2022. For FY 2017, the interest rate on three-month Treasury bills is expected to rise to 0.5 percent, slightly more than FY 2016’s 0.2 percent rate. In FY 2018, the interest rate on three-month Treasury bills is expected to rise to 1.0 percent and increase again to approximately 1.8 percent in FY 2019. For FY 2020 the rate is expected to climb to 2.5 percent before stabilizing at 2.6 percent in FY 2021, FY 2022 and thereafter. This forecasted increase in the three-month Treasury bill rate is consistent with the anticipated increase of the Federal Reserve’s interest rate target. The interest rate on ten-year Treasury notes is expected to decrease from 2.0 percent in FY 2016 to 1.8 percent in FY 2017, before rising to 2.4 percent in FY 2018, 3.0 percent in FY 2019, and 3.6 percent for FY 2021 and thereafter. The Consensus Economic Forecast for the fiscal years 2017 through 2022 agreed upon by the conferees at the November 2016 REC is shown in the following table.
Rates of Growth (%) FY 2017 FY 2018 FY 2019 FY 2020 FY 2021 FY 2022
Non-Farm Employment 0.9 0.5 0.3 0.4 0.2 0.4
Personal Income 3.0 4.0 4.3 4.3 4.1 4.1
Wage and Salary Income 3.0 4.3 4.2 4.2 4.2 4.4
Dividends, Interest and Rent 2.6 3.2 5.2 5.5 4.4 3.6
Nominal Rates (%)
U.S. CPI-U 1.9 2.5 2.5 2.6 2.4 2.4
RI Unemployment Rate 5.6 5.4 5.3 5.3 5.5 5.5
Ten-Year Treasury Notes 1.8 2.4 3.0 3.6 3.6 3.6
Three-Month Treasury Bills 0.5 1.0 1.8 2.5 2.6 2.6
The differences between the November 2016 and the May 2016 Consensus Economic Forecasts, primarily downward revisions, are shown below.
21

The Economy
Rates of Growth (%) FY 2017 FY 2018 FY 2019 FY 2020 FY 2021 FY 2022
Non-Farm Employment -0.31 -0.58 -0.70 -0.20 0.00 0.00
Personal Income -0.19 -0.09 0.10 0.43 0.41 0.28
Wage and Salary Income -0.17 0.05 -0.11 0.20 0.62 0.63
Dividends, Interest and Rent -0.63 -0.62 0.44 3.23 1.20 0.57
Nominal Rates (%)
U.S. CPI-U -0.14 -0.14 -0.14 0.00 0.04 0.09
RI Unemployment Rate 0.10 0.10 0.08 0.06 0.08 0.10
Ten-Year Treasury Notes -0.42 -0.38 -0.25 -0.10 -0.10 -0.12
Three-Month Treasury Bills -0.29 -0.55 -0.42 -0.22 -0.21 -0.26
Percentage Changes from November 2016 to May 2016 Consensus Economic Forecasts
22

General Revenues
Introduction
The Governor’s recommended budget is based on estimated general revenues of $3.719 billion in FY 2017 and $3.832 billion in FY 2018. Annual estimated growth during FY 2017 and FY 2018 is 1.5 percent and 3.0 percent, respectively. Estimated deposits of $116.6 million and $117.3 million will be made to the Budget Reserve and Cash Stabilization Fund during these fiscal years. The contributions to the Budget Reserve and Cash Stabilization Fund are financed by limiting annual appropriations to 97.0 percent of estimated revenues in FY 2017 and FY 2018. The revenue estimates contained in the Governor’s FY 2017 supplemental and FY 2018 recommended budgets are predicated upon the revenue estimates adopted at the November 2016 Consensus Revenue Estimating Conference (REC) and the Governor’s recommended changes to the adopted general revenues. The Consensus Revenue Estimating Conference is required by statute to convene at least twice annually to forecast general revenues for the current year and the budget year, based upon current law and collection trends, and the consensus economic forecast. The Conference members are the State Budget Officer, the House Fiscal Advisor, and the Senate Fiscal Advisor. Typically, the two required meetings of the Consensus Revenue Estimating Conference occur in November and May of each fiscal year.
FY 2017 Revised Revenues
The principals of the November 2016 Revenue Estimating Conference adopted revenue estimates that were $44.8 million greater than the enacted FY 2017 revenue estimates, an increase of 1.2 percent. As shown in the Changes to FY 2017 Enacted Revenue Estimates table in Appendix A of this document, the Governor’s revised FY 2017 Budget recommends an decrease of $202,882 in revenues over the amount adopted at the November 2016 Revenue Estimating Conference. The recommended change to the FY 2017 adopted estimates is attributable to four items. The first item is a delay in the motor vehicle license plate reissuance from April 2017 to April 2018, which decreases departmental receipts by $935,975. The second item is a transfer from the Office of the Attorney General. State law permits the Attorney General’s office to retain in a restricted account up to $65,000 per year from legal settlements, and the office has been routinely retaining an amount in excess of the statutory limit. A transfer of $401,323 adjusts for this excess. The third item is a transfer from the Department of Administration for excess bond cost of issuance, which will increase departmental receipts by $67,400. The final item is a transfer from the Departments of Business Regulation and Health for excess funds in the departments’ restricted accounts for medical marijuana regulation. The departments are expected to collect more in fees than they will expend on the program. This transfer will increase departmental receipts by $264,370 in FY 2017. All four of these items will be recorded as general revenue, with the revenue decrease from the plate reissuance delay reflected in the Governor’s revenue estimate for departmental receipts, and the additional revenue from the other three items reflected in other sources general revenues.
FY 2017 Revised Revenues vs. FY 2016 Final Audited Recommended revenues for FY 2017 are based upon a $55.7 million increase in total general revenues over FY 2016 final audited revenues, or growth of 1.5 percent. Much of this increase is attributable to projected increases in personal income taxes, general business taxes, and sales and use taxes. However, these increases are partially offset by decreases in excise taxes, other taxes including estate and transfer taxes, departmental receipts, and other sources general revenues including the lottery transfer.
23
General Revenues Personal income tax revenues continue to be the single largest source of state general revenues in FY 2017 at 34.1 percent. FY 2017 personal income tax revenues are estimated to grow at an annual rate of 4.1 percent or $50.2 million above FY 2016 final audited personal income tax revenues. Much of this increase is due to a projected $64.3 million increase in withholding payments, a $9.8 million increase in estimated payments, and a $7.5 million upward adjustment to the estimated accrual. However, these increases are partially offset by an additional $31.7 million in refund payments. FY 2017 revised general business tax revenues are projected to increase by $41.8 million or 9.6 percent. The change is made up of a $32.6 million increase in business corporations taxes along with a combined increase of $10.2 million in public utilities gross earnings taxes and insurance companies gross premiums taxes. These increases are offset by a $988,195 combined decrease in financial institutions taxes, bank deposit taxes, and the health care provider assessment. FY 2017 revised sales and use tax revenues are projected to increase by $42.3 million or 4.3% percent, over final FY 2016 audited revenues. Sales and use taxes represent 27.3 percent of total general revenues in FY 2017 and are projected to be $1,014.2 million. Excise taxes other than the sales and use tax are expected to decrease by $31.3 million or 15.5 percent in FY 2017 over final audited FY 2016 revenues. This change is largely driven by a projected decrease in motor vehicle operator license and registration fees of $26.6 million and a decrease in cigarette excise taxes of $5.1 million. The decrease in motor vehicle operator license and registration fees is largely due to the fact that in FY 2017 seventy-five percent of these fees are being removed from general revenue and placed in the Rhode Island Highway Maintenance Account. Other taxes are projected to decrease by $37.8 million, or 46.4 percent in FY 2017 relative to final FY 2016 audited revenues. Of the total decrease in other taxes, estate and transfer taxes are expected to decrease by $39.0 million or 55.7 percent. This large decrease is largely explained by the fact that there were two unusually large payments received in FY 2016 totaling $52.4 million and similar large payments are not expected to recur in FY 2017. FY 2017 realty transfer taxes are anticipated to increase by $1.2 million while FY 2017 racing and athletics tax revenues are projected to increase slightly. In the Governor’s FY 2017 revised budget, departmental receipts are projected at $363.9 million, a decrease of $3.8 million from final audited FY 2016 revenues, representing a decrease of 1.0 percent. The revised FY 2017 departmental receipts are $935,975 below the FY 2017 revenue estimate adopted at the November 2016 Revenue Estimating Conference. This change results from the delay of the motor vehicle license plate reissuance described above. For FY 2017, total other sources general revenues are projected to decrease by $5.6 million, or 1.4 percent from final FY 2016 audited other sources general revenues. Total other sources general revenue is comprised of other miscellaneous revenues, the lottery transfer and the transfer of proceeds from the unclaimed property program administered by the Office of the General Treasurer. Other miscellaneous revenues are projected to increase by $3.8 million, or 93.1 percent from final audited FY 2016 other miscellaneous revenues. In addition, a decrease is expected in FY 2017 for the lottery transfer of $6.3 million, or 1.7 percent, from the final audited FY 2016 lottery transfer. The projected decrease in the lottery transfer in FY 2017 is due to the results of the November 2016 Revenue Estimating Conference which decreased the estimated transfer amount from video lottery terminals (VLTs) by $4.3 million from final FY 2016 audited revenues. Revenues from table games are projected to increase by 15.3 percent to $18 million, an increase of $2.4 million over FY 2016 final audited revenues. Traditional
24

General Revenues lottery and monitor games revenues are projected to decrease to $56.6 million in FY 2017, a decrease of 7.2 percent, or $4.4 million over FY 2016 final audited revenues. The unclaimed property transfer to the general fund is forecasted to decrease by $3.2 million in FY 2017 or 22.4 percent from final FY 2016 audited revenues. The revised FY 2017 other sources general revenues is $733,093 above the FY 2017 revenue estimate adopted at the November 2016 Revenue Estimating Conference. This change results from the three transfers of excess revenues described above.
FY 2018 Proposed Revenues
Total General Revenue
The Governor’s recommended FY 2018 budget estimates general revenues of $3.833 billion, an increase of 3.0 percent from the revised FY 2017 level. The Governor’s recommendation is comprised of $3.612 billion of revenue estimated at the November 2016 Revenue Estimating Conference (REC) for FY 2018 and $221.0 million of recommended changes to these adopted estimates. These changes are shown in the schedule Changes to FY 2018 Adopted Revenue Estimates located in Appendix A of this document. Personal Income Tax
The largest source of FY 2018 general revenues is the personal income tax. The Governor recommends personal income tax revenues of $1.317 billion in FY 2018, $750,000 more than the estimate adopted at the November 2016 REC and reflecting anticipated growth of 3.9 percent from the revised FY 2017 budgeted amount. The Governor recommends the following changes to the November 2016 REC adopted estimate for FY 2018 personal income tax revenues:
The Governor recommends the addition of 2.0 new FTE Revenue Agent and 2.0 new FTE Data Analyst positions in the Department of Revenue’s Division of Taxation. The addition of these positions is estimated to have a total revenue impact of $2,000,000 divided among personal income tax, business corporations tax, and sales and use tax. The estimated impact on FY 2017 personal income tax revenue is an increase of $750,000. Impacts on other revenue streams are described in each relevant section below.
General Business Taxes
General Business taxes are recommended to comprise 12.4 percent of total general revenue collections in the FY 2018 Budget. Business corporations tax revenues are expected to yield $167.6 million, a decrease of $4.8 million from the FY 2018 estimate adopted at the November 2016 REC. This decrease is attributable to the following initiatives:
The Governor recommends $3.3 million in redeemable manufacturing investment tax credits to be issued by the Commerce Corporation.
The Governor recommends $2.0 million in redeemable job training tax credits to be issued by the Commerce Corporation.
The Governor recommends the addition of 2.0 new FTE Revenue Agent and 2.0 new FTE Data Analyst positions in the Department of Revenue’s Division of Taxation. This is expected to have an impact of $500,000 in additional business corporations tax revenue resulting from enhanced enforcement of current tax policy.
Insurance companies gross premiums tax revenues are projected to reach $133.8 million in FY 2018, a decrease of $980,954 from the FY 2018 estimate adopted at the November 2016 REC. This decrease is due to the Governor recommending the following initiatives:
25
General Revenues
The Governor recommends a collection of Executive Office of Health and Human Services initiatives, six of which will decrease insurance companies gross premiums tax revenue and one of which will increase insurance companies gross premiums tax revenue. The six initiatives that will result in decreases are: (1) Healthy Aging in the Community expenditure reductions (decrease of $504,903), (2) reduce Upper Payment Limit funding by 50 percent (decrease of $197,843), (3) hospital payments managed care rate freeze (decrease of $236,067), (4) managed care administrative cost reductions (decrease of $43,685), (5) hospital rate cut of 1.0 percent (decrease of $51,725), and (6) reduced behavioral health inpatient reimbursement rate (decrease of $49,734). The one initiative that will increase revenue is an increase in the wage rate for home health care workers (increase in revenues of $103,003).
The health care provider assessment is projected to reach $42.9 million in FY 2018, a decrease of $630,273 from the FY 2018 estimate adopted at the November 2016 REC. This decrease is due to the Governor recommending the following initiative:
The Governor recommends a nursing home payments rate freeze, which will reduce health care provider assessment revenue by $630,273.
The Governor’s FY 2018 recommended revenues for the public utilities gross earnings tax, the financial institutions tax, and the bank deposits tax remain at the same level as adopted at the November 2016 REC. Sales and Use Tax
Sales and use tax revenues are expected to yield $1.075 billion in the Governor’s recommended FY 2018 budget, $36.6 million more than was adopted at the November 2016 REC for FY 2018. The increase is reflective of the Governor recommending the following initiatives:
The Governor recommends increasing the excise tax on cigarettes to $4.25 per pack from $3.75 effective August 1, 2017. This is expected to result in $8.7 million in additional FY 2018 recommended revenues with an impact on both sales and use taxes as well as the cigarette excise tax. This policy is projected to result in an increase of $1.1 million in FY 2018 sales and use tax revenue.
The Governor recommends a statutory change that requires remote sellers to report, to both consumers and the Division of Taxation, all purchases made in a given year. This tax reporting requirement is expected to increase compliance with existing law as it pertains to use tax owed on purchases from remote sellers. This policy is projected to result in an increase of $34.7 million in FY 2018 sales and use tax revenue.
The Governor recommends the addition of 2.0 new FTE Revenue Agent and 2.0 new FTE Data Analyst positions in the Department of Revenue’s Division of Taxation. This is expected to have an impact of $750,000 in additional sales and use tax revenue resulting from enhanced enforcement of current tax policy.
Excise Taxes Other than Sales and Use Taxes
The Governor recommends FY 2018 excise taxes other than sales and use taxes totaling $162.3 million or $7.6 million more than was adopted at the November 2016 REC for FY 2018.
The Governor recommends cigarettes excise taxes in FY 2018 in the amount of $141.5 million or $7.6 million more than the adopted estimate of $133.9 million at the November 2016 REC for FY 2018. The Governor recommends one initiative that will increase cigarette excise tax revenues as described below:
The increase in the cigarette excise tax described above is expected to result in a $7.6 million increase in FY 2018 recommended cigarette excise tax revenues. This expected increase is
26

General Revenues
comprised of $6,544,616 in increased cigarette excise tax revenues and $1,028,208 from the cigarette floor stock which is triggered when there is an increase in the cigarette excise tax rate.
The Governor’s FY 2018 recommended revenues for the motor vehicle operator license and vehicle registration fees, motor carrier fuel use tax, and alcohol excise tax at the same levels as adopted at the November 2016 REC. Other Taxes
The Governor’s FY 2018 recommended revenues for the estate and transfer tax, racing and athletics tax, and realty transfer tax remain at the same levels as adopted at the November 2016 REC.
Departmental Receipts
The Governor’s FY 2018 recommended departmental receipts revenues of $375.0 million are $11.1 million more than the revised FY 2017 estimate, and represent 9.8 percent of recommended FY 2018 total general revenues. The proposed FY 2018 departmental receipts revenue estimate is $168.3 million above the FY 2018 departmental receipt estimate adopted at the November 2016 REC. The Governor’s FY 2018 recommended total for departmental receipts revenues is made up of the following proposals:
Licenses and Fees
The Governor recommends reinstituting the hospital licensing fee on the hospital FY 2015 base year at 5.652 percent. This is expected to result in an increase of $169.0 million in FY 2018 recommended departmental receipts revenues.
The Governor recommends the elimination of the Department of Labor and Training’s apprenticeship fee. This is expected to result in a decrease of $45,000 in FY 2018 recommended departmental receipts revenues.
The Governor recommends the transfer of Eisenhower House revenues from departmental receipt revenues under the Rhode Island Historical Preservation and Heritage Commission to a restricted receipts account under the Department of Environmental Management. This transfer is expected to decrease FY 2018 recommended departmental receipts revenues by $153,500.
Fines and Penalties
The Governor recommends increasing two penalties collected by the Department of Labor and Training. One change will increase the employee misclassification penalty from $500 to $1,500, and is expected to increase FY 2018 recommended departmental receipts revenues by $100,000. The other change will increase the electrical trades violations penalty from a range of $500-$950 to a range of $1,500-$2,000, and is expected to increase FY 2018 recommended departmental receipts revenues by $100,000.
The Governor recommends establishing two new penalties that will be collected by the Department of Labor and Training. One penalty would collect 15 to 25 percent of wages owed (first offense) for employer wage and hour violations, and is expected to increase FY 2018 recommended departmental receipts revenues by $150,000. The other new penalty would collect $250 per quarter for employers that fail to properly maintain payroll records, and is expected to increase FY 2018 recommended departmental receipts revenues by $300,000.
Sales and Services
The Governor recommends delaying the motor vehicle license plate reissuance from April 2017 to April 2018, which is expected to decrease FY 2018 recommended departmental receipts revenues by $1.1 million.
27

General Revenues Other Sources
The FY 2018 recommended revenues for the other sources component of total general revenues totals $389.6 million, an increase of $15.2 million, or 1.9 percent, compared to the revised revenue estimate for FY 2017. The FY 2018 recommended revenues for other general revenue sources are $14.1 million above the estimate of $375.4 million adopted at the November 2016 REC for FY 2018. Other sources of general revenue are comprised of the lottery transfer, other miscellaneous revenues and the unclaimed property transfer. The Governor’s proposed changes contained in the FY 2018 recommended budget impacting the other miscellaneous revenues component within other sources of revenue are listed below:
The Governor recommends a transfer from the Departments of Business Regulation and Health for excess funds in the departments’ restricted accounts for medical marijuana regulation. This transfer is expected to increase in FY 2018 recommended other sources revenues by $670,641.
The Governor recommends an increase in the rent charged to the Public Utilities Commission from $13.81 per square foot to $19.75 per square foot, resulting in an increase in FY 2018 recommended other sources revenues of $160,380
The Governor recommends transferring $1.2 million in excess reserves from the Rhode Island Health and Educational Building Corporation.
The Governor recommends transferring $2.6 million in excess reserves from the Rhode Island Turnpike and Bridge Authority.
The Governor recommends transferring $2.5 million in excess reserves from the Narragansett Bay Commission.
The Governor recommends transferring $6.0 million in excess reserves from the Rhode Island Resource Recovery Corporation.
The Governor recommends transferring $1.0 million in excess reserves from the Rhode Island Infrastructure Bank.
The Governor’s FY 2018 recommended revenues for the lottery transfer and the unclaimed property transfer remain at the same level as adopted at the November 2015 REC. The chart below shows the sources of general revenues for the period FY 2014 – FY 2018. The values of the two major sources of general revenues, personal income taxes and sales and use taxes, are highlighted.
28

General Revenues
1227.6 1217.4
1267.61317.0
1168.9 1173.8 1184.81237.0
0.0
200.0
400.0
600.0
800.0
1000.0
1200.0
1400.0
FY 2015 FY 2016 FY 2017 FY 2018
General Revenue Sources ($ millions)
Personal Income Tax General Business Taxes Sales and Use Taxes Other Miscellaneous Revenues Lottery Receipts Other Taxes Departmental Receipts Other Sources
29

Restricted Receipts and Pass Through Revenues
Introduction
The Governor’s recommended budget proposes changes to revenue sources other than general revenues for FY 2017 and FY 2018. The revenue estimates in the Governor’s FY 2017 revised budget contains a decrease of $665,593 in non-general revenues. The revenue estimates in the Governor’s FY 2018 recommended budget contain a decrease of $393,141 in non-general revenues.
FY 2017 Revised Non-General Revenues The Governor’s revised FY 2017 revised budget includes a transfer from the Office of the Attorney General’s restricted receipt accounts. State law permits the Attorney General’s office to retain in a restricted account up to $65,000 per year from legal settlements, and the office has been routinely retaining an amount in excess of the statutory limit. This transfer will decrease the restricted receipt account by $401,323. The Governor’s revised FY 2017 budget includes a transfer from the Departments of Business Regulation and Health for excess funds in the departments’ restricted accounts for medical marijuana regulation. The departments are expected to collect more in fees than they will expend on the program. This transfer will decrease the departments restricted receipt accounts by $264,370.
FY 2018 Recommended Non-General Revenues
The Governor’s FY 2018 recommended budget includes a transfer from the Departments of Business Regulation and Health for excess funds in the departments’ restricted accounts for medical marijuana regulation. The departments are expected to collect more in fees than they will expend on the program. This transfer will decrease the departments restricted receipt accounts by $670,641. The Governor’s FY 2018 recommended budget includes a transfer of Eisenhower House revenues from departmental receipt revenues under the Rhode Island Historical Preservation and Heritage Commission to a restricted receipt account under the Department of Environmental Management. This transfer is expected to increase the Department of Environmental Management’s restricted receipt accounts by $153,500. The Governor’s FY 2018 recommended budget includes an increased penalty collected by the Department of Labor and Training. The department will increase the penalty for the late filing of employer tax and withholding record reports from $10-$150 to $25-$200. This increased fee is expected to increase the department’s restricted receipt accounts by $125,000.
30

All Sources The total budget of $9.248 billion includes all sources of funds from which state agencies make expenditures. Federal funds represent 33.3 percent of all funds. Almost 78.5 percent of federal funds are expended for human services, primarily for Medicaid. Income and Sales Taxes combined represent 27.6 percent of all revenue sources. University and College Funds, and Income Support Benefit payments represent 9.7 percent, and 3.9 percent of the total, respectively. Remaining sources include: Other General Revenues, 9.4 percent; the Lottery Transfer, 3.9 percent; Restricted Receipts, 3.0 percent; and Other Funds 9.2 percent.
$3,081.8
$1,317.0
$1,237.0
$894.4
$873.8
$846.3
$365.0
$359.0
$273.8
0.0% 5.0% 10.0% 15.0% 20.0% 25.0% 30.0% 35.0% 40.0%
Federal Funds
Personal Income Tax
Sales Tax
University & College Funds
Other General Revenues
Other Funds
Lottery Transfers
Income Support Benefit Payments
Restricted Receipts
FY 2018 Revenue Forecast ‐ All Sources(Dollars in Millions)
31

All Expenditures The Governor’s FY 2018 Budget recommendation is $9.248 billion in all funds comprised of six functional units of state government: Health and Human Services, Education, General Government, Public Safety, Transportation, and Natural Resources. Approximately 42.1 percent of all expenditures are for Health and Human Services, comprised of agencies that engage in a broad spectrum of activities including income support, client subsidies, client advocacy, case management and residential support, and medical regulation, prevention, treatment, and rehabilitation services. The FY 2018 recommended budget for all health and human service agencies is $3.897 billion. Approximately 28.0 percent of all expenditures are for Education, which includes the Department of Elementary and Secondary Education, Public Higher Education, the Rhode Island State Council on the Arts, the Rhode Island Atomic Energy Commission, and the Historical Preservation and Heritage Commission. The FY 2018 recommended budget for education is $2.593 billion. Approximately 16.6 percent of all expenditures are for General Government, which includes agencies that provide general administrative services to other state agencies, assist in developing the state’s workforce, assist municipalities in achieving fiscal health, and those that perform state licensure and regulatory functions. The FY 2018 recommended budget for all General Government agencies is $1.536 billion. Approximately 6.4 percent of all expenditures are for Public Safety, which is the system that provides law enforcement, adjudicates justice, performs correction and rehabilitative services, and handles emergencies impacting Rhode Island’s citizens. The FY 2018 recommended budget for the public safety system is $592.3 million. Approximately 5.5 percent of all expenditures are for Transportation, which provides for the state’s maintenance and construction of a quality transportation infrastructure. The FY 2018 recommended budget for transportation is $510.5 million. Approximately 1.3 percent of all expenditures are for Natural Resources, which includes the Department of Environmental Management and the Coastal Resources Management Council. The FY 2018 recommended budget for natural resources is $118.5 million.
32
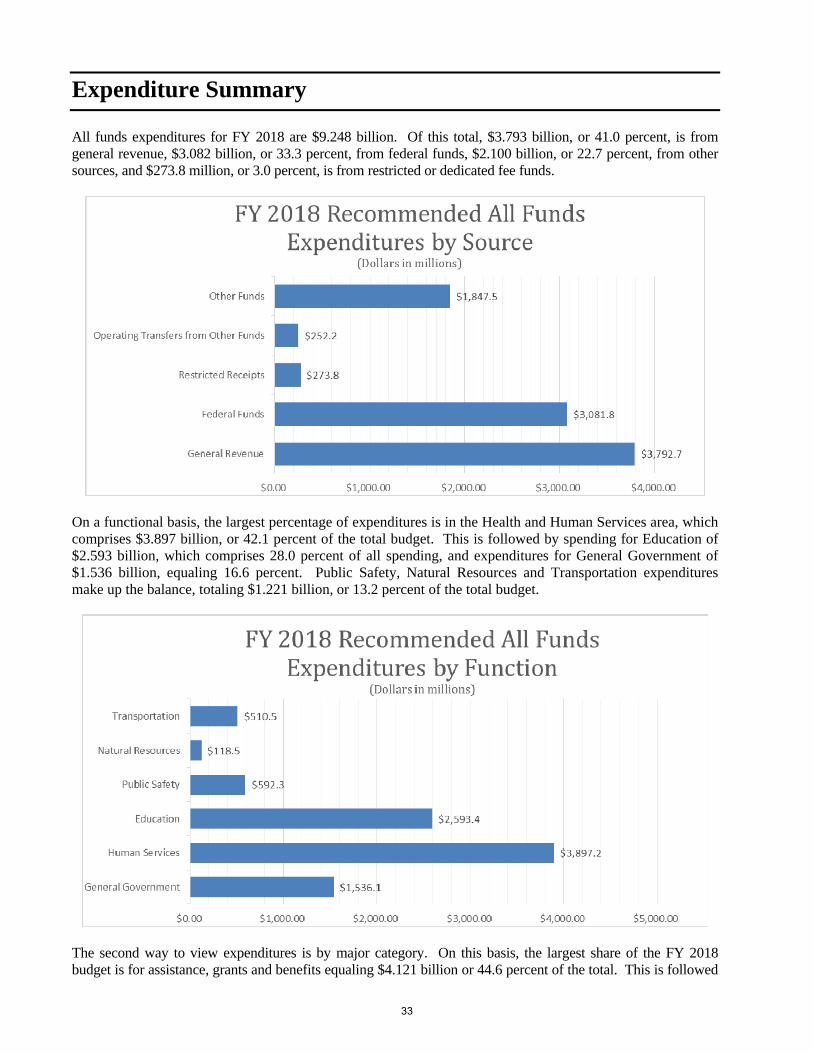
Expenditure Summary
All funds expenditures for FY 2018 are $9.248 billion. Of this total, $3.793 billion, or 41.0 percent, is from general revenue, $3.082 billion, or 33.3 percent, from federal funds, $2.100 billion, or 22.7 percent, from other sources, and $273.8 million, or 3.0 percent, is from restricted or dedicated fee funds.
On a functional basis, the largest percentage of expenditures is in the Health and Human Services area, which comprises $3.897 billion, or 42.1 percent of the total budget. This is followed by spending for Education of $2.593 billion, which comprises 28.0 percent of all spending, and expenditures for General Government of $1.536 billion, equaling 16.6 percent. Public Safety, Natural Resources and Transportation expenditures make up the balance, totaling $1.221 billion, or 13.2 percent of the total budget.
The second way to view expenditures is by major category. On this basis, the largest share of the FY 2018 budget is for assistance, grants and benefits equaling $4.121 billion or 44.6 percent of the total. This is followed
33

Expenditure Summary
by personnel expenditures (including consultants), which comprise 21.4 percent, or $1.979 billion, and local aid expenditures, which make up 13.9 percent, or $1.289 billion of the total budget. Expenditures for capital purchases and debt service total $721.9 million or 7.8 percent, with the balance of spending used to finance operating expenditures and operating transfers of $1.137 billion, or 12.3 percent of the total.
For general revenue only, expenditures total $3.793 billion for FY 2018. By function, spending by Health and Human Service agencies represents the largest share with expenditures, totaling $1.392 billion, or 36.7 percent of the general revenue budget. This is followed by spending for Education, which totals $1.388 billion, or 36.6 percent. General revenue expenditures for General Government and Public Safety comprise $504.3 million (13.3 percent) and $461.0 million (12.2 percent), respectively. Expenditures for Natural Resources comprise $46.6 million, or 1.2 percent of total general revenue spending. Transportation expenditures are financed mostly by dedicated gasoline taxes and motor vehicle fees and are not a component of general revenue spending.
34

Expenditure Summary
The largest components of general revenue expenditures are assistance, grants, and benefit expenditures of $1.251 billion, comprising 33.0 percent of total general revenue spending. Local Aid expenditures of $1.119 billion represent 29.5 percent of total spending; personnel expenditures (including contracted services) of $974.1 million comprise 25.7 percent of the budget; capital expenditures total $8.7 million and debt service is $175.4 million, or a combined total of 4.9 percent of the general revenue budget; and, operating expenditures and operating transfers total $265.0 million, or 7.0 percent of the budget.
35
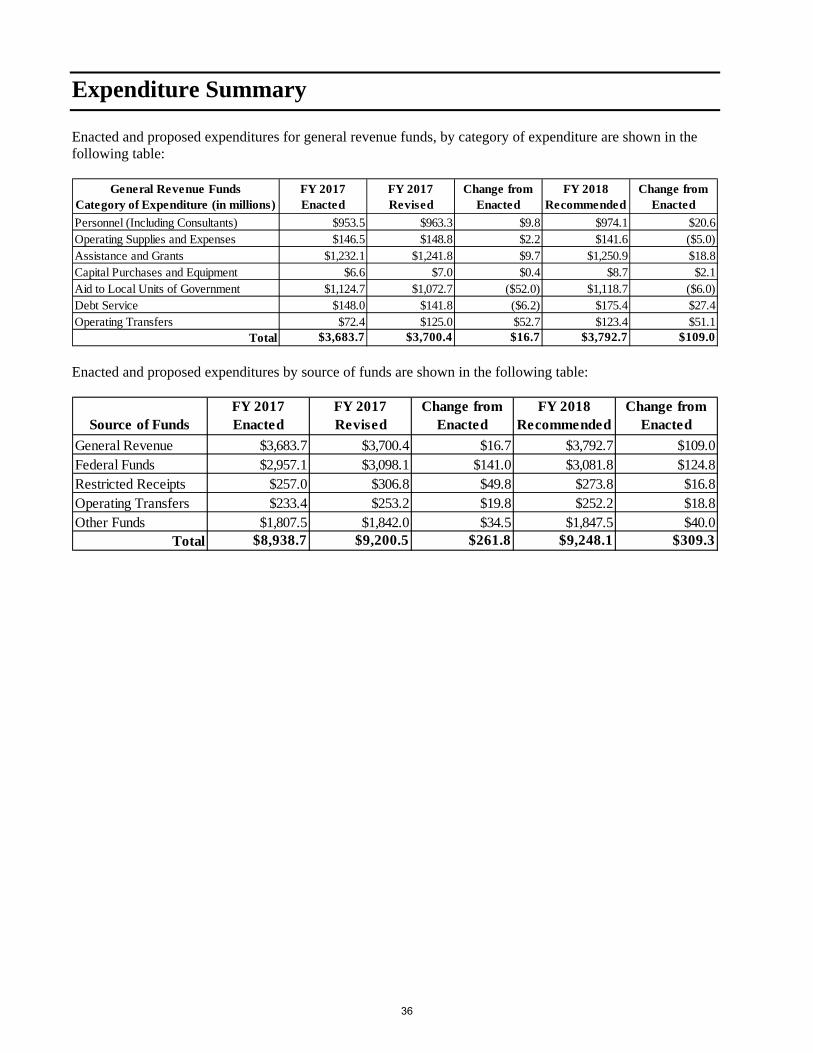
Expenditure Summary
Enacted and proposed expenditures for general revenue funds, by category of expenditure are shown in the following table:
General Revenue Funds Category of Expenditure (in millions)
FY 2017 Enacted
FY 2017 Revised
Change from Enacted
FY 2018 Recommended
Change from Enacted
Personnel (Including Consultants) $953.5 $963.3 $9.8 $974.1 $20.6 Operating Supplies and Expenses $146.5 $148.8 $2.2 $141.6 ($5.0)Assistance and Grants $1,232.1 $1,241.8 $9.7 $1,250.9 $18.8 Capital Purchases and Equipment $6.6 $7.0 $0.4 $8.7 $2.1 Aid to Local Units of Government $1,124.7 $1,072.7 ($52.0) $1,118.7 ($6.0)Debt Service $148.0 $141.8 ($6.2) $175.4 $27.4 Operating Transfers $72.4 $125.0 $52.7 $123.4 $51.1
Total $3,683.7 $3,700.4 $16.7 $3,792.7 $109.0 Enacted and proposed expenditures by source of funds are shown in the following table:
Source of FundsFY 2017 Enacted
FY 2017 Revised
Change from Enacted
FY 2018 Recommended
Change from Enacted
General Revenue $3,683.7 $3,700.4 $16.7 $3,792.7 $109.0 Federal Funds $2,957.1 $3,098.1 $141.0 $3,081.8 $124.8 Restricted Receipts $257.0 $306.8 $49.8 $273.8 $16.8 Operating Transfers $233.4 $253.2 $19.8 $252.2 $18.8 Other Funds $1,807.5 $1,842.0 $34.5 $1,847.5 $40.0
Total $8,938.7 $9,200.5 $261.8 $9,248.1 $309.3
36

Personnel Summary The Governor’s FY 2018 recommended Budget finances personnel at $1.99 billion. This includes $1.7 billion for salary and benefits (87.0 percent) and $258.3 million for purchased services (13.0 percent). This total includes expenditures financed from general revenue, federal grants, restricted receipts, other funds, and internal service funds. General revenue finances 48.9 percent of FY 2018 personnel expenditures. Federal funds finance 21.1 percent, Other Funds (primarily college tuition funds) and Internal Service Funds finance 24.4 percent, and restricted receipts finance the remaining 5.6 percent. The personnel supplements provided in the budget volumes contain all expenditures for personnel, including those of the internal service funds, as noted above. Since internal service fund positions are financed through charges to state agencies categorized as operating expenses, totals shown will differ in some cases from personnel costs shown in complementary documents of the FY 2018 Budget. After adjusting to reflect internal service fund personnel expenditures in the personnel category rather than as an operating expense, personnel expenditures constitute approximately 21.4 percent of the state budget, the second largest category of spending (after assistance, grants and benefits).
Personnel expenditures recommended for FY 2018 decrease by $53.3 million from the FY 2017 revised Budget, and decrease by $6.2 million (2.6 percent) from the FY 2017 enacted Budget. From the enacted Budget, direct salaries increase by 1.5 percent, overtime decreases by 6.3 percent, fringe benefits increase by 5.0 percent overall, with retiree health increasing by 2.7 percent and retirement increasing by 2.0 percent, and medical benefits (including the medical waiver bonus) increasing by 8.3 percent. The enacted FTE position authorization for FY 2017 is 14,952.6. In the FY 2017 revised Budget, the Governor recommends a FTE position authorization of 15,035.9, an increase of 83.3 FTE positions from the FY 2017 enacted Budget. In the FY 2018 Budget, the Governor recommends a further increase of 31.5 FTE positions from the FY 2017 revised Budget, to a total of 15,067.4 FTE positions. Current Retiree Health Benefit Structure In order to address the unfunded liability associated with retiree health benefits and reduce the ongoing cost to the taxpayer, eligibility requirements and co-share percentages for retiree health were modified in the 2008 session of the General Assembly. The new plan provided that employees retiring after October 1, 2008 would
37
Personnel Summary be eligible for retiree health coverage through the State if they are age 59 or over with a minimum of 20 years of service. For employees retiring before October 1, 2008, an employee with over 10 years of service as of July 1, 2005 was eligible for retirement with at least 28 years of service at any age, or at least 10 years of service and at least age 60, and was therefore eligible for retiree heath. For those employees with less than 10 years of service prior to July 1, 2005, the employee had to be age 59 with at least 29 years of service, age 65 with ten years of service, or age 55 with 20 years of service in order to be eligible for retirement and therefore also eligible for retiree health. The enacted reform modified the co-share percentage to require a 20 percent co-share on the full cost of the early retiree or post-65 plan in which the retiree is enrolled. For those retiring prior to October 1, 2008, the early retirees pay a co-share based on years of service on the active employee rate. For these employees retiring prior to October 1, 2008, who are over age 60 with at least 28 years of service, the state pays 100 percent of the cost of the plan. Funding of Retiree Health Unfunded Liability The Governor’s recommended budget includes previously added provisions requiring that the State finance retiree health benefits on an actuarial basis and amortize the unfunded liability over a thirty year period. This financing mechanism will provide transparency with respect to the true cost of the benefit offered to state employees after employment. In compliance with GASB Statements 43 and 45, “Other Post-Employment Benefits (OPEB),” in July 2007, the State obtained an actuarial estimate of the unfunded liability relating to retiree medical benefits. During the 2008 session of the General Assembly, in order to begin funding this unfunded liability, legislation was enacted that required the State to finance on an actuarial basis and authorized creation of a trust fund for retiree medical benefit liabilities. During the 2009 Session of the General Assembly, this actuarial financing requirement was delayed until FY 2011.
Beginning with the first pay period of FY 2011, the state began providing the resources necessary to the OPEB trust fund to finance retiree health benefit costs on an actuarial basis, which will be used to pay current benefits and hold assets for investment.
Actuarial valuations for the Retiree Health Fund are performed every two years and the rates determined by the valuation are used for the two fiscal years following their adoption. A valuation was completed in June 2016 for the fiscal year ending June 30, 2015 and the rates from this valuation would be used for fiscal years 2018 and 2019. Retiree health is calculated on salaries of different categories of employees, including state employees, State Police, and judges. Due to full funding of their respective fund, no assessment is required for judges. For FY 2018, the Governor’s budget recommendation recognizes an increase in the rate for retiree health insurance for state employees from the FY 2017 enacted rate of 5.97 percent to 5.98 percent in FY 2018 per the actuarial report issued by Gabriel, Roeder and Smith. There are also changes for legislators (decrease from 1.53 percent to 0.81 percent) and for State Police (increase from 33.39 percent to 34.89 percent). Cost of Living Adjustments For both FY 2017 and FY 2018, a recently signed arbitration award with the Rhode Island Brotherhood of Correctional Officers includes financing for a cumulative wage increase of 10.68 percent for 989 correctional officers and nurses, (2.0 per cent in FY 2012, 2.0 per cent in FY 2013, 2.0 percent in FY 2014, 2.0 percent in FY 2015, 2.0 percent in FY 2016 and 2.25 per cent beginning in January 1, 2017). The award is retroactive to FY 2015 and FY 2016 ($18.1 million) as well as in FY 2017 ($12.2 million). When adjusted for audit adjustments of $5.5 million and the base budget of $8.3 million, the total additional funding is $3.9 million in FY 2017 and $6.7 million in FY 2018.
38
Personnel Summary For the State Police, the Governor’s recommended budget includes $1.0 million from general revenue in FY 2017 revised and FY 2018 to finance a salary increase retroactive to May 2016 resulting from a negotiated settlement agreement and to provide a general salary increase of 1.25 percent effective July 1, 2017 and 2.0 percent effective November 1, 2017. A $300,000 contract reserve is also included to finance anticipated raises for Capitol Police officers. Employee Medical Benefits For FY 2017 revised, the budget instructions contained an estimated planning value equal to $19,011, a decrease of $100, or approximately 0.005 percent, from the FY 2017 enacted budget amount of $19,111. This is the decrease upon which the statewide target adjustment was based. The Governor’s recommended revised Budget also includes a further reduction in medical benefits of $2.6 million. For FY 2018, the original budget instructions contained an estimated planning value of $20,121, a 5.51 percent increase from the FY 2017 revised value. Updated rates have resulted in a 1.56 percent increase, or a weighted value of $19,825. The state is self-insured for medical benefits and develops annual working rates based upon prior claims experience, adjusted for medical inflation. This fund is used to pay insurers for medical benefits for state employees. Revenue is generated by assessing state agencies on a bi-weekly basis, by co-shares from employees and from pharmaceutical rebates. In the event that there is a surplus, the balance may be used to reduce the working rates by not charging the state agencies for medical coverage for a particular pay period, known as a medical holiday. Employees paying a co-share based on a percentage of the premium cost are also not charged for the respective pay period. Employees paying a co-share based on a percentage of their pay are still charged. Full-Time Equivalent Positions (FTE) The FY 2017 enacted budget contained 14,952.6 full-time equivalent (FTE) positions, including 745.8 FTE positions that are third party funded positions in Higher Education. In order to maintain an acceptable level of critical services and addressing new program concerns, the Governor also recommends an increase of 83.3 FTE positions to 15,035.9 FTE positions in the revised FY 2017 Budget. In FY 2018, the Governor recommends a total FTE position level of 15,067.4, including 745.8 Higher Education third party funded positions, an increase of 31.5 FTE positions from the revised FY 2017 level and 114.8 FTE positions from the FY 2017 enacted level. In General Government, the Governor recommends 2,402.9 FTE positions, a net increase of 60.2 FTE positions in FY 2018 from the FY 2017 enacted budget. The largest increase (24.2) is in the Department of Labor and Training and comprises 3.0 additional labor standards examiners, 13.2 employer and training interviewers, on interpreter/interviewer, one financial analyst, and a net of 6.5 other FTE positions. The Governor recommends the addition of 16.0 FTE positions in the Department of Revenue, 8.0 in the Taxation Division reflecting the establishment of a new integrated tax system to enhance revenue collection, and 8.0 in the Division of Motor Vehicles for the RIMS project. The Governor recommends the addition of 9.0 FTE positions in the Department of Business Regulation, 1.0 in central management, 3.0 in Banking Regulation, and 5.0 in Insurance Regulation. The Department’s FTE level also includes 2.0 health economic specialists transferred from the Health Department, offset by 2.0 vacancy reductions. In the Public Utilities Commission, the Governor recommends an additional 6.0 FTE positions (3.0 in FY 2017 and 3.0 more in FY 2018). The new positions will assist with the growing number of utility termination cases, the increased complexity of issues such as utility regulations, compliance, and increased filings, including grid system and rate modernization, as well as new renewable energy standards, reflecting the work of the Energy Facilities
39

Personnel Summary Siting Board and the Renewable Energy Standard program. The Governor recommends the transfer of 5.0 FTE positions from the Department of Public Safety to the Department of Administration, in order to further centralize human resources and information technology functions. The Governor’s recommend budget also includes the following: a 1.0 FTE position vacancy reduction in the General Treasurer; and a federal funded 1.0 FTE position increase in the Executive Office of Commerce for federal grant management. In Health and Human Services, the Governor recommends 3,561.6 FTE positions; a decrease of 57.0 FTE positions in FY 2018 from the FY 2017 enacted FTE authorization. The Governor recommends the centralization of finance and human resource functions in the Office of Health and Human Services through the transfer of 91.0 FTE positions from the Departments of Human Services (39.0), Behavioral Healthcare, Developmental Disabilities and Hospitals (33.0), Health ((7.0), and Children, Youth and Families (12.0). In addition, the Governor recommends in the Department of Health, a net increase of 3.0 FTE positions, reflecting the transfer of 2.0 FTE positions to OHIC in Business Regulation, a decrease of 1.0 FTE position reflecting boards and licensing consolidation, an additional 3.0 FTE positions in the Lead Abatement program, and an additional 3.0 FTE positions in hospital inspections, complaint investigations, and regulatory enforcement. The Governor’s recommendation also includes a reduction of 60.0 FTE positions in the Department of Human Services, in the expectation of efficiencies in the UHIP program. Other changes carried forward from the FY 2017 revised budget include transfers of 2.0 FTE position from OHHS and DCYF to the Governor’s Office, and a new federal funded position in the Office of the Child Advocate. In Education, the Governor recommends a total authorization (standard and third party funded) of 4,664.7 in FY 2018, an increase of 9.0 FTE positions, including a 10.0 FTE position increase in the Office of Postsecondary Commission of Higher Education for the administrative staff of the newly constructed Rhode Island Nursing Education Center. The recommendation also includes a transfer of 1.0 FTE position from the Historical Preservation and Heritage Commission to the Department of Environmental Management for the management of Eisenhower House. In Public Safety, there is an increase of 25.6 FTE positions to 3,231.2 in FY 2018 from the FY 2017 enacted budget. The Governor recommends an increase of 50.4 FTE positions in the Department of Public Safety. In FY 2017, the Governor recommends inclusion of a Commissioner position, a Director of Cyber Security, and a restoration of 4.0 FTE positions not included in the final FY 2017 enacted budget. In FY 2018, the Governor recommends 2.0 FTE positions to support the new commissioner, 3.0 FTE’s to replace police officers with civilians in administrative posts, 1.0 FTE position in the Fire Marshal’s Office., 5.0 additional Capitol Police screeners, 2.0 rotary officers at BHDDH, and 4.0 positions in the State Police. The Governor also recommends the merger of the Emergency Management Agency with Public Safety, and adds 32.0 FTE positions. The Governor also recommends 3.0 additional FTE positions in the Department of Corrections to enhance mental health services, and 1.0 FTE on the Office of the Public Defender to increase legal representation. In Natural Resources, the Governor recommends 432.0 FTE positions, an increase of 4.0 FTE positions from the FY 2017 enacted budget in the Department of Environmental Management, reflect a 1.0 FTE transfer from Historical Preservation, 2.0 additional FTE positions in the Divisions of Water Resources and Air Resources, and 1.0 FTE position for a new merchandising program. In Transportation, the Governor recommends 775.0, reflecting the restoration 40.0 FTE positions not included in the FY 2017 enacted budget, and an additional 34.0 FTE positions in FY 2018, including 2.0
40
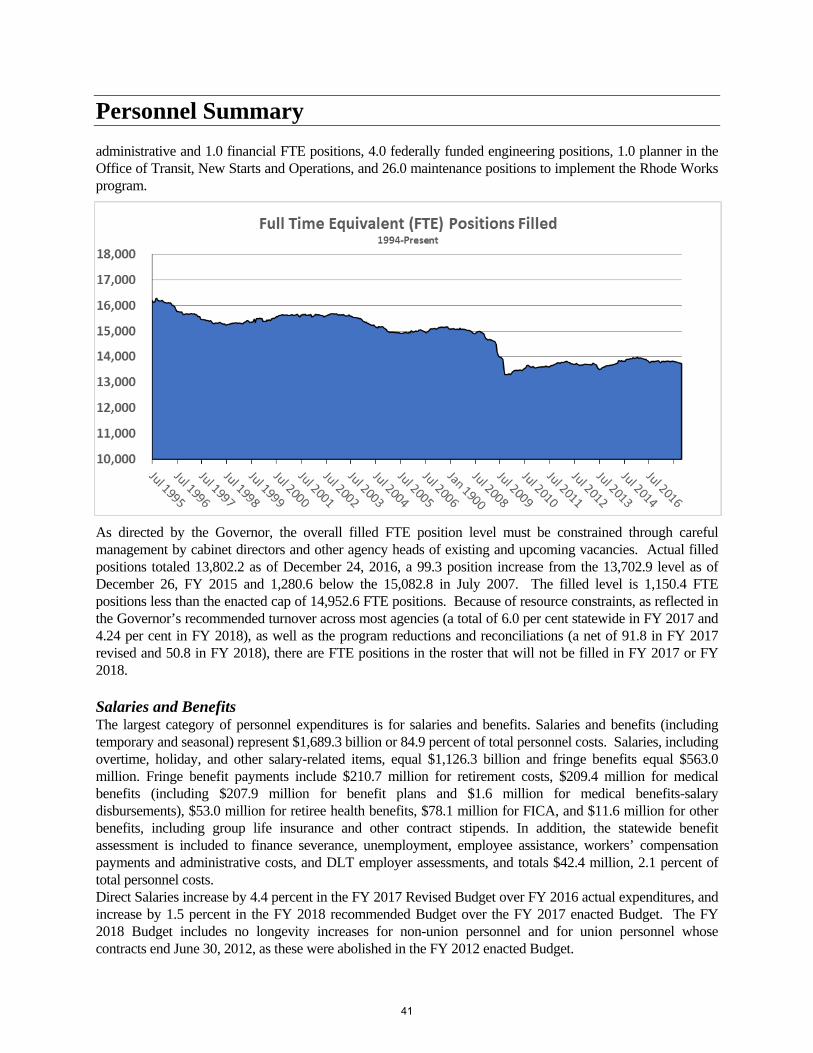
Personnel Summary
administrative and 1.0 financial FTE positions, 4.0 federally funded engineering positions, 1.0 planner in the Office of Transit, New Starts and Operations, and 26.0 maintenance positions to implement the Rhode Works program.
As directed by the Governor, the overall filled FTE position level must be constrained through careful management by cabinet directors and other agency heads of existing and upcoming vacancies. Actual filled positions totaled 13,802.2 as of December 24, 2016, a 99.3 position increase from the 13,702.9 level as of December 26, FY 2015 and 1,280.6 below the 15,082.8 in July 2007. The filled level is 1,150.4 FTE positions less than the enacted cap of 14,952.6 FTE positions. Because of resource constraints, as reflected in the Governor’s recommended turnover across most agencies (a total of 6.0 per cent statewide in FY 2017 and 4.24 per cent in FY 2018), as well as the program reductions and reconciliations (a net of 91.8 in FY 2017 revised and 50.8 in FY 2018), there are FTE positions in the roster that will not be filled in FY 2017 or FY 2018.
Salaries and Benefits The largest category of personnel expenditures is for salaries and benefits. Salaries and benefits (including temporary and seasonal) represent $1,689.3 billion or 84.9 percent of total personnel costs. Salaries, including overtime, holiday, and other salary-related items, equal $1,126.3 billion and fringe benefits equal $563.0 million. Fringe benefit payments include $210.7 million for retirement costs, $209.4 million for medical benefits (including $207.9 million for benefit plans and $1.6 million for medical benefits-salary disbursements), $53.0 million for retiree health benefits, $78.1 million for FICA, and $11.6 million for other benefits, including group life insurance and other contract stipends. In addition, the statewide benefit assessment is included to finance severance, unemployment, employee assistance, workers’ compensation payments and administrative costs, and DLT employer assessments, and totals $42.4 million, 2.1 percent of total personnel costs. Direct Salaries increase by 4.4 percent in the FY 2017 Revised Budget over FY 2016 actual expenditures, and increase by 1.5 percent in the FY 2018 recommended Budget over the FY 2017 enacted Budget. The FY 2018 Budget includes no longevity increases for non-union personnel and for union personnel whose contracts end June 30, 2012, as these were abolished in the FY 2012 enacted Budget.
41

Personnel Summary
Fringe benefit adjustments increase by 10.2 percent in the FY 2017 revised Budget over FY 2016 actual expenditure and increase by a further 5.0 percent in FY 2018 over the FY 2017 enacted Budget. Retirement increases by 10.4 percent in FY 2017 revised from FY 2016 actual and by 1.4 percent in FY 2018 from the FY 2017 revised Budget. This includes a one percent defined contribution addition of $5.3 million. Within state agency budgets, state employer retirement contributions are budgeted at 26.34 percent in FY 2017 and 26.0 percent in FY 2018. FICA increases by 7.4 percent in revised FY 2017 from FY 2016 actual expenditure but in FY 2018 increases by only 1.7 percent from the revised Budget. Retiree Health increases by 7.8 percent in FY 2017 revised from FY 2016 actual expenditure, and by 3.2 percent in FY 2018. The rate remains at 5.97 percent in FY 2017 revised and FY 2018 for state employees. The largest fringe benefit increase is in medical benefits. The FY 2017 revised Budget of $197.0 million includes an overall increase of 10.1 percent over FY 2016 actual expenditure levels. For FY 2018, the recommendation of $207.9 million in medical benefits is an increase of 6.4 percent from the recommended revised budget amount for FY 2017. The two year total is 16.5 percent. The increases include estimated reductions in FY 2018 due to revised estimates.
42

Personnel Summary
Workers’ compensation costs budgeted directly in the agencies in FY 2017 and FY 2018 are $446,886 and $398,090 respectively and are financed primarily in the Department of Corrections and Behavioral Healthcare, Developmental Disabilities and Hospitals. These amounts reflect the continuation of wages in excess of those amounts received as a result of the Workers’ Compensation statute (primarily as a result of assault cases). Since FY 2001, all workers’ compensation costs, as well as unemployment insurance and unused leave severance payments, have been paid from a separate Assessed Fringe Benefits Administrative Fund. The fund is financed by a statewide benefit assessment of a fixed percentage of direct salaries that is charged to every department and agency in this document. The FY 2017 revised Budget and the FY 2018 recommended Budget values are 4.49 percent and 4.2 percent respectively for regular state employees, and includes a downward revision from the enacted 4.75 percent, reflecting surpluses from FY 2016 and lower than estimated expenditures in FY 2017 and FY 2018. However, certain agencies and/or certain employee classifications are not assessed the full rate because they do not receive worker’s compensation benefits. Also, certain higher education employees do not receive severance payments. The assessed fringe benefit rate is applied to all direct salaries, except overtime. Expenditures from the fund have grown from $31.1 million in FY 2008 to $43.1 million FY 2009, but decreased in FY 2010 to $28.8 million. The surge in severance payments was due to the large number of employees that retired prior to changes in retiree health benefit provisions, which became effective October 1, 2008. The FY 2017 revised Budget is $42.5 million, a decrease of 0.6 percent from the enacted budget but an increase of 6.4 percent from FY 2016 actual expenditure. The recommendation for FY 2018 is $42.4 million, a decrease of 0.2 percent from the revised recommendation. The Assessed Fringe Benefit Fund is used to fund the following: services provided by the Donley Center; services of the Workers’ Compensation Court; the Division of Workers’ Compensation administrative costs related to workers’ compensation activities; workers’ compensation benefit payments to employees; payments to workers’ compensation providers; unemployment compensation payments; severance payments to employees for unused leave upon termination from state service; and Cornerstone Program administrative costs for the Flexible Health savings account.
43

Personnel Summary Purchased Services Purchased Services costs in the FY 2018 Budget total $258.3 million, and represent 13.0 percent of total personnel costs. Expenditures in this category are for services provided by outside contractors in cases where special expertise is needed or where it would be less effective to hire full-time employees. Major categories of expenditure are management and consulting services (comprising 29.3 percent of the total), design and engineering services (comprising 18.2 percent), training and education services (comprising 16.8 percent), and information technology services (10.5 percent). Recommended expenditures in the FY 2017 revised Budget of $351.6 million are $48.9 million more than FY 2017 enacted expenditures, a 16.1 percent increase in spending for services, including increases in training services ($5.6 million), design and engineering services ($1.2 million), clerical services ($1.2 million), medical services ($1.0 million) and information technology services ($50.3 million). Recommended expenditures in FY 2018 are $93.3 million less than FY 2017 revised. The greatest decreases are in information technology services ($68.2 million), training and education services ($6.9 million) and management and consultant services ($14.1 million). For each department or agency of state government, the Budget volumes contain an agency summary of personnel costs. For each program, the Budget volumes display all positions and their respective costs. Footnotes will assist readers in understanding variances between the years. Additionally, there are a number of terms used that are not part of every day usage. A Personnel Glossary with extended explanations is included in the back of the Technical Appendix. For more information on the codes used to identify the pay scales, refer to the Glossary. Pay scales are provided on the State’s Human Resources web site under the Compensation and Classification section.
44

Capital Budget
Introduction The Capital Budget reflects the Governor's recommended one-year capital budget and five-year capital improvement plan and contains individual project expenditures as well the debt service component relating to capital improvements and any "pay-as-you-go" capital, which is financed from current revenues. Detailed information on the Governor’s recommendation are presented in detail in a separate document. The following provides a brief summary of the one-year capital budget and the five-year capital improvement plan. Governor Raimondo’s FY 2018 capital budget and five-year capital plan continues to invest limited capital funds to improving the Rhode Island economy. The five year capital plan includes proposed expenditures of $4.908 billion, of which Transportation projects represent 57.2 percent, Natural Resources projects represent 19.5 percent, Education projects represent 11.3 percent, Human Services projects represent 1.0 percent, Public Safety projects represent 3.7 percent and General Government and Economic Development projects represent 7.2 percent.
Over the five year period, all other funding, encompasses $2.444 billion or approximately half of financing for planned projects; a total of $1.313 billion in federal funds will finance approximately 26.9 percent of the planned capital projects; general obligation bonds will finance $396.1 million or 8.1 percent; Certificates of Participation (COPS) will finance $55.6 million or 1.1 percent of projects; the Rhode Island Capital Plan Fund provides $650.9 million or 13.3 percent of planned projects; and $14.9 million is from restricted receipt funding, which invests 0.3 percent of funding.
45

Capital Budget
Rhode Island Capital Plan Fund Of the $4.908 billion recommended in the five year plan, a total of $650.9 million is financed by the Rhode Island Capital Plan Fund (RICAP), a pay-as-you go capital funding program, which has been a key factor in improving the state’s debt management policies. The Governor’s capital budget recommendation continues to provide RICAP funding in order to ensure a reliable and safe transportation system, which is critical to keeping the Rhode Island economy moving forward. The recommendation continues to use a combination of RICAP funding and resources derived from various transportation-related licenses and fees to support the State match for the Department of Transportation’s Highway Improvement Plan (HIP), which is directed towards implementing the federal-funded capital program as identified in the Transportation Improvement Plan. A major part of the HIP consists of the RhodeWorks plan focused on reducing the number of structurally deficient bridges in Rhode Island, from 22% in 2015 to 10% in 2025. The Governor also recommends a total of $470,588 from RICAP in FY 2018 for the Downtown Providence Transit Connector to match a discretionary Tiger Grant awarded to the Rhode Island Public Transit Authority to implement an enhanced transit corridor that will provide peak bus service through downtown Providence and connect passengers to the state’s largest employment hubs and major redevelopment area. The Governor also recommends the use of Department of Transportation gas tax funding to finance major RIPTA bus purchases in FY 2018. The Governor’s FY 2018 capital budget infuses RICAP investment in education infrastructure in both K-12 and higher education institutions. A total of $3.7 million is recommended in FY 2018 for the creation of a new Center for Advanced Manufacturing at the William M. Davies Jr. Career and Technical High School. The Center, which will be open to all Rhode Island students, will offer multiple pathways into manufacturing and engineering careers. A total of $8.2 million is recommended in FY 2018, with additional funding through FY 2020 to continue the campus renewal project at the Knight Campus at the Community College or Rhode Island. A total of $6.1 million in FY 2018 and an additional $6.0 million in FY 2019 will allow for a phased modernization and rehabilitation of the academic buildings and $4.5 million in FY 2018 with $15.1 million
46

Capital Budget through FY 2022 will modernize the infrastructure on the campus of Rhode Island College, including improving traffic circulation on campus. A total of $1.0 million FY 2018 will address the initial infrastructure needs of the Fine Arts Center of the University of Rhode Island. In FY 2018, the Governor includes total funding of $15.7 million to preserve and protect our natural resources, including $1.0 million included for Fort Adams Sailing Improvements, so that needed improvements can be made in time for Rhode Island’s next hosting of the Volvo Ocean Race in May 2018. A total of $250,000 is recommended for a new project, the Narragansett Bay Special Area Management Plan. This project is to develop a set of policies to better protect the Narragansett Bay. A total of $5.7 million is recommended in the five-year plan including $2.3 million in FY 2018 to undertake a hospital consolidation at the Department of Behavioral Healthcare, Developmental Disabilities, and Hospitals. The project will consolidate hospital units to improve the quality of care and gain operation efficiencies. In the enacted FY 2017 Budget, the Capital Projects and Property Management and Facilities Management programs were merged into the newly created Capital Asset Management and Maintenance program (DCAMM). This Division has been tasked to increase the level of facility maintenance throughout the State for facilities under its purview. The merger encourages higher levels of service with more consistency and redundancy. Anticipated outcomes also entail a better alignment of staff resources and clarification of roles and responsibilities in order to support the state’s portfolio such that cost savings and efficiencies are achieved. In order to provide the flexibility this new division will need in its management of statewide projects the Governor recommends the consolidation of major RICAP funded projects under DCAMM’s oversight into five major project categories including Environmental, State Facility, Pastore Center Campus, State House Asset Protection and Capitol Hill Campus. This new consolidation is reflected in the FY 2018 Budget under the Department of Administration. Included in the consolidations is the transfer of oversight of the Shephard Building project from the University of Rhode Island to DCAMM. This capital plan addresses the Governor's desire to continue targeting current resources to infrastructure needs in the state. In order to maintain state-owned property, ensure the safety of those who use these buildings and preserve the value of the properties, the Governor recommends in excess of $531.0 million over the five year capital improvement plan from the Rhode Island Capital Plan Fund for asset protection projects. Under the Governor’s plan, over $160.0 million will be dedicated from this fund in FY 2018 to infrastructure needs. Debt Financing As part of the five year capital budget plan the Governor recommends a total of $50.3 million in Certificates of Participation (COPS) financing to invest in critical projects that seek to modernize systems that span state government agencies, advance clean energy and further economic development in Rhode Island. A total of $11.6 million is recommended for the University of Rhode Island Energy Conservation Phase III for multi-campus installation of LED lighting, HVAC upgrades, building weatherization, and electric sub-metering on the Kingston Campus. In order to implement the Governor’s Executive Order 15-17, which sets robust energy reduction targets and clean energy goals for state agencies, the Office of Energy Resources (OER) will undertake a comprehensive, cost-effective energy efficiency measures and renewable energy installations at state-owned facilities. The funds will allow the State to leverage other funding sources including funds allocated by OER from the state’s participation in the Regional Greenhouse Gas Initiative (RGGI), as well as financial incentives made possible by utility-administered energy efficiency programs supported by the Systems Benefit Charge (SBC) to increase the pool of capital available to support clean energy projects. A total of $16.2 million will finance several IT projects deemed to have a potential positive impact for
47

Capital Budget consolidation, efficiency, and improvements in customer service. Lastly, a total of $10.5 million will support the Coastal Resources Management Council for the Confined Aquatic Dredged Material Disposal (CAD) Cells project. The Army Corps of Engineers has approached the agency to act as the local sponsor to the federal action of maintaining the depths of the Providence River and Harbor Shipping Channel, which was last maintained in 2003. COPS funding will provide the federally state cost share for the construction of a new CAD cell in order to store the removed sediment not suitable for ocean disposal. Increased disposal capacities from new CAD cells are needed to maintain viability of the port and maritime operations, the state’s marine trades industry, and the increased economic value of ProvPort soon-to-be derived from the approved 2016 Rhode Island Port Infrastructure authorized bond. A major source of state financing for capital projects is general obligation bonding. As of June 30, 2016, there were $1.051 billion in outstanding general obligation bonds. Over the five-year planning period, the recommended capital improvement plan provides for the issuance of $486.6 million of authorized debt including the issuance of $227.5 million from the bond referenda approved by the voters in the November 2016 election. Debt Service Budgeting The projection of capital project disbursements and debt service costs reflect updated debt service projections as included in the FY 2018 – FY 2022 Capital Improvement Plan. General revenue funded debt service on all tax supported obligations is projected to rise from $201.1 million in FY 2017 to $231.3 million in FY 2018, and to $239.3 in FY 2022. The five year forecast is based upon outstanding debt and projected new debt contained in the Governor’s recommended FY 2018-2022 Capital Budget. The Governor’s Capital Budget is within the recommended debt guidelines set by the Public Finance Management Board with regards to debt ratios. The projected ratio of debt service to general revenues is also well within the recommended guideline of 7.5 percent. The FY 2017 ratio is 5.19 percent, is projected to increase to 5.81 percent in FY 2019 and is projected to decrease to 5.56 percent by FY 2022. The low percentages in the early years of the plan are the result of the debt restructuring/refinancing completed in July 2015. This lowered the amount of debt service due in FY 2016 and FY 2017, but will result in an increase in debt service in later years. In addition, the state’s general revenue receipts have strengthened in recent years and the out-year forecast reflects a continuing economic recovery. The capital plan shows that net tax supported debt is projected to be $1.480 billion by FY 2012. This would be a reduction of almost $241.8 million from the FY 1996 high of $1.722 billion. As of June 30, 2016, the State had net tax supported debt of $1.791 billion.
48

Capital Budget
As can be seen in the section entitled “Tax Supported Debt Burden” in the Capital Budget document the ratio of debt to personal income which is well within the recommended 5.0 to 6.0 percent guideline, decreasing from 7.02 percent in FY 1996 to 3.08 percent in FY 2017, and projected to further decrease to 2.19 percent by FY 2022.
49

Capital Budget
For FY 2018 the Governor recommends debt service funding from all sources of $243.2 million for debt and other long term obligations, including: $131.6 million for general obligation debt service, $22.5 million for the Convention Center obligation, $9.1 million for motor fuel debt service, $19.1 for federally funded GARVEE debt service, $32.5 million for certificates of participation and long-term obligations, $18.7 million for Higher Education non-general obligation debt, and $7.0 million for performance-based obligations. A detailed description of these obligations can be found in the capital budget document, and the long-term projections are shown in the chart below:
Projected Debt RatioDebt as Percentage of Personal Income
50

Capital Budget
51
