fy 2019 annual report - san antonio
TRANSCRIPT

FORWARD LOOKING.FORWARD THINKING.
FY 2019Annual Report


Letter to Our Stakeholders
As we began to develop this year’s report, we thought about what happened in FY 2019 and considered
where our focus had been. What was our story? It didn’t take long before the theme for this report revealed itself – we spent the
year doing our homework.
San Antonio is growing, no question. In a few short years as our customer base continues to greatly expand, will our current operations prove scalable? We concluded
that right now is the time to evaluate doing certain things differently and in other cases trying something completely new. We’ve documented our due diligence in the sections of this report that
follow. First though, I would like to highlight some achievements we are very proud of.
ISO 45001 Certification
It is not often an individual or organization can state they were first in the world to do something. Our safety team worked diligently this past year on creating the Department’s Safety Management System (SMS). Once it was developed and implemented, we were audited by an outside firm for the scope and effectiveness of the SMS. The report was submitted to the International Organization for Standardization (ISO) and in March we were notified that we had received the ISO’s newest level of certification for industrial safety and injury prevention known as ISO 45001. San Antonio, Texas was the first municipality in the world to receive this certification, clearly showing our continued commitment to a culture of safety.
Performance Excellence
Another recognition at the international level was achieved at the 2019 Solid Waste Association of North America’s (SWANA) International Road-E-O, a competition for CDL driving maneuvers. At the state level, Department competitors nabbed three 1st place, three 2nd place, and two 3rd place finishes. However, at the international event in Phoenix, Arizona our own Juan Barrera, Jr. bested 69 other drivers to become the international champion, a.k.a TOP GUN, in the ‘roll-off’ competition. These events are another great example of our priorities on safety. They demonstrate the precision and skill it takes to operate our equipment and the dedication of our team to mastering this craft.
Program Excellence
In FY 2019, our education and outreach, marketing and communications, ReWorksSA, planning and innovation, organics, and safety programs collectively received 20 awards for innovation, effectiveness, and superior program design. These recognitions were from various organizations including the American Advertising Federation, American Marketing Association, Public Relations Society of America, City-County Marketing Communications Association, State of Texas Alliance for Recycling, Urban and Regional Information Systems Association, and Solid Waste Association of North America. Perhaps the highlight was being nominated for a Lone Star EMMY by the National Television Academy of Arts and Sciences, Texas Chapter for our cart downsizing commercial. The bar has been set.
Personal Excellence
Department employee Aaron Arce received the City Manager’s Excellence Award in May. He is a driver who works in the Warehouse Operations and has been with the City for five years. Aaron is fondly known as the ‘go-
3
FORWARD LOOKING.FORWARD THINKING.

to-guy’ at his worksite for being helpful, caring, resourceful, and happy to offer assistance no matter the task. He excels at training and motivating his staff and co-workers. One example of his dedication was during just a regular work day. Aaron spotted an unsupervised toddler. He knocked on doors up and down the street, taking the time to find the toddler’s home and returned him safely to his very grateful mother who didn’t realize the child was missing. We are extremely proud to have this caliber of professional on our team.
Home School Recycling Expos
Another first in FY 2019 happened in our Education and Outreach Division. This team made over 1,100 presentations last year in schools and at community events. One group that had been difficult to reach was the thousands of families in San Antonio’s home school community. We decided to host a series of events specifically for these families. The programs featured recycling presentations, interactive games and activities, contests, recognitions, and certificates of participation. Over 450 parents and students attended. The initiative received great local media coverage and our plans for FY 2020 will be even bigger.
Aquaman and the River City
Actor Jason Momoa is well-known for his movie roles but also for his passion about recycling. We discovered he would headline the Celebrity Fan Fest in San Antonio and quickly moved to see how we could take advantage of his visit and voice for a recycling message directly to San Antonio residents. Through the tenacity of our team, we convinced the event promoters to allow the SWMD to present him with a gift from the City and say a few words at his fan panel appearance. The event received both local and national news coverage, putting San Antonio clearly in the spotlight as a City leading the way with recycling programs.
ReWorksSA
Our commercial recycling recognition program, ReWorksSA continued making measurable impact in the local business community. The Division exceeded its annual goal by helping 67 organizations achieve recycling certification from the City through consultations, assessments, and resources. More than 100 consultations were conducted for different types of organizations. Another 51 organizations received over 600 indoor recycle bins and the team participated in more than 20 community and Chamber of Commerce events garnering exposure to hundreds of businesses. The program is gaining in both brand fidelity and participation momentum.
Thank You
I would like to thank the 730 women and men who are the Solid Waste Management Department team. Their dedication, professionalism, and work ethic keep our Department able to provide our valued customers excellent service and support.
Forward Looking. Forward Thinking. The future is at hand – and we’re ready.
Sincerely,
David W. McCary, CPM Director City of San Antonio Solid Waste Management Department
4
5
DIVISIONALHIGHLIGHTS
Brush & Bulky
Commercial & Multi‑Family
Customer Service
Education & Outreach
Environmental Services
Fleet Operations
Marketing & Communications
Organics
Planning & Innovation
Recycling
Safety

6
In FY 2019, the Brush and Bulky Division consisted of 154 full-time employees and 30 temporary employees that worked out of six locations. The Division, led by Andrew Gutierrez (inset), maintained a 96% retention rate keeping vacancies at a minimum. Customers were notified of their curbside collection dates by the Division placing out 1.4 million door hangers in FY 2019. Those customer notifications generated 49,669 tons of brush and 34,030 tons of bulky material collected at residents’ homes. Brush was collected twice per year and bulky was also collected twice per year.
Major storms passed through San Antonio in June, 2019. Hardest hit were the Woodlawn Lake and Monticello areas. Special units of the Division swept the area and made 4,751 individual stops, collecting 2,200 tons of downed trees, uprooted shrubs, and other debris. In addition to proactively sweeping these neighborhoods, the Division addressed 1,183 storm calls, 703 out-of-cycle calls, and 169 code hardship calls. These catastrophe relief efforts were completed without any disruption to regular customer service. Later in the summer, all the brush collected was turned into mulch and given back to the residents of the affected areas (pictured below).
Another important residential collection system was the Dial-A-Trailer (DAT) program. Citizens requested large collection trailers for 87 community events and 2,044 customers attending those events dropped off 265 tons of material. The Brush and Bulky Division also monitored and cleaned up illegal dumping sites and removed 1,350 tons of trash from San Antonio’s streets and other areas. This was done with the SWMD special unit, Neighborhood Enhancement Team (NET).
Brush & Bulky

7
The Division worked with internal clients as well. In partnership with the City’s Parks Department, special oak wilt flyers were distributed to six brush zones. By splitting the flyer crew cost, this initiative saved the SWMD $45,063.
Another significant savings occurred through the SWMD’s warehouse relocation effort. Over 40,000 carts were moved by this Division using internal resources which prevented $30,000 in outsourced contract labor. The Brush and Bulky Division continued to assist all four service centers as well as assisting Fleet Operations running much needed parts.
The Division conducted sweeps prior to city-wide events that included the MLK March, Rock-n-Roll Marathon, City Manager’s 5K, the King William Fair, and the Fiesta parades. Other special services continued to be offered such as Christmas tree mulching, mulch delivery to parks and various non-profits, out-of-cycle collections, organic contamination hauling, and City Council and Code compliance assistance. Another important event that the Division supported was the annual Basura Bash, which is an opportunity for volunteers to clean up the banks of the San Antonio River and its tributaries.
The SWMD’s culture of safety was also a priority for the Division with a reduction in preventable accidents in FY 2019. Another performance measure was the compliance rate for Service Level Agreements (SLAs). Over 10,000 calls were addressed and the team maintained a 99.6% SLA compliance rate.
The Brush and Bulky Division also enforced City Code, Chapter 14 for violations such as unaccepted materials, obstructions, and late set outs by residents after crews had passed. Fines for these infractions could be up to $2,000. Out-of-cycle collections were available at a fee determined by the size of items to be collected.
As all other SWMD Divisions did, this team looked forward as well. A new database was implemented that included training and updates. Four 100 cubic yard tractor-trailers were purchased to prepare for future increases in hauling mulch. Three team members were promoted into management positions and one employee became certified by the State of Texas as a Department of Transportation examiner. With this position, the process of certifying candidates for a commercial drivers license (CDL) was brought in-house. Getting trained drivers for the SWMD on the job much more quickly was a significant step toward planning for future staffing needs.

8
The Commercial Initiatives and Multi-Family Recycling Division (CIMFRD) had a successful year with tremendous growth and several key achievements. ReWorksSA remained the major program under the commercial initiatives component of the Division. In addition to the metrics highlighted in the stakeholders letter, ReWorksSA underwent several operational enhancements to improve the recycling certification process.
The entire program was built around businesses achieving steps or practice points to determine a gold, silver, or bronze recycling status. Looking forward to future performance measures, the team spent time in FY 2019 re-evaluating and reconfiguring these practice points to promote the more important elements of a successful recycling program and to enable more and different types of organizations to participate more easily.
Also built for the future were several upgrades to online content at reworkssa.org to help organizations better manage their recycling programs. With the help of ITSD, information on environmental purchasing policies, local recycling drop-off locations, and training checklists for new employees were some of the new pages added to the site. Functionality was also broadened with the creation of a recycling portal. After establishing an account, users could access consultation requests, container orders, and improved certification applications.
ReWorksSA also hosted two major events this past fiscal cycle. On America’s Recycle Day, the group organized a panel discussion forum focused on reducing recycling contamination in the workplace. Additionally, to celebrate the milestone of achieving the first 50 businesses to be certified in the program, known as Charter
Commercial & Multi-Family

9
Members, the SWMD held a members event for those organizations of distinction.
The ReWorksSA brand and program design were recognized in FY 2019 by the American Marketing Association (inset) and the Public Relations Society of America for business to business marketing and also excellence in community relations. The brand continued to gain traction through digital advertising in the Rivard Report, San Antonio Business Journal, and a TV spot on KLRN. The team was also very active in social media campaigns.
The multi-family recycling activities of the Division continued to enforce the Recycling Ordinance passed in 2010 that requires properties with three or more units within the City to provide recycling collection. However, the goal was about better education on compliance than penalties. Two recycling coordinators completed over 400 inspections and helped 97% of these dwellings achieve compliance. Additionally, the team hosted 16 outreach community events and
presented to apartment residents, owners, and managers.
One way the multi-family group looked forward was engaging in a coordinated effort with the Development Services Department to identify newly-constructed properties
for a more expedient on-boarding process.

10
The Customer Service Division was fully-staffed throughout FY 2019 with six specialists and one supervisor. (The inset is Lynn Cox who oversees the Division.) The team was able to assist customers in English and Spanish. They handled 49,834 customer phone calls regarding service issues and general information requests. The Division also processed 518 collection assistance requests for the Department’s special service. During a two-week period in June after large storms swept through San Antonio, the team worked after hours to assist with storm-related calls. After the storms, the Department established a mobile command center in the Woodlawn Lake area and this team staffed the center providing direct customer access.
Calls from customers regarding service issues sometimes were in the form of complaints. However, the SWMD also received 250 compliments entered through the 311 call center. Here was one of the more significant customer quotes:
“SWMD driver Amanda was on her trash route on Monday and found my husband outside of the home unresponsive. Amanda did everything she could to help save him and called 911.” The 311 summary continued with, “(Customer) is so thankful that Amanda stopped and helped and did everything she did and all that she could do to help. (This family) thanks her for doing such a great job and going above and beyond what her job requires.” The employee was Amanda Ehlers from the Southeast Service Center.
Many of the calls received for SWMD services were inquiries on the cart downsizing program. In FY 2019, 6,511 customers downsized to the medium 64 gallon trash cart and 10,719 moved all the way down to the small 48 gallon size. As percentages, 85% of customers remained at the large 98 gallon cart, 6% switched to the medium size, and 9% downsized to small.
Customer Service

11
From the perspective of customer account management, the Department needed to look forward to hit higher numbers of downsizes in FY 2020. The adopted FY 2020 budget called for no fee increases to trash collection service for the large brown cart and the medium brown cart. However, it did include a reduction to the fee for the smallest cart. Customers that switched to the smallest brown trash cart down from the large cart would reduce their collection service fee by $144 per year – a greater savings than the $120 per year savings of FY 2018.
To supplement the marketing and advertising efforts, the Department implemented a tactic of direct customer contact. Dubbed ‘the Ground Game’, operational teams of inspectors and service center personnel started going directly into neighborhoods and knocking on doors. Customers could downsize their carts on the spot. For example, teams from the Northeast Service Center contacted 10,211 homes and helped 293 customers downsize their cart in real time. This initiative will continue throughout FY 2020, with a goal of all customers receiving the direct message on saving money.
Additionally, two very important customer touch points were improved in FY 2019. A new Services Guide was published and new cart stickers were designed. Both of these projects were also promotional tactics for the Ground Game. The new designs featured more literal photography about the recycling and organics programs and also eliminated excessive instructional copy. They became quicker to scan and easier to understand. An example is pictured below.

12
SPECIAL REPORT
EVENT HORIZONS INTO THE NEXT DECADEFive Areas of Focus for the SWMD
The Department held a strategy retreat with all senior management in FY 2018 to determine what the focus of the Department should be over the next five to ten years. Five topics were agreed upon and for the entire year of FY 2019, the retreat attendees broke into groups and studied these topics.
HUMAN CAPITALThis study group defined human capital as the collective talent and capabilities of all SWMD employees, current and future. Common aspirations were to engage the employees, lift and maintain high morale, achieve sustained production levels, attract solid, skilled and motivated staff, fill vacancies, and maintain low turnover. Without consistent focus on human capital, the group believed that SWMD would not reach its potential and possibly fail in its mission. It was concluded that over the next ten years, these will need to be the areas of focus and strategy: (i.) younger workforce; (ii.) private versus public wages; (iii.) training and retention; (iv.) diversity and inclusion; (v.) improving hiring and onboarding processes, and; (vi.) the growing need for resources. This group’s efforts are ongoing.
TECHNOLOGY AND LOGISTICSWith constant technological advances, the Department determined that evaluating options and leveraging technology would be key to improving service delivery, customer service, safety, and value. This group considered everything, from technology on the trucks to systems for tracking carts. They concluded that as the City of San Antonio continues to grow, so does the ability to capture ever-increasing amounts of data. Recommendations were made on streamlining and automating the various data systems of stored information to reduce or eliminate manual processes.
Two areas of focus were identified: field operations and administrative processes. This group’s report was extensive. The types of technology to either master now and/or acquire for the future would be: (i.) telematics and “Big Data” schemes; (ii.) tools such as radio frequency identification (RFID), ArcGIS, FleetMind, SAP Business Analytics, Mobileye, and Intelex; (iii.) radar/sonar systems; (iv.) collision avoidance systems; (v.) on-board system diagnostics and; (vi.) structured query language (SQL) databases. With their report, the study by this group was completed.
CUSTOMER ENGAGEMENTThis committee based their work on the idea that customer engagement and customer satisfaction were two different concepts. Satisfaction was described as a one way channel – measured only by customer feedback. Engagement was considered a two way exchange. Only the consensus of many points of view could drive sustainable change. Customers were defined as: (i.) rate payers; (ii.) internal customers (City Manager, City Council, Mayor); (iii.) education and outreach audiences, and; (iv.) commercial and multi-family as a single combined category.
Even though the SWMD has no competition, customer engagement was still deemed extremely important and relevant. Without it, customers’ non-compliant behaviors would cause immeasurable, lasting damage to the City of San Antonio and completely derail efforts toward the 60% recycling goal. The group laid out many areas
13
of focus and strategies, with technology being at the center of most of them. A surprising closing statement was made by this team. The goal of customer engagement would be to remove the need for customer engagement altogether. Essentially, make the right choice of behavior the only choice. This focus group completed their effort and transitioned future work to the Department’s operational leaders.
GROWTH, RESOURCES, SUSTAINABILITY Within the context of this report, growth referred to population growth of inhabitants within the City of San Antonio. Sustainability referred to achieving and maintaining a city that meets the needs of the individuals within it today without undermining the ability to meet the needs of future residents. Resources referred to Department personnel at all levels, equipment, and facilities, all of which are integral in fulfilling the Department’s mission. These were the main topics agreed upon to develop into a future action plan:
Waste Generation
Disposal/Recovery Rates and Options
Landfill Life
Population Growth
Policy Options
Infrastructure Costs
Economic Impacts
Greenhouse Gas (GHG) Emissions
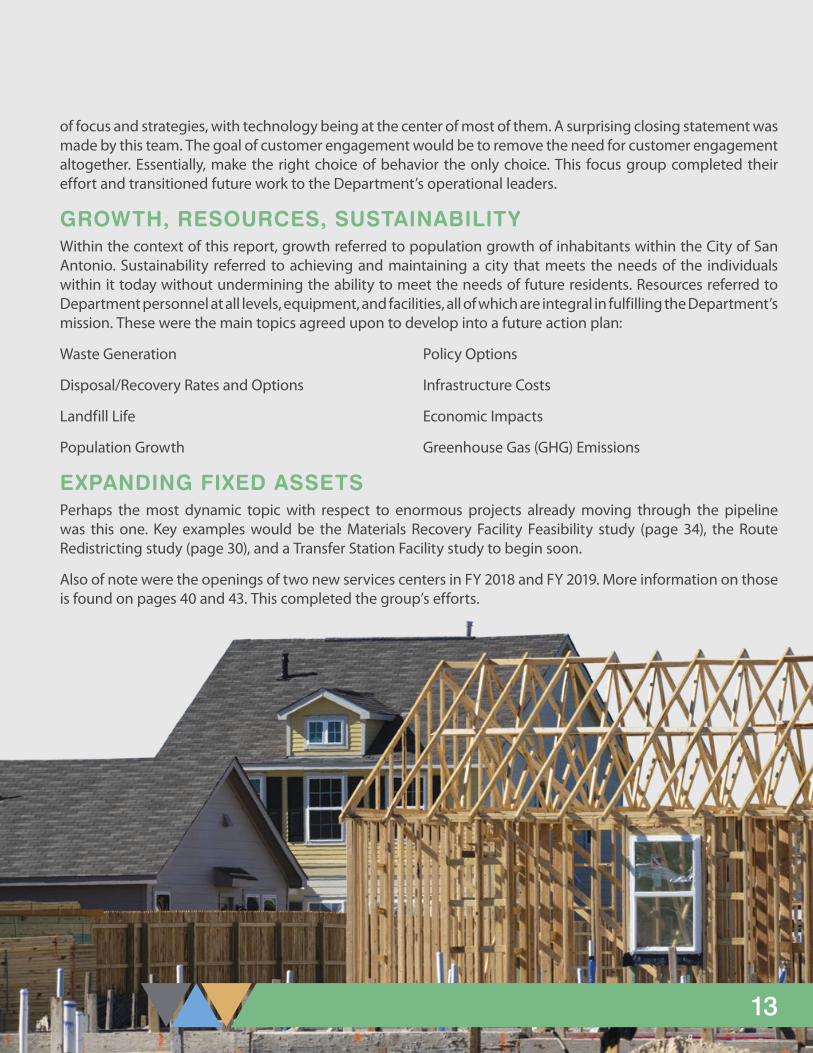
EXPANDING FIXED ASSETSPerhaps the most dynamic topic with respect to enormous projects already moving through the pipeline was this one. Key examples would be the Materials Recovery Facility Feasibility study (page 34), the Route Redistricting study (page 30), and a Transfer Station Facility study to begin soon.
Also of note were the openings of two new services centers in FY 2018 and FY 2019. More information on those is found on pages 40 and 43. This completed the group’s efforts.

14
This team, comprised of four recycling coordinators, made 1,101 individual presentations in FY 2019, reaching tens of thousands of local residents. The majority of the presentations were in schools and that particular goal of 800 school events was exceeded by 133. Presentations were available in English and Spanish and were also interpreted in American Sign Language (ASL) for hearing-impaired students. Several presentations were also tailored for special needs students.
The team established a new goal of 50 schools and organizations that had never requested presentations before. This specific goal was also exceeded as the group completed 89. Intended as a ‘thank you’ for being invited, the team created teacher toolkits as leave behind gifts. These kits contained materials to help teachers decorate their classrooms, start a composting project, and distribute activity materials to every student. These toolkits were able to be developed by receiving Alamo Area Council of Government (AACOG) grant funding.
The series of home school expos, referenced in the stakeholders letter, was a new and large initiative. Twelve three-hour sessions were conducted at Hardberger Park’s Urban Ecology Learning Center. As a new targeted group, the home school community was challenging to find and reach. Invitations were pushed out through a series of Facebook groups and across other digital channels. Attendee comments were extremely positive,
mainly for the thoughtfulness of not overlooking these students. The events were also covered by the local media. It was determined that the series should become an annual event and was added to the FY 2020 plan.
Education & Outreach
Schools
Community Events
COSA Departments
Total
New Organizations
Goal
800
80
12
892
50
Actual
933
152
16
1101
89
Performance Measures

15
The recycling coordinators walked again in the Battle of the Flowers and Fiesta Flambeau Fiesta parades. In years past, they carried only hand-held signs about recycling. In educational materials, the group had incorporated characters into the learning process – Curby the blue recycling cart and Glenda the green organics cart. These characters were turned into thirteen-foot inflatable mascots and were rolled along the parade routes at Fiesta 2019. The visibility of the Department’s recycling message was increased exponentially with every step.
To ensure the group was looking ahead, the Division held a strategy and planning retreat in July. Part of the agenda was determining signature projects by each team member. It was concluded that these would be initiatives to execute in the coming year:
• More partnerships with local educational attractions and organizations such as SeaWorld, the Zoo, the Doseum, and Morgan’s Wonderland.
• A series of recycling video tutorials for sarecycles.org.
• A second original children’s book on organics to compliment the recycling book, Where Does It Go?
• New digital learning programs featuring the mascots utilizing the technology known as ‘augmented reality.’ The inset shows an award the team received for the current digital game, CART SMART.
• A series of ‘pop-up recycling’ events for the summer months.
• Construction of an interactive scale model of a Materials Recovery Facility.
• A focus on equity principles in presentations such as working with Lighthouse for the Blind.

16
The Department’s Environmental Services Division continued to ensure safe and environmentally friendly operations for San Antonio. Responsibilities covered regulatory compliance, landfill maintenance, curbside inspections, dead animal collection, downtown collection, drop-off centers, and household hazardous waste.
The landfill maintenance processes were critical to efficiently control methane gas migration, odor abatement, and greenhouse gas emissions reduction at the closed landfills managed by the SWMD. The Division managed seven closed landfills in FY 2019. Three landfills had gas collection systems – Rigsby Road, West Avenue, and Nelson Gardens. Additionally, in FY 2019 the energy plant at Nelson Gardens produced 17,874 megawatt hours (MWh) of power. One MWh is enough to power 20 homes on a hot summer day.
Landfill compliance systems and data collection were performed by one full-time landfill compliance technician and two landfill consultants, managed by Sal Ytuarte (inset). Their focus was on: (i.) methane monitoring through the landfill gas systems (LFG); (ii.) oversight of ground water collection and the Edwards Aquifer Well, and; (iii.) mandatory recording and reporting according to state regulations.
Environmental Services

17
The landfill maintenance team consisted of five employees that maintained the seven landfills. Their fundamental duties included mowing, erosion repair, subsidence, and addressing ponding issues.
In FY 2019, landfill operations needed a solution to reduce noise levels from bulky operations of the Rigsby location in the adjacent neighborhoods. A consultant was hired that ultimately recommend a pre-cast wall with a cost of up to $90,000. The Department, however, made a decision to build a berm instead of the pre-cast wall using landfill operations staff and in-house resources.
The landfill operations team constructed the berm with approximately 3,340 cubic yards of soil and an estimated 750 man hours. The total cost to build the berm wall using internal resources was just over $17,000, a savings of nearly $83,000.
Another significant achievement in the past year was addressing the continual erosion at the Leon Creek bank near the Pearsall landfill location. Consultants were hired for this study as well. Their least expensive solution was a status quo maintenance and repair contract for $1.5m over thirty years, or $50,000 annually. Here again, the Department decided to use in-house resources to solve the eroding bank issue and it was repaired using rock, soil, the French drain process, and approximately 136 man hours. The total cost to repair the bank using in-house resources was just over $4,000, a cost savings of nearly $46,000 a year.
The four bulky drop-off centers including household hazardous waste (HHW) are included in the Environmental Services Division. Information on these are found beginning on page 44. In FY 2019, two new initiatives led to cost savings and increased recycling in the HHW operations.
Paint is a frequent HHW material collected. Technicians use grates to empty the cans. A simple innovation of welding two T-Bars to the grates made it possible to extract even more paint. From this new technique and by taking the extra time to scrape the inside of the metal cans, the empty metal containers were able to be recycled which saved disposal fees and increased metal recycling tonnage. The second initiative was diverting additional electronics from the HHW Contractor to Goodwill Industries. This new workflow saved over $100,000 in processing fees.

18
This SWMD Division provided repair and maintenance services to more than 2,000 pieces of equipment, both off-road and on-road, primarily for the Solid Waste Management Department, Transportation and Capital Improvements (TCI), and the Parks and Recreation Department. It operated four heavy duty truck shops and one heavy equipment shop. The professionally trained and dedicated staff of 101 shop personnel consisted of parts clerks, maintenance workers, heavy equipment mechanics, service advisors, superintendents, and mangers. Additionally, there was a support staff of five for administrative duties. The team worked diligently to keep garbage trucks, street sweepers, pothole patch trucks, aerial bucket trucks, brush and bulky grapple trucks, bulldozers, brush grinders, and even the occasional lawn mower in service.
Former Solid Waste Manager for the Fleet Division, Stephen Haney retired after more than 20 years of service to the Department and David Badillo (inset) stepped in as the new Solid Waste Manager. He previously managed the off-road equipment shop under Haney’s guidance and brought a dedication to continue the Division’s mission of consistently providing high quality, responsive service to ensure customers’ success. Badillo established safety as a first priority given the environment of Fleet Operations and the multiple risks that exist there. His shops also quickly implemented an online dashboard to track major issues and then provide innovative fixes for equipment service.
A key metric for Fleet Operations in FY 2019 continued to be meeting daily line up requirement for its customers. Early in the year it became difficult to meet this requirement. The Fleet Division ended the year with an 88.8% availability rate for the Solid Waste Department, which is a slight decrease from last fiscal year. In FY 2019, a contributing factor that prevented meeting the performance measure was faulty and aging equipment. To make positive gains wherever possible, mechanics at each shop focused on innovation and implemented new techniques, and in some instances rebuilt entire systems on aged trucks in order to meet line up. The results delivered effective strides to an improved daily line up requirement.
Fleet Operations

19
Managers also prioritized increasing in-house repairs and reducing outsourced maintenance this past year. Heavy equipment mechanics were responsible for 119,196 billable labor hours on customers’ equipment. The Division closed 29,087 work orders this year and issued 529,588 parts.
The SWMD recently added six diesel-electric hybrid trucks to certain collection routes. Fleet mechanics had to master this new type of technology. These trucks work exactly as a passenger gasoline hybrid with an electric engine and on average, burn 22% less diesel fuel which lowered fuel costs significantly. This also led to reduced emissions. In FY 2019 they had a very low number of maintenance issues as well.
Fleet Operations achieved a forward looking/forward thinking milestone with the opening of the state of the art shop at the Southeast Service Center. Some of the technological advances included a heavy duty lift, overhead crane, WiFi for telematics, and electrical connections throughout for welding in any service bay. This became the second new shop opened in the past two years as the Division looked to continue providing excellent internal customer service. These internal customers in turn were responsible for providing external SWMD customer service, which is not possible without working equipment.
20
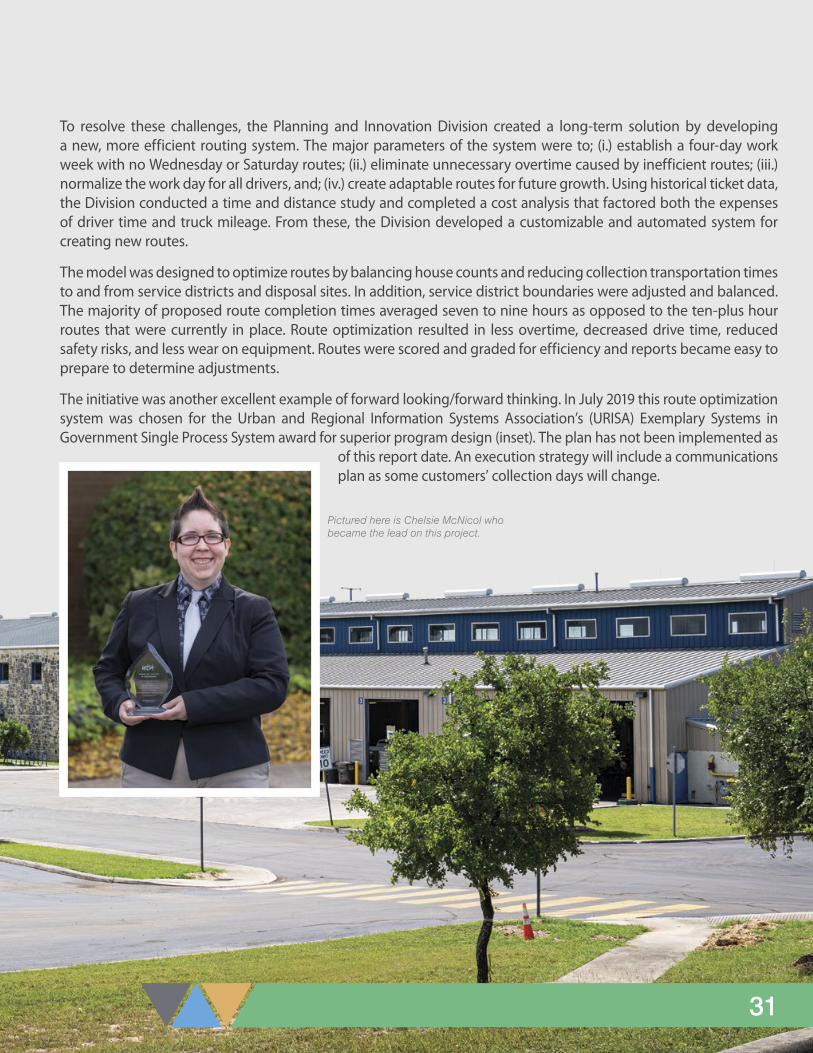
The main focus of this Division in FY 2019 was to continue promoting the Department’s cart downsizing program. Two new commercials were produced emphasizing the amount of savings available to customers if they moved to the smaller brown trash cart. These were produced in both English and Spanish. In addition to TV, radio, digital, in-theater, and social media marketing channels, a billboard concept was deployed encouraging people to look on their CPS energy bill. Through the Galloway Research project detailed on the following pages, it was discovered that most customers were not even aware of what they paid for collection service.
The new cart downsizing campaign was booked first for Super Bowl Sunday 2020 as the beginning of a robust media plan. A contamination campaign would follow later in the spring. The Division also renewed the SPURS sponsorship package which included for the first time the SWMD sponsoring all closed captioning. The sponsorship also extended to the Rampage and the SAFC.
A pilot program was launched for cart downsizing as well. Simple public service announcement style spots were recorded in five Middle Eastern languages: Hindi, Punjabi, Urdu, Marathi and Gujarati. These were deployed through a digital campaign that targeted specific areas of San Antonio. The results were very positive. The average for a 30-second video to be watched to completion is 31%. These were longer at 45 seconds and were completely watched by 38%. Additionally, the average click-thru (opening the video link) rate for videos is 10%. These had a click-thru rate of 56%. Top delivery sites were cnn.com and people.com.
Another pilot was a promotional direct mail campaign for ReWorksSA. That program had been working with very limited marketing collateral – essentially a rack card. The need for a more robust sales kit was clear. The promotional piece was designed with an interesting folding jacket containing individual slip sheets of information inside. This ensured that pages of information could change as needed without reprinting the entire project. It was, of course printed on recycled paper. Two databases were identified for the distribution which were, the limited commercial accounts serviced by the SWMD and the San Antonio Business Journal Book of Lists. In the first drop of only 250 pieces in October, one business responded almost immediately and became certified.
Marketing & Communications
Photo © San Antonio Express-News/ ZUMA Wire

21
Interviews were conducted for a newly-created position of Assistant Marketing Manager, who would be responsible primarily for expanding the Department’s digital marketing channels, including web sites, mobile app, social media content calendars, and campaigns. A candidate was selected at the end of FY 2019 with a start date of early FY 2020.
Production began on five major special reports for City Council, including this Annual Report. These included the Multi-Family Annual Report, the Waste Characterization Study report, the Materials Recovery Facility Feasibility Study report, and an updated Resources and Recovery Plan. The Division also produced the FY 2020 budget presentation which was well received. It included multiple videos for innovation and visual interest.
In FY 2019, 36 stories ran in local media on various SWMD programs and events. Topics ranged from the global recycling industry, Fiesta recycling, the home school events, and the safety certification. Two stories on the Fan Fest event ran nationally on msn.com and people.com.
Below is a photograph from the Fan Fest Event mentioned in the stakeholder letter. It was held at Freeman Coliseum.
The inset is one award this Division received in FY 2019. It is an ADDY from the American Advertising Federation.

22
SPECIAL REPORT
WHAT MATTERSMarket Research for Multi-Year Strategies
The Marketing Division had been promoting cart downsizing campaigns since early FY 2018 with successful results in increasing actual cart downsizing transactions. For example, in January 2018, there were 176 requests to downsize. The first campaign was deployed in February of 2018 and in August of that same year, there were 4,631 requests.
However, even with these solid results, the actual percentages of customers reducing their cart size and collection fee remained under the goals outlined for each cart size. The Division decided that market research into the triggers and drivers of customer perceptions, behaviors, motivators, and resistant obstacles would be critical in moving the needle faster and to a higher degree. The local firm of Galloway Research was engaged to conduct this market reconnaissance.
Qualitative or quantitative methods was the first question to address. Because there needed to be in-depth conversations with people, focus groups were determined to generate better data than a survey. Nine group discussions involving over 80 people in total yielded 18 hours of research with thousands of data points to codify. There were three distinct categories and participants were recruited according to their alignment with being: (i.) someone who had downsized; (ii.) someone who was contemplating downsizing and; (iii.) a person who would never consider downsizing.
From the first group, the questions focused on their reasons, experience, and level of satisfaction with a smaller cart. From the second group, the research was designed to discover that, if they were thinking about switching, what was preventing the decision and what would compel them to move forward. With the third group, the idea was to probe for any reasons or situations that would change their minds and how extreme those would have to be.
Several results were expected but others were surprising. These were a few salient points:
• Not one single person in all of the groups knew exactly how much they paid for SWMD collection service.
• A majority did not know the Department’s name. Several more thought CPS Energy was their provider.
• Saving money made an impression but only in larger amounts, i.e. $122 per year was more powerful than $10 a month.
• There was great confusion about accepted and non-accepted items for both recycling and organics. Food in the green cart was a negative issue for everyone.
• Generally speaking, the collective was supportive of the recycling and organics programs and were overall satisfied with the SWMD services.
• Those that had downsized did so without any change in recycling behavior. They were already leaving space in the brown cart. Those that said they would never downsize were not opposed to the program but felt convinced they would not be able to change because of the size of their household.

23
Using the report’s overall findings, the Marketing Division began to formulate strategies for concepts and messages to drive the FY 2020 cart downsizing campaigns. As only one example shown below, the data confirmed people had seen previous SWMD advertising and more importantly where they saw it. This helped refine the Marketing Division’s media placement strategies for the coming year.
Have you seen or heard any ads recentlyregarding cart downsizing?
Yes
No
Don’t Know
Blank
Total Responding
79%
17%
2%
2%
100%
[IF YES] Where do you recal seeingor hearing ads for cart downsizing?
Television
Radio
Billboards
Bus Signage
Social Media
Newspaper / Magazines
Miscellaneous Mentions
64%
11%
11%
4%
12%
14%
24%
All Participants All Participants
The percentages exceed 100% due to participants selecting multiple advertising channels.

24
The organics program started as a pilot in 2011, became subscription-based in 2013, and was later rolled out for all SWMD customers in FY 2017. FY 2019 marked the two-year anniversary of this city-wide implementation. Through its history, the program showed improvement in customer participation. Tonnage increased by 16.4% from 58,335 tons in FY 2018 to 67,916 tons in FY 2019. Organics has proven to be a seasonal program. San Antonio’s spring growing season of March-April generated the most volume.
Organics
0
30,000
70,000
20,000
40,000
FY 14 FY 16 FY 19FY 18
10,000
FY 15 FY 17
4,821 7,116
24,027
56,624 58,335
67,916
Organics Tonnage
60,000
50,000

25
Even though non-organic materials were still found in the green carts through the year (known as contamination which can lead to loads being rejected by the compost facility), the rejection rate was lower than in past years. Of the aforementioned total tons, 17,407 tons were rejected. This was close to a 25% rate which was still much better than rejection rates as high as 39% from earlier in the program.
Organic route drivers played a critical role in reducing rejected loads. Customers received cart tags and then were mailed letters when repeated contamination was found in their green carts. In FY 2018, 33,306 letters and tags were distributed and in FY 2019, that rose to 51,725 which reflected an increase in effort by the service centers.
From all the organic materials, compost was created and made available back to San Antonio’s communities. This past year, for example, at the Old Spanish Trails Park, 3,500 cubic yards were delivered to improve a youth soccer field. The total amounts given directly to SWMD customers was 5,121 bags on 85 pallets.
The SWMD’s organics program was recognized by the State of Texas Alliance for Recycling (STAR) with the 2019 Texas Environmental Leadership Award (inset). To be selected out of all state organizations considered stewards of the environment was an exciting highlight for the year.
Looking forward, based on the results of the following special report, the organics program was shown to have great potential for raising the City’s recycling rate. Future business strategies began to be developed based on marketing and promoting the organics program to a higher degree.

26
SPECIAL REPORT
ONLY UNTIL YOU LOOK INSIDEA Waste Study Project that Revealed Clear Directions
In FY 2019, the Department completed the City of San Antonio’s first-ever Waste Characterization Study. The study was designed to provide data on the composition of the City’s single-family residential garbage and bulky curbside streams. The overarching purpose for the research was to analyze the results to inform strategies and programs that would support diverting recoverable material from the landfill and increase the recycling rate. The rate was 32% in FY 2018 and 35.5% in FY 2019.
The study included collecting approximately 47,000 pounds or nearly 24 tons of garbage material from all ten Council Districts. Over a two week period, the material was hand-sorted into 42 material types which were then categorized into seven major categories: organics, paper, plastic, metal, glass, household hazardous waste (HHW), and landfill.
The findings were enlightening. Of all the material residents disposed of in the garbage cart, 67% could have been recovered through the City’s recycling or organics programs. Only 33% of what residents placed in the garbage cart should have actually gone to the landfill as non-recoverable material. Within the 67% that was recoverable material, 45% was organic material that could have been composted through the City’s green cart program. This organic material included food waste, yard debris, and compostable paper such as fast food paper bags/wrappings and pizza boxes. In addition, 22% of the garbage stream was recyclable material such as plastics, paper/cardboard, aluminum cans, and scrap metals. These findings will be factored into many Department strategies for FY 2020, especially ones of the Marketing and Communications Division for customer messaging around better participation in the organics program.

27
Findings showed fairly similar percentages across all Council Districts. The highest potential for organics recovery in any district was 48% (two districts tied) and the lowest was 41%. San Antonio as a city was compared to Waste Characterization Studies from two other regions having organics programs – Phoenix, Arizona (2015 study) and San Diego, California (2012 study). Both of their organics potential for recovery was 48% compared to San Antonio’s 45%. However, San Antonio proved to recycle better, leaving only 22% of recyclable materials in the brown trash cart, while Phoenix’s volume showed 27% that could have been recycled and San Diego could have recycled 32%.
A summary of the report was presented to City Council in August 2019 during the Department’s FY 2020 budget presentation. A full report will be released in the spring of FY 2020. It was clear from the report that improving participation in the SWMD’s organics program would increase the City’s overall recycling rate by a large margin.

28
The Planning and Innovation Division contributed value to multiple SWMD programs and initiatives in FY 2019, by providing data, research, and analysis that supported the SWMD’s strategic decisions. Improved efficiency and development of future innovations were also a focus. Near the end of FY 2019, the group became fully staffed as a six-member team. Tim Pittman (inset), joined as the Planning and Innovation Manager and an open project manager position was also filled. Pittman was a civilian contractor in the Middle East for eight years working with the Department of Defense, Department of State, US Army, and US Marine Corps. His experience includes program management, logistics, contract administration, data analysis, and database administration.
The Division executed three key special projects in FY 2019 highlighted in this Annual Report: the Waste Characterization Study, the MRF Feasibility Study, and the Route Optimization Study. Planning and Innovation also tracked the SWMD’s traditional monthly metrics and established new metrics such as the capture rate. The
Planning & Innovation
FY 2019 Capture Rate by Material
Newspaper
Corrugated Cardboard
#2 HDPE Colored Containers
Glass Containers
#1 PETE Containers
Mixed-Paper Waste
Aluminum Cans
Tin/Steel Cans
#2 HDPE Natural Containers
Other Recyclable Metals
Other
85.4%
7.1%
13.7%
28.6%
30.5%
32.0%
36.4%
52.1%
54.8%
58.3%
59.1%
Northwest Service Center Southwest Service Center

29
capture rate identifies which materials have the greatest untapped recovery potential and can be used to develop future policies and programs. Quarterly audits of the recycling stream were conducted at the City’s contracted recycling facility. These quarterly audits helped to gain a better understanding of the composition and quantities of recyclable material that did not get captured at the recycling facility.
Development of the annual budget presentation to City Council was another significant accomplishment. The challenge was distilling down a heavy volume of complicated information into a 15-minute easy-to-understand, visually appealing presentation. Literally months in the making, it was met with favorable reception from the Mayor, Council, the Office of Budget Management, and the City Manager’s Office.
The team was also heavily focused on collecting tonnage, transportation, collection, and disposal data to create analysis models not only for the Route Optimization Study but also for a transfer station analysis. Additionally, the Division was tasked to begin an update to the City’s Recycling and Resource Recovery Plan which was originally developed and adopted by City Council in 2010 and last updated in 2013.
Climate Action And Adaptation PlanFor this specific City initiative, a series of SWMD FY 2019 results will be highlighted as progress in the Department’s section within the plan. Updates will include how ReWorksSA affected commercial waste reduction (page 8). Also, how the cart downsizing program (page 22) was a key tactic for residential waste reduction. Organics diversion (page 24) was another important climate ready strategy. From FY 2008, residential tons per household to the landfill has decreased by 28%. The decline continued in FY 2019 over FY 2018 (page 48). The residential recycling rate was 35.5% (page 33) for the year compared to 32.2% in FY 2018. Additionally, the hybrid trucks (page 19) were introduced. These were several of the major SWMD contributions to the Climate Action Plan.
New initiatives included partnering with the Development Services Department and the Office of Historic Preservation to reduce construction material to the landfill. Also, a forward look toward zero waste in City facilities will begin with a strategic plan to be developed in FY 2020.
Northeast Service Center Southeast Service Center

30
SPECIAL REPORT
WHEN A ROUTE BECOMES A PATHGetting to ‘No Hands Touch the Trade’
The City of San Antonio grew by an estimated 120,000 residents over the past ten years and is likely to become the sixth largest city in the nation in the coming years. The Solid Waste Management Department’s collection routes had not been updated in that decade nor kept pace with population growth. This imbalance between collection requirements and collection resources caused several issues for the SWMD including increased overtime expenses, longer route completion times, wear on vehicles, and interruption to customer service. Also, the addition of organics routes in 2015 created an even greater strain on available resources.
With an outdated and static picture of its routes, the SWMD was unable to look forward as to where new customers would be acquired or where current denser geographic route areas required adjustments and improvements. Although the need was clear, the process to design routes had not evolved. Hand-drawn paper maps were the only method of updating route changes. That system was not trackable and information could not be shared – which is almost the definition of inefficient.
31
To resolve these challenges, the Planning and Innovation Division created a long-term solution by developing a new, more efficient routing system. The major parameters of the system were to; (i.) establish a four-day work week with no Wednesday or Saturday routes; (ii.) eliminate unnecessary overtime caused by inefficient routes; (iii.) normalize the work day for all drivers, and; (iv.) create adaptable routes for future growth. Using historical ticket data, the Division conducted a time and distance study and completed a cost analysis that factored both the expenses of driver time and truck mileage. From these, the Division developed a customizable and automated system for creating new routes.
The model was designed to optimize routes by balancing house counts and reducing collection transportation times to and from service districts and disposal sites. In addition, service district boundaries were adjusted and balanced. The majority of proposed route completion times averaged seven to nine hours as opposed to the ten-plus hour routes that were currently in place. Route optimization resulted in less overtime, decreased drive time, reduced safety risks, and less wear on equipment. Routes were scored and graded for efficiency and reports became easy to prepare to determine adjustments.
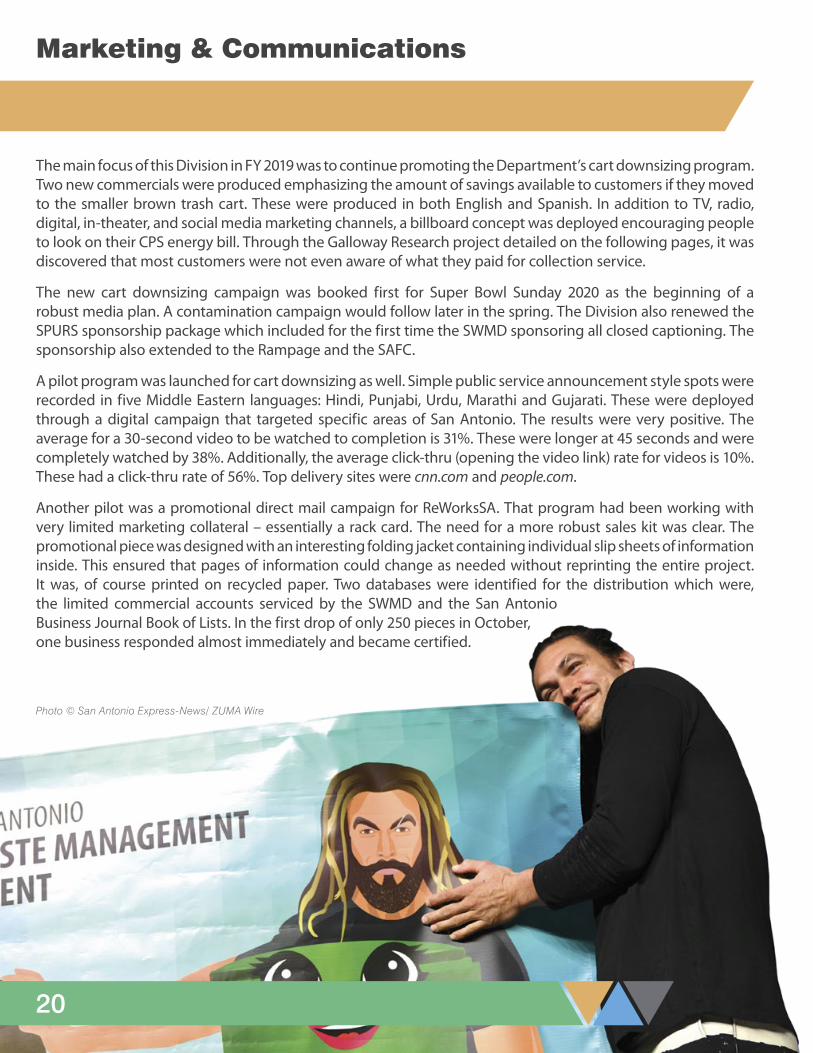
The initiative was another excellent example of forward looking/forward thinking. In July 2019 this route optimization system was chosen for the Urban and Regional Information Systems Association’s (URISA) Exemplary Systems in Government Single Process System award for superior program design (inset). The plan has not been implemented as
of this report date. An execution strategy will include a communications plan as some customers’ collection days will change.
Pictured here is Chelsie McNicol who became the lead on this project.

32
In 2017, China announced a program called ‘National Sword’ which banned 24 items from being imported into that country. An additional 16 items, including many metals were added to the list in 2019. Several paper products are expected to be added to the list in 2020. Recyclers across the country began to scramble for a place to sell their recycling commodities.
In response to this global industry shift, San Antonio began forward looking and forward thinking several years ago. Just one example was the Department’s decision to invest heavily in the inspection program. Inspectors and their role in direct customer education regarding contamination in recyclables, continued to be an invaluable tactic of changing customer behavior and expanding understanding about this problem.
The recycling program in San Antonio remained strong in FY 2019. There were no changes to the program with respect to accepted items, unlike other municipalities that reduced, and in some cases, eliminated their recycling programs altogether.
Even at depressed selling prices, recycling still made economic sense in the past fiscal year. After processing fees were paid and revenues split, the SWMD paid $9.42 per ton for recycling compared to $25.11 per ton for landfilling material. FY 2019 recycling tonnage was 75,645 which equated to $712,576. Had that tonnage been landfilled, the cost to the City would have been almost $1.9 million.
Recycling

33
Moreover, working with the Department’s contractor, Republic Services, domestic markets were found for the City’s recycling, replacing the need and dependency on China’s purchasing heft.
Commodities such as aluminum and plastic soda bottles were highly profitable in FY 2019. Glass recycled at a financial loss. However, keeping glass in the SWMD program was justified for important environmental benefits to San Antonio (please see below).
The inset is an award for recycling outreach and education from the Public Relations Society of America.
NOTE: According to the Glass Packaging Institute, for every six tons of recycled container glass used in making new glass, one ton of carbon dioxide is reduced. If recycled glass increased in new glass by 10%, the results would be an 8% reduction of air particulates, a 4% reduction of nitrogen oxide, and a 10% reduction of sulfur oxides.
25%
40%
35%
28.9% 29.4%
31.9%
33.1% 32.2%
35.5%
Recycling Rate
30%
FY 14 FY 16 FY 19FY 18FY 15 FY 17
This recycling graph is the aggregate of all SWMD recycling programs that include residential recycling (blue cart), organics (green cart), brush (curbside and drop-off centers), and certain materials recovered from the bulky and HHW programs.

34
SPECIAL REPORT
OUTSOURCED OR RESOURCEDThoughtful Explorations on Building a New Facility
Starting as early as 2016, market trends began to indicate significant changes in the recycling industry. As their revenues decreased, private operators of Material Recovery Facilities (MRFs) raised processing fees to compensate. Faced with these higher fees, some municipalities began to scale down their programs or eliminate recycling programs altogether. In another significant example of forward looking/forward thinking, the Department began to thoughtfully consider all aspects of the recycling process to keep it sustainable and economically viable for San Antonio.
Realizing the contract term with the City’s current MRF would expire in the very close future of 2024, the Department began to plan ahead, given the important decisions about 2025 and beyond that would have to be made. In FY 2018 the Department contracted a leading waste industry consulting firm, Burns & McDonnell (B&M), to evaluate the financial feasibility of owning and operating a single-stream MRF.
Multiple scenarios with combinations of data variables involving tonnage, commodity mix, current market prices, and even specific locations were analyzed. B&M also ran multiple price sensitivity analyses measuring the impacts on revenue, based on variations in the composition and value of commodities in the recycle stream. Ultimately, the study revealed multiple benefits for the City to consider, including:
• Capital costs such as existing land and equipment resources
• Fixed rate versus flexibility in contract terms
• Adaptability to changing markets and industry trends
• Measurable contribution to San Antonio’s circular economy

35
Also, with direct access to a ‘MRF of the future’ would come the opportunity to use the facility as a learning experience for the entire public about the complete recycling process. This would foster stewardship that could directly affect the recycling rate in San Antonio. Studies have shown that when individuals actually know what happens to items they discard, there is more ownership – they become SWMD partners in the program. Equally important, this would be an ideal venue to show the negative impact of contamination which would in turn address a major customer behavior issue.
To supplement information provided in the Burns & McDonnell study, the SWMD also conducted site visits to three recycling facilities in 2018. Facilities in three Texas cities, Dallas, Fort Worth, and Austin, were selected due to the similarity of size and demographics to San Antonio. Additionally, a survey of 17 nonprofit and municipal-owned and/or operated recycling facilities was completed. The selected facilities included only MRFs which processed 20,000 tons or more per year. Analysis was made by comparing each facility’s major data points that included: (i.) tons processed per year; (ii.) tons per hour; (iii.) contamination rate; (iv.) percentages of residential and commercial mix, and; (v.) revenues versus expenses. These studies supported the B&M recommendations as well.
The Department stated to City Council in the FY 2019 budget presentation that the findings of the B&M study and MRF site visits were compelling enough to continue feasibility exploration. City Council approved moving forward with an engineering study to determine facility location, site layout, capital costs, equipment design, evaluation of the recyclable commodities market, and an updated financial analysis. The complete results from both studies will be presented to City Council in spring FY 2020.
Photo courtesy of CP Group, San Diego, CA

36
As referenced in the stakeholders letter, receiving the ISO 45001 was the true highlight of FY 2019. However, it was the beginning, not the end, of a continued dedication to a culture of safety. The Safety Division looked forward to consider what resources would be needed to sustain this level of commitment across the entire organization for years to come.
Creating the SMS was a partnership between the SWMD and the City’s Office of Risk Management (ORM). On February 28, 2019, the program was audited by ABS Quality Evaluations and was subsequently recommended by that organization for the ISO certification. Priorities that the SMS addressed were: (i.) manage risks and opportunities; (ii.) eliminate hazards; (iii.) address opportunities for improvement; and (iv.) prevent work-related injuries, illnesses, and accidents. The SMS developed a robust set of tools and resources for employee training, participation, and input that included establishing a Safety Roundtable. A future objective will be to replicate this model for safety culture in other City Departments.
Motor vehicle accidents continued to decline. In FY 2017, 140 accidents were reported. That dropped significantly in FY 2018 to 76 and dropped again in FY 2019 to 67. Personal injuries however, rose which underscored the need for a continued Department-wide emphasis on working safely.
Several safety tools were introduced this past year. A safety dashboard with interactive data retrieval was designed to improve operational efficiency. The team began the development of a safety website for training and information. A safety hotline was introduced for broader intake of risk management and reporting. For these and multiple other innovations, the Solid Waste Association of North America (SWANA) awarded the SWMD for the industry’s Best Innovation Program (inset).
Safety

37
Training was a key to instilling solid safety behaviors. Over 100 new hires were trained and the Department’s driving simulator was a critical part of that process. An additional 33 employees successfully obtained their CDL license. The Department’s apprentice program that was started in 2017 led to 35 temporary employees being hired as full-time after they completed the program.
Also mentioned in the stakeholders letter, the Safety Division was very proud of the skilled drivers who entered the state and international Road-E-O competitions. The maneuvers in these competitions are intentionally very difficult and truly separate the experts from the average. The event was sponsored by SWANA. Another partnership with SWANA was taking the ‘Safety and Distractive Driving’ pledge, which reads:
I pledge to help everyone get home safe every single day. I will consider worker, customer, and public safety in every decision that I make. My ultimate mission is to serve the community safely for myself, my company, and those who depend on me. If I cannot do it safely, then I will not do it at all.
For the Safety Division, one example of looking forward was budget improvements which were proposed and adopted. One provided for the addition of one manager and one lead trainer to improve and enhance the SWMD’s Safety Management System. In addition, three training vehicles were also approved. Another significant action of forward looking in FY 2019 was the green light to build a Safety Resource and Employee Training Center at Camargo Park in FY 2020.
June 11, 2019 the ISO certificate was presented (pictured below) by Dominic Townsend, President of ABS Quality Evaluations at the SWMD’s Northeast Service Center.

38

39
Northwest Service Center
Northeast Service Center
Southeast Service Center
Southwest Service Center
Bitters Brush & Bulky
Culebra Road Bulky & HHW
Frio City Road Bulky
Rigsby Bulky
Nelson Gardens Brush
Warehouse Operations
LOCATIONS HIGHLIGHTS

40
6939 W Loop 1604 NIn FY 2019, the Northwest Service Center provided trash, recycling, and organics collections services to approximately 101,000 customers with a staff of 85 led by Manager Anthony Salazar (inset). The majority of the team was side loading equipment operators at 51 alongside collection truck drivers and collection workers. The location also had three participants in the CDL apprentice program.
The estimated volume collected last year on a weekly basis was 1,546 tons of trash, 406 tons of recycling, and 214 tons of organics. Crews drove approximately 17,000 miles per week to make these collections. The Northwest Service Center operated 67 vehicles.
Drivers, route supervisors, and assistant managers all focused on reducing the organics rejection rate. Tagging carts for non-program materials rose from 8,604 customer messages in FY 2018 to 9,652 in FY 2019. Driver log entries also increased by 11% from 13,800 entries in FY 2018 to 15,347 last year. These tactics combined to achieve a 15.7% organic rejection rate at this operation which was under the overall Department goal of 20%.
The most significant accomplishment of FY 2019 was moving into a new location in October. The modern facilities include some TCI buildings on the campus as well as Fleet Operations. David McDaniel with SWMD and Cathleen Crabb with TCI were the project leads for this multi-year endeavor.
Northwest Service Center

41
10303 Tool YardAlfonso Castillo, Jr. (inset) managed a total of 77 employees in FY 2019. In addition to two assistant managers and five route inspectors, the facility had 54 side load operators, seven truck drivers, and 12 collectors. The Northeast Service Center also had four individuals in the CDL apprentice program.
To service its 92,606 customers with weekly trash, recycling, and organics collections, staff drove an average of 14,258 miles per week with a fleet of 61 trucks. The estimated total weekly volume collected was 1,402 tons of trash, 421 tons of recycling, and 331 tons of organics.
The Northeast Service Center had a very successful year with the organics program. Of all the organic material collected, 91% was accepted at the compost facility run by New Earth.
A forward looking technology, known as FleetMind (please see below), was installed in five side load trucks in FY 2019. Twenty operators were trained on this technology.
NOTE: The Solid Waste Management Department is piloting FleetMind, an onboard computing solution to help improve the SWMD’s operation and overall communication efforts. The SWMD is analyzing the solution’s ability to: (i.) capture real-time data and video footage; (ii.) confirm service of delivery; (iii.) identify contamination; (iv.) monitor route activity, and; (v.) track driver performance. The expectation is that the FleetMind will enhance decision-making in the areas of driver coaching, resident communication, and operational productivity.
Northeast Service Center

42
6927 W CommerceThe Southwest Service Center had 85,255 customers in FY 2019 with a staff of 72 under the guidance of Manager Martin Perez (inset). The Center collected, on average, 1,380 tons of trash, 281 tons of recyclables, and 321 tons of organics each week for a combined total of 1,982 tons. The 56 trucks drove an average of 40,000 miles during a six-day work week for those collections.
The team’s continued focus on safety saw a reduction in events despite driving an additional 82,111 miles in FY 2019. Additionally, the Southwest Service Center improved its organics rejection rate to 35.9% in FY 2019 as opposed to 40.1% in FY 2018.
The Center also supported the collection of recyclables for all City employees through the Central Office Recycle (COR) program. Recyclables were collected from CoSA employees housed either in a CoSA owned or leased facility in the downtown or Central Business District (CBD).
There were 47 different collection points for the office recycling program including Municipal Plaza, Riverview Towers, and various community centers. Surprisingly, the COR also provided collection at several other unique locations such as the Magik Theatre and La Villita. In FY 2019, this route was serviced by only one hard-working SWMD employee. Unlike residential collections, carts for COR were not at the curb and, for four days per week, this driver retrieved and returned the carts to all the service points. In addition to regular collection spots, COR ran additional paper collection routes for 20 locations last year. For that program special collection bins, brand name Toters, were required and marked specifically for shredded paper only. Over 240 tons were collected in FY 2019 by the COR, which included about 24 tons of shredded paper.
Southwest Service Center

43
1318 SE Loop 410Seventy-one employees were managed by Ray Castillo (inset) at the Southeast Service Center. They provided weekly trash, recycling, and organics collections for 78,083 Solid Waste Management customers. The year-end volumes for these collections were 68,654 tons of trash, 15,386 tons of recycling, and 10,747 tons of organics.
Some customers in this service area had taken advantage of the Department’s cart downsizing program. More than 5,100 customers were using the smallest 49-gallon cart in the past year and another 2,570 had moved to the 64-gallon size brown trash cart.
The location had 38 trucks and other equipment in FY 2019. The vehicles, on average, drove 16,855 miles per month. Four employees obtained their CDL; three apprentices and one collector completed the training.
Inspectors and drivers continued to work together distributing tags on contaminated recycling and organics carts. Customers were started off with ‘friendly reminder’ messages, but for continual infractions, residents received a warning and ultimately a fine notice tag for habitual contamination. The Southeast Service Center had a 72% acceptance rate for all the organic material that was collected in FY 2019.
Perhaps the highlight of the year was moving into a new facility in January 2019. There are several buildings on the campus, some operated by TCI and a large space for Fleet Operations. Several notable improvements over the old location were a wellness facility, spacious meetings rooms, larger employee locker space, new furniture, a truck wash area on property, and multiple fuel pumps.
Southeast Service Center
44
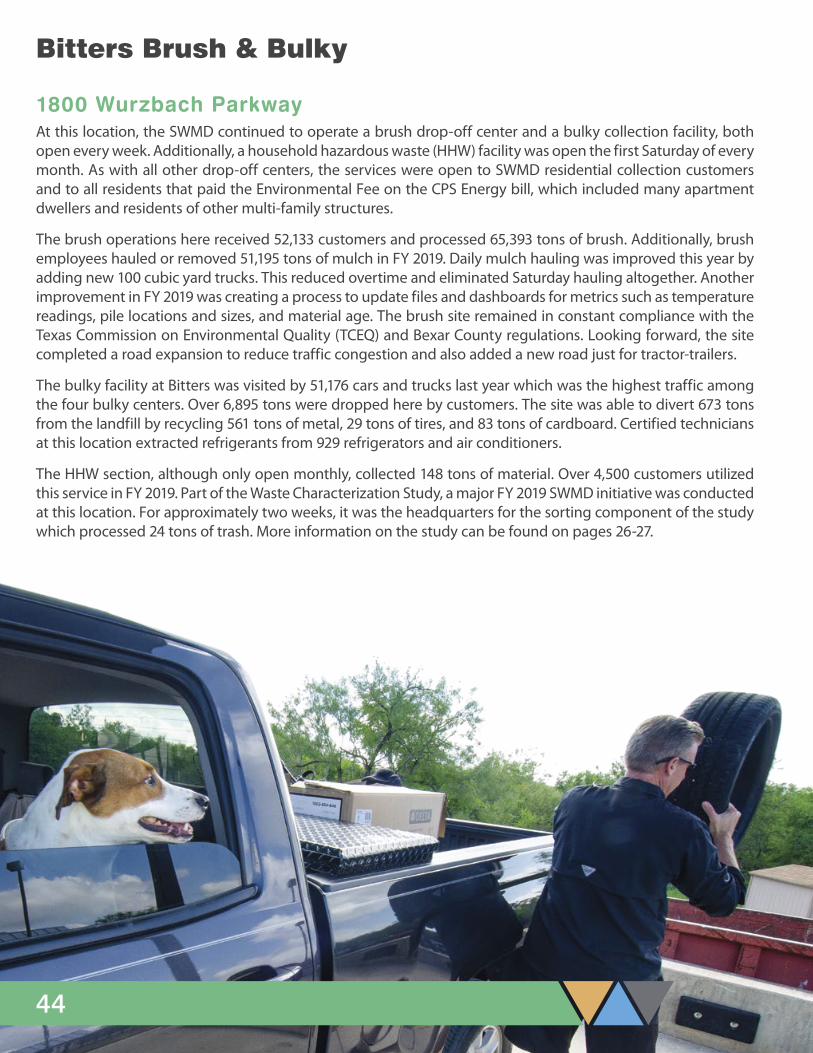
1800 Wurzbach ParkwayAt this location, the SWMD continued to operate a brush drop-off center and a bulky collection facility, both open every week. Additionally, a household hazardous waste (HHW) facility was open the first Saturday of every month. As with all other drop-off centers, the services were open to SWMD residential collection customers and to all residents that paid the Environmental Fee on the CPS Energy bill, which included many apartment dwellers and residents of other multi-family structures.
The brush operations here received 52,133 customers and processed 65,393 tons of brush. Additionally, brush employees hauled or removed 51,195 tons of mulch in FY 2019. Daily mulch hauling was improved this year by adding new 100 cubic yard trucks. This reduced overtime and eliminated Saturday hauling altogether. Another improvement in FY 2019 was creating a process to update files and dashboards for metrics such as temperature readings, pile locations and sizes, and material age. The brush site remained in constant compliance with the Texas Commission on Environmental Quality (TCEQ) and Bexar County regulations. Looking forward, the site completed a road expansion to reduce traffic congestion and also added a new road just for tractor-trailers.
The bulky facility at Bitters was visited by 51,176 cars and trucks last year which was the highest traffic among the four bulky centers. Over 6,895 tons were dropped here by customers. The site was able to divert 673 tons from the landfill by recycling 561 tons of metal, 29 tons of tires, and 83 tons of cardboard. Certified technicians at this location extracted refrigerants from 929 refrigerators and air conditioners.
The HHW section, although only open monthly, collected 148 tons of material. Over 4,500 customers utilized this service in FY 2019. Part of the Waste Characterization Study, a major FY 2019 SWMD initiative was conducted at this location. For approximately two weeks, it was the headquarters for the sorting component of the study which processed 24 tons of trash. More information on the study can be found on pages 26-27.
Bitters Brush & Bulky

45
7030 Culebra RoadThis site continued to operate as one of the SWMD bulky drop-off centers but also the permanent location for a household hazardous waste (HHW) facility. The free services were open to SWMD residential collection customers and were also available to all residents that paid the Environmental Fee on the CPS Energy bill, which included many apartment and other multi-family dwellers.
In FY 2019, 41,205 cars came through the bulky facility at this location. Although over 6,000 tons of material were landfilled, there were also 335 tons of metal, 41 tons of tires, and 45 tons of cardboard collected. That equated to 421 tons that were able to be recycled. Residents were permitted to bring one cubic yard of construction debris and four cubic yards of bulky items per visit. Large appliances, referred to as ‘whitegoods’ were also accepted. From the refrigerators and air conditioning units received, refrigerants were extracted from 442 appliances by certified staff at the Culebra location.
The Culebra HHW facility collected over 800 tons of materials from the 30,277 cars that passed through the Center. An additional 20 tons was recovered through three neighborhood mobile HHW events from 810 customers.
Common HHW items accepted included automotive fluid, chemicals, solvents, pesticides, paint, oil filters, fluorescent lights, and electronic waste. Four categories of these materials, non-hazardous batteries, oil, paint, and antifreeze were able to be recycled. In FY 2019 nearly 70 tons of those four materials were recycled.
Culebra Road Bulky & HHW

46
1531 Frio City RoadThis bulky location collected 8,318 total tons of material this past fiscal year. It had the second highest amount of traffic behind the Bitters location with 42,396 cars and trucks coming to this location. Frio City recycled 232.8 tons of metal, 56.8 tons of tires, and 5.4 tons of cardboard.
The free services were open to SWMD residential collection customers but were also available to all residents that paid the Environmental Fee on the CPS Energy bill, which included many apartment and multi-family dwellers.
Common items accepted included wood, sheet rock, roof shingles, furniture, mattresses, carpet, sinks, tubs, and car parts. Large appliances, referred to as ‘whitegoods’ were also accepted. Certified staff removed refrigerants from the 367 appliances received at the Frio City location.
All four bulky drop-off centers were open Tuesday through Saturday all of last year with the exception of holidays.
2755 Rigsby AvenueThis location was one of four bulky drop-off centers the SWMD operated in FY 2019. It was staffed with four employees. The free services were open to SWMD residential collection customers but were also available to all residents that paid the Environmental Fee on the CPS Energy bill, which included many apartment and multi-family dwellers.
In FY 2019, 25,805 cars utilized the Rigsby bulky facility. The total tons of material collected in FY 2019 here was just over 4,341 and 234 of that tonnage was able to be recycled. Metal (181.3 tons), tires (46.9 tons), and cardboard (5.4 tons) were diverted from the landfill. Residents were permitted to bring one cubic yard of construction debris and four cubic yards of bulky items per visit.
Common items accepted included wood, sheet rock, roof shingles, furniture, mattresses, carpet, sinks, tubs, and car parts. Large appliances, referred to as ‘whitegoods’ were also accepted. Certified staff removed refrigerants from 232 refrigerators and air conditioners at the Rigsby location last year.
As mentioned in the stakeholders letter, pictured here is Juan Barerra, Jr. the International Road-E-O champion in the “roll-off” competition.
Rigsby Bulky
Frio City Road Bulky

47
8963 Nelson RoadNelson Gardens was one of two brush sites the SWMD operated in FY 2019. During the past fiscal year, it received 18,049 customers. These customers brought over 39,348 tons of brush to this brush grinding and recycling center. The services were open to SWMD residential collection customers but were also available to all residents that paid the Environmental Fee on the CPS Energy bill, which included many apartment and multi-family dwellers. The facility was open every day all year with the exception of holidays. There was a staff of four at the Nelson Gardens location.
One significant improvement in FY 2019, the Center reduced overtime and eliminated Saturday hauling by implementing daily mulch hauling with new 100 cubic yard trucks. Nelson Gardens also created better dashboards for metrics such as temperature readings, pile locations and sizes, and material age. The brush site remained in constant compliance with the Texas Commission on Environmental Quality (TCEQ) and Bexar County regulations. Looking forward, the site expanded its work face footprint by approximately seven acres.
Nelson Gardens also contributed a large support effort for the Waste Characterization Study, detailed on pages 26 and 27. All of the material collection, 24 tons, and the transportation were done out of this location. It was taken to the Bitters site for sorting.
6802 Culebra RoadThe SWMD relocated its Warehouse Operations this past year which, among many other things, involved moving 75,000 brown, blue, and green customer carts. This project was completed on time and under budget. Equally important, there were no interruptions to customer service requests. In FY 2019, there were 77,857 service requests and of those, 16,951 were for smaller cart exchanges. One main rationale for the move was to increase efficiency. In FY 2019, the Warehouse had nine full-time employees and was able to reduce the temporary employee staff from 20 down to nine. Additionally, four drivers loaned from the Service Centers were released back to their own locations.
Several promotions were a highlight for this team. Two crew leaders were upgraded to supervisor, one truck driver was moved up to crew leader, and one field maintenance employee became an equipment operator. In addition, three fork lift operators obtained their operator’s license which increased operational safety. The equipment inventory was expanded to include five trailers to increase cart delivery efficiency as well as one rear load vehicle, one flatbed truck, and one tractor.
Warehouse Operations also supported major City events by supplying recycling carts and cleanup services. The New Year’s Eve celebration, the Rock-n-Roll Marathon, Luminaria, and Fiesta were only a few.
As mentioned in the stakeholders letter, pictured here is Aaron Arce with the City Manager’s Excellence Award.
Warehouse Operations
Nelson Gardens Brush

48
Year-End Results
Pie Chart (above). Total numbers from Curbside (Trash, Recycling, Organics, Brush, Bulky, and Special), Drop-off Centers, Special Events, and Dial-A-Trailer.
Bar Graph (left). For recycling, ‘good’ material is defined as all recyclable material that is accepted by the MRF and is free of any mixed in trash. For organics, it refers to organic material which is compostable material accepted by the composting facility, also free of any mixed in trash.
1.11
Tons Landfilled per Household
1.15
1.13
1.08
1.06
2015 2016 2017 2018 2019
1.04
1.16
1.12
1.08
Material Recovered vs. Landfilled
Recovered211,664 tons
Landfilled379,795 tons
Total591,459 tons
Good Material60,273 tons
Recycling Tonnage by Program
Good Material50,508 tons
Recycling Organics
Total Material75,644 tons
Total Material67,916 tons

49
Executive Leadership
David W. McCaryDirector
David NewmanDeputy Director
Josephine ValenciaAssistant Director
Nicholas GalusAssistant Director
Audrey Zamora-JohnsonChief of Staff
Walter BarrettSafety, Reliability and Quality Assurance
Ray CastilloSoutheast Collections
Lynn CoxCouncil Affairs & Customer Service
Tim PittmanPlanning & Innovation
Anthony SalazarNorthwest Collections
Andrew GutierrezBrush & Bulky Collections
Brian HalversonCommercial Division
David BadilloFleet Operations
Marcus LeeMarketing & Communications
Martin PerezSouthwest Collections
Gilbert RamirezFiscal Administration
Alfonso Castillo, Jr.Northeast Collections
Salvador YtuarteEnvironmental Services
Special thanks to the Sheraton Gunter for the use of their facility
50
OUR FY 2019 RETIREESWe appreciate your contribution to the Solid Waste Management Department.
Esteban Aguirre
Ricky Alvarado
Adolph Esparza
Calletano Z. Gaitan
Norma Gomez
Hector Gomez
Albert Gutierrez
Stephen Haney
Joe Manuel Hernandez
Rudolfo Hernandez
Hoyt Jefferson
Robert Longoria
Daniel Maciel
Patrick F. Martinez
Ronald Mercer
Robert Ozuna
Ruben R. Roque
Rodolfo Serna
Samuel Tijerina
Cruz Trevino
Hector Villanueva
OUR VETERANSThank you for your service.
Noel B. Andino
Albert Barrera
Walter Barrett
Anthony Bermea
Norman Caldwell
Ricardo Cantu
Ramon Casillas
Ramy Castilla
Jose M. Cerda
Michael Culbertson
Leonard Dezaiffe
Ramon Diaz, III
Amanda Ehlers
Roger Escamilla
Tarik Esquerra
Ron Fletcher
Avery Flood
Marco Flores
Victor Garcia
Adam Giarratano
Gary Gomez
Juan Gonzales
Roland Gonzales
Brandon Good Shield
Naomi Good Shield
Edward Guajardo
Brian Guerra
Gilbert Guerrero
Paul C. Harris
Vernon Harris
Chris Hebner
Alejandro Hernandez
Joe A. Hernandez
Jennifer Holton
Clifford Hughes
Alfred Jimenez
Stephanie A. Johnson
Chris Kittler
Ernest A. Lopez
Mark Lopez
Richard Love
Richard Maldonado
Antonio Martinez
Jose L. Martinez
David McDaniel
Francisco Muniz
Sam Munoz
Ysidoro Olivo, Jr.
Doug Overton
Matthew Palacios
Mario Palomo
Michael Parker
Paul A. Pena
Jose Perez
Ruben Perez
Samantha Prentice
Kenneth Ravenscroft
Valeriano Reyna
Manuel Rios
Steven Roberts
Jesus Rodriguez
Raymond Rojas
Jose Luis Ruiz
William Russell
Aaron Sanchez
Michael Sanchez
Sergio Scaturchio
Michael Scott
Agapito Shearer
Otto Sonnen
Robert Spenrath
Jonathan Thornton
Glen Tobin
Tomas Torres
Joe Uriegas
Juan Uriegas
Fidel Valdovinos
Alejandro Villalon
Paul D. Villarreal
Danny Viray
Richard Walley
Ross Webb

4410 W. Piedras Dr.San Antonio, TX 78228
210-207-6428
sanantonio.gov/swmd
The Solid Waste Management Department (the ‘SWMD’ or the ‘Department’) serves approximately 359,000 single-family San Antonio households, employs 730 individuals, and manages two major funds: (i.) the Solid Waste Operating and Maintenance Fund which was $125.5 million in FY 2019 and; (ii.) the Fleet Services Fund which was $19.8 million.
The SWMD is responsible for the collection of municipal solid waste generated by its customers, the residents of the City of San Antonio (the ‘City’). Primary collection services include: (i.) weekly curbside collection of residential garbage, recyclables, and organics; (ii.) semi-annual residential collection of brush and bulky items, and; (iii.) other services by request. Additionally, the Department: (i.) administers the City’s household hazardous waste (HHW) programs; (ii.) monitors and maintains closed City landfills; (iii.) operates two brush recycling centers; (iv.) operates four bulky waste drop-off centers, and; (v.) provides dead animal collection.
Supplemental services by request include out of cycle collections, special leaf collections, and a collection assistance service for customers with physical challenges. To support neighborhood clean-up efforts, community organizations can request large containers through the Dial-a-Trailer (DAT) program. Quarterly, the Department sponsors free landfill days to provide more opportunities for residents to conveniently and safely dispose of their solid waste. Assistance is provided as needed for severe weather clean-up, illegal dumping, and recycling at some of San Antonio’s larger city-wide special events. The Department also has Community Outreach and Commercial Recycling Divisions.
The Solid Waste Operating and Maintenance Fund is an enterprise fund, requiring that the services provided to the customers are supported by fees charged to the customers for those services, making the fund self-supporting. The majority of its revenue is from the Solid Waste Fee and the Environmental Fee, both of which are placed on a customer’s monthly CPS Energy bill. Additional revenues are derived from waste hauler permit fees, brush recycling fees, and the sale of mulch and recyclable materials. This fund receives no funding from any taxes.
The Fleet Services Fund is an internal services fund. The Department is responsible for the maintenance and repair of 2,041 heavy equipment vehicles for various City Departments. In this role, the Department ensures that vehicles are kept operational and ready for use throughout the City by using an integrated and programmatic service delivery approach.
Information current at time of printing.
Department Profile

SW-M00901 • 01-2020