fy16 – preliminary budget presentation may 2015 murray school district
TRANSCRIPT

FY16 – PRELIMINARY BUDGET PRESENTATION
MAY 2015
MURRAY SCHOOL DISTRICT
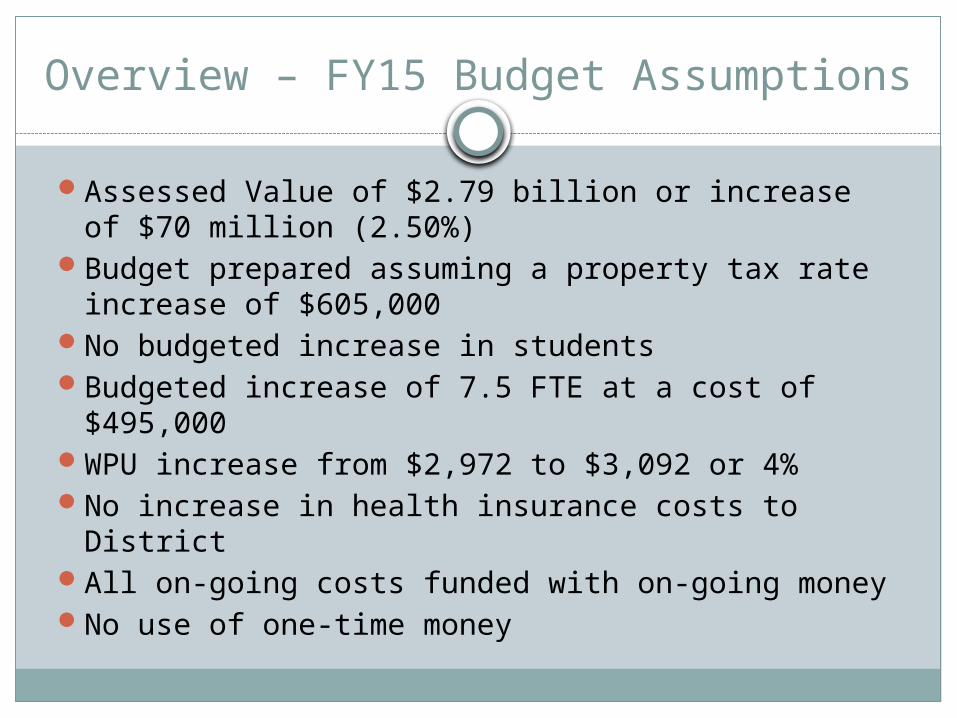
Overview – FY15 Budget Assumptions
Assessed Value of $2.79 billion or increase of $70 million (2.50%)
Budget prepared assuming a property tax rate increase of $605,000
No budgeted increase in studentsBudgeted increase of 7.5 FTE at a cost of
$495,000WPU increase from $2,972 to $3,092 or 4%No increase in health insurance costs to District All on-going costs funded with on-going money No use of one-time money
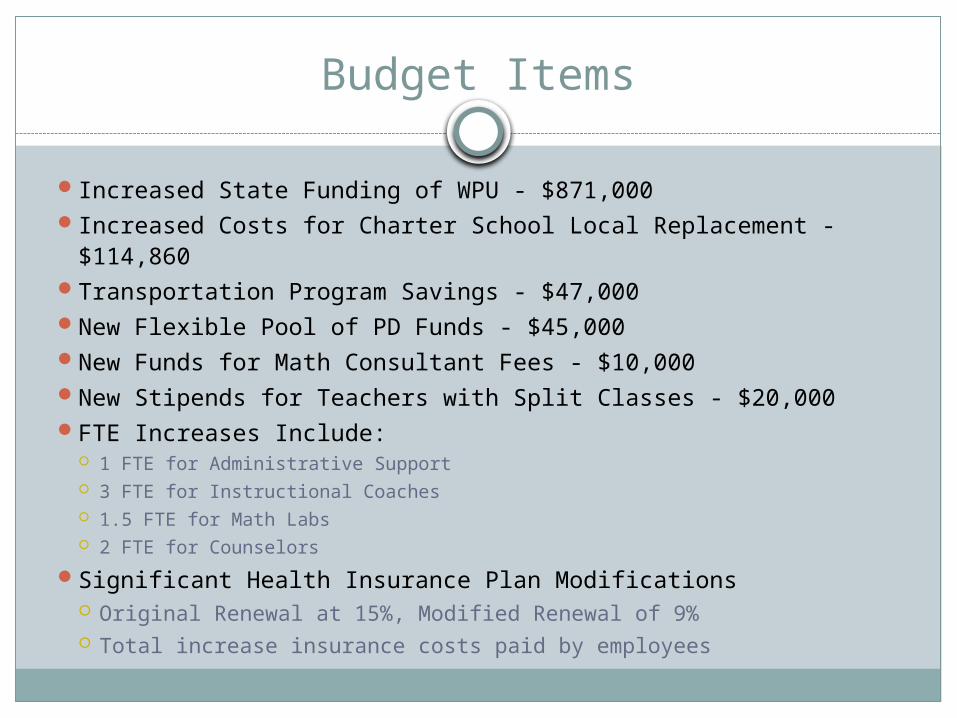
Budget Items
Increased State Funding of WPU - $871,000 Increased Costs for Charter School Local Replacement - $114,860 Transportation Program Savings - $47,000 New Flexible Pool of PD Funds - $45,000 New Funds for Math Consultant Fees - $10,000 New Stipends for Teachers with Split Classes - $20,000 FTE Increases Include:
1 FTE for Administrative Support 3 FTE for Instructional Coaches 1.5 FTE for Math Labs 2 FTE for Counselors
Significant Health Insurance Plan Modifications Original Renewal at 15%, Modified Renewal of 9% Total increase insurance costs paid by employees
Budget Items – Cont.
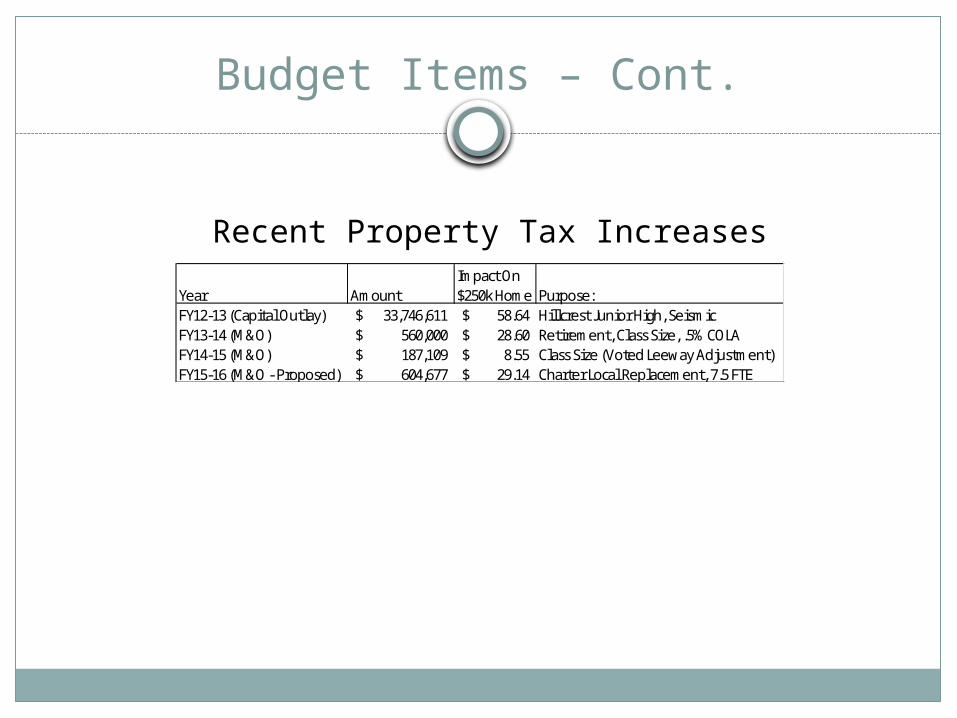
Impact OnYear Amount $250k Home Purpose:FY12-13 (Capital Outlay) 33,746,611$ 58.64$ Hillcrest Junior High, SeismicFY13-14 (M&O) 560,000$ 28.60$ Retirement, Class Size, .5% COLAFY14-15 (M&O) 187,109$ 8.55$ Class Size (Voted Leeway Adjustment)FY15-16 (M&O - Proposed) 604,677$ 29.14$ Charter Local Replacement, 7.5 FTE
Recent Property Tax Increases
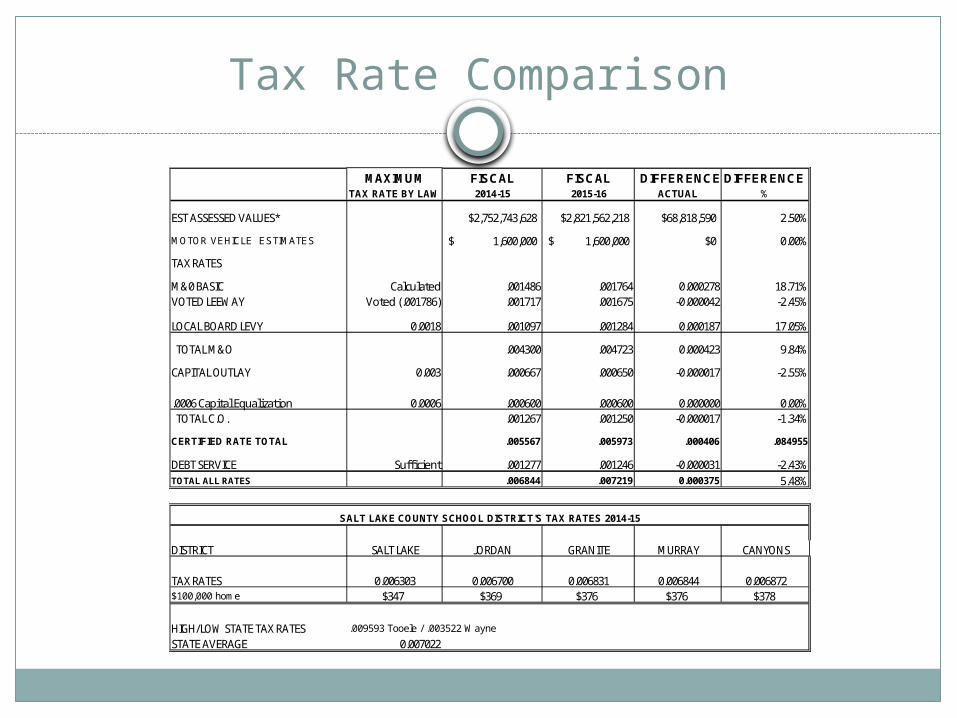
Tax Rate Comparison
MAXIMUM FISCAL FISCAL DIFFERENCE DIFFERENCETAX RATE BY LAW 2014-15 2015-16 ACTUAL %
EST ASSESSED VALUES* $2,752,743,628 $2,821,562,218 $68,818,590 2.50%
MOTOR VEHICLE ESTIMATES 1,600,000$ 1,600,000$ $0 0.00%
TAX RATES
M&0 BASIC Calculated .001486 .001764 0.000278 18.71%VOTED LEEWAY Voted (.001786) .001717 .001675 -0.000042 -2.45%
LOCAL BOARD LEVY 0.0018 .001097 .001284 0.000187 17.05%
TOTAL M&O .004300 .004723 0.000423 9.84%
CAPITAL OUTLAY 0.003 .000667 .000650 -0.000017 -2.55%
.0006 Capital Equalization 0.0006 .000600 .000600 0.000000 0.00% TOTAL C.O. .001267 .001250 -0.000017 -1.34%
CERTIFIED RATE TOTAL .005567 .005973 .000406 .084955
DEBT SERVICE Suffi cient .001277 .001246 -0.000031 -2.43%TOTAL ALL RATES .006844 .007219 0.000375 5.48%
DISTRICT SALT LAKE JORDAN GRANITE MURRAY CANYONS
TAX RATES 0.006303 0.006700 0.006831 0.006844 0.006872$100,000 home $347 $369 $376 $376 $378
HIGH/LOW STATE TAX RATES .009593 Tooele / .003522 Wayne
STATE AVERAGE 0.007022
SALT LAKE COUNTY SCHOOL DISTRICT'S TAX RATES 2014-15

General Fund Budget SummaryExpenditures by Object
2014-15 2015-162009-10 2010-11 2011-12 2012-13 2013-14 Revised ProposedActual Actual Actual Actual Actual Budget Budget
Revenues:Property Taxes $ 10,565,553 $ 11,210,164 $ 12,429,628 $ 12,704,863 $ 13,072,096 $ 13,194,313 $ 15,274,776 Interest on Investments 427,111 106,823 232,949 180,993 221,667 25,000 25,000 Other Local Revenue 1,110,006 882,628 1,247,218 1,582,864 1,815,282 1,388,143 1,389,156 State of Utah 22,963,978 22,390,363 22,060,958 22,345,426 23,424,024 24,653,764 24,333,382 Federal Government 4,296,485 3,594,711 2,080,138 2,049,985 2,140,924 2,408,648 2,201,765
Total Revenues 39,363,133 38,184,689 38,050,891 38,864,131 40,673,993 41,669,868 43,224,079
Expenditures:Salaries 24,545,723 24,761,810 24,763,221 24,510,003 24,570,978 25,750,209 26,603,991 Employee Benefits 9,389,686 9,308,095 10,105,286 9,928,384 11,161,067 11,434,187 11,784,251 Contract Services 572,184 455,150 504,154 451,862 468,201 781,383 799,949 Maintenance & Repairs 656,657 456,647 581,836 316,121 643,794 553,141 503,369 Other Purchased Services 311,407 329,023 322,073 273,068 296,632 390,735 387,793 Supplies 2,683,004 2,415,447 2,334,936 2,174,508 2,612,913 3,171,009 3,270,443 Equipment 737,427 454,042 320,613 276,346 730,399 112,820 112,820 Other Objects 22,420 36,949 33,080 66,356 71,710 104,104 104,104
Total Expenditures 38,918,508 38,217,163 38,965,199 37,996,648 40,555,694 42,297,588 43,566,720
Net Change in Fund Balances 444,625 (32,474) (914,308) 867,483 118,299 (627,720) (342,641) Fund Balance - July 1 9,404,303 9,848,928 9,816,454 8,902,146 9,769,629 9,887,928 9,260,208 Fund Balance - June 30 $ 9,848,928 $ 9,816,454 $ 8,902,146 $ 9,769,629 $ 9,887,928 $ 9,260,208 $ 8,917,567
Fund BalanceNonspendable:
Inventories & Prepaid Exp. $ 124,151 $ 755,502 $ 498,687 $ 588,061 $ 618,420 $ 618,420 $ 618,420 Other 742,510 51,739 60,938 - -
Committed:Economic Stabilization 2,000,000 2,000,000 2,000,000 2,000,000 2,000,000 2,000,000 2,000,000 Employee Benefit Obligations 5,438,358 5,238,358 4,996,968 5,238,358 5,238,358 5,238,358 5,238,358
Unassigned 1,543,909 1,770,855 1,345,553 1,943,210 2,031,150 1,403,430 1,060,789 Total Fund Balance $ 9,848,928 $ 9,816,454 $ 8,902,146 $ 9,769,629 $ 9,887,928 $ 9,260,208 $ 8,917,567

Student Activities Fund Budget SummaryExpenditures by Object
2014-15 2015-162009-10 2010-11 2011-12 2012-13 2013-14 Revised ProposedActual Actual Actual Actual Actual Budget Budget
Revenues:Other Local Revenue $ 1,172,604 $ 1,603,539 $ 1,561,819 $ 1,795,099 1,448,852 $ 1,900,000 $ 1,900,000
Total Revenues 1,172,604 1,603,539 1,561,819 1,795,099 1,448,852 1,900,000 1,900,000
Expenditures:SalariesEmployee BenefitsPurchased Services 259,715 545,173 567,237 695,321 328,312 30,000 30,000 Supplies 684,188 757,647 639,994 759,462 740,595 1,563,000 1,563,000 Equipment 74,921 55,580 45,722 62,135 45,403 7,000 7,000 Other Objects 162,556 242,730 277,347 273,591 284,931 300,000 300,000
Total Expenditures 1,181,380 1,601,130 1,530,300 1,790,509 1,399,241 1,900,000 1,900,000
Net Change in Fund Balances (8,776) 2,409 31,519 4,590 49,611 - - Fund Balance - July 1 744,933 736,157 738,566 770,085 774,675 824,286 824,286 Fund Balance - June 30 $ 736,157 $ 738,566 $ 770,085 $ 774,675 824,286 $ 824,286 $ 824,286
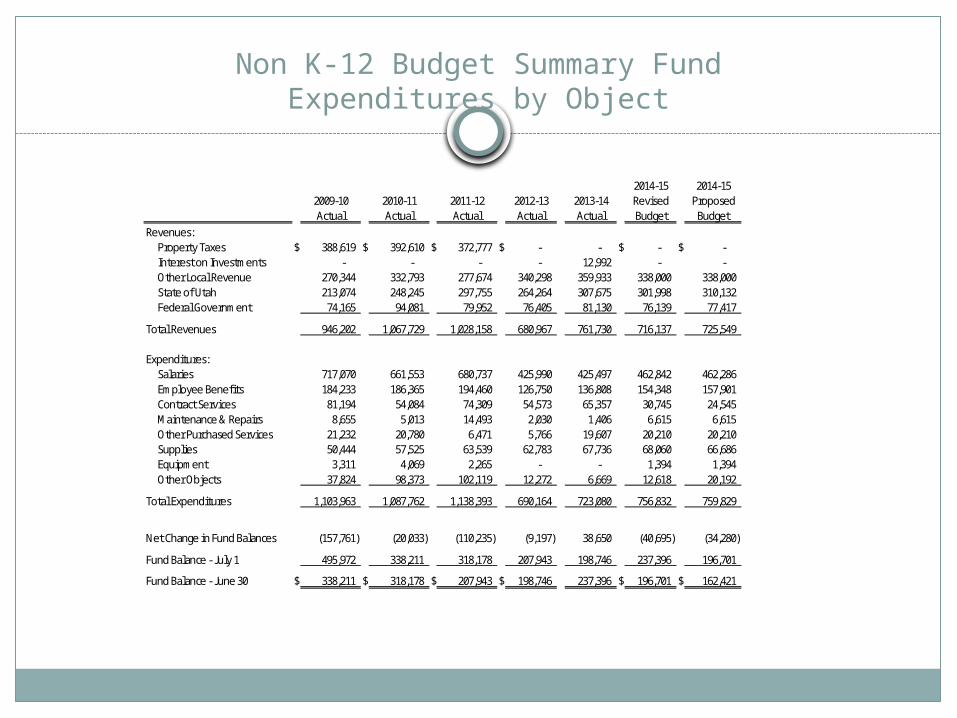
Non K-12 Budget Summary FundExpenditures by Object
2014-15 2014-152009-10 2010-11 2011-12 2012-13 2013-14 Revised ProposedActual Actual Actual Actual Actual Budget Budget
Revenues:Property Taxes $ 388,619 $ 392,610 $ 372,777 $ - - $ - $ - Interest on Investments - - - - 12,992 - - Other Local Revenue 270,344 332,793 277,674 340,298 359,933 338,000 338,000 State of Utah 213,074 248,245 297,755 264,264 307,675 301,998 310,132 Federal Government 74,165 94,081 79,952 76,405 81,130 76,139 77,417
Total Revenues 946,202 1,067,729 1,028,158 680,967 761,730 716,137 725,549
Expenditures:Salaries 717,070 661,553 680,737 425,990 425,497 462,842 462,286 Employee Benefits 184,233 186,365 194,460 126,750 136,808 154,348 157,901 Contract Services 81,194 54,084 74,309 54,573 65,357 30,745 24,545 Maintenance & Repairs 8,655 5,013 14,493 2,030 1,406 6,615 6,615 Other Purchased Services 21,232 20,780 6,471 5,766 19,607 20,210 20,210 Supplies 50,444 57,525 63,539 62,783 67,736 68,060 66,686 Equipment 3,311 4,069 2,265 - - 1,394 1,394 Other Objects 37,824 98,373 102,119 12,272 6,669 12,618 20,192
Total Expenditures 1,103,963 1,087,762 1,138,393 690,164 723,080 756,832 759,829
Net Change in Fund Balances (157,761) (20,033) (110,235) (9,197) 38,650 (40,695) (34,280)
Fund Balance - July 1 495,972 338,211 318,178 207,943 198,746 237,396 196,701
Fund Balance - June 30 $ 338,211 $ 318,178 $ 207,943 $ 198,746 237,396 $ 196,701 $ 162,421

Redevelopment Agency – Special Revenue FundExpenditures by Object
2014-15 2015-16Revised ProposedBudget Budget
Revenues:Tax Increment $ $ 1,822,250 $ 1,867,806
Total Revenues 1,822,250 1,867,806
Expenditures:Tax Increment Payment 1,822,250 1,867,806
Total Expenditures 1,822,250 1,867,806
Net Change in Fund Balances - -
Fund Balance - July 1 - -
Fund Balance - June 30 $ $ - $ -
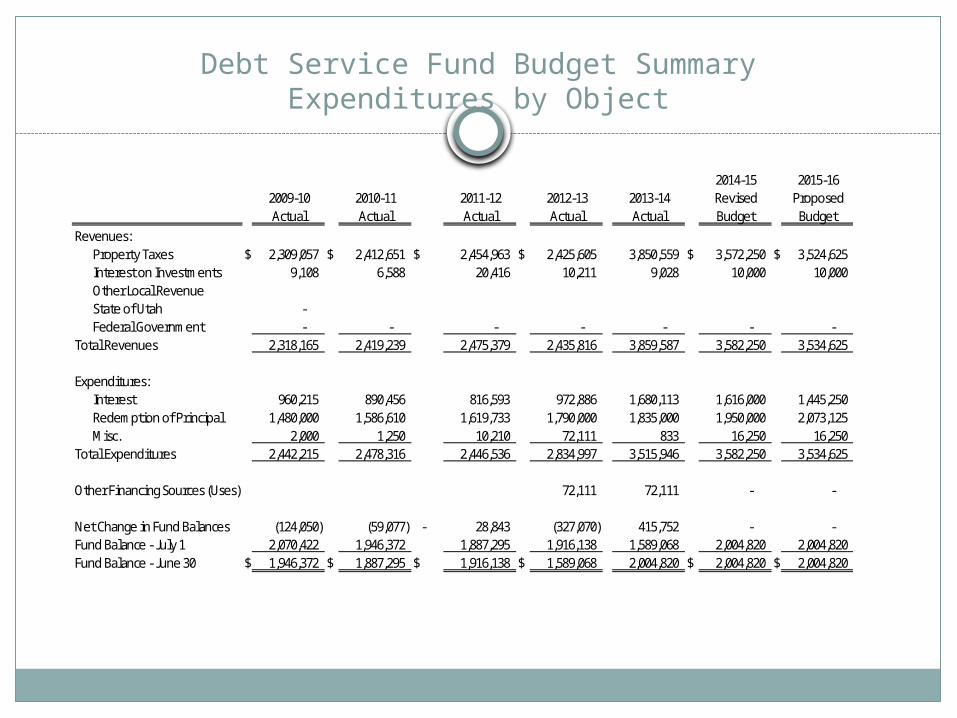
Debt Service Fund Budget SummaryExpenditures by Object
2014-15 2015-162009-10 2010-11 2011-12 2012-13 2013-14 Revised ProposedActual Actual Actual Actual Actual Budget Budget
Revenues:Property Taxes $ 2,309,057 $ 2,412,651 $ 2,454,963 $ 2,425,605 3,850,559 $ 3,572,250 $ 3,524,625 Interest on Investments 9,108 6,588 20,416 10,211 9,028 10,000 10,000 Other Local RevenueState of Utah - Federal Government - - - - - - -
Total Revenues 2,318,165 2,419,239 2,475,379 2,435,816 3,859,587 3,582,250 3,534,625
Expenditures:Interest 960,215 890,456 816,593 972,886 1,680,113 1,616,000 1,445,250 Redemption of Principal 1,480,000 1,586,610 1,619,733 1,790,000 1,835,000 1,950,000 2,073,125 Misc. 2,000 1,250 10,210 72,111 833 16,250 16,250
Total Expenditures 2,442,215 2,478,316 2,446,536 2,834,997 3,515,946 3,582,250 3,534,625
Other Financing Sources (Uses) 72,111 72,111 - -
Net Change in Fund Balances (124,050) (59,077) - 28,843 (327,070) 415,752 - - Fund Balance - July 1 2,070,422 1,946,372 1,887,295 1,916,138 1,589,068 2,004,820 2,004,820 Fund Balance - June 30 $ 1,946,372 $ 1,887,295 $ 1,916,138 $ 1,589,068 2,004,820 $ 2,004,820 $ 2,004,820
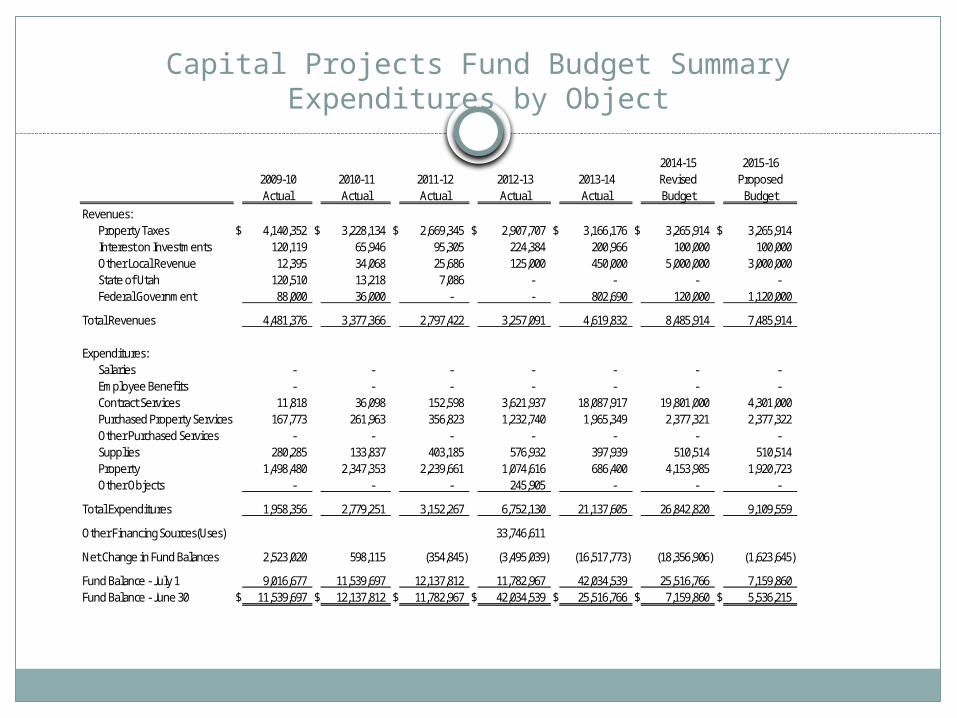
Capital Projects Fund Budget SummaryExpenditures by Object
2014-15 2015-162009-10 2010-11 2011-12 2012-13 2013-14 Revised ProposedActual Actual Actual Actual Actual Budget Budget
Revenues:Property Taxes $ 4,140,352 $ 3,228,134 $ 2,669,345 $ 2,907,707 $ 3,166,176 $ 3,265,914 $ 3,265,914 Interest on Investments 120,119 65,946 95,305 224,384 200,966 100,000 100,000 Other Local Revenue 12,395 34,068 25,686 125,000 450,000 5,000,000 3,000,000 State of Utah 120,510 13,218 7,086 - - - - Federal Government 88,000 36,000 - - 802,690 120,000 1,120,000
Total Revenues 4,481,376 3,377,366 2,797,422 3,257,091 4,619,832 8,485,914 7,485,914
Expenditures:Salaries - - - - - - - Employee Benefits - - - - - - - Contract Services 11,818 36,098 152,598 3,621,937 18,087,917 19,801,000 4,301,000 Purchased Property Services 167,773 261,963 356,823 1,232,740 1,965,349 2,377,321 2,377,322 Other Purchased Services - - - - - - - Supplies 280,285 133,837 403,185 576,932 397,939 510,514 510,514 Property 1,498,480 2,347,353 2,239,661 1,074,616 686,400 4,153,985 1,920,723 Other Objects - - - 245,905 - - -
Total Expenditures 1,958,356 2,779,251 3,152,267 6,752,130 21,137,605 26,842,820 9,109,559
Other Financing Sources(Uses) 33,746,611
Net Change in Fund Balances 2,523,020 598,115 (354,845) (3,495,039) (16,517,773) (18,356,906) (1,623,645)
Fund Balance - July 1 9,016,677 11,539,697 12,137,812 11,782,967 42,034,539 25,516,766 7,159,860 Fund Balance - June 30 $ 11,539,697 $ 12,137,812 $ 11,782,967 $ 42,034,539 $ 25,516,766 $ 7,159,860 $ 5,536,215
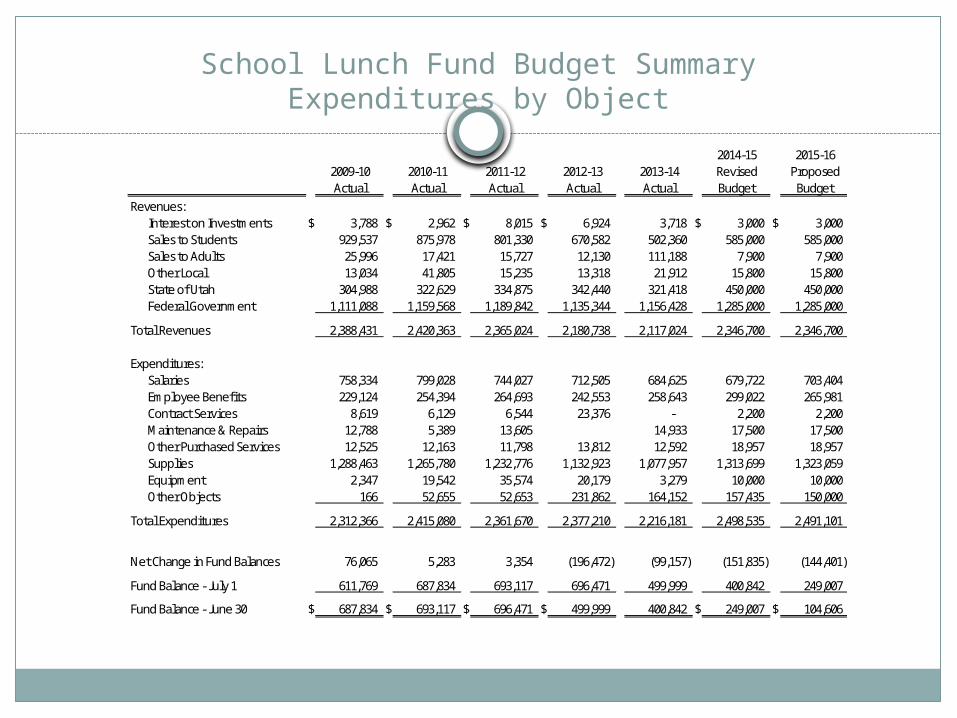
School Lunch Fund Budget SummaryExpenditures by Object
2014-15 2015-162009-10 2010-11 2011-12 2012-13 2013-14 Revised ProposedActual Actual Actual Actual Actual Budget Budget
Revenues:Interest on Investments $ 3,788 $ 2,962 $ 8,015 $ 6,924 3,718 $ 3,000 $ 3,000 Sales to Students 929,537 875,978 801,330 670,582 502,360 585,000 585,000 Sales to Adults 25,996 17,421 15,727 12,130 111,188 7,900 7,900 Other Local 13,034 41,805 15,235 13,318 21,912 15,800 15,800 State of Utah 304,988 322,629 334,875 342,440 321,418 450,000 450,000 Federal Government 1,111,088 1,159,568 1,189,842 1,135,344 1,156,428 1,285,000 1,285,000
Total Revenues 2,388,431 2,420,363 2,365,024 2,180,738 2,117,024 2,346,700 2,346,700
Expenditures:Salaries 758,334 799,028 744,027 712,505 684,625 679,722 703,404 Employee Benefits 229,124 254,394 264,693 242,553 258,643 299,022 265,981 Contract Services 8,619 6,129 6,544 23,376 - 2,200 2,200 Maintenance & Repairs 12,788 5,389 13,605 14,933 17,500 17,500 Other Purchased Services 12,525 12,163 11,798 13,812 12,592 18,957 18,957 Supplies 1,288,463 1,265,780 1,232,776 1,132,923 1,077,957 1,313,699 1,323,059 Equipment 2,347 19,542 35,574 20,179 3,279 10,000 10,000 Other Objects 166 52,655 52,653 231,862 164,152 157,435 150,000
Total Expenditures 2,312,366 2,415,080 2,361,670 2,377,210 2,216,181 2,498,535 2,491,101
Net Change in Fund Balances 76,065 5,283 3,354 (196,472) (99,157) (151,835) (144,401)
Fund Balance - July 1 611,769 687,834 693,117 696,471 499,999 400,842 249,007
Fund Balance - June 30 $ 687,834 $ 693,117 $ 696,471 $ 499,999 400,842 $ 249,007 $ 104,606
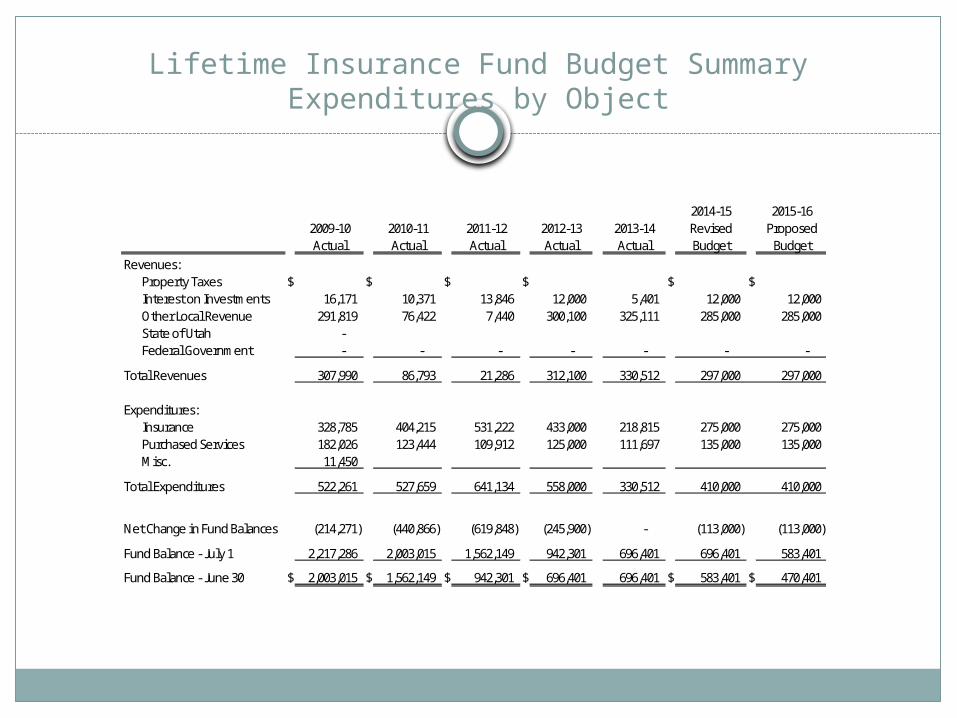
Lifetime Insurance Fund Budget SummaryExpenditures by Object
2014-15 2015-162009-10 2010-11 2011-12 2012-13 2013-14 Revised ProposedActual Actual Actual Actual Actual Budget Budget
Revenues:Property Taxes $ $ $ $ $ $Interest on Investments 16,171 10,371 13,846 12,000 5,401 12,000 12,000 Other Local Revenue 291,819 76,422 7,440 300,100 325,111 285,000 285,000 State of Utah - Federal Government - - - - - - -
Total Revenues 307,990 86,793 21,286 312,100 330,512 297,000 297,000
Expenditures:Insurance 328,785 404,215 531,222 433,000 218,815 275,000 275,000 Purchased Services 182,026 123,444 109,912 125,000 111,697 135,000 135,000 Misc. 11,450
Total Expenditures 522,261 527,659 641,134 558,000 330,512 410,000 410,000
Net Change in Fund Balances (214,271) (440,866) (619,848) (245,900) - (113,000) (113,000)
Fund Balance - July 1 2,217,286 2,003,015 1,562,149 942,301 696,401 696,401 583,401
Fund Balance - June 30 $ 2,003,015 $ 1,562,149 $ 942,301 $ 696,401 696,401 $ 583,401 $ 470,401

QUESTIONS?