fy2009 defense budget: issues for congress
TRANSCRIPT
FY2009 Defense Budget: Issues for Congress
Stephen DaggettRonald O’RourkeLawrence Kapp
Foreign Affairs, Defense, and Trade DivisionCongressional Research Service
February 11, 2008

2
Outline
• Overview, Trends, Issues: Steve Daggett• Weapons Acquisition: Ronald O’Rourke• Personnel Issues: Lawrence Kapp
FY2009 Defense Budget: Overview, Trends, and Issues
Stephen Daggett(202 707-7642)
Specialist in Defense Policy and BudgetsForeign Affairs, Defense, and Trade Division
Congressional Research Service
4
Key Budget Terminology
• Budget authority versus outlays• National defense budget function versus
Department of Defense budget• Discretionary versus mandatory funds• Regular appropriations versus
“emergency” and/or “supplemental” and/or “additional” appropriations
5
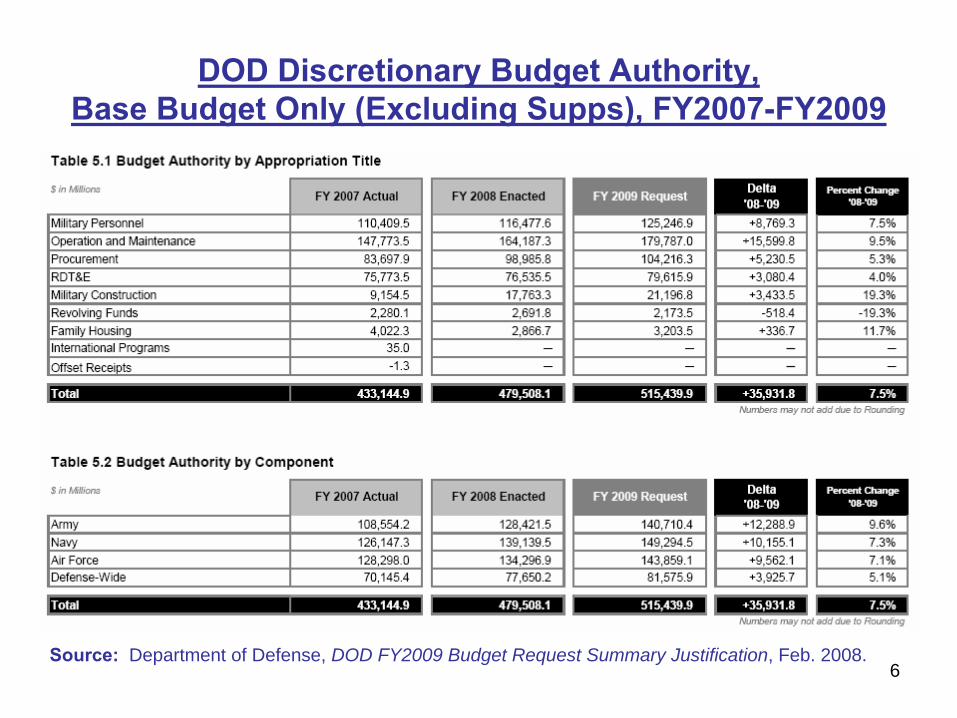
6Source: Department of Defense, DOD FY2009 Budget Request Summary Justification, Feb. 2008.
DOD Discretionary Budget Authority, Base Budget Only (Excluding Supps), FY2007-FY2009
8
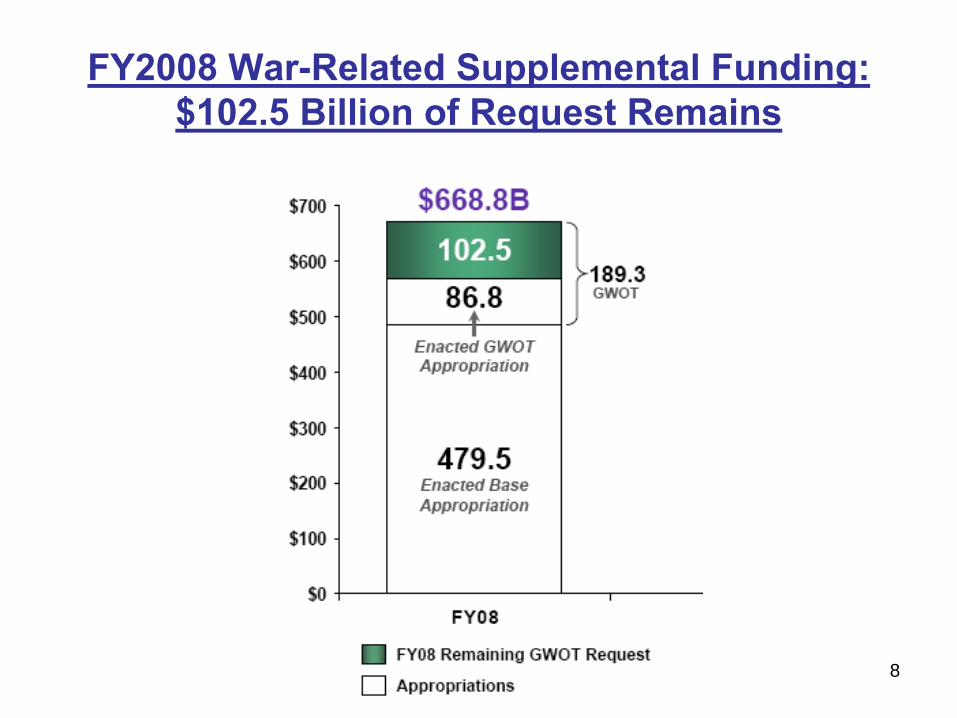
FY2008 War-Related Supplemental Funding: $102.5 Billion of Request Remains
9
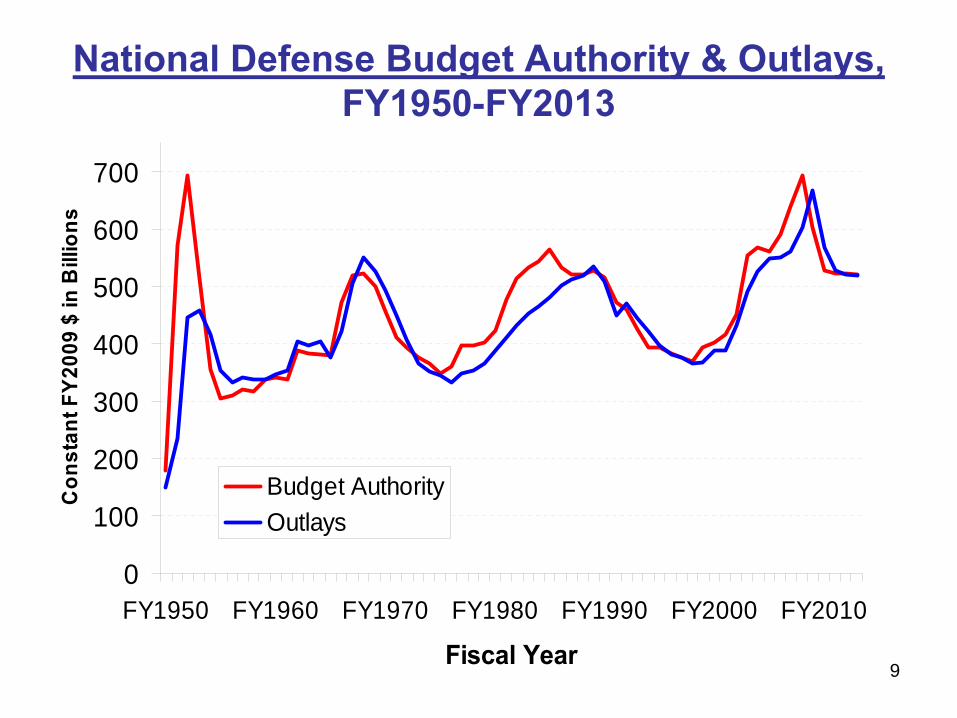
National Defense Budget Authority & Outlays, FY1950-FY2013
0
100
200
300
400
500
600
700
FY1950 FY1960 FY1970 FY1980 FY1990 FY2000 FY2010
Fiscal Year
Con
stan
t FY2
009
$ in
Bill
ions
Budget AuthorityOutlays
10
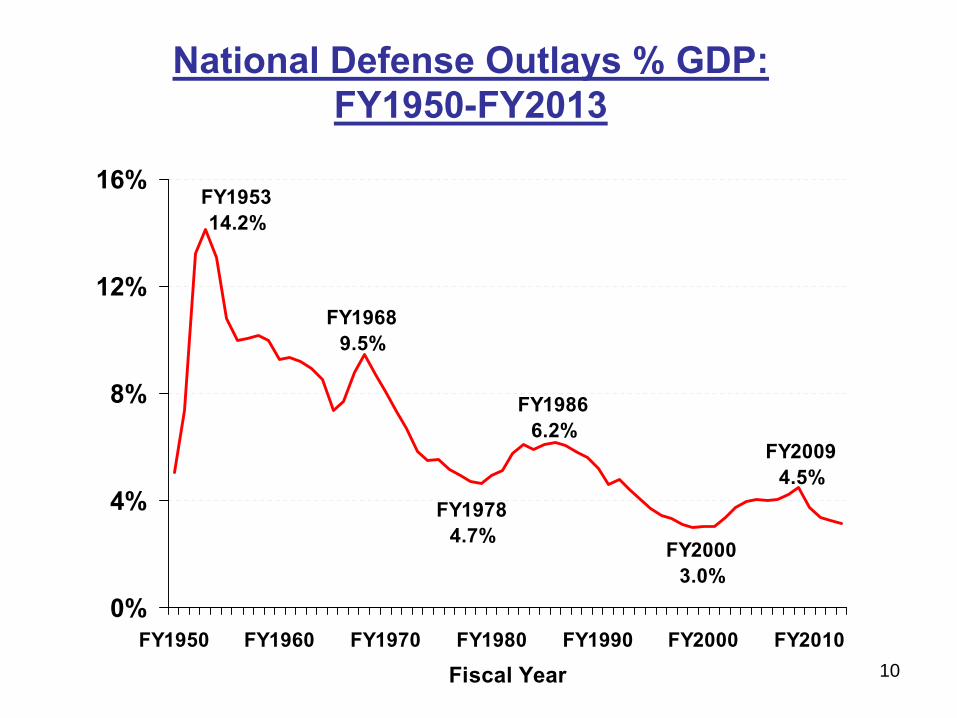
National Defense Outlays % GDP: FY1950-FY2013
0%
4%
8%
12%
16%
FY1950 FY1960 FY1970 FY1980 FY1990 FY2000 FY2010
Fiscal Year
FY195314.2%
FY19689.5%
FY19866.2%
FY20003.0%
FY19784.7%
FY20094.5%
11
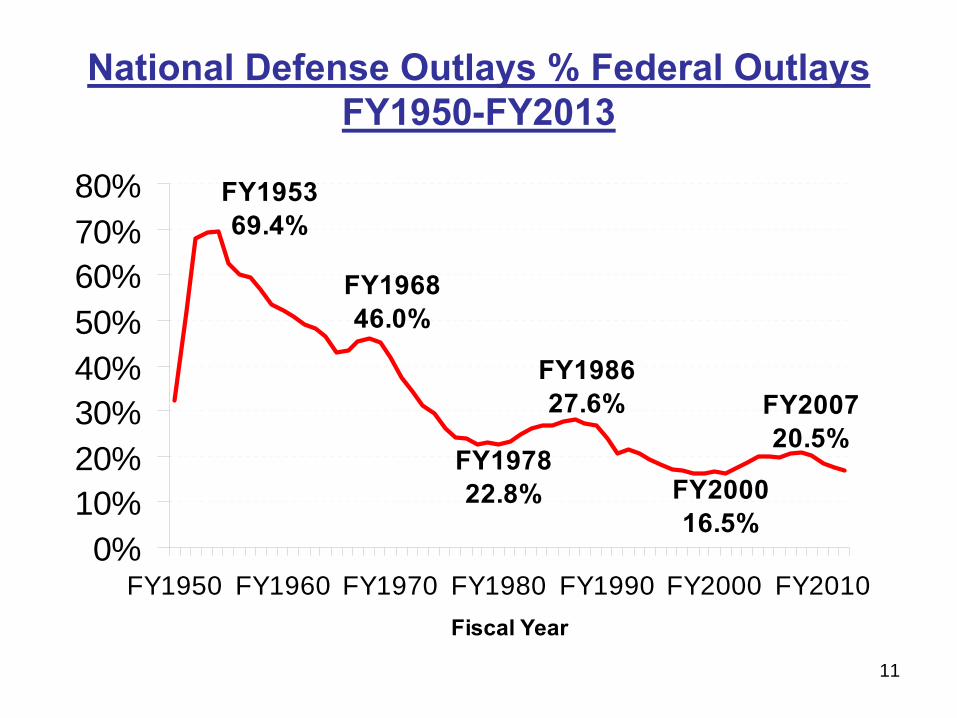
National Defense Outlays % Federal Outlays FY1950-FY2013
FY195369.4%
FY200720.5%
FY200016.5%
FY196846.0%
FY197822.8%
FY198627.6%
0%10%20%30%40%50%60%70%80%
FY1950 FY1960 FY1970 FY1980 FY1990 FY2000 FY2010Fiscal Year

12
Federal Outlays by Category as % GDP FY1962-FY2012
0%
5%
10%
15%
20%
FY1962 FY1972 FY1982 FY1992 FY2002 FY2012Fiscal Year
% G
DP Mandatory
Net Interest
Non-DefenseDiscretionary
Defense Discretionary
13
Long-Term Budget Challenges• Top line for “base” budget flattens out• Funding for “modernization” squeezed by
– Increased cost of personnel– Continued steady growth of operations– Cost growth in major weapons program
• Issue for Congress – “affordability”– Steady state cost of adding 92K ground forces– Air Force -- $20 billion annual acquisition shortfall– Navy – 313 ship goal
14
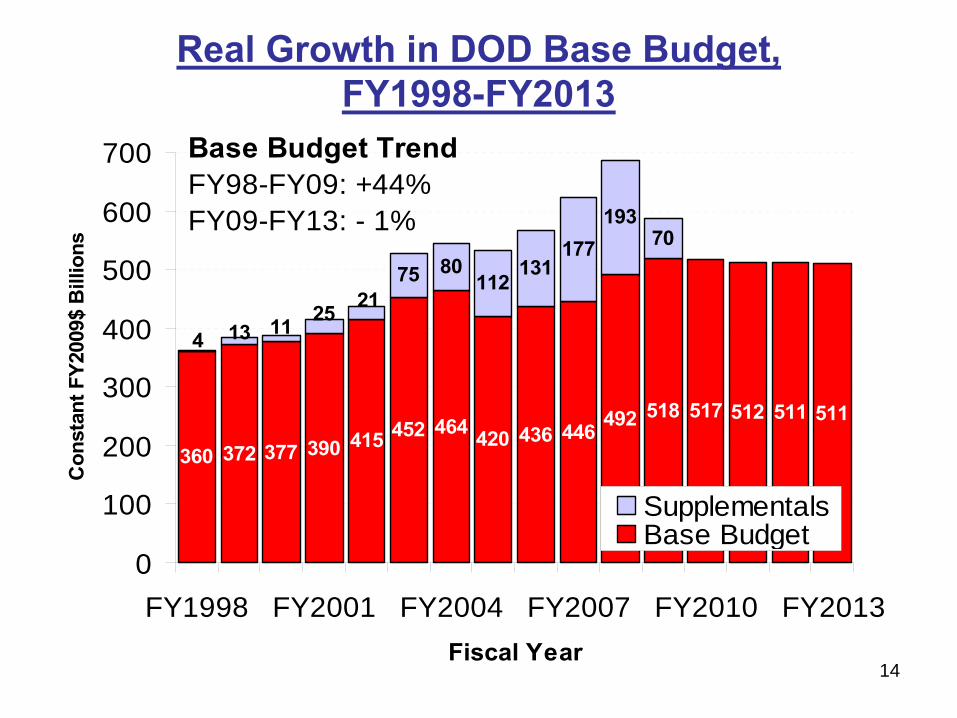
360 372 377 390 415 452 464 420 436 446 492 518 517 512 511 511
75 80112
131177
19370
4 13 11 25 21
0
100
200
300
400
500
600
700
FY1998 FY2001 FY2004 FY2007 FY2010 FY2013Fiscal Year
Con
stan
t FY2
009$
Bill
ions
SupplementalsBase Budget
Base Budget TrendFY98-FY09: +44%FY09-FY13: - 1%
Real Growth in DOD Base Budget, FY1998-FY2013
15
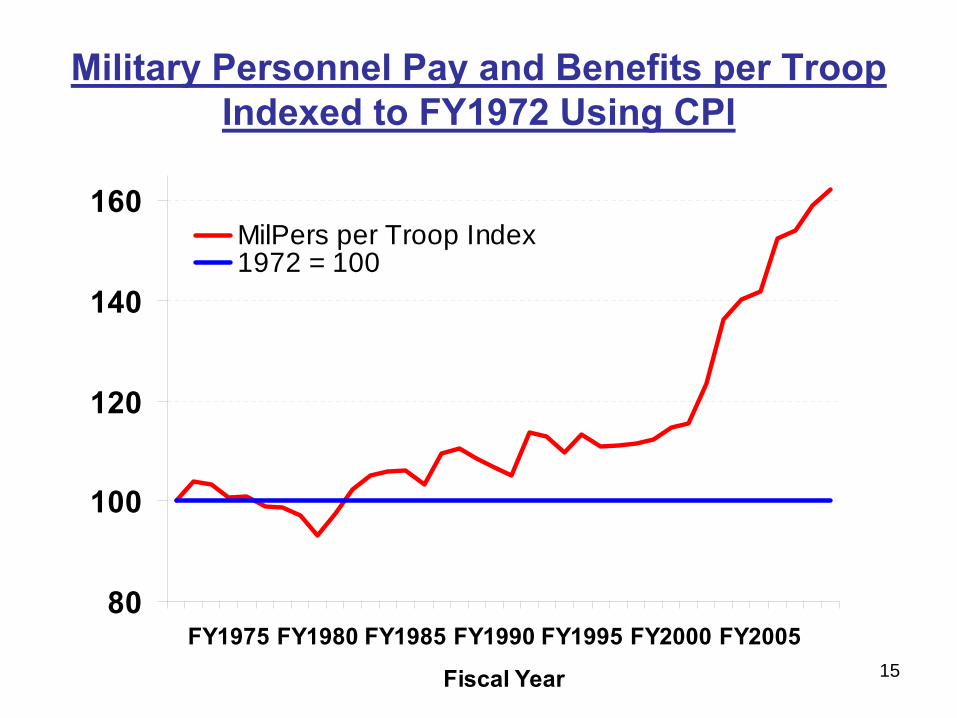
Military Personnel Pay and Benefits per Troop Indexed to FY1972 Using CPI
80
100
120
140
160
FY1975 FY1980 FY1985 FY1990 FY1995 FY2000 FY2005
Fiscal Year
MilPers per Troop Index1972 = 100
16
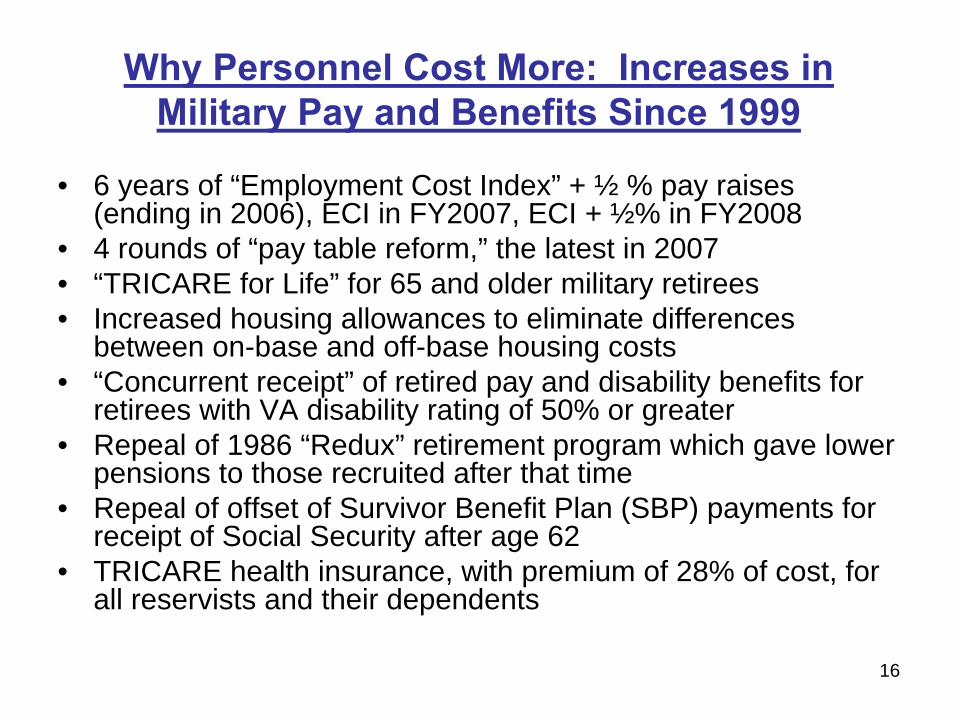
Why Personnel Cost More: Increases in Military Pay and Benefits Since 1999
• 6 years of “Employment Cost Index” + ½ % pay raises (ending in 2006), ECI in FY2007, ECI + ½% in FY2008
• 4 rounds of “pay table reform,” the latest in 2007• “TRICARE for Life” for 65 and older military retirees• Increased housing allowances to eliminate differences
between on-base and off-base housing costs• “Concurrent receipt” of retired pay and disability benefits for
retirees with VA disability rating of 50% or greater• Repeal of 1986 “Redux” retirement program which gave lower
pensions to those recruited after that time• Repeal of offset of Survivor Benefit Plan (SBP) payments for
receipt of Social Security after age 62• TRICARE health insurance, with premium of 28% of cost, for
all reservists and their dependents
17
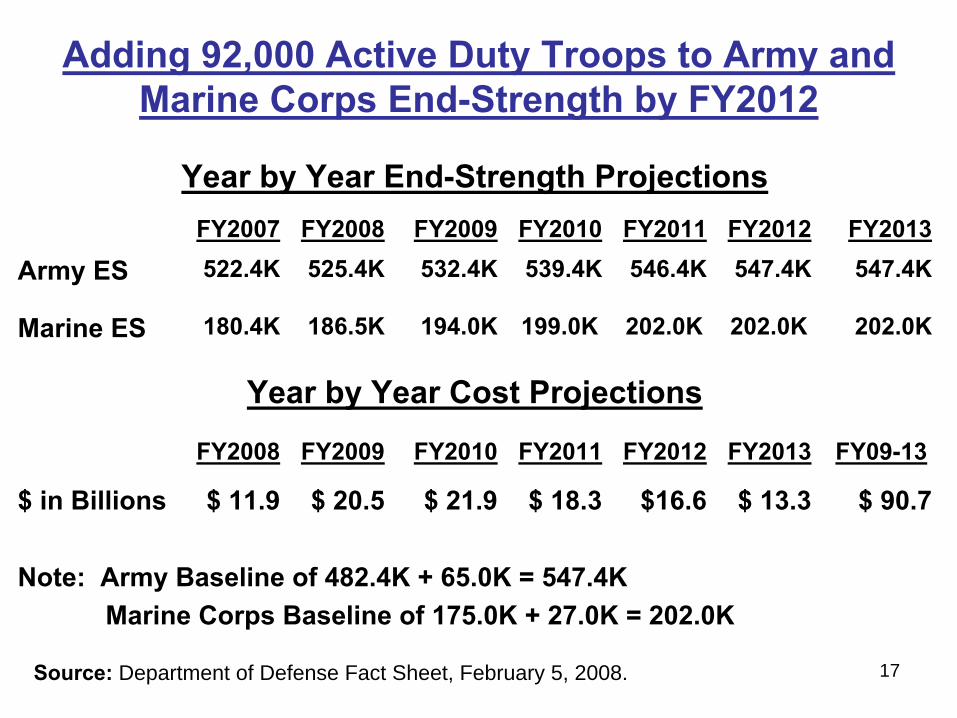
Adding 92,000 Active Duty Troops to Army and Marine Corps End-Strength by FY2012
Year by Year End-Strength ProjectionsFY2007 FY2008 FY2009 FY2010 FY2011 FY2012 FY2013
Army ES 522.4K 525.4K 532.4K 539.4K 546.4K 547.4K 547.4K
Marine ES 180.4K 186.5K 194.0K 199.0K 202.0K 202.0K 202.0K
Year by Year Cost Projections
FY2008 FY2009 FY2010 FY2011 FY2012 FY2013 FY09-13
$ in Billions $ 11.9 $ 20.5 $ 21.9 $ 18.3 $16.6 $ 13.3 $ 90.7
Note: Army Baseline of 482.4K + 65.0K = 547.4KMarine Corps Baseline of 175.0K + 27.0K = 202.0K
Source: Department of Defense Fact Sheet, February 5, 2008.

18
Operating Costs Grow: Total Operation & Maintenance $ per Troop: FY1955-FY2013
0
20,000
40,000
60,000
80,000
100,000
120,000
1955 1965 1975 1985 1995 2005Fiscal Year
Con
stan
t FY2
009
$
O&M Per TroopTrend +2.5% Per Year

19
Why O&M Costs Continue to Climb
• Civilian personnel pay and benefits – most civilians paid in O&M
• Health care cost growth – major issue for DOD• Quality of life/environmental cleanup and
compliance, etc• Costs of recruitment and training• Costs of operating and maintaining modern
weapons
20
Costs of Recapitalization/ Modernization Climb
• Common view: Unit cost of equipment dramatically higher than in earlier generations – e.g., F-16 vs F-35 (low end)– General evidence from industry briefings– Further research needed
• Add lack of effective cost controls– GAO findings– Industry claims due to instability, GAO argues due to
acceptance of excessive risk

21
Recapitalization Rates: 1985 vs. 2008
1985 2008 ∆Tactical Fighters 338 56 -282
Bombers 34 0 - 34
Other Fixed Wing 211 153 -58
Rotary Wing 354 373 +19
Missiles 87,113 13,471 - 73,642
Tracked Combat Vehicles 2,414 1,258 -1,156
Tactical Vehicles 56,551 32,276 - 24,275
Satellites (Unclassified) 10 1 -9
Ships 23 7 -16Source:
Adapted from Boeing Corporation, January 2008
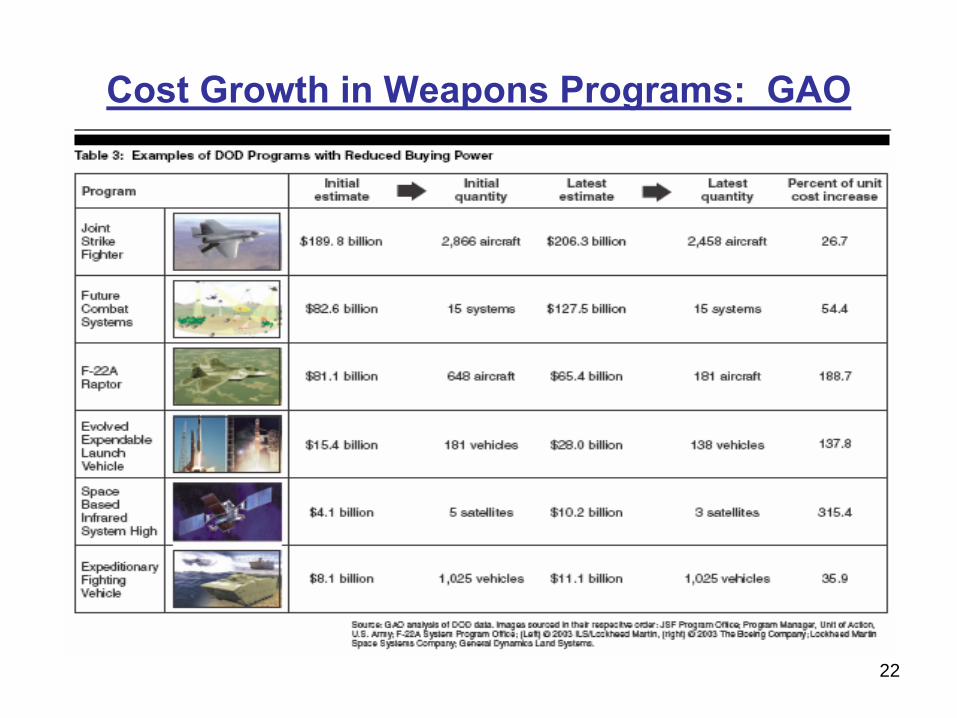
22
Cost Growth in Weapons Programs: GAO
23
Why Do Weapons Costs Climb?
• Pressures to “transform”– Effort to exploit rapidly advancing technology– Result – pursuit of immature technologies
• Requirements creep – due, in part, to– Smaller numbers– Plus uncertain strategic requirements
• Tight budgets increase incentives to underestimate costs – “buying in”
24
Current Defense Issues
• FY2008 Supplemental: $103 billion pending– Army O&M runs out by June
• FY2009 Supplemental– $70 billion “placeholder” – understates deficit– Full-year estimate expected in Spring
• Army and Marine Corps End-Strength– Recruit quality an issue
25
Current Defense Issues (cont.)
• F-22 – $500 million planned for line shutdown deleted from FY09 request– Will request 4 aircraft in FY09 supp– Lockheed says not enough to avoid shutdown
• C-17 – also no $ for line shutdown• Cost growth issues
– Littoral Combat Ship – not ready– TSAT (Comm Satellite) delay
26
Current Defense Issues (cont.)
• Commission on National Guard and Reserve– Units not fully prepared or equipped for
homeland defense– Nor fully equipped for operational reserve role
• Global Partnership– Money not large but– DOD role remains matter of debate
FY2009 Defense Budget: Weapons Acquisition
Ronald O’Rourke(202 707-7610)
Specialist in Naval AffairsForeign Affairs, Defense, and Trade Division
Congressional Research Service
28
Ground Forces• MRAP
– JROC approved 15,374; Commanders: fewer• Expeditionary Fighting Vehicle (EFV)
– Development problems, cost growth– Armor inserts; V hull– DAB review early 2008 – additional
prototypes?• Future Combat System (FCS)
– Technology Spin Out 1 this year• Contact: Andrew Feickert, x7-7673
29
Airpower• F-22
– 183 (OSD) vs. 381 (USAF)– Keeping production line open– F-15 structural problems
• F-35 Joint Strike Fighter (JSF)– Second engine?– Boeing proposal to skip Navy carrier version
• Long Range Strike– Meeting 2018 goal for fielding new plane
• VH-71 Presidential helicopter– Development problems; program restructuring
• Contact: Anthony Murch, x7-0432
30
Airpower (continued)• KC-X competition
– Closely watched; award in late-Feb/Mar• C-17 acquisition
– No FY08 funds requested for either new acquisition or production line shutdown
• C-5 modernization– Cost and cost effectiveness of Reliability
Enhancement and Re-Engining Program• Contact: William Knight, x7-6427
31
Naval Forces• Overall rate of Navy shipbuilding
– FY09-FY13 reductions; affordability of plan• Littoral Combat Ship (LCS)
– Cost growth, schedule delays, restructuring– Commonality with Coast Guard hulls
• Amphibious ships– Force-level goal– 10th LPD-17
• CG(X) cruiser– Nuclear power?
• Virginia-class submarine– Acceleration to 2 per year in FY11, or earlier?
• Contact: Ronald O’Rourke, x7-7610
32
Ballistic Missile Defense• $10.9 billion requested for FY09
– Total above includes $400M in MilCon and BRAC– $9.4B for Missile Defense Agency (MDA)
• European Ground-Based Defense (GMD) element– Debate over proposal last year– Congress approved $225 million for FY08 for surveys
and analyses, but cut $85 million for site construction pending resolution of several congressional concerns
– DOD has requested $720 million for FY09• Contact: Steve Hildreth, x7-7635
33
Strategic nuclear forces
• (Former) conventional Trident missile modification program– Funding denied last year– No longer unique program – merged into Prompt
Global Strike technology development program• New Nuclear Posture Review
– Set to begin early ’09, with next Administration• Next-generation SSBN
– Initial design work accelerated; to begin soon• Contact: Amy Woolf, x7-2379
34
Nuclear Weapons
• Reliable Replacement Warhead (RRW)– Debate over its necessity– Congress denied FY08 development funding– DOE has requested $10 million for FY09
• Contact: Jonathan Medalia, x7-7632
FY2009 Defense Budget: Manpower & Personnel Issues
Lawrence Kapp(202 707-7609)
Specialist in Manpower PolicyForeign Affairs, Defense, and Trade Division
Congressional Research Service
MILITARY MANPOWER AND PERSONNEL ISSUES IN 2008
• Manning Army• Changing role of National Guard and Reserve• Implementation of Wounded Warrior legislation
37
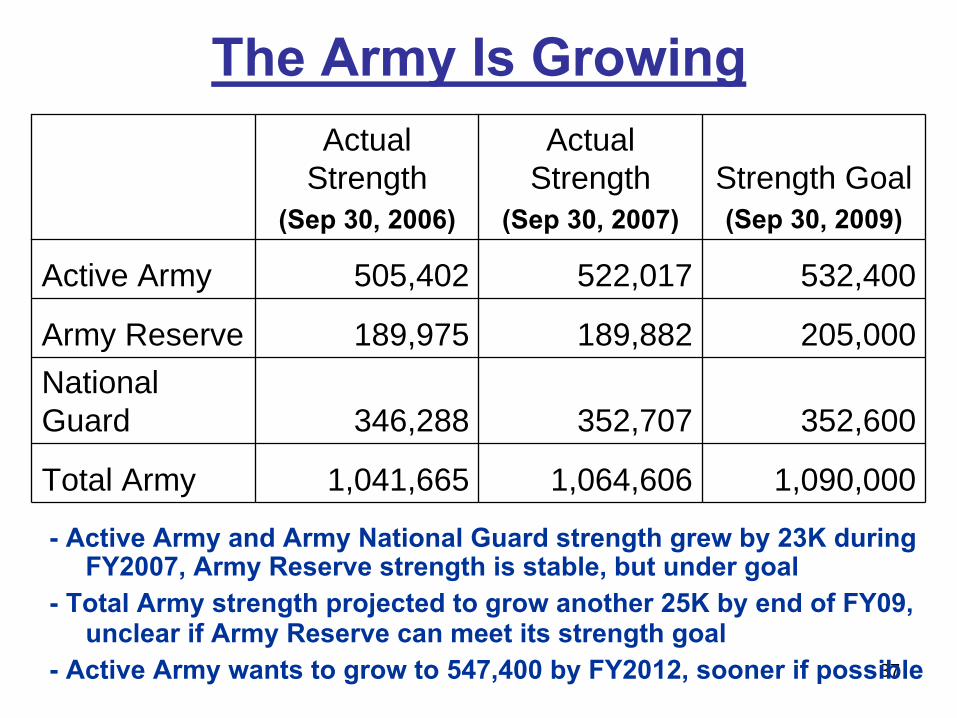
The Army Is GrowingActual
Strength(Sep 30, 2006)
Actual Strength
(Sep 30, 2007)Strength Goal(Sep 30, 2009)
Active Army 505,402 522,017 532,400
Army Reserve 189,975 189,882 205,000National Guard 346,288 352,707 352,600
Total Army 1,041,665 1,064,606 1,090,000
-
Active Army and Army National Guard strength grew by 23K during
FY2007, Army Reserve strength is stable, but under goal
-
Total Army strength projected to grow another 25K by end of FY09, unclear if Army Reserve can meet its strength goal
-
Active Army wants to grow to 547,400 by FY2012, sooner if possible
38
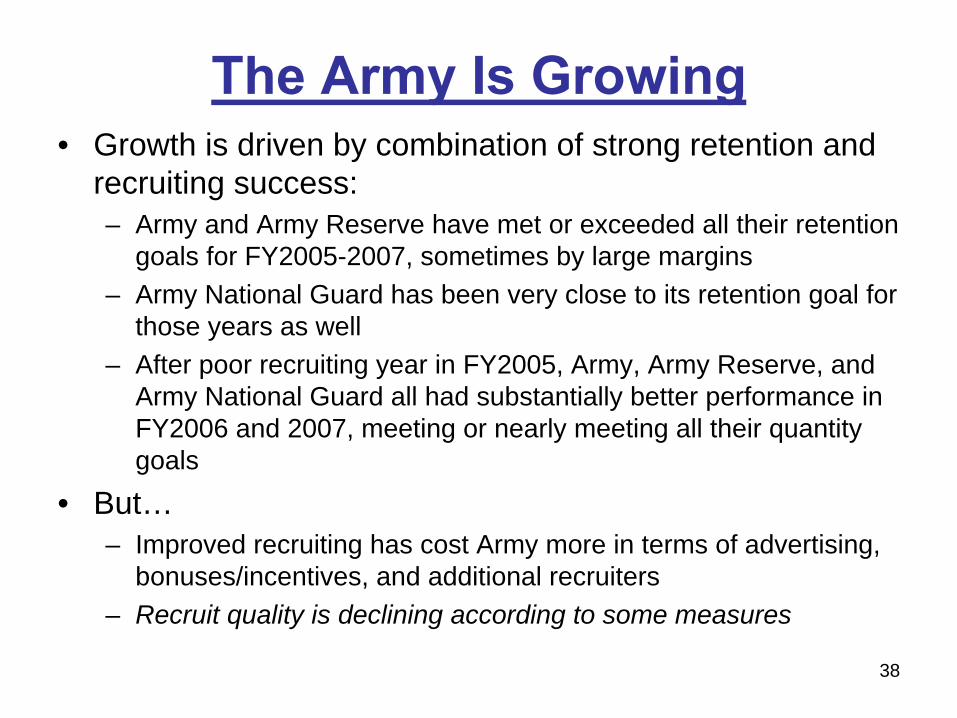
The Army Is Growing• Growth is driven by combination of strong retention and
recruiting success:– Army and Army Reserve have met or exceeded all their retention
goals for FY2005-2007, sometimes by large margins– Army National Guard has been very close to its retention goal for
those years as well– After poor recruiting year in FY2005, Army, Army Reserve, and
Army National Guard all had substantially better performance in FY2006 and 2007, meeting or nearly meeting all their quantity goals
• But…– Improved recruiting has cost Army more in terms of advertising,
bonuses/incentives, and additional recruiters– Recruit quality is declining according to some measures
39
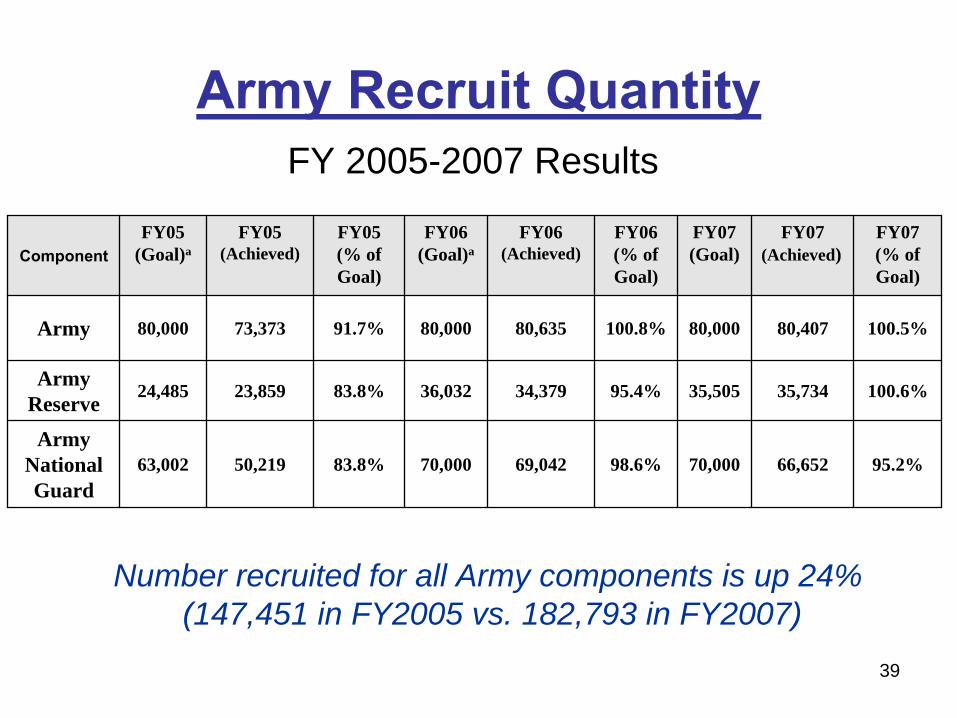
Army Recruit QuantityFY 2005-2007 Results
Number recruited for all Army components is up 24% (147,451 in FY2005 vs. 182,793 in FY2007)
ComponentFY05
(Goal)aFY05
(Achieved)FY05(% of Goal)
FY06(Goal)a
FY06(Achieved)
FY06(% of Goal)
FY07(Goal)
FY07(Achieved)
FY07(% of Goal)
Army 80,000 73,373 91.7% 80,000 80,635 100.8% 80,000 80,407 100.5%
Army Reserve 24,485 23,859 83.8% 36,032 34,379 95.4% 35,505 35,734 100.6%
Army National Guard
63,002 50,219 83.8% 70,000 69,042 98.6% 70,000 66,652 95.2%
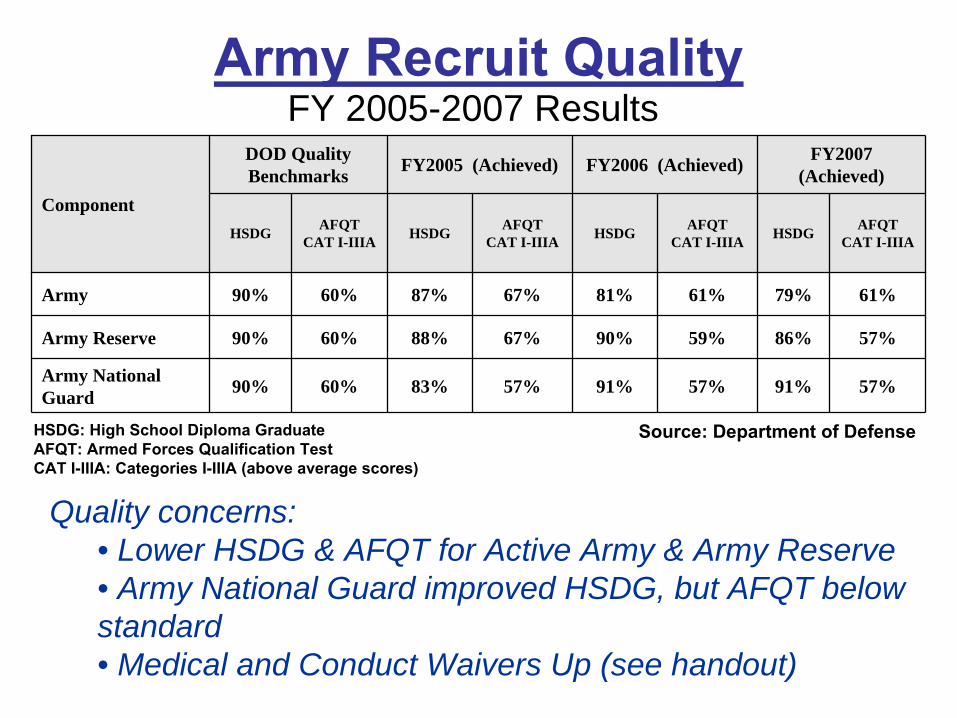
Army Recruit QualityFY 2005-2007 Results
Quality concerns:• Lower HSDG & AFQT for Active Army & Army Reserve• Army National Guard improved HSDG, but AFQT below standard• Medical and Conduct Waivers Up (see handout)
Component
DOD Quality Benchmarks FY2005 (Achieved) FY2006 (Achieved) FY2007
(Achieved)
HSDG AFQTCAT I-IIIA HSDG AFQT
CAT I-IIIA HSDG AFQTCAT I-IIIA HSDG AFQT
CAT I-IIIA
Army 90% 60% 87% 67% 81% 61% 79% 61%
Army Reserve 90% 60% 88% 67% 90% 59% 86% 57%
Army National Guard 90% 60% 83% 57% 91% 57% 91% 57%
HSDG: High School Diploma GraduateAFQT: Armed Forces Qualification TestCAT I-IIIA: Categories I-IIIA (above average scores)
Source: Department of Defense
41
Recruiting Challenges Perceived Causes of Army Recruiting Difficulties
• War – over six years in Afghanistan, nearly five in Iraq• Army is growing – needs to recruit more people than it
did a few years ago• About ¾ of target population for enlistment (males aged
17-24) do not meet military standards for entry – physical, intellectual, moral, educational, dependency
• Unemployment is low – plenty of alternatives to military service
• High proportion of youth (about 2/3) going on to college• Declining “propensity to serve” among youth• “Influencers” – parents, teachers, coaches -- less willing
to recommend military service
42
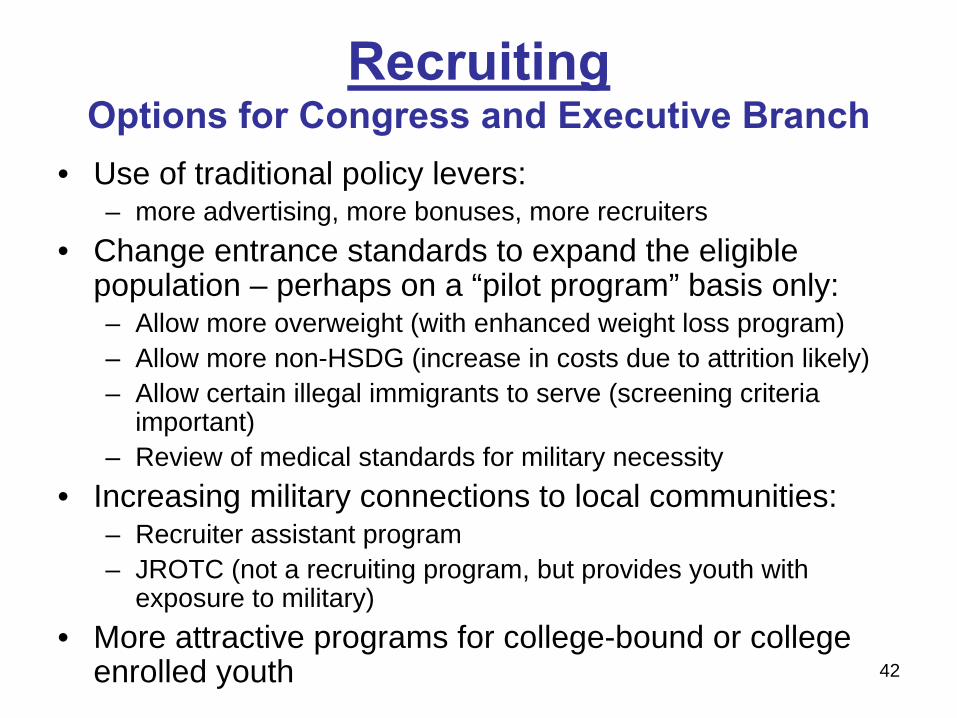
Recruiting Options for Congress and Executive Branch
• Use of traditional policy levers: – more advertising, more bonuses, more recruiters
• Change entrance standards to expand the eligible population – perhaps on a “pilot program” basis only:– Allow more overweight (with enhanced weight loss program)– Allow more non-HSDG (increase in costs due to attrition likely)– Allow certain illegal immigrants to serve (screening criteria
important)– Review of medical standards for military necessity
• Increasing military connections to local communities:– Recruiter assistant program– JROTC (not a recruiting program, but provides youth with
exposure to military)• More attractive programs for college-bound or college
enrolled youth
43
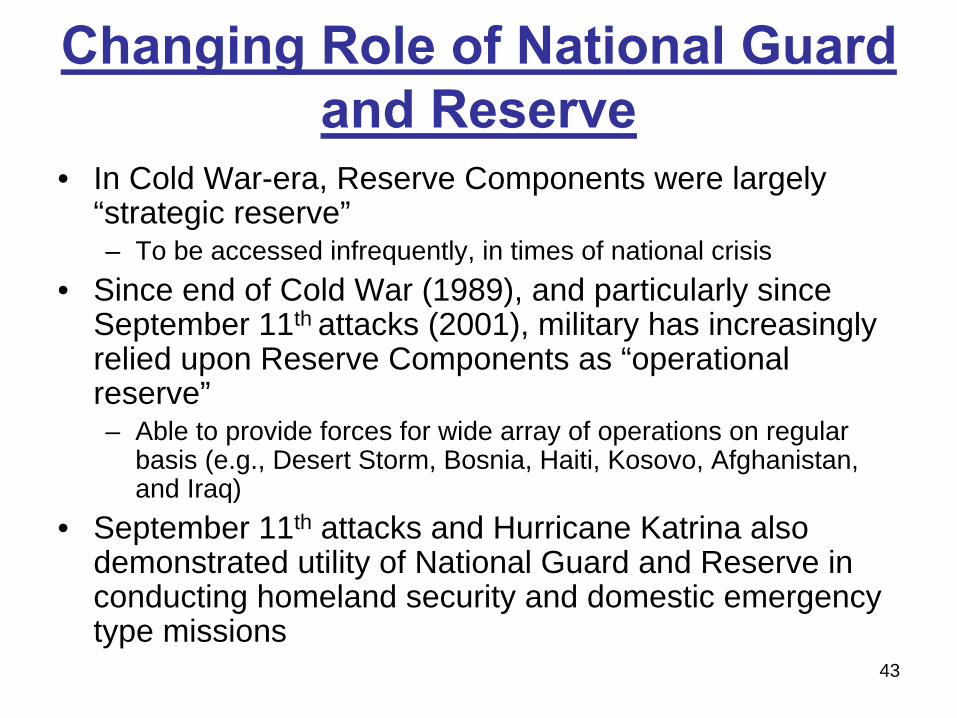
Changing Role of National Guard and Reserve
• In Cold War-era, Reserve Components were largely “strategic reserve”– To be accessed infrequently, in times of national crisis
• Since end of Cold War (1989), and particularly since September 11th attacks (2001), military has increasingly relied upon Reserve Components as “operational reserve”– Able to provide forces for wide array of operations on regular
basis (e.g., Desert Storm, Bosnia, Haiti, Kosovo, Afghanistan, and Iraq)
• September 11th attacks and Hurricane Katrina also demonstrated utility of National Guard and Reserve in conducting homeland security and domestic emergency type missions
44
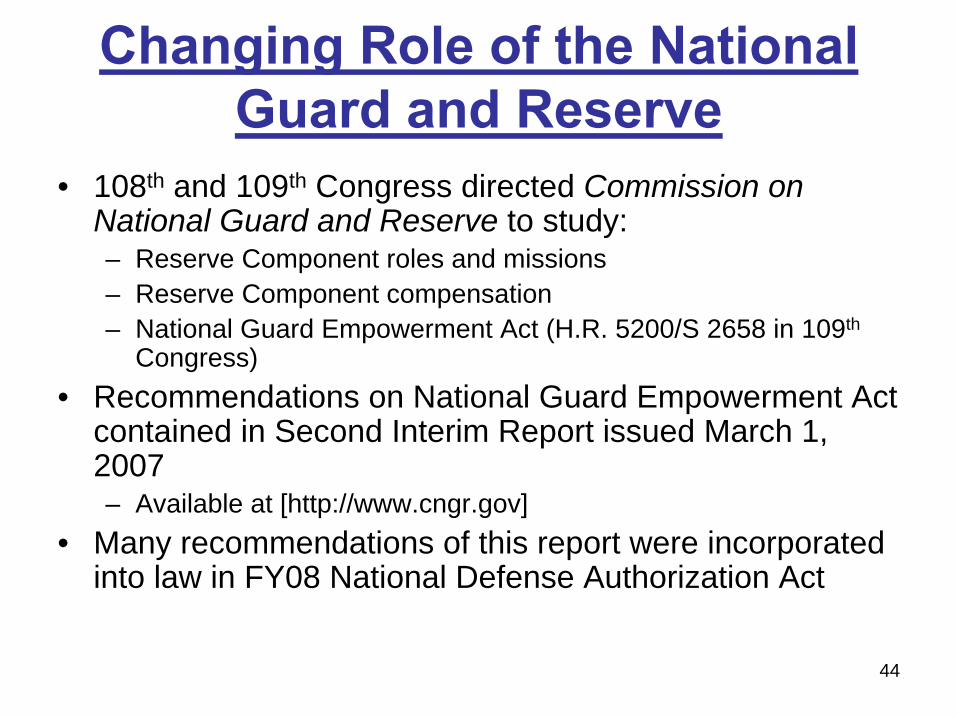
Changing Role of the National Guard and Reserve
• 108th and 109th Congress directed Commission on National Guard and Reserve to study:– Reserve Component roles and missions– Reserve Component compensation– National Guard Empowerment Act (H.R. 5200/S 2658 in 109th
Congress)• Recommendations on National Guard Empowerment Act
contained in Second Interim Report issued March 1, 2007– Available at [http://www.cngr.gov]
• Many recommendations of this report were incorporated into law in FY08 National Defense Authorization Act
45
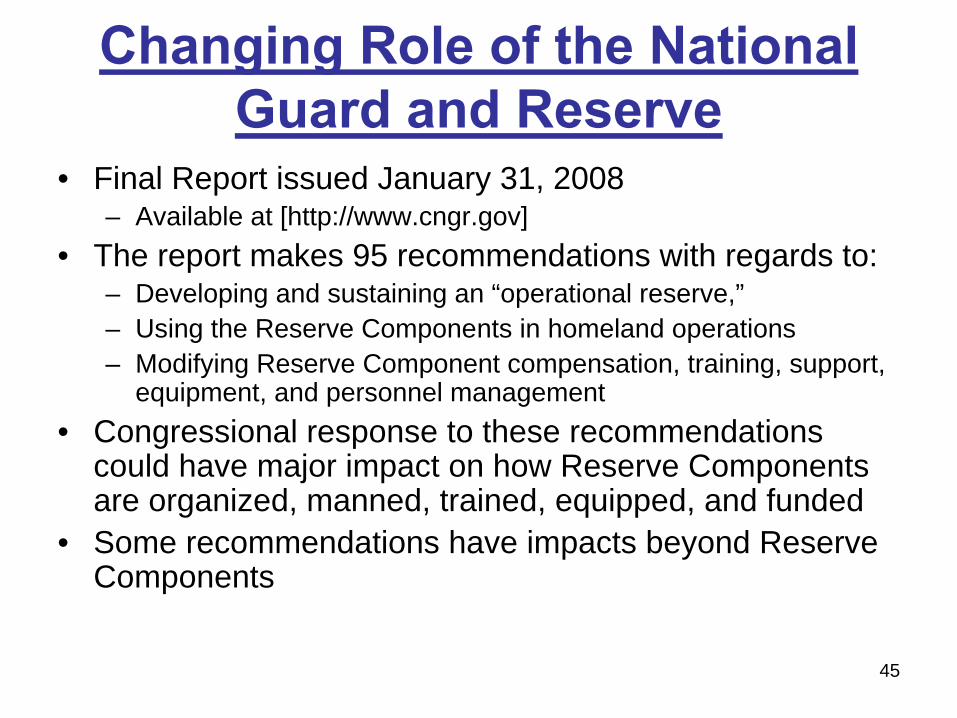
Changing Role of the National Guard and Reserve
• Final Report issued January 31, 2008– Available at [http://www.cngr.gov]
• The report makes 95 recommendations with regards to: – Developing and sustaining an “operational reserve,”– Using the Reserve Components in homeland operations– Modifying Reserve Component compensation, training, support,
equipment, and personnel management• Congressional response to these recommendations
could have major impact on how Reserve Components are organized, manned, trained, equipped, and funded
• Some recommendations have impacts beyond Reserve Components
46
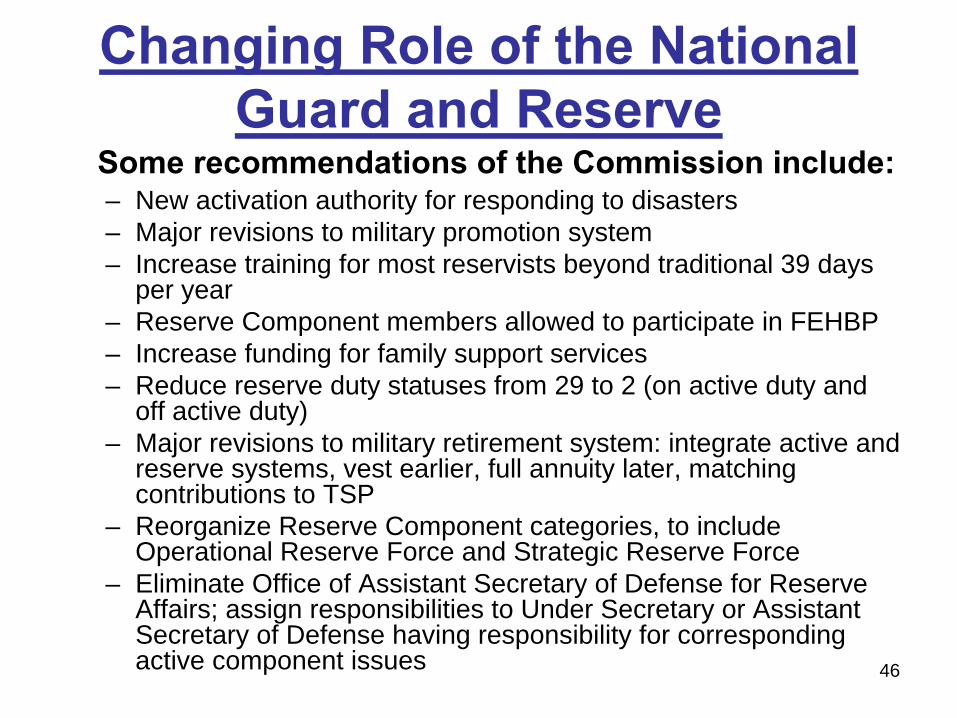
Changing Role of the National Guard and Reserve
– New activation authority for responding to disasters– Major revisions to military promotion system– Increase training for most reservists beyond traditional 39 days
per year– Reserve Component members allowed to participate in FEHBP– Increase funding for family support services– Reduce reserve duty statuses from 29 to 2 (on active duty and
off active duty)– Major revisions to military retirement system: integrate active and
reserve systems, vest earlier, full annuity later, matching contributions to TSP
– Reorganize Reserve Component categories, to include Operational Reserve Force and Strategic Reserve Force
– Eliminate Office of Assistant Secretary of Defense for Reserve Affairs; assign responsibilities to Under Secretary or Assistant Secretary of Defense having responsibility for corresponding active component issues
Some recommendations of the Commission include:
47
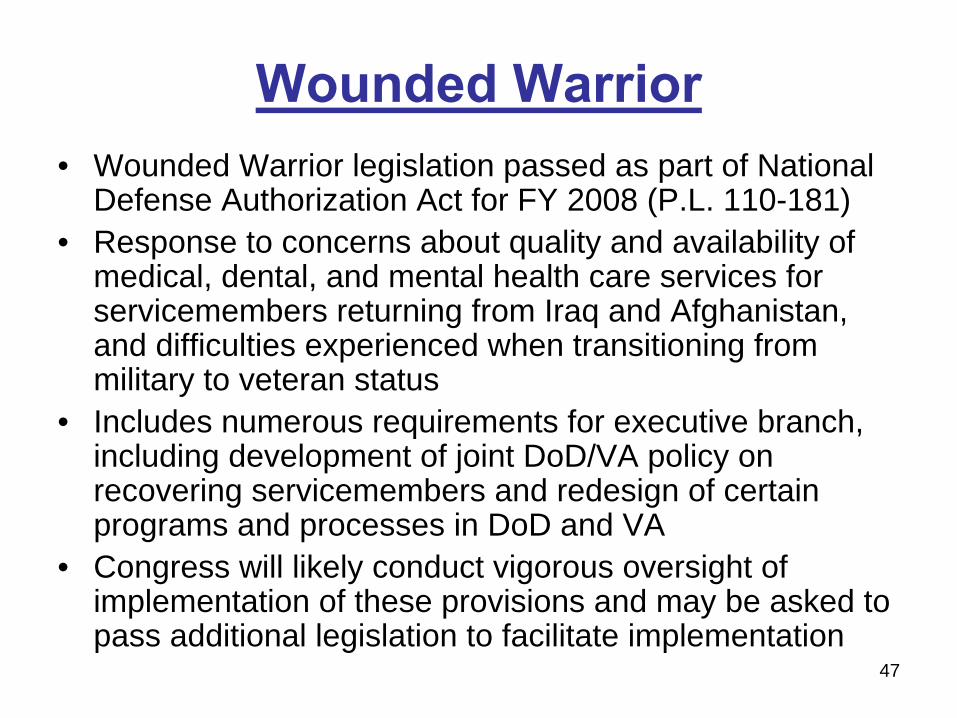
Wounded Warrior• Wounded Warrior legislation passed as part of National
Defense Authorization Act for FY 2008 (P.L. 110-181)• Response to concerns about quality and availability of
medical, dental, and mental health care services for servicemembers returning from Iraq and Afghanistan, and difficulties experienced when transitioning from military to veteran status
• Includes numerous requirements for executive branch, including development of joint DoD/VA policy on recovering servicemembers and redesign of certain programs and processes in DoD and VA
• Congress will likely conduct vigorous oversight of implementation of these provisions and may be asked to pass additional legislation to facilitate implementation
MILITARY MANPOWER AND PERSONNEL ISSUES
Backup SlidesOn Recruit Waivers
(Active Components)Data provided by Department of Defense
49
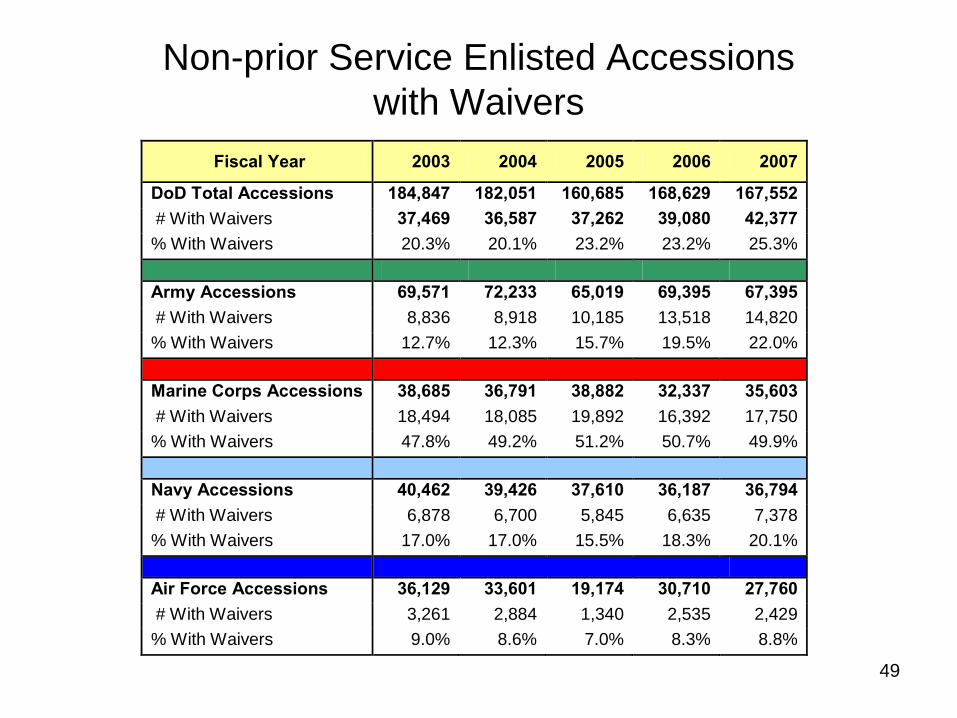
Non-prior Service Enlisted Accessions with Waivers
Fiscal Year 2003 2004 2005 2006 2007
DoD Total Accessions 184,847 182,051 160,685 168,629 167,552 # With Waivers 37,469 36,587 37,262 39,080 42,377% With Waivers 20.3% 20.1% 23.2% 23.2% 25.3% Army Accessions 69,571 72,233 65,019 69,395 67,395 # With Waivers 8,836 8,918 10,185 13,518 14,820% With Waivers 12.7% 12.3% 15.7% 19.5% 22.0% Marine Corps Accessions 38,685 36,791 38,882 32,337 35,603 # With Waivers 18,494 18,085 19,892 16,392 17,750% With Waivers 47.8% 49.2% 51.2% 50.7% 49.9% Navy Accessions 40,462 39,426 37,610 36,187 36,794 # With Waivers 6,878 6,700 5,845 6,635 7,378% With Waivers 17.0% 17.0% 15.5% 18.3% 20.1% Air Force Accessions 36,129 33,601 19,174 30,710 27,760 # With Waivers 3,261 2,884 1,340 2,535 2,429% With Waivers 9.0% 8.6% 7.0% 8.3% 8.8%
50
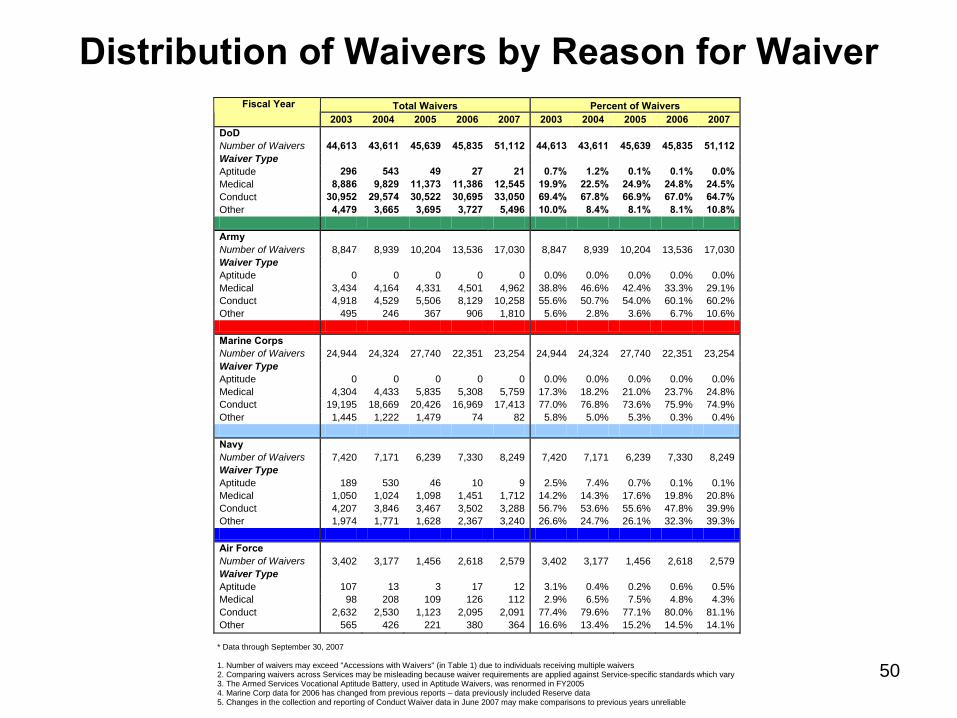
Distribution of Waivers by Reason for Waiver
Total Waivers Percent of Waivers Fiscal Year 2003 2004 2005 2006 2007 2003 2004 2005 2006 2007
DoD Number of Waivers 44,613 43,611 45,639 45,835 51,112 44,613 43,611 45,639 45,835 51,112Waiver Type Aptitude 296 543 49 27 21 0.7% 1.2% 0.1% 0.1% 0.0%Medical 8,886 9,829 11,373 11,386 12,545 19.9% 22.5% 24.9% 24.8% 24.5%Conduct 30,952 29,574 30,522 30,695 33,050 69.4% 67.8% 66.9% 67.0% 64.7%Other 4,479 3,665 3,695 3,727 5,496 10.0% 8.4% 8.1% 8.1% 10.8% Army Number of Waivers 8,847 8,939 10,204 13,536 17,030 8,847 8,939 10,204 13,536 17,030Waiver Type Aptitude 0 0 0 0 0 0.0% 0.0% 0.0% 0.0% 0.0%Medical 3,434 4,164 4,331 4,501 4,962 38.8% 46.6% 42.4% 33.3% 29.1%Conduct 4,918 4,529 5,506 8,129 10,258 55.6% 50.7% 54.0% 60.1% 60.2%Other 495 246 367 906 1,810 5.6% 2.8% 3.6% 6.7% 10.6% Marine Corps Number of Waivers 24,944 24,324 27,740 22,351 23,254 24,944 24,324 27,740 22,351 23,254Waiver Type Aptitude 0 0 0 0 0 0.0% 0.0% 0.0% 0.0% 0.0%Medical 4,304 4,433 5,835 5,308 5,759 17.3% 18.2% 21.0% 23.7% 24.8%Conduct 19,195 18,669 20,426 16,969 17,413 77.0% 76.8% 73.6% 75.9% 74.9%Other 1,445 1,222 1,479 74 82 5.8% 5.0% 5.3% 0.3% 0.4% Navy Number of Waivers 7,420 7,171 6,239 7,330 8,249 7,420 7,171 6,239 7,330 8,249Waiver Type Aptitude 189 530 46 10 9 2.5% 7.4% 0.7% 0.1% 0.1%Medical 1,050 1,024 1,098 1,451 1,712 14.2% 14.3% 17.6% 19.8% 20.8%Conduct 4,207 3,846 3,467 3,502 3,288 56.7% 53.6% 55.6% 47.8% 39.9%Other 1,974 1,771 1,628 2,367 3,240 26.6% 24.7% 26.1% 32.3% 39.3% Air Force Number of Waivers 3,402 3,177 1,456 2,618 2,579 3,402 3,177 1,456 2,618 2,579Waiver Type Aptitude 107 13 3 17 12 3.1% 0.4% 0.2% 0.6% 0.5%Medical 98 208 109 126 112 2.9% 6.5% 7.5% 4.8% 4.3%Conduct 2,632 2,530 1,123 2,095 2,091 77.4% 79.6% 77.1% 80.0% 81.1%Other 565 426 221 380 364 16.6% 13.4% 15.2% 14.5% 14.1%
* Data through September 30, 2007 1. Number of waivers may exceed "Accessions with Waivers" (in Table 1) due to individuals receiving multiple waivers 2. Comparing waivers across Services may be misleading because waiver requirements are applied against Service-specific standards which vary 3. The Armed Services Vocational Aptitude Battery, used in Aptitude Waivers, was renormed in FY2005 4. Marine Corp data for 2006 has changed from previous reports – data previously included Reserve data 5. Changes in the collection and reporting of Conduct Waiver data in June 2007 may make comparisons to previous years unreliable
51
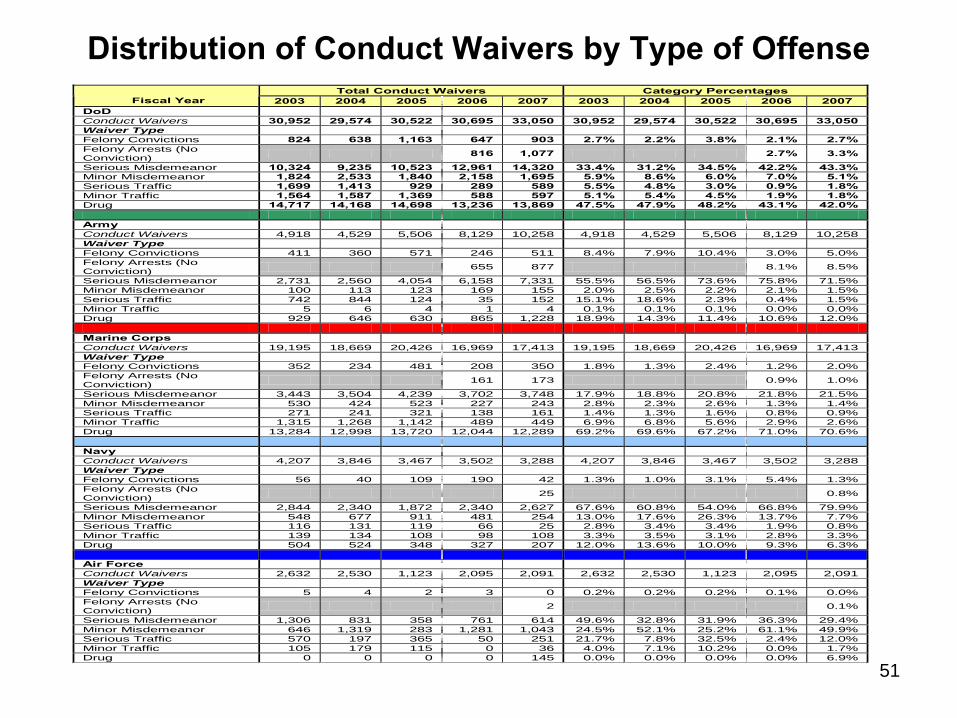
Distribution of Conduct Waivers by Type of OffenseTotal Conduct Waivers Category Percentages
Fiscal Year 2003 2004 2005 2006 2007 2003 2004 2005 2006 2007 DoD Conduct Waivers 30,952 29,574 30,522 30,695 33,050 30,952 29,574 30,522 30,695 33,050 Waiver Type Felony Convictions 824 638 1,163 647 903 2.7% 2.2% 3.8% 2.1% 2.7% Felony Arrests (No Conviction) 816 1,077 2.7% 3.3%
Serious Misdemeanor 10,324 9,235 10,523 12,961 14,320 33.4% 31.2% 34.5% 42.2% 43.3% Minor Misdemeanor 1,824 2,533 1,840 2,158 1,695 5.9% 8.6% 6.0% 7.0% 5.1% Serious Traffic 1,699 1,413 929 289 589 5.5% 4.8% 3.0% 0.9% 1.8% Minor Traffic 1,564 1,587 1,369 588 597 5.1% 5.4% 4.5% 1.9% 1.8% Drug 14,717 14,168 14,698 13,236 13,869 47.5% 47.9% 48.2% 43.1% 42.0% Army Conduct Waivers 4,918 4,529 5,506 8,129 10,258 4,918 4,529 5,506 8,129 10,258 Waiver Type Felony Convictions 411 360 571 246 511 8.4% 7.9% 10.4% 3.0% 5.0% Felony Arrests (No Conviction) 655 877 8.1% 8.5%
Serious Misdemeanor 2,731 2,560 4,054 6,158 7,331 55.5% 56.5% 73.6% 75.8% 71.5% Minor Misdemeanor 100 113 123 169 155 2.0% 2.5% 2.2% 2.1% 1.5% Serious Traffic 742 844 124 35 152 15.1% 18.6% 2.3% 0.4% 1.5% Minor Traffic 5 6 4 1 4 0.1% 0.1% 0.1% 0.0% 0.0% Drug 929 646 630 865 1,228 18.9% 14.3% 11.4% 10.6% 12.0% Marine Corps Conduct Waivers 19,195 18,669 20,426 16,969 17,413 19,195 18,669 20,426 16,969 17,413 Waiver Type Felony Convictions 352 234 481 208 350 1.8% 1.3% 2.4% 1.2% 2.0% Felony Arrests (No Conviction) 161 173 0.9% 1.0%
Serious Misdemeanor 3,443 3,504 4,239 3,702 3,748 17.9% 18.8% 20.8% 21.8% 21.5% Minor Misdemeanor 530 424 523 227 243 2.8% 2.3% 2.6% 1.3% 1.4% Serious Traffic 271 241 321 138 161 1.4% 1.3% 1.6% 0.8% 0.9% Minor Traffic 1,315 1,268 1,142 489 449 6.9% 6.8% 5.6% 2.9% 2.6% Drug 13,284 12,998 13,720 12,044 12,289 69.2% 69.6% 67.2% 71.0% 70.6% Navy Conduct Waivers 4,207 3,846 3,467 3,502 3,288 4,207 3,846 3,467 3,502 3,288 Waiver Type Felony Convictions 56 40 109 190 42 1.3% 1.0% 3.1% 5.4% 1.3% Felony Arrests (No Conviction) 25 0.8%
Serious Misdemeanor 2,844 2,340 1,872 2,340 2,627 67.6% 60.8% 54.0% 66.8% 79.9% Minor Misdemeanor 548 677 911 481 254 13.0% 17.6% 26.3% 13.7% 7.7% Serious Traffic 116 131 119 66 25 2.8% 3.4% 3.4% 1.9% 0.8% Minor Traffic 139 134 108 98 108 3.3% 3.5% 3.1% 2.8% 3.3% Drug 504 524 348 327 207 12.0% 13.6% 10.0% 9.3% 6.3% Air Force Conduct Waivers 2,632 2,530 1,123 2,095 2,091 2,632 2,530 1,123 2,095 2,091 Waiver Type Felony Convictions 5 4 2 3 0 0.2% 0.2% 0.2% 0.1% 0.0% Felony Arrests (No Conviction) 2 0.1%
Serious Misdemeanor 1,306 831 358 761 614 49.6% 32.8% 31.9% 36.3% 29.4% Minor Misdemeanor 646 1,319 283 1,281 1,043 24.5% 52.1% 25.2% 61.1% 49.9% Serious Traffic 570 197 365 50 251 21.7% 7.8% 32.5% 2.4% 12.0% Minor Traffic 105 179 115 0 36 4.0% 7.1% 10.2% 0.0% 1.7% Drug 0 0 0 0 145 0.0% 0.0% 0.0% 0.0% 6.9%