fy2012 2q financial results - topcon · fy2012 2q financial results . october 31, 2012 topcon...
TRANSCRIPT
©2012 Topcon Corporation From Reform To Enhancement
FY2012 2Q Financial Results
October 31, 2012 TOPCON CORPORATION President Norio Uchida
In this presentation, “FY2012” refers to the year ending March 31, 2013. In addition, “FY2012 2Q” refers to the period from April 1 to September 30, 2012.
©2012 Topcon Corporation From Reform To Enhancement
CONTENTS
Ⅰ
III Appendix
II
FY2012 2Q Financial Results
FY2012 2Q Financial Results
FY2012 Full Year Forecast
1
©2012 Topcon Corporation From Reform To Enhancement
FY2012 2Q Financial Results
2
©2012 Topcon Corporation From Reform To Enhancement
TOPCON TOPCON
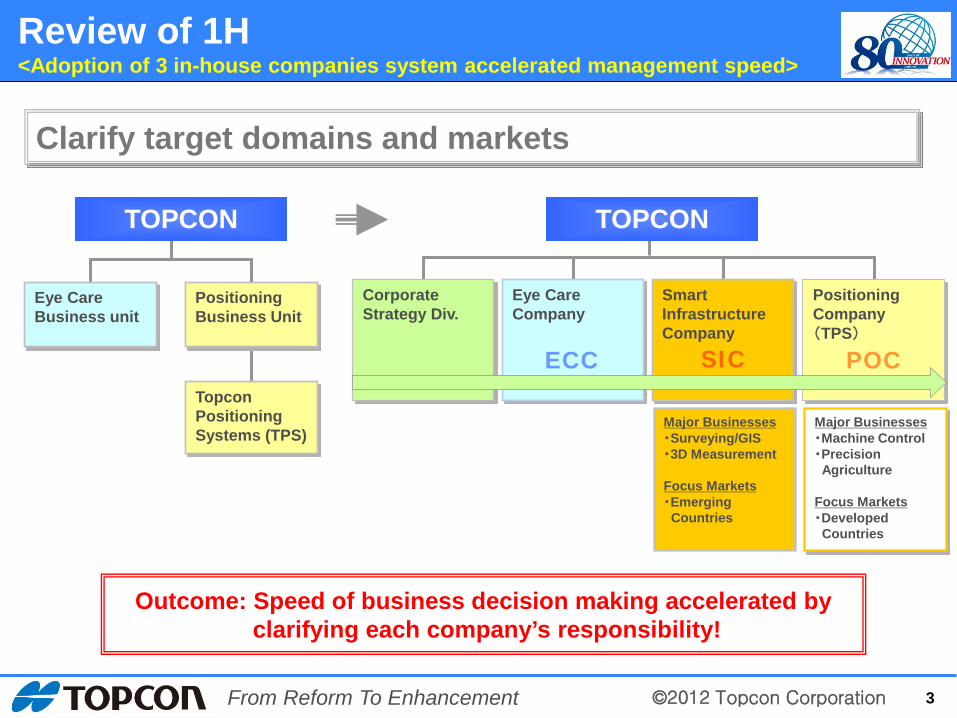
Review of 1H <Adoption of 3 in-house companies system accelerated management speed>
3
Clarify target domains and markets
Eye Care Business unit
Major Businesses ・Surveying/GIS ・3D Measurement Focus Markets ・Emerging Countries
Major Businesses ・Machine Control ・Precision Agriculture Focus Markets ・Developed Countries
Topcon Positioning Systems (TPS)
Positioning Business Unit
Eye Care Company
Smart Infrastructure Company
Positioning Company (TPS)
Corporate Strategy Div.
ECC SIC POC
Outcome: Speed of business decision making accelerated by clarifying each company’s responsibility!
©2012 Topcon Corporation From Reform To Enhancement
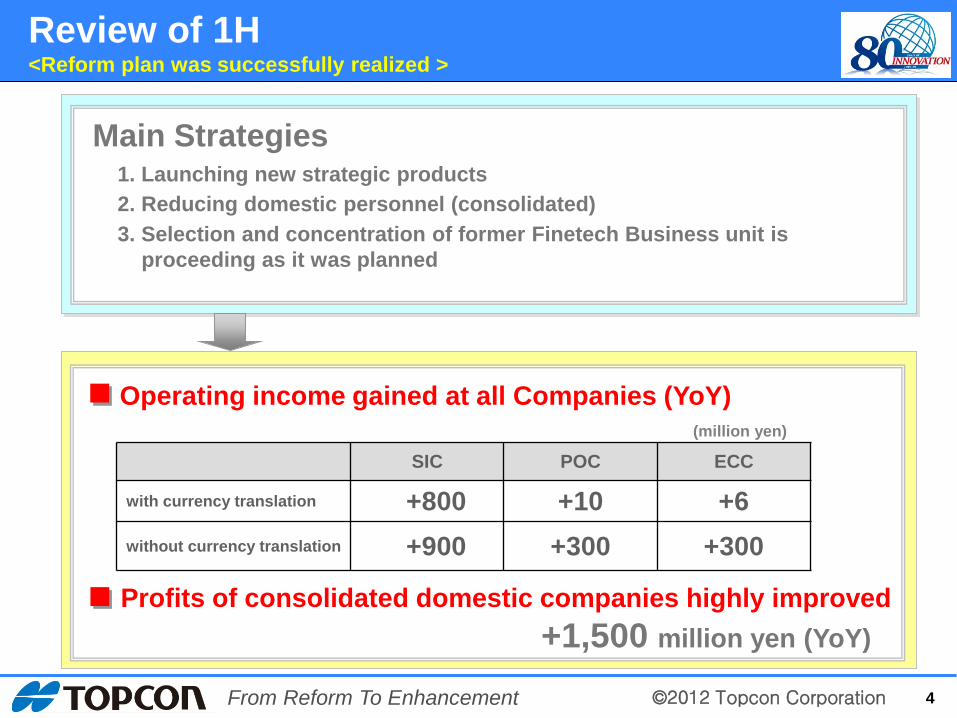
Operating income gained at all Companies (YoY)
Profits of consolidated domestic companies highly improved +1,500 million yen (YoY)
Review of 1H <Reform plan was successfully realized >
1. Launching new strategic products 2. Reducing domestic personnel (consolidated) 3. Selection and concentration of former Finetech Business unit is proceeding as it was planned
Main Strategies
4
SIC POC ECC
with currency translation +800 +10 +6 without currency translation +900 +300 +300
(million yen)
©2012 Topcon Corporation From Reform To Enhancement
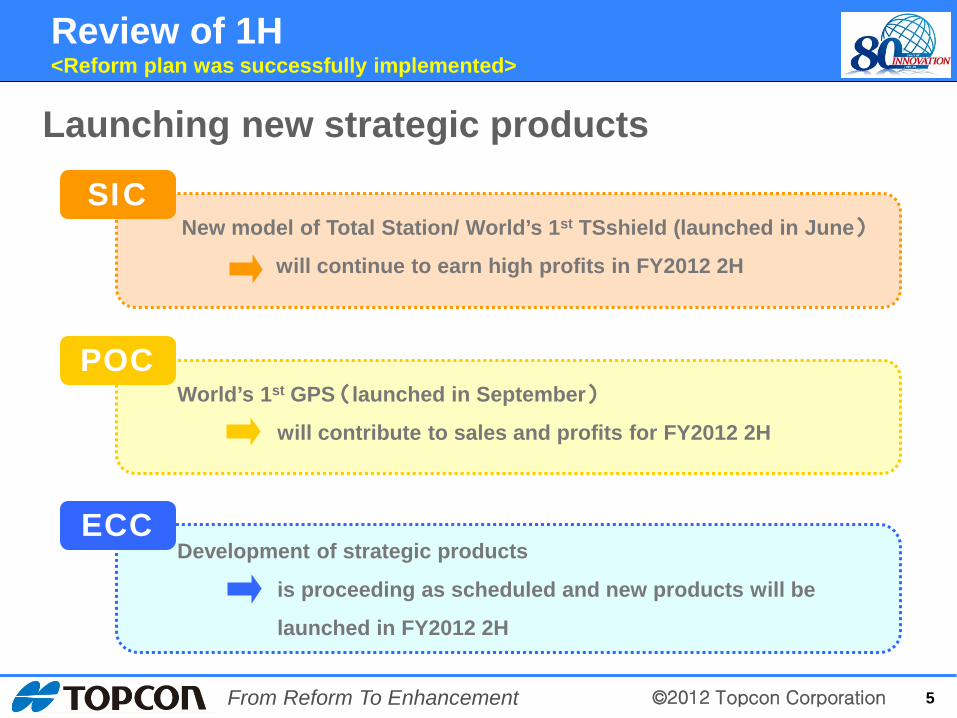
New model of Total Station/ World’s 1st TSshield (launched in June)
will continue to earn high profits in FY2012 2H
World’s 1st GPS (launched in September)
will contribute to sales and profits for FY2012 2H
Development of strategic products
is proceeding as scheduled and new products will be
launched in FY2012 2H
5
POC
ECC
SIC
Launching new strategic products
Review of 1H <Reform plan was successfully implemented>
©2012 Topcon Corporation From Reform To Enhancement
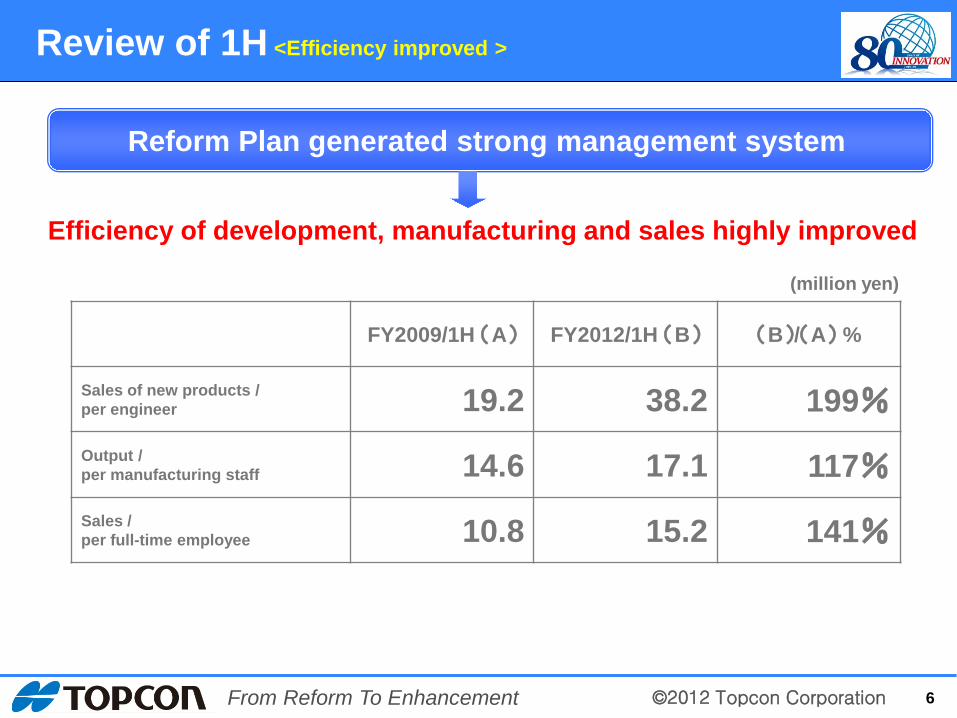
Efficiency of development, manufacturing and sales highly improved
FY2009/1H (A) FY2012/1H (B) (B)/(A) %
Sales of new products / per engineer 19.2 38.2 199% Output / per manufacturing staff 14.6 17.1 117% Sales / per full-time employee 10.8 15.2 141%
(million yen)
6
Reform Plan generated strong management system
Review of 1H <Efficiency improved >
©2012 Topcon Corporation From Reform To Enhancement
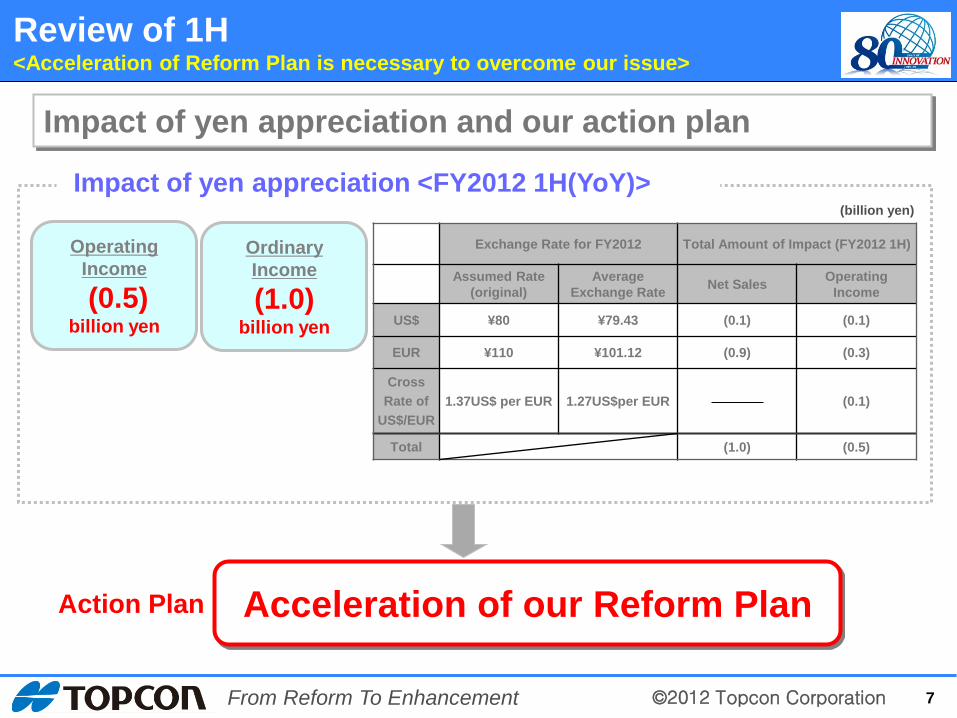
Exchange Rate for FY2012 Total Amount of Impact (FY2012 1H)
Assumed Rate (original)
Average Exchange Rate Net Sales Operating
Income
US$ ¥80 ¥79.43 (0.1) (0.1)
EUR ¥110 ¥101.12 (0.9) (0.3)
Cross Rate of
US$/EUR 1.37US$ per EUR 1.27US$per EUR (0.1)
Total (1.0) (0.5)
7
Impact of yen appreciation and our action plan
Operating Income
(0.5) billion yen
Ordinary Income
(1.0) billion yen
Acceleration of our Reform Plan Action Plan
Impact of yen appreciation <FY2012 1H(YoY)>
Review of 1H <Acceleration of Reform Plan is necessary to overcome our issue>
(billion yen)
©2012 Topcon Corporation From Reform To Enhancement
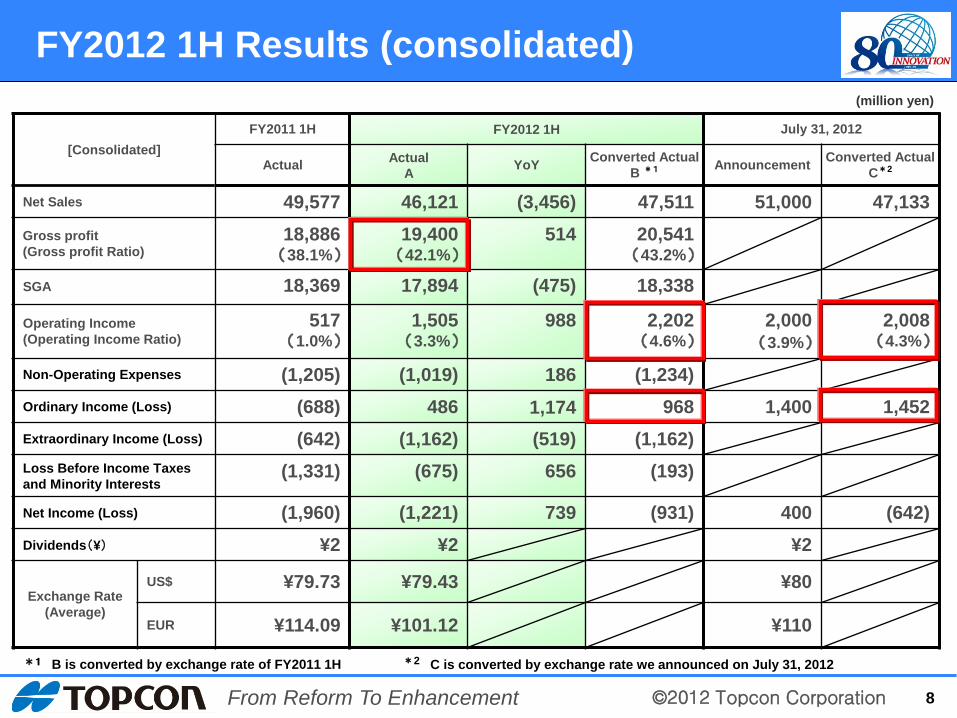
[Consolidated] FY2011 1H FY2012 1H July 31, 2012
Actual Actual A YoY Converted Actual
B *1 Announcement Converted Actual C*2
Net Sales 49,577 46,121 (3,456) 47,511 51,000 47,133 Gross profit (Gross profit Ratio)
18,886 (38.1%)
19,400 (42.1%)
514 20,541 (43.2%)
SGA 18,369 17,894 (475) 18,338
Operating Income (Operating Income Ratio)
517 (1.0%)
1,505 (3.3%)
988 2,202 (4.6%)
2,000 (3.9%)
2,008 (4.3%)
Non-Operating Expenses (1,205) (1,019) 186 (1,234) Ordinary Income (Loss) (688) 486 1,174 968 1,400 1,452 Extraordinary Income (Loss) (642) (1,162) (519) (1,162) Loss Before Income Taxes and Minority Interests
(1,331) (675) 656 (193)
Net Income (Loss) (1,960) (1,221) 739 (931) 400 (642) Dividends(¥) ¥2 ¥2 ¥2
Exchange Rate (Average)
US$ ¥79.73 ¥79.43 ¥80
EUR ¥114.09 ¥101.12 ¥110
8
(million yen)
FY2012 1H Results (consolidated)
*1 B is converted by exchange rate of FY2011 1H *2 C is converted by exchange rate we announced on July 31, 2012
©2012 Topcon Corporation From Reform To Enhancement
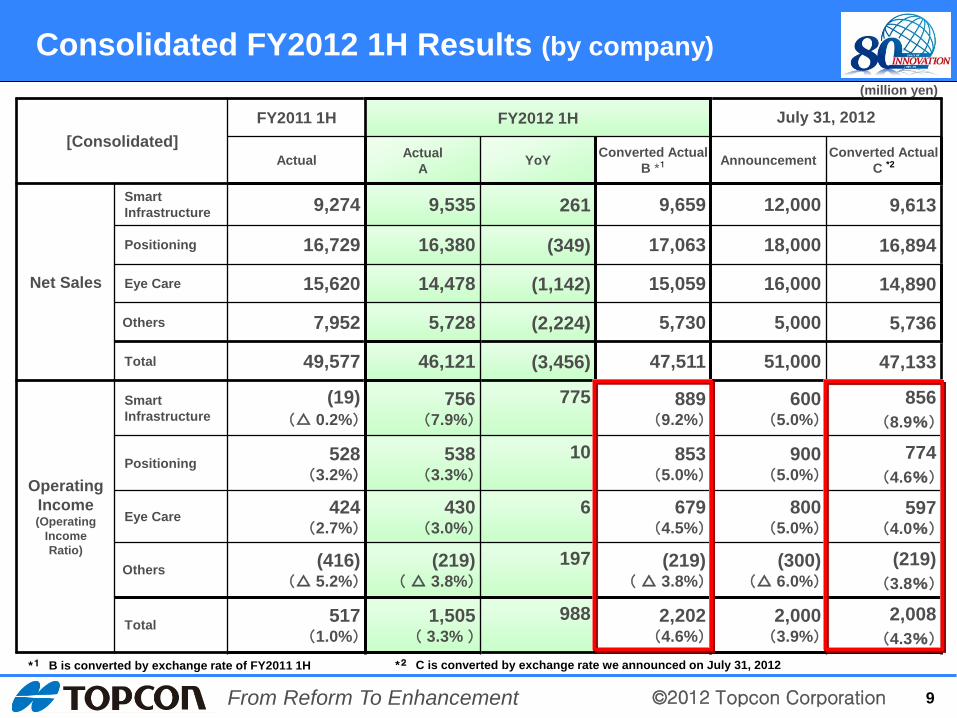
[Consolidated] FY2011 1H FY2012 1H July 31, 2012
Actual Actual A YoY Converted Actual
B *1 Announcement Converted Actual C *2
Net Sales
Smart Infrastructure 9,274 9,535 261 9,659 12,000 9,613
Positioning 16,729 16,380 (349) 17,063 18,000 16,894
Eye Care 15,620 14,478 (1,142) 15,059 16,000 14,890
Others 7,952 5,728 (2,224) 5,730 5,000 5,736
Total 49,577 46,121 (3,456) 47,511 51,000 47,133
Operating Income (Operating
Income Ratio)
Smart Infrastructure
(19) (△ 0.2%)
756 (7.9%)
775 889 (9.2%)
600 (5.0%)
856 (8.9%)
Positioning 528 (3.2%)
538 (3.3%)
10 853 (5.0%)
900 (5.0%)
774 (4.6%)
Eye Care 424 (2.7%)
430 (3.0%)
6 679 (4.5%)
800 (5.0%)
597 (4.0%)
Others (416) (△ 5.2%)
(219) ( △ 3.8%)
197 (219) ( △ 3.8%)
(300) (△ 6.0%)
(219) (3.8%)
Total 517 (1.0%)
1,505 ( 3.3% )
988 2,202 (4.6%)
2,000 (3.9%)
2,008 (4.3%)
9
(million yen)
Consolidated FY2012 1H Results (by company)
*1 B is converted by exchange rate of FY2011 1H *2 C is converted by exchange rate we announced on July 31, 2012
©2012 Topcon Corporation From Reform To Enhancement
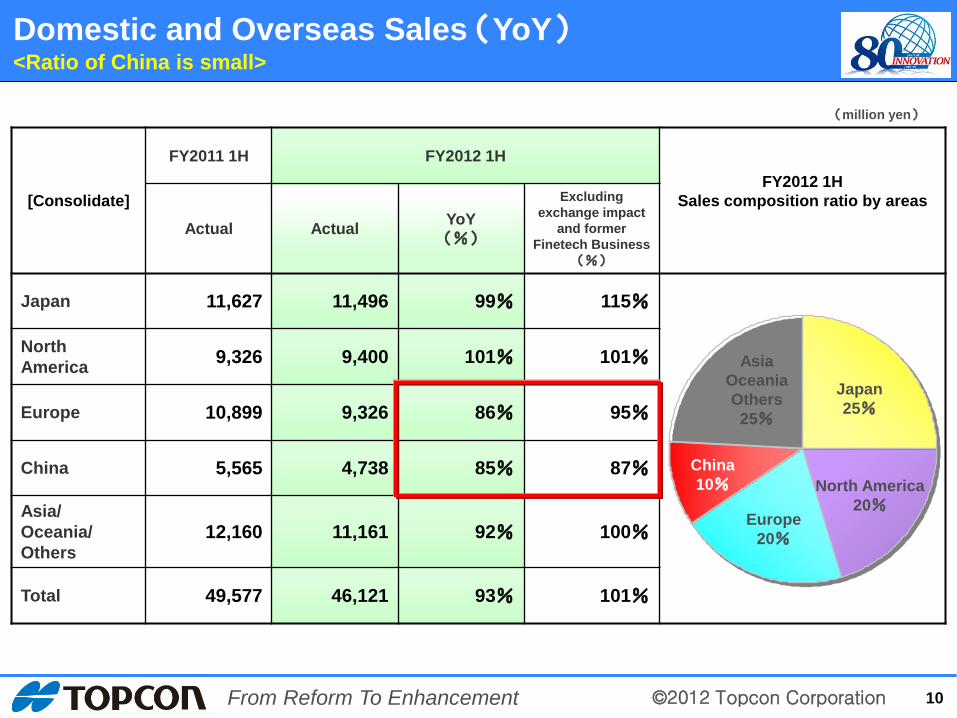
[Consolidate]
FY2011 1H FY2012 1H FY2012 1H
Sales composition ratio by areas Actual Actual YoY
(%)
Excluding exchange impact
and former Finetech Business
(%)
Japan 11,627 11,496 99% 115%
North America 9,326 9,400 101% 101%
Europe 10,899 9,326 86% 95%
China 5,565 4,738 85% 87%
Asia/ Oceania/ Others
12,160 11,161 92% 100%
Total 49,577 46,121 93% 101%
Japan 25%
Europe 20%
North America 20%
China 10%
Asia Oceania Others 25%
10
(million yen)
Domestic and Overseas Sales (YoY) <Ratio of China is small>
©2012 Topcon Corporation From Reform To Enhancement
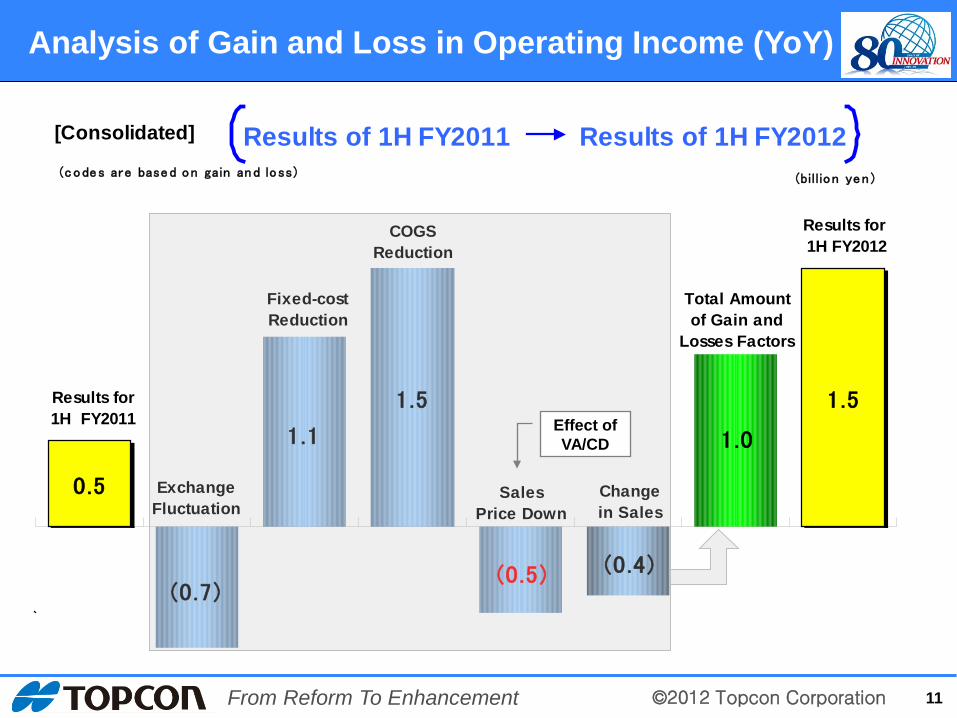
1.5
1.01.1
1.5
(0.4)(0.7)
0.5
(0.5)
Total Amountof Gain and
Losses Factors
Results for 1H FY2012
SalesPrice Down
Changein Sales
Results for1H FY2011
Fixed-costReduction
ExchangeFluctuation
COGSReduction
(billion yen )(codes are based on gain and loss)
[Consolidated] Results of 1H FY2011 Results of 1H FY2012
11
Analysis of Gain and Loss in Operating Income (YoY)
Effect of VA/CD

©2012 Topcon Corporation From Reform To Enhancement
FY2012 Full Year Forecast
12
©2012 Topcon Corporation From Reform To Enhancement 13
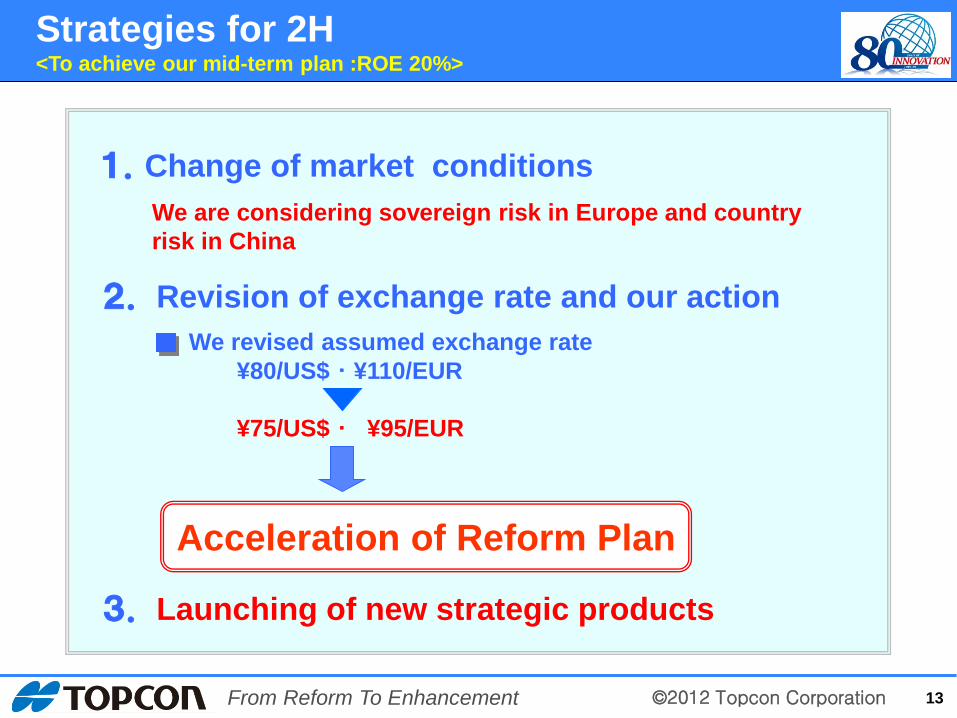
We revised assumed exchange rate ¥80/US$ ・ ¥110/EUR ¥75/US$ ・ ¥95/EUR
2. Revision of exchange rate and our action
3. Launching of new strategic products
We are considering sovereign risk in Europe and country risk in China
Acceleration of Reform Plan
Strategies for 2H <To achieve our mid-term plan :ROE 20%>
1.Change of market conditions
©2012 Topcon Corporation From Reform To Enhancement
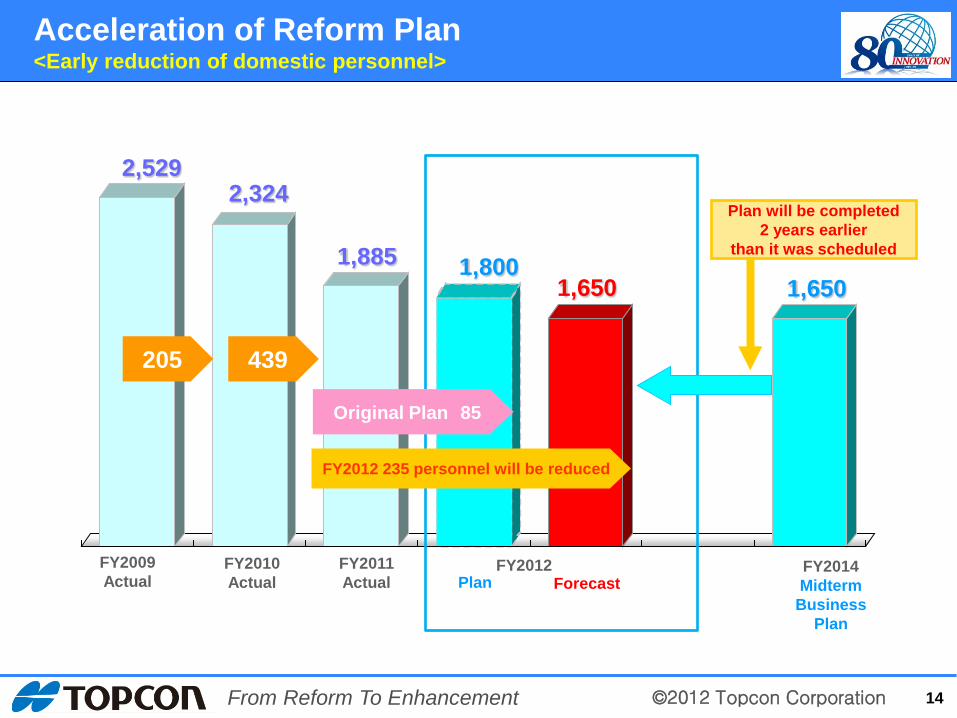
2,529 2,324
1,885 1,800 1,650 1,650
205 439
Original Plan 85
FY2012 235 personnel will be reduced
Plan will be completed 2 years earlier
than it was scheduled
14
Acceleration of Reform Plan <Early reduction of domestic personnel>
FY2009 Actual
FY2010 Actual
FY2011 Actual
FY2012 Forecast Plan
FY2014 Midterm
Business Plan
©2012 Topcon Corporation From Reform To Enhancement
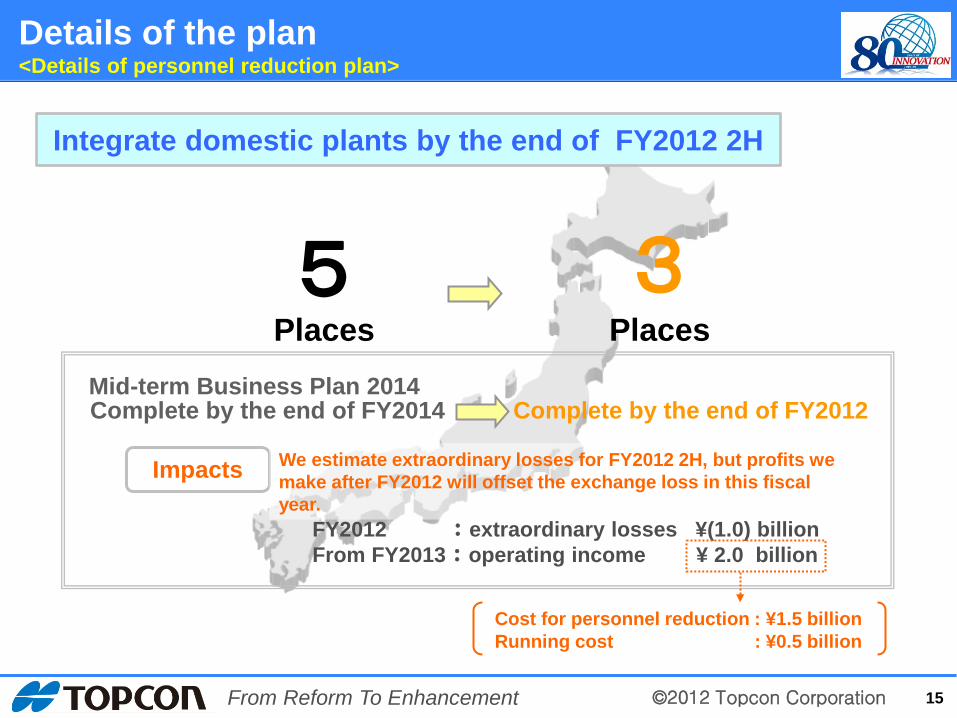
Integrate domestic plants by the end of FY2012 2H
15
Complete by the end of FY2014 Complete by the end of FY2012 Mid-term Business Plan 2014
Impacts We estimate extraordinary losses for FY2012 2H, but profits we make after FY2012 will offset the exchange loss in this fiscal year.
FY2012 : extraordinary losses ¥(1.0) billion From FY2013 : operating income ¥ 2.0 billion
Cost for personnel reduction : ¥1.5 billion Running cost : ¥0.5 billion
Details of the plan <Details of personnel reduction plan>
5Places
3 Places
©2012 Topcon Corporation From Reform To Enhancement
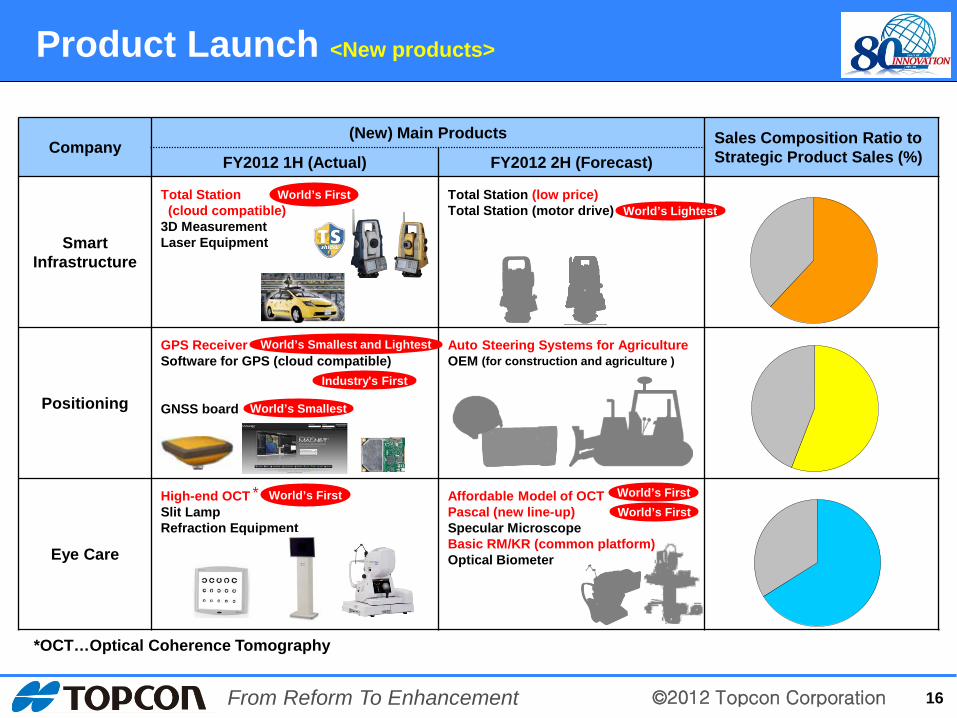
Product Launch <New products>
Company (New) Main Products Sales Composition Ratio to
Strategic Product Sales (%) FY2012 1H (Actual) FY2012 2H (Forecast)
Smart Infrastructure
Total Station (cloud compatible) 3D Measurement Laser Equipment
Total Station (low price) Total Station (motor drive)
Positioning
GPS Receiver Software for GPS (cloud compatible) GNSS board
Auto Steering Systems for Agriculture OEM (for construction and agriculture )
Eye Care
High-end OCT Slit Lamp Refraction Equipment
Affordable Model of OCT Pascal (new line-up) Specular Microscope Basic RM/KR (common platform) Optical Biometer
16
*OCT…Optical Coherence Tomography
*
World’s First
World’s Smallest and Lightest
Industry's First
World’s Smallest
World’s First
World’s Lightest
World’s First World’s First
©2012 Topcon Corporation From Reform To Enhancement
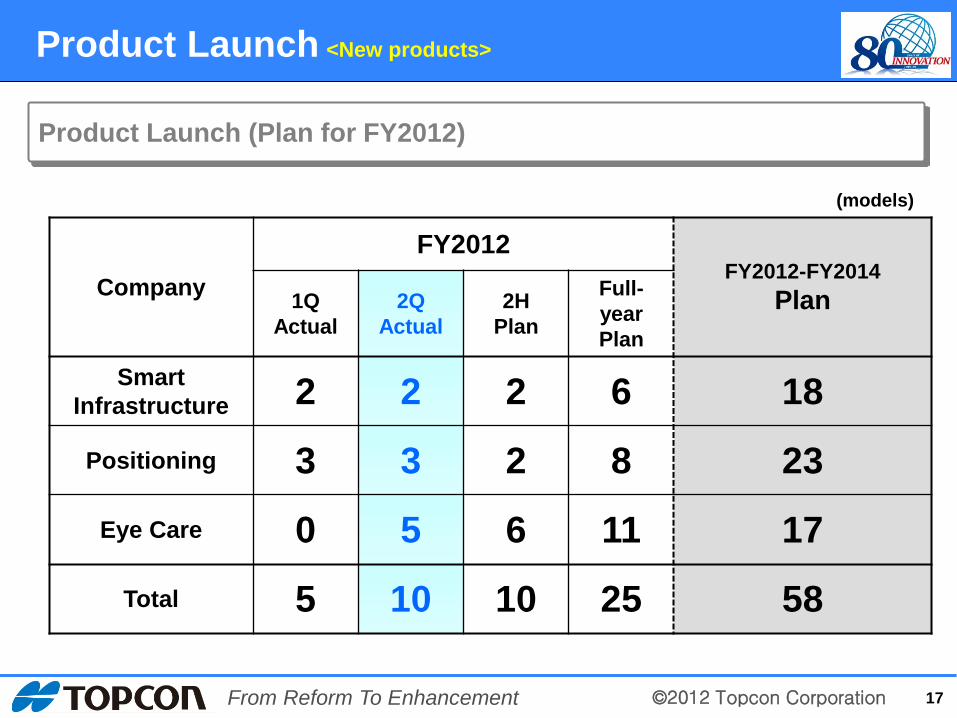
Product Launch (Plan for FY2012)
(models)
Company
FY2012 FY2012-FY2014
Plan 1Q Actual
2Q Actual
2H Plan
Full-year Plan
Smart Infrastructure 2 2 2 6 18 Positioning 3 3 2 8 23
Eye Care 0 5 6 11 17 Total 5 10 10 25 58
Product Launch <New products>
17
©2012 Topcon Corporation From Reform To Enhancement
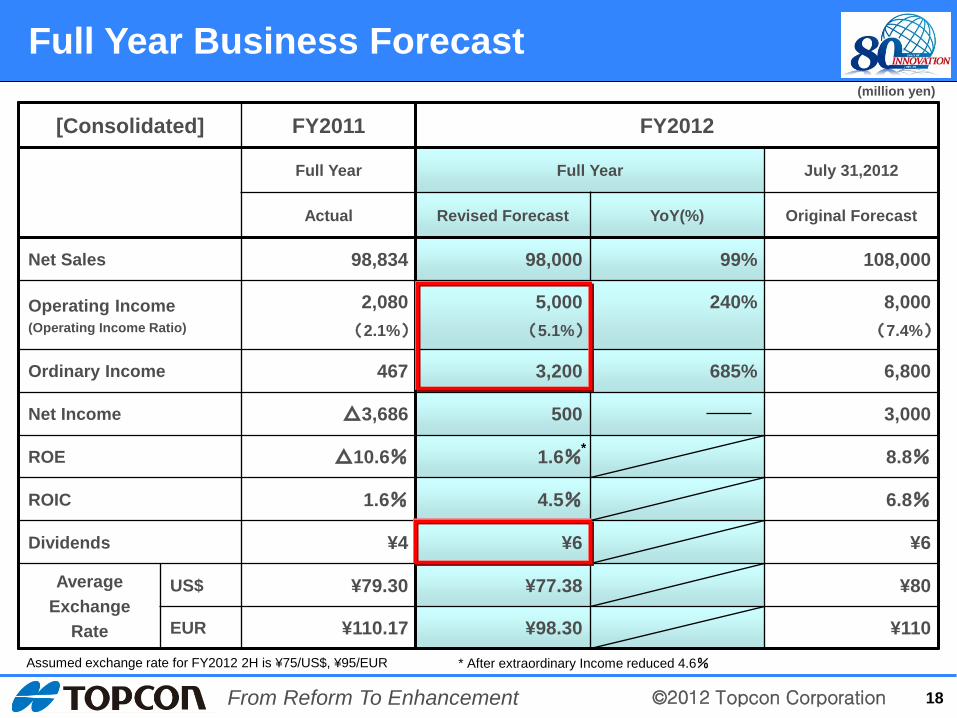
[Consolidated] FY2011 FY2012
Full Year Full Year July 31,2012
Actual Revised Forecast YoY(%) Original Forecast
Net Sales 98,834 98,000 99% 108,000
Operating Income (Operating Income Ratio)
2,080 (2.1%)
5,000 (5.1%)
240% 8,000 (7.4%)
Ordinary Income 467 3,200 685% 6,800
Net Income △3,686 500 3,000
ROE △10.6% 1.6% 8.8%
ROIC 1.6% 4.5% 6.8%
Dividends ¥4 ¥6 ¥6
Average Exchange
Rate
US$ ¥79.30 ¥77.38 ¥80
EUR ¥110.17 ¥98.30 ¥110
18
(million yen)
Full Year Business Forecast
Assumed exchange rate for FY2012 2H is ¥75/US$, ¥95/EUR * After extraordinary Income reduced 4.6%
*
©2012 Topcon Corporation From Reform To Enhancement
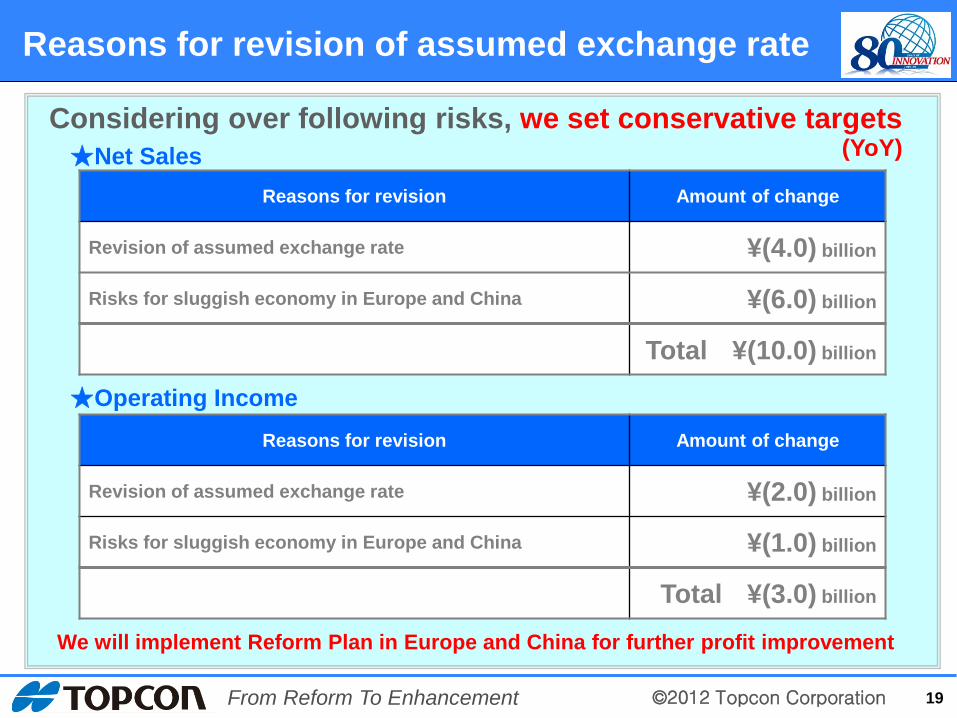
Reasons for revision of assumed exchange rate
19
Reasons for revision Amount of change
Revision of assumed exchange rate ¥(4.0) billion
Risks for sluggish economy in Europe and China ¥(6.0) billion
Total ¥(10.0) billion
Reasons for revision Amount of change
Revision of assumed exchange rate ¥(2.0) billion
Risks for sluggish economy in Europe and China ¥(1.0) billion
Total ¥(3.0) billion
★Net Sales
★Operating Income
Considering over following risks, we set conservative targets
We will implement Reform Plan in Europe and China for further profit improvement
(YoY)
©2012 Topcon Corporation From Reform To Enhancement
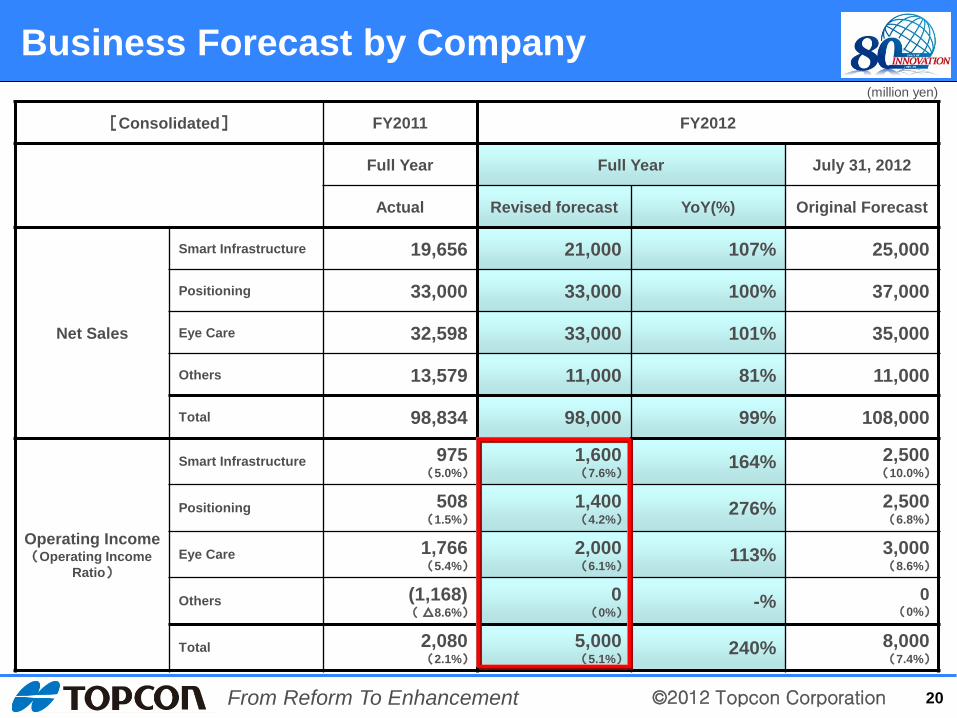
[Consolidated] FY2011 FY2012
Full Year Full Year July 31, 2012
Actual Revised forecast YoY(%) Original Forecast
Net Sales
Smart Infrastructure 19,656 21,000 107% 25,000
Positioning 33,000 33,000 100% 37,000
Eye Care 32,598 33,000 101% 35,000
Others 13,579 11,000 81% 11,000
Total 98,834 98,000 99% 108,000
Operating Income (Operating Income
Ratio)
Smart Infrastructure 975 (5.0%)
1,600 (7.6%)
164% 2,500 (10.0%)
Positioning 508 (1.5%)
1,400 (4.2%)
276% 2,500 (6.8%)
Eye Care 1,766 (5.4%)
2,000 (6.1%)
113% 3,000 (8.6%)
Others (1,168) ( △8.6%)
0 (0%)
-% 0 (0%)
Total 2,080 (2.1%)
5,000 (5.1%)
240% 8,000 (7.4%)
20
(million yen)
Business Forecast by Company
©2012 Topcon Corporation From Reform To Enhancement
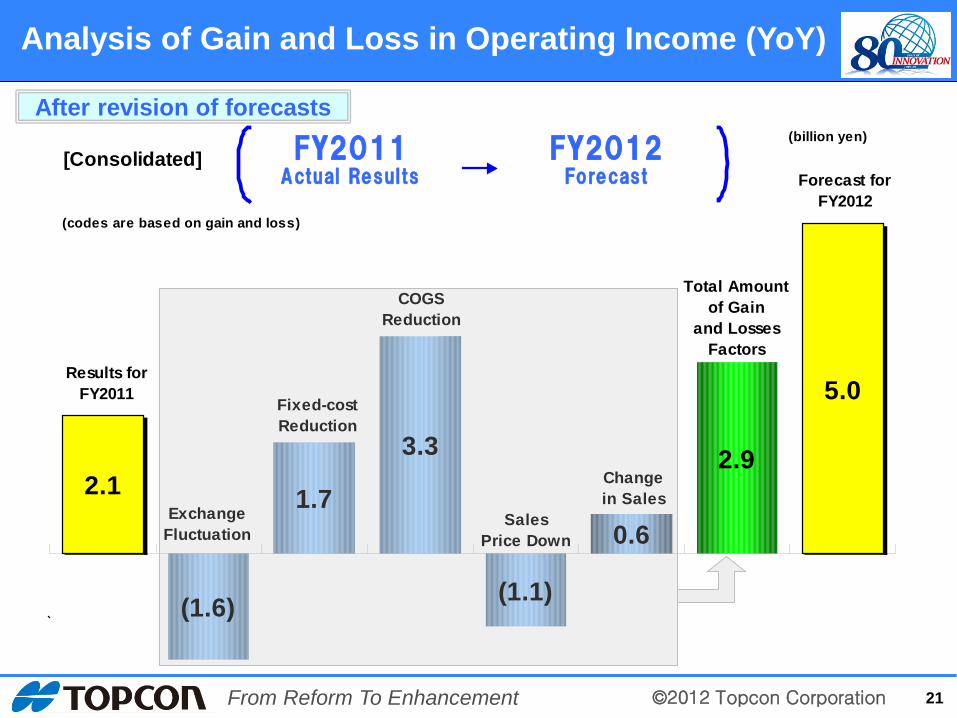
5.0
2.9
0.6
(1.1)
3.3
1.7
(1.6)
2.1
COGSReduction
ExchangeFluctuation
Fixed-costReduction
Results forFY2011
Changein Sales
SalesPrice Down
Forecast forFY2012
Total Amountof Gain
and LossesFactors
(billion yen)
(codes are based on gain and loss)
[Consolidated] FY2011Actual Results
FY2012Forecast
21
After revision of forecasts
Analysis of Gain and Loss in Operating Income (YoY)
©2012 Topcon Corporation From Reform To Enhancement
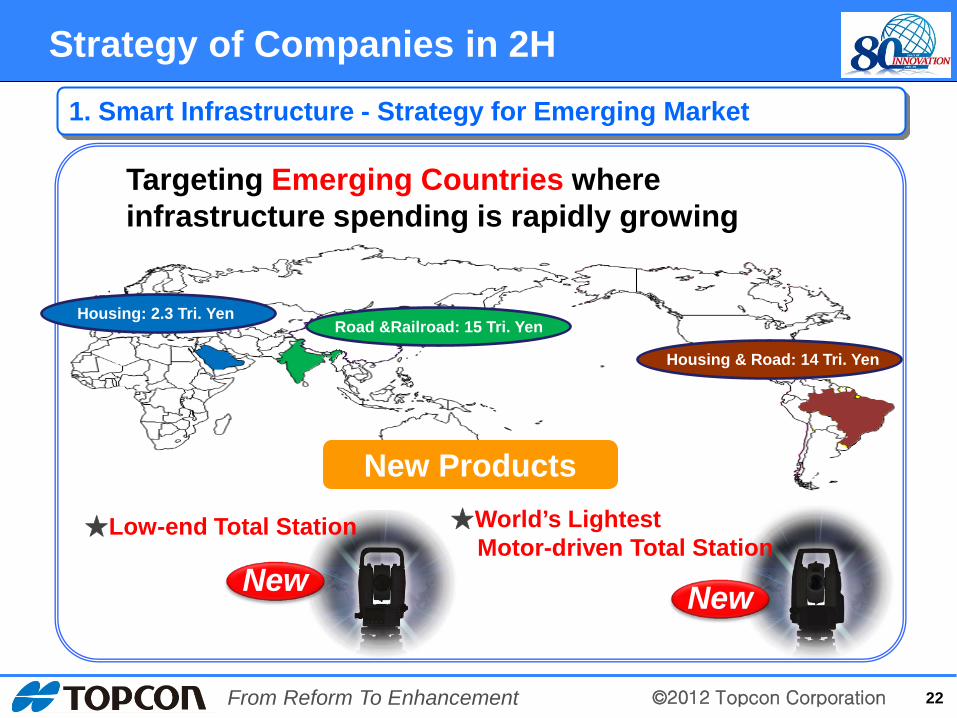
1. Smart Infrastructure - Strategy for Emerging Market
Road &Railroad: 15 Tri. Yen Housing: 2.3 Tri. Yen
Housing & Road: 14 Tri. Yen
★World’s Lightest Motor-driven Total Station
★Low-end Total Station
Strategy of Companies in 2H
22
Targeting Emerging Countries where infrastructure spending is rapidly growing
New Products
New New
©2012 Topcon Corporation From Reform To Enhancement
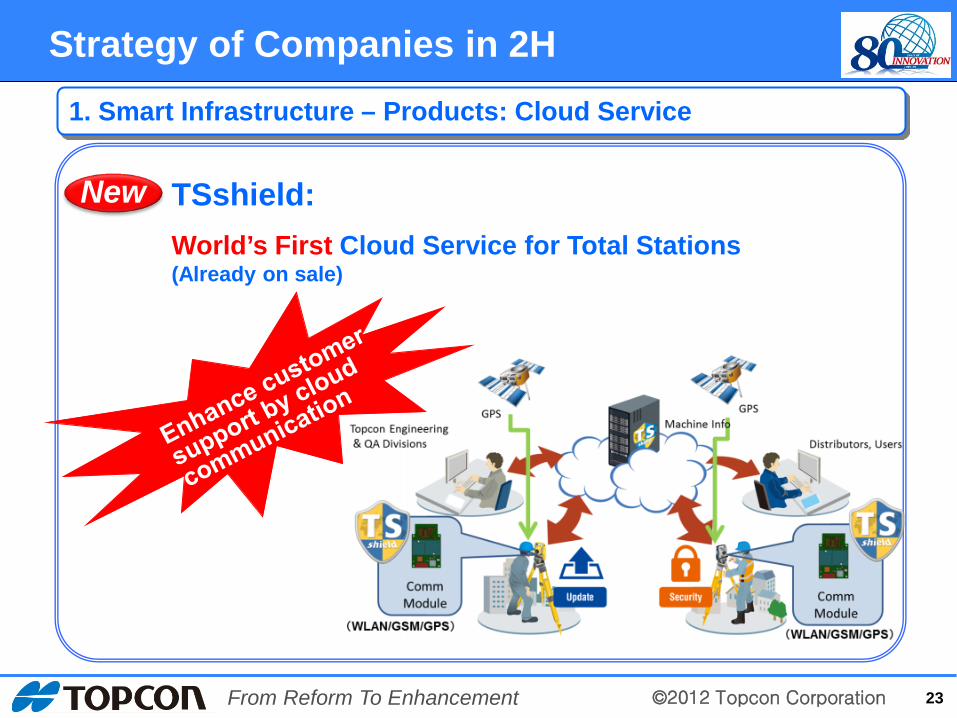
1. Smart Infrastructure – Products: Cloud Service
23
Strategy of Companies in 2H
TSshield: World’s First Cloud Service for Total Stations (Already on sale)
New
©2012 Topcon Corporation From Reform To Enhancement
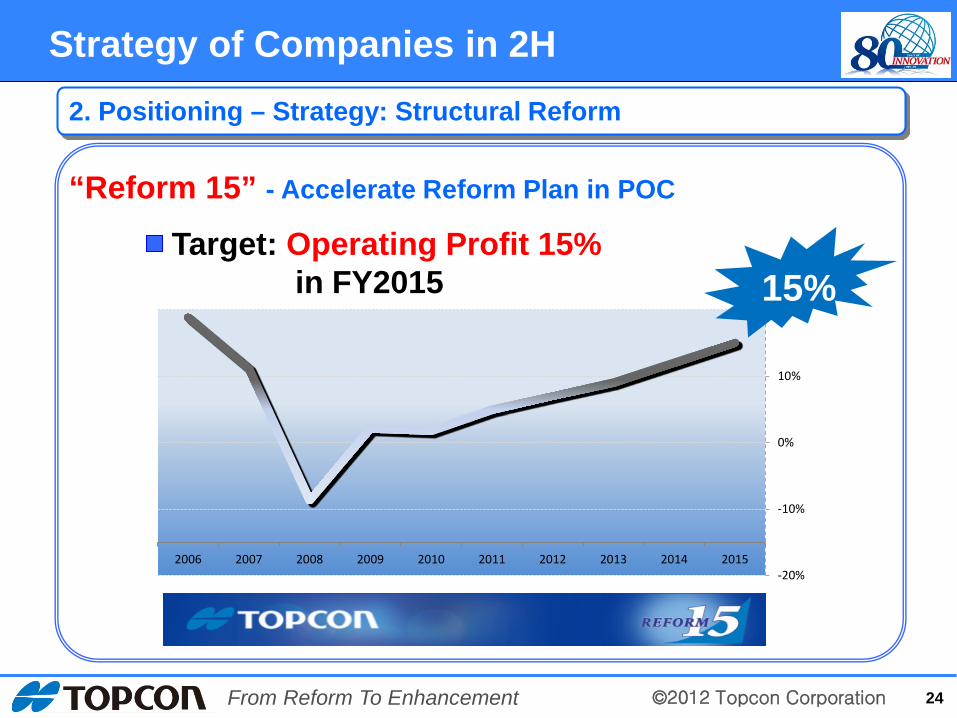
2. Positioning – Strategy: Structural Reform
Strategy of Companies in 2H
24
“Reform 15” - Accelerate Reform Plan in POC
Target: Operating Profit 15% in FY2015
-20%
-10%
0%
10%
20%
2015201420132012201120102009200820072006
15%
©2012 Topcon Corporation From Reform To Enhancement
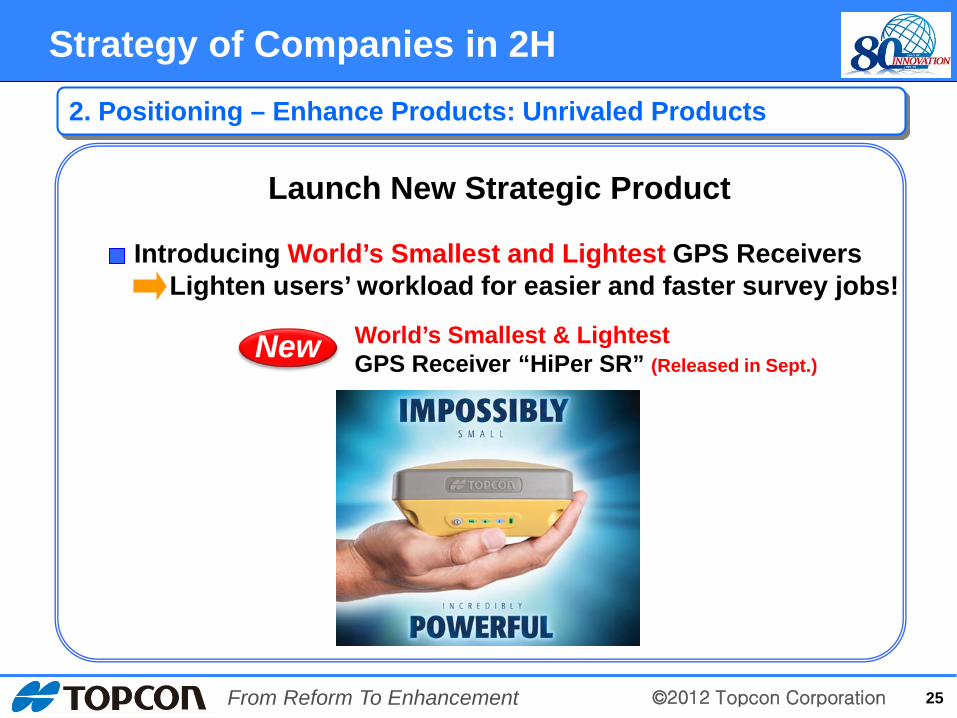
2. Positioning – Enhance Products: Unrivaled Products
25
Strategy of Companies in 2H
Introducing World’s Smallest and Lightest GPS Receivers Lighten users’ workload for easier and faster survey jobs!
New
Launch New Strategic Product
World’s Smallest & Lightest GPS Receiver “HiPer SR” (Released in Sept.)
©2012 Topcon Corporation From Reform To Enhancement
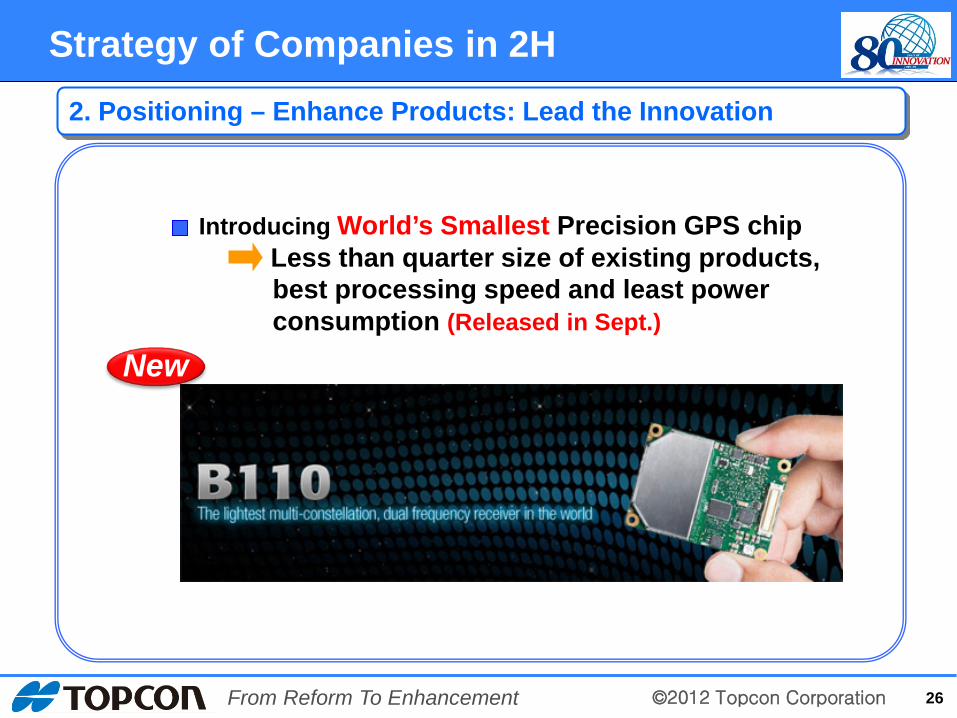
2. Positioning – Enhance Products: Lead the Innovation
26
Strategy of Companies in 2H
Introducing World’s Smallest Precision GPS chip Less than quarter size of existing products, best processing speed and least power consumption (Released in Sept.)
New
©2012 Topcon Corporation From Reform To Enhancement
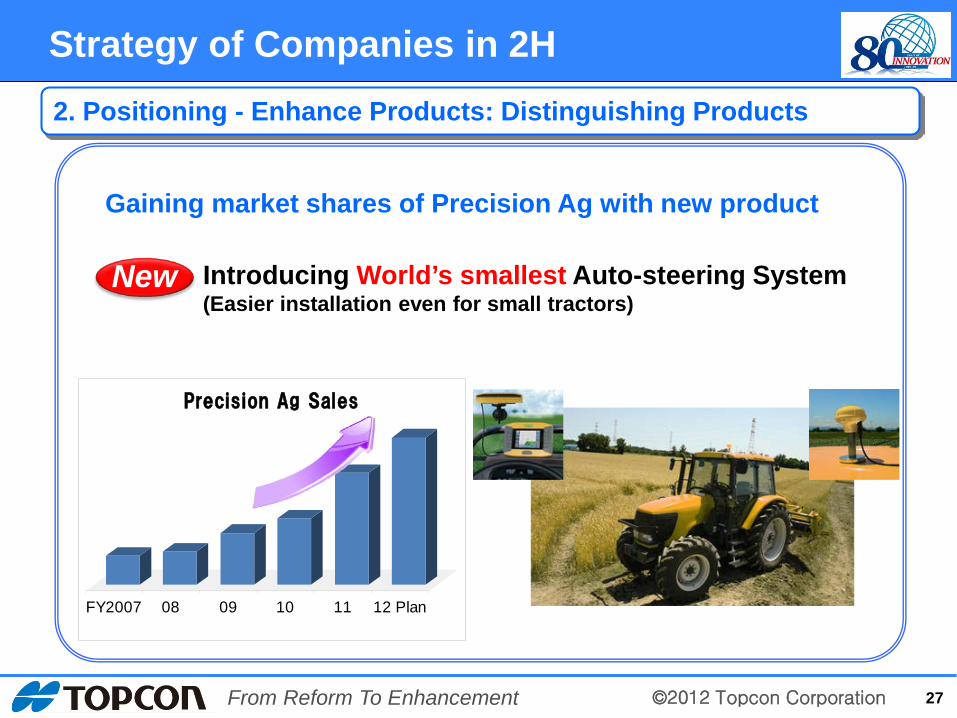
2. Positioning - Enhance Products: Distinguishing Products
FY2007 08 09 10 11 12 Plan
Precision Ag Sales
27
Strategy of Companies in 2H
Gaining market shares of Precision Ag with new product
Introducing World’s smallest Auto-steering System (Easier installation even for small tractors)
New
©2012 Topcon Corporation From Reform To Enhancement
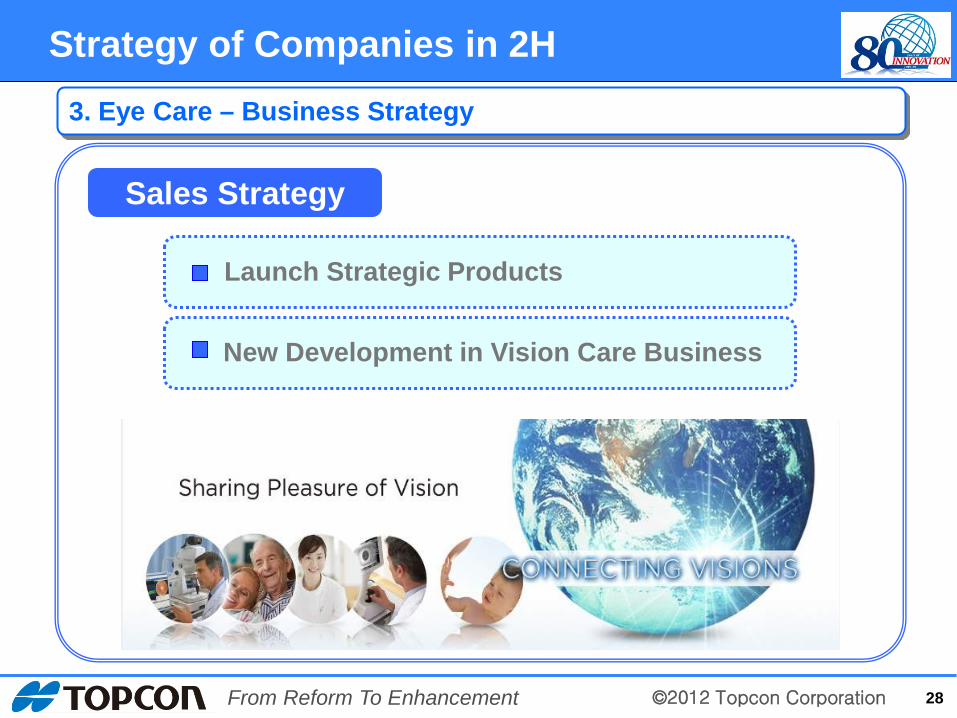
Strategy of Companies in 2H 3. Eye Care – Business Strategy
Launch Strategic Products
New Development in Vision Care Business
Sales Strategy
28
©2012 Topcon Corporation From Reform To Enhancement 29
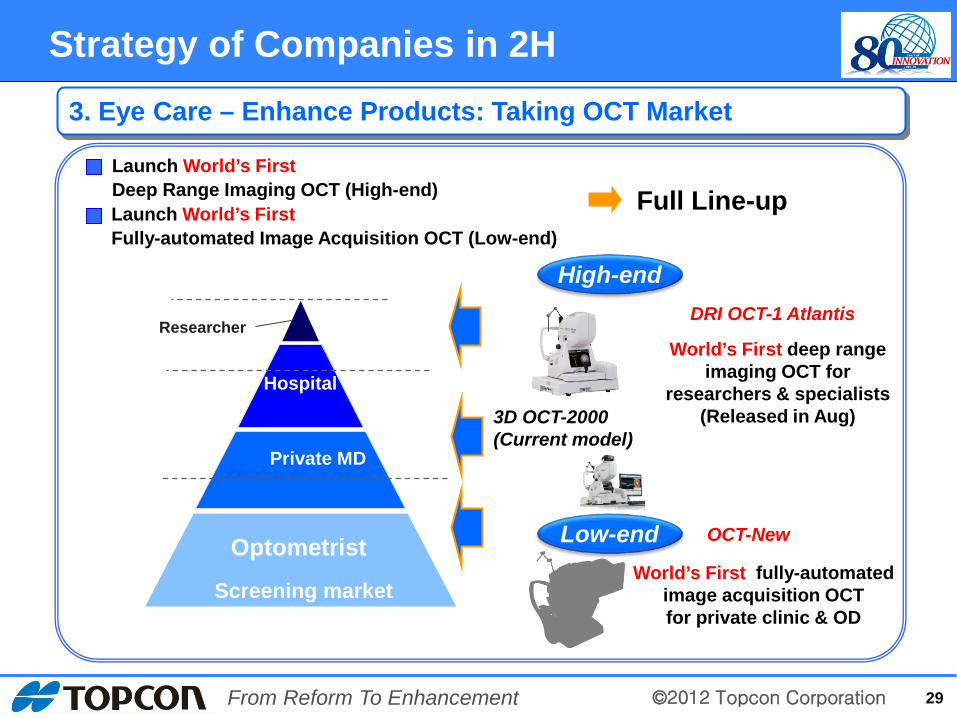
3. Eye Care – Enhance Products: Taking OCT Market
Strategy of Companies in 2H
Hospital
Private MD
Optometrist Low-end World’s First fully-automated
image acquisition OCT for private clinic & OD
Hospital
Researcher
Screening market
High-end DRI OCT-1 Atlantis
Launch World’s First Deep Range Imaging OCT (High-end)
OCT-New
World’s First deep range imaging OCT for
researchers & specialists (Released in Aug)
Full Line-up
3D OCT-2000 (Current model)
Launch World’s First Fully-automated Image Acquisition OCT (Low-end)
©2012 Topcon Corporation From Reform To Enhancement
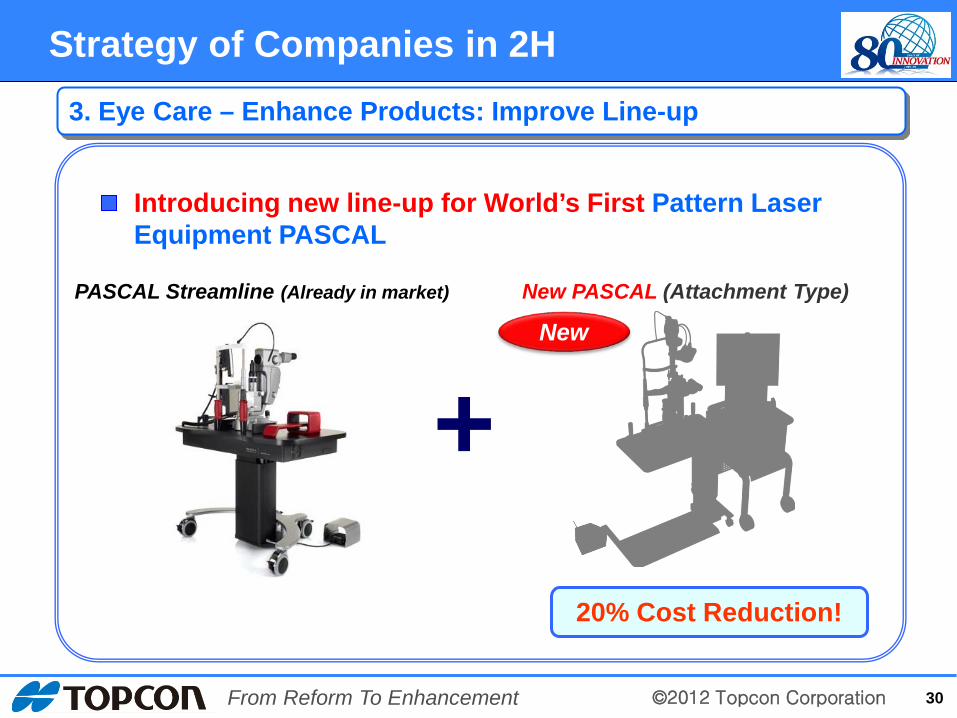
3. Eye Care – Enhance Products: Improve Line-up
Strategy of Companies in 2H
Introducing new line-up for World’s First Pattern Laser Equipment PASCAL
Hospital
30
PASCAL Streamline (Already in market) New PASCAL (Attachment Type)
New
+ 20% Cost Reduction!
©2012 Topcon Corporation From Reform To Enhancement
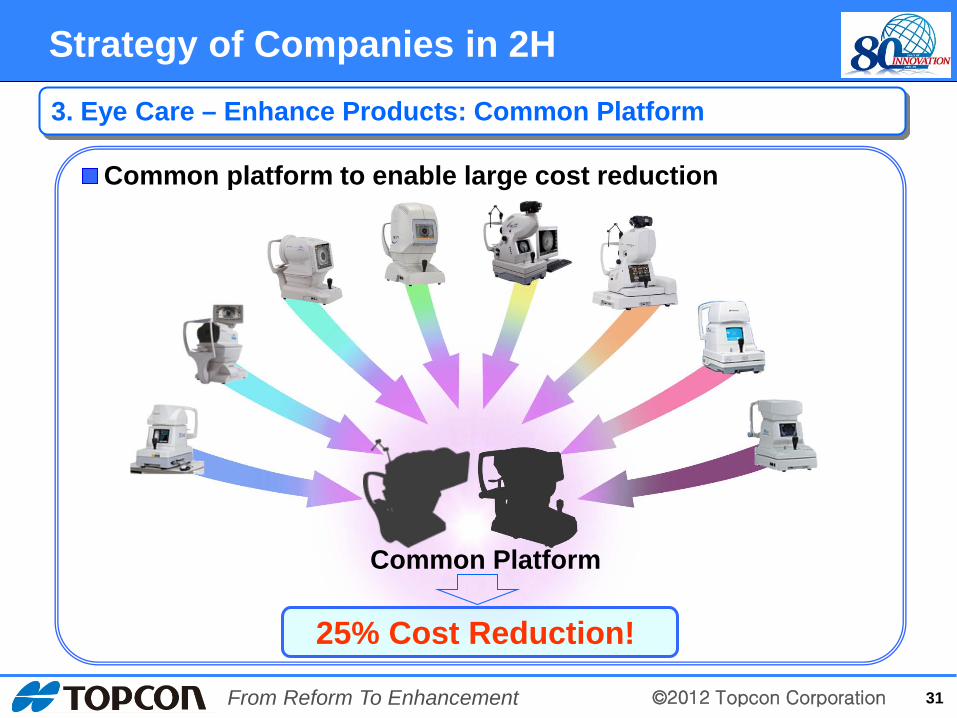
3. Eye Care – Enhance Products: Common Platform
31
Strategy of Companies in 2H
Common platform to enable large cost reduction
25% Cost Reduction!
Common Platform
©2012 Topcon Corporation From Reform To Enhancement
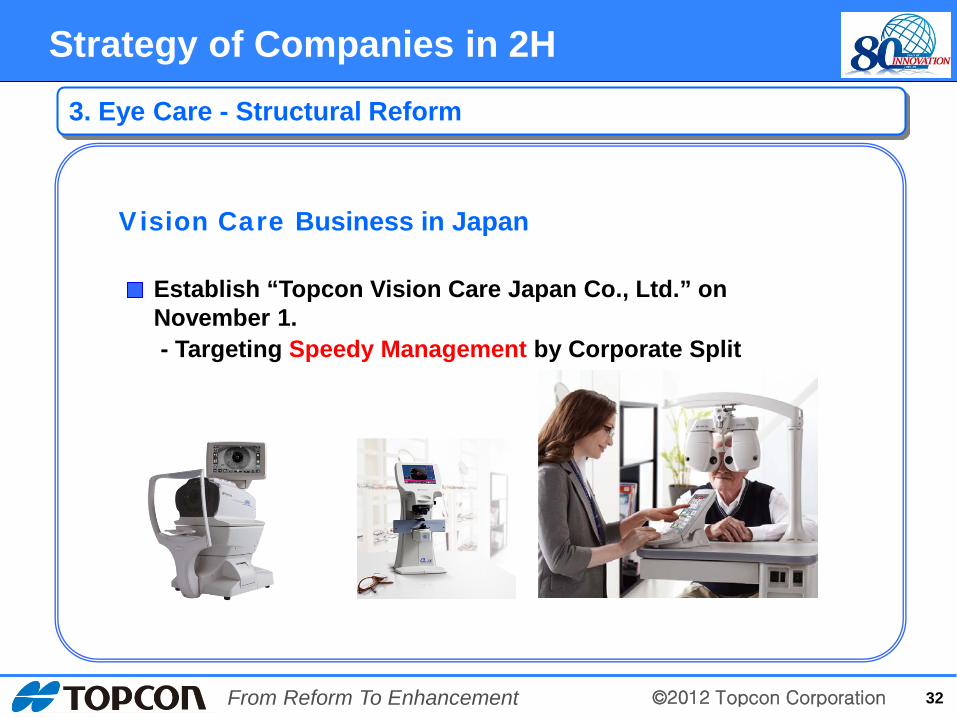
3. Eye Care - Structural Reform
32
Strategy of Companies in 2H
Vision Care Business in Japan
Establish “Topcon Vision Care Japan Co., Ltd.” on November 1. - Targeting Speedy Management by Corporate Split
©2012 Topcon Corporation From Reform To Enhancement
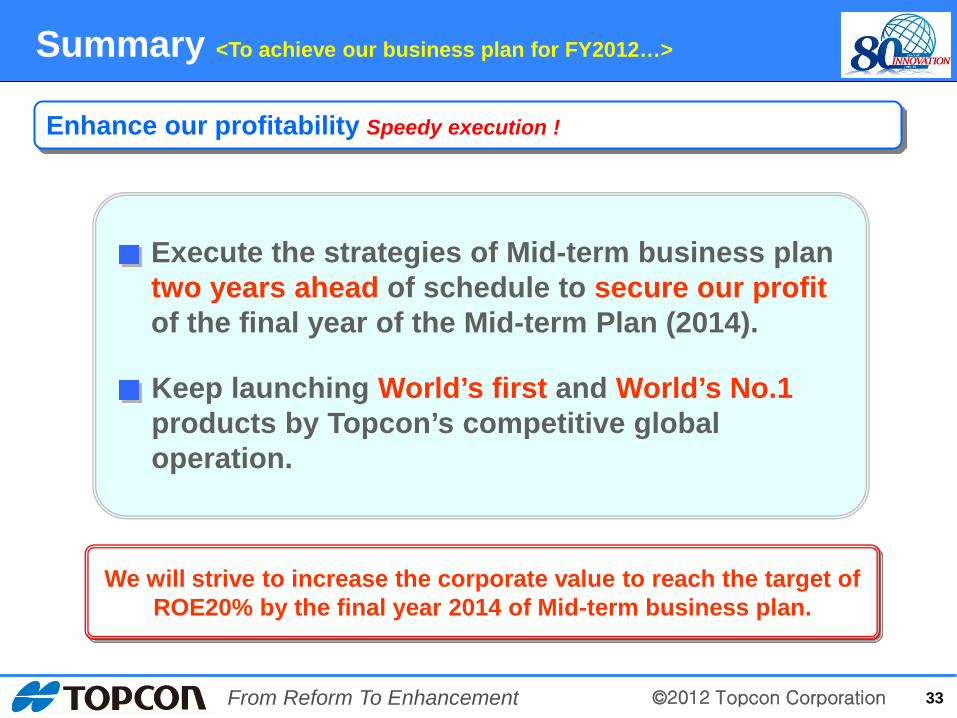
Summary <To achieve our business plan for FY2012…>
We will strive to increase the corporate value to reach the target of ROE20% by the final year 2014 of Mid-term business plan.
Enhance our profitability Speedy execution !
Keep launching World’s first and World’s No.1 products by Topcon’s competitive global operation.
Execute the strategies of Mid-term business plan two years ahead of schedule to secure our profit of the final year of the Mid-term Plan (2014).
33
©2012 Topcon Corporation From Reform To Enhancement
Appendix
34
©2012 Topcon Corporation From Reform To Enhancement
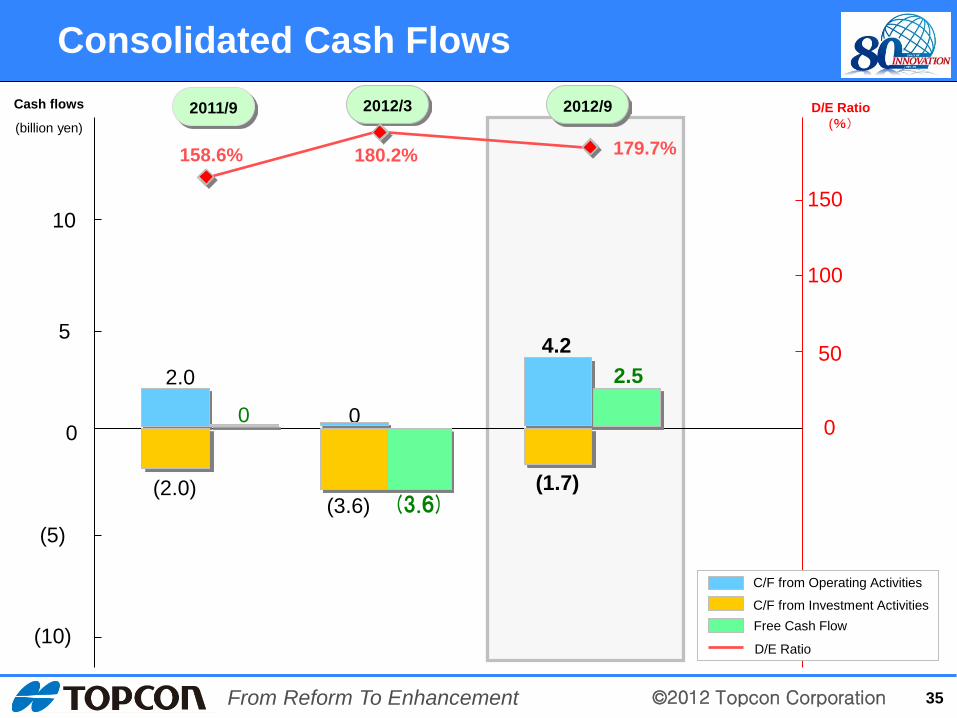
Consolidated Cash Flows
35
Cash flows
(billion yen)
10
5
(10)
(5)
0
100
50
0
D/E Ratio (%)
150
C/F from Operating Activities
C/F from Investment Activities Free Cash Flow
D/E Ratio
2011/9 2012/9
158.6%
4.2
(1.7)
2.5 2.0
(2.0)
179.7%
2012/3
0
(3.6) (3.6)
180.2%
0
©2012 Topcon Corporation From Reform To Enhancement
2011/9 2012/9 2010/9 2011/9 2012/9 2010/9
60
40
20
0
10
5
2.0
1.0
1.5
0.5
9.0%
1.5
1.3
0.6
4.4 1.7
10.7%
1.6
0.8
5.3
1.7 1.6
1.4
1.6
1.6 1.5
1.4
0.2
1.5
9.0%
4.2
1.1
0.0
1.1 1.3
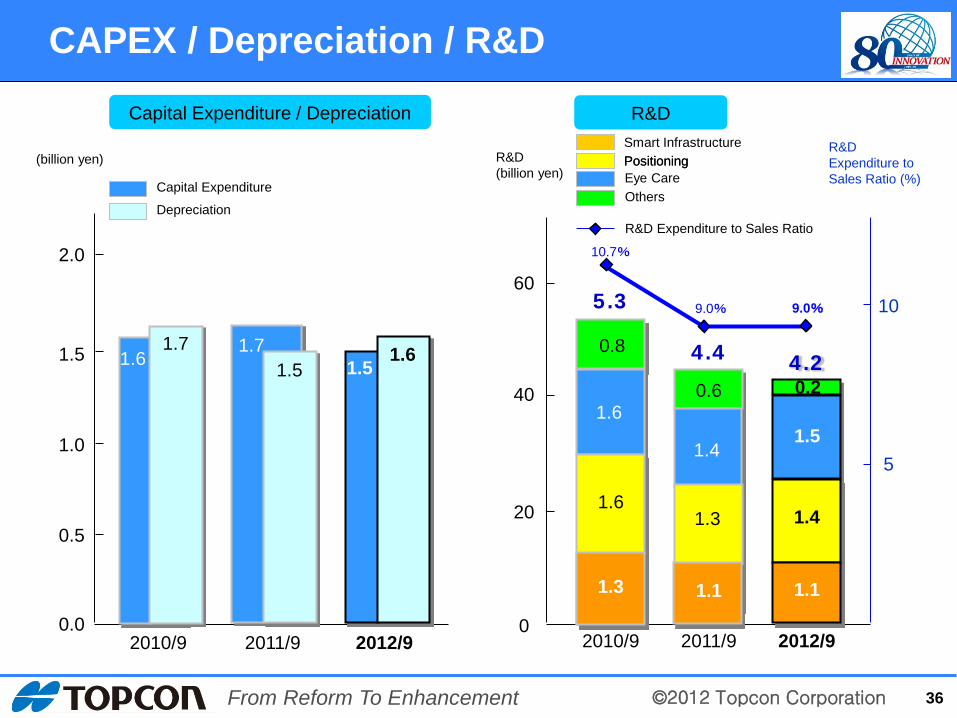
CAPEX / Depreciation / R&D
Capital Expenditure / Depreciation R&D
Capital Expenditure
Depreciation
Positioning
R&D Expenditure to Sales Ratio
Eye Care Others
R&D Expenditure to Sales Ratio (%)
R&D (billion yen)
(billion yen)
36
Positioning Smart Infrastructure
©2012 Topcon Corporation From Reform To Enhancement 37
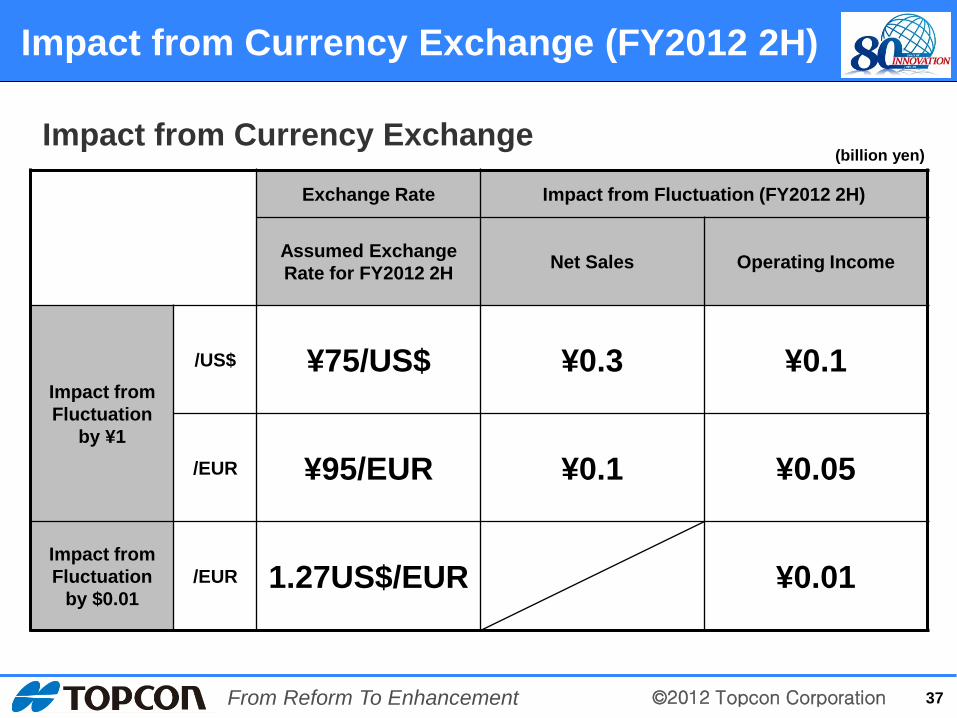
Exchange Rate Impact from Fluctuation (FY2012 2H)
Assumed Exchange Rate for FY2012 2H Net Sales Operating Income
Impact from Fluctuation
by ¥1
/US$ ¥75/US$ ¥0.3 ¥0.1
/EUR ¥95/EUR ¥0.1 ¥0.05
Impact from Fluctuation
by $0.01 /EUR 1.27US$/EUR ¥0.01
Impact from Currency Exchange
Impact from Currency Exchange (FY2012 2H)
(billion yen)
©2012 Topcon Corporation From Reform To Enhancement 38
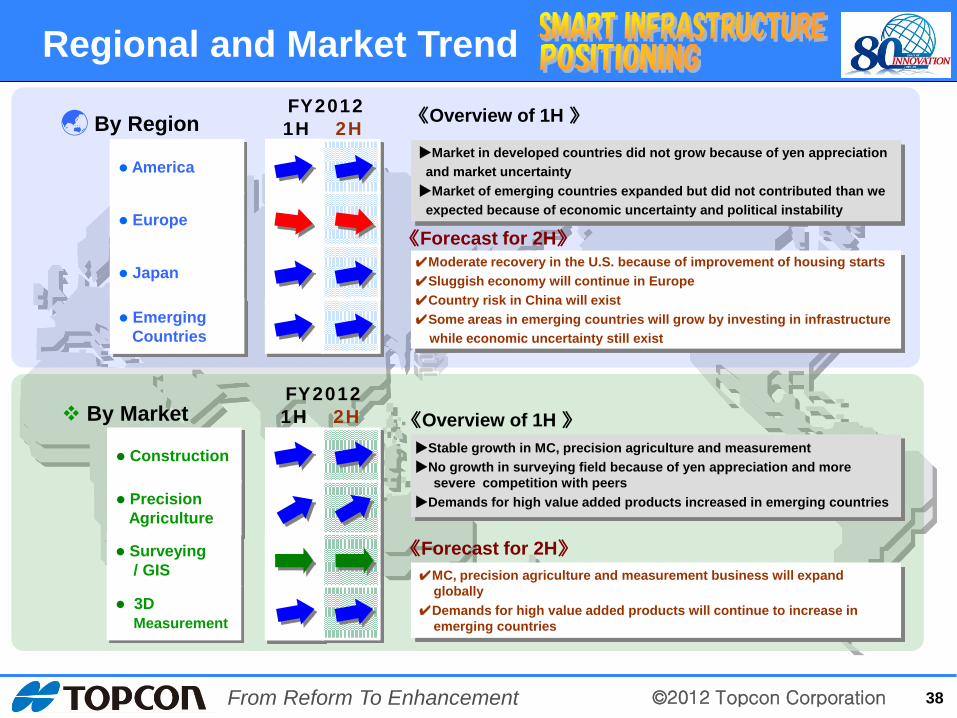
▶Market in developed countries did not grow because of yen appreciation and market uncertainty ▶Market of emerging countries expanded but did not contributed than we expected because of economic uncertainty and political instability
▶Stable growth in MC, precision agriculture and measurement ▶No growth in surveying field because of yen appreciation and more
severe competition with peers ▶Demands for high value added products increased in emerging countries
✔Moderate recovery in the U.S. because of improvement of housing starts ✔Sluggish economy will continue in Europe ✔Country risk in China will exist ✔Some areas in emerging countries will grow by investing in infrastructure while economic uncertainty still exist
✔MC, precision agriculture and measurement business will expand globally
✔Demands for high value added products will continue to increase in emerging countries
FY2012 1H 2H
America
Europe
Japan
Emerging Countries
FY2012 1H 2H
《Overview of 1H 》
《Overview of 1H 》
《Forecast for 2H》
《Forecast for 2H》
Construction
Precision Agriculture
Surveying / GIS
3D Measurement
By Market
By Region
Regional and Market Trend
©2012 Topcon Corporation From Reform To Enhancement
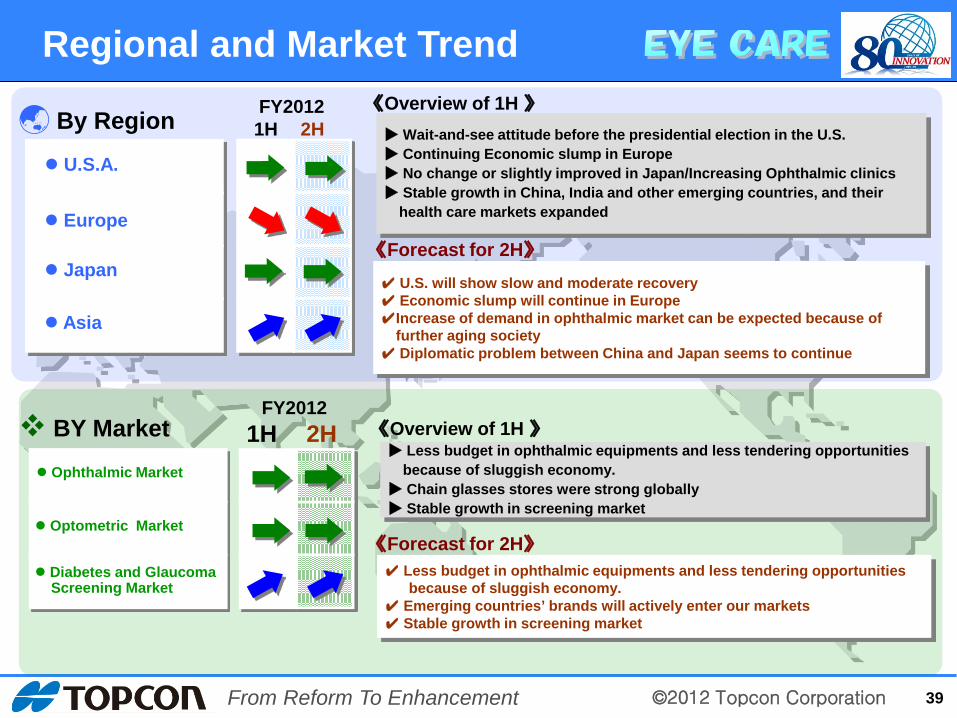
FY2012 1H 2H
FY2012 1H 2H
Japan
Europe
U.S.A.
Asia
▶ Wait-and-see attitude before the presidential election in the U.S. ▶ Continuing Economic slump in Europe ▶ No change or slightly improved in Japan/Increasing Ophthalmic clinics ▶ Stable growth in China, India and other emerging countries, and their
health care markets expanded
✔ U.S. will show slow and moderate recovery ✔ Economic slump will continue in Europe ✔Increase of demand in ophthalmic market can be expected because of
further aging society ✔ Diplomatic problem between China and Japan seems to continue
▶ Less budget in ophthalmic equipments and less tendering opportunities because of sluggish economy.
▶ Chain glasses stores were strong globally ▶ Stable growth in screening market
✔ Less budget in ophthalmic equipments and less tendering opportunities because of sluggish economy. ✔ Emerging countries’ brands will actively enter our markets ✔ Stable growth in screening market
《Overview of 1H 》
《Forecast for 2H》
Regional and Market Trend
BY Market
By Region
39
《Overview of 1H 》
《Forecast for 2H》
Ophthalmic Market
Optometric Market
Diabetes and Glaucoma Screening Market
©2012 Topcon Corporation From Reform To Enhancement
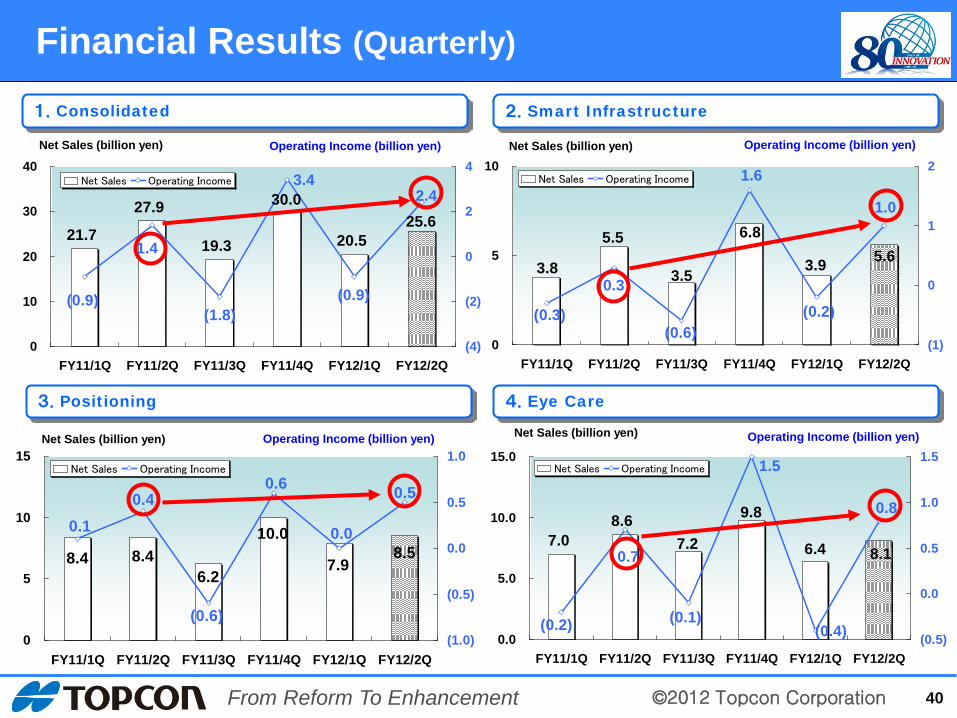
5.63.93.53.8
5.5 6.81.0
(0.2)
1.6
(0.6)
0.3
(0.3)
0
5
10
FY11/1Q FY11/2Q FY11/3Q FY11/4Q FY12/1Q FY12/2Q(1)
0
1
2Net Sales Operating Income
21.7
27.9
19.3 20.525.6
30.03.4
2.4
(0.9)(1.8)
1.4
(0.9)
0
10
20
30
40
FY11/1Q FY11/2Q FY11/3Q FY11/4Q FY12/1Q FY12/2Q(4)
(2)
0
2
4Net Sales Operating Income
8.57.9
10.0
6.28.48.4
0.5
0.0
0.6
(0.6)
0.40.1
0
5
10
15
FY11/1Q FY11/2Q FY11/3Q FY11/4Q FY12/1Q FY12/2Q(1.0)
(0.5)
0.0
0.5
1.0Net Sales Operating Income
40
Financial Results (Quarterly)
1.Consolidated 2.Smart Infrastructure
4.Eye Care 3.Positioning
Net Sales (billion yen)
Operating Income (billion yen) Operating Income (billion yen)
Operating Income (billion yen) Operating Income (billion yen) Net Sales (billion yen)
Net Sales (billion yen) Net Sales (billion yen)
7.08.6
7.2
9.8
6.4 8.1
0.8
(0.4)
1.5
(0.1)
0.7
(0.2)0.0
5.0
10.0
15.0
FY11/1Q FY11/2Q FY11/3Q FY11/4Q FY12/1Q FY12/2Q(0.5)
0.0
0.5
1.0
1.5Net Sales Operating Income
©2012 Topcon Corporation From Reform To Enhancement
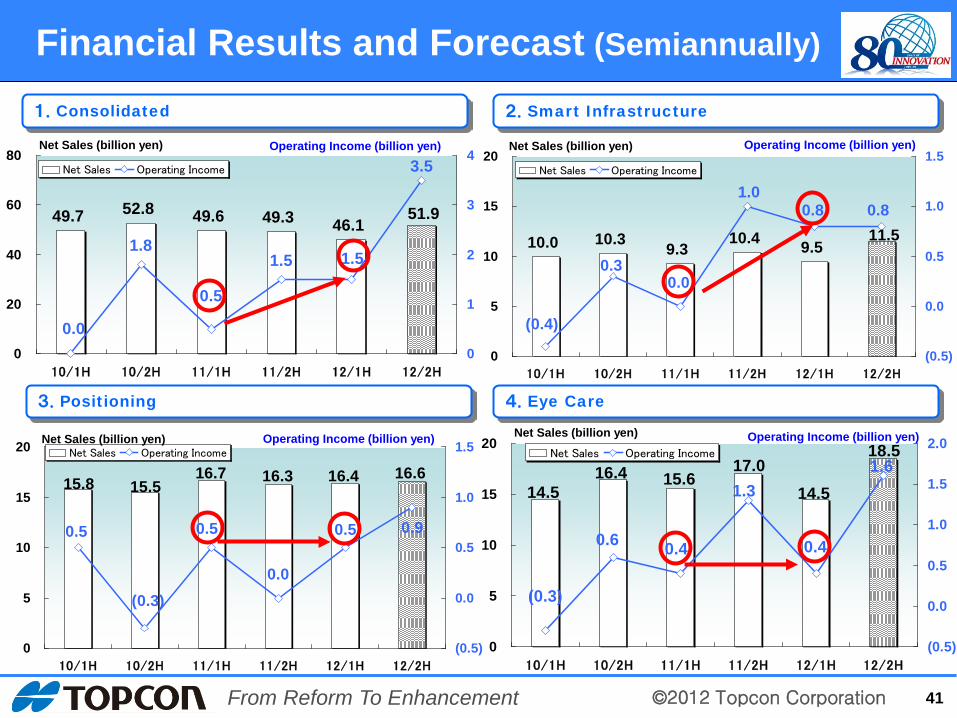
16.616.416.316.715.515.8
0.90.5
0.0
0.5
(0.3)
0.5
0
5
10
15
20
10/1H 10/2H 11/1H 11/2H 12/1H 12/2H
(0.5)
0.0
0.5
1.0
1.5Net Sales Operating Income
49.7 52.8 49.6 49.3 46.151.9
3.5
1.51.5
0.5
1.8
0.00
20
40
60
80
10/1H 10/2H 11/1H 11/2H 12/1H 12/2H
0
1
2
3
4Net Sales Operating Income
18.5
14.517.0
15.616.414.5
1.6
0.4
1.3
0.40.6
(0.3)
0
5
10
15
20
10/1H 10/2H 11/1H 11/2H 12/1H 12/2H
(0.5)
0.0
0.5
1.0
1.5
2.0Net Sales Operating Income
10.0 10.3 9.310.4 9.5
11.50.80.8
1.0
0.00.3
(0.4)
0
5
10
15
20
10/1H 10/2H 11/1H 11/2H 12/1H 12/2H
(0.5)
0.0
0.5
1.0
1.5Net Sales Operating Income
1.Consolidated 2.Smart Infrastructure
4.Eye Care 3.Positioning
41
Financial Results and Forecast (Semiannually)
Net Sales (billion yen)
Operating Income (billion yen) Operating Income (billion yen)
Operating Income (billion yen) Operating Income (billion yen) Net Sales (billion yen)
Net Sales (billion yen) Net Sales (billion yen)
©2012 Topcon Corporation From Reform To Enhancement
Inquiries: IR Affairs Corporate Communication Dept. TOPCON CORPORATION Tel: +81-3-3558-2532 E-mail: [email protected] URL: http: //global.topcon.com/invest/
Cautionary Note regarding Forward-Looking Statements These materials contain forward-looking statements, including projections of future operating performance. Such statements are based on management’s best judgment, given the materials available to them at the time these statements are made. However, please be aware that actual performance may differ from projected figures owing to unexpected changes in the economic environment in which we operate, as well as to market fluctuations.