fy2012 2q quarterly securities report · (3) management’s discussion and analysis of financial...
TRANSCRIPT

Quarterly Securities Report For the three months ended September 30, 2012
(TRANSLATION)
Sony Corporation

CONTENTS
Page Note for readers of this English translation Cautionary Statement
1 1
I Corporate Information 2 (1) Selected Consolidated Financial Data 2 (2) Business Overview 3
II State of Business 4 (1) Risk Factors 4 (2) Material Contracts 4 (3) Management’s Discussion and Analysis of Financial Condition, Results of Operations and
Status of Cash Flows 4
III Company Information 9 (1) Information on the Company’s Shares 9 (2) Directors and Corporate Executive Officers 12
IV Financial Statements 13 (1) Consolidated Financial Statements 14 (2) Other Information 40

- 1 -
Note for readers of this English translation
On November 9, 2012, Sony Corporation (the “Company” or “Sony Corporation”) filed its Japanese-language Quarterly
Securities Report (Shihanki Houkokusho) for the three months ended September 30, 2012 with the Director-General of the
Kanto Local Finance Bureau in Japan pursuant to the Financial Instruments and Exchange Act of Japan. This document is
an English translation of the Quarterly Securities Report in its entirety, except for (i) information that had been previously
filed with or submitted to the U.S. Securities and Exchange Commission (the “SEC”) in a Form 20-F, Form 6-K or any
other form and (ii) a description of differences between generally accepted accounting principles in the U.S. (“U.S.
GAAP”) and generally accepted accounting principles in Japan (“J-GAAP”), which are required to be described in the
Quarterly Securities Report under the Financial Instruments and Exchange Act of Japan if the Company prepares its
financial statements in conformity with accounting principles other than J-GAAP.
Cautionary Statement
Statements made in this release with respect to Sony’s current plans, estimates, strategies and beliefs and other statements
of the Company and its consolidated subsidiaries (collectively “Sony”) that are not historical facts are forward-looking
statements about the future performance of Sony. Forward-looking statements include, but are not limited to, those
statements using words such as “believe,” “expect,” “plans,” “strategy,” “prospects,” “forecast,” “estimate,” “project,”
“anticipate,” “aim,” “intend,” “seek,” “may,” “might,” “could” or “should,” and words of similar meaning in connection
with a discussion of future operations, financial performance, events or conditions. From time to time, oral or written
forward-looking statements may also be included in other materials released to the public. These statements are based on
management’s assumptions, judgments and beliefs in light of the information currently available to it. Sony cautions you
that a number of important risks and uncertainties could cause actual results to differ materially from those discussed in the
forward-looking statements, and therefore you should not place undue reliance on them. You also should not rely on any
obligation of Sony to update or revise any forward-looking statements, whether as a result of new information, future
events or otherwise. Sony disclaims any such obligation. Risks and uncertainties that might affect Sony include, but are not
limited to (i) the global economic environment in which Sony operates and the economic conditions in Sony’s markets,
particularly levels of consumer spending; (ii) foreign exchange rates, particularly between the yen and the U.S. dollar, the
euro and other currencies in which Sony makes significant sales and incurs production costs, or in which Sony’s assets and
liabilities are denominated; (iii) Sony’s ability to continue to design and develop and win acceptance of, as well as achieve
sufficient cost reductions for, its products and services, including televisions, game platforms, and smart phones, which are
offered in highly competitive markets characterized by severe price competition and continual new product and service
introductions, rapid development in technology and subjective and changing consumer preferences; (iv) Sony’s ability and
timing to recoup large-scale investments required for technology development and production capacity; (v) Sony’s ability to
implement successful business restructuring and transformation efforts under changing market conditions; (vi) Sony’s
ability to implement successful hardware, software, and content integration strategies for all segments excluding the
Financial Services segment, and to develop and implement successful sales and distribution strategies in light of the
Internet and other technological developments; (vii) Sony’s continued ability to devote sufficient resources to research and
development and, with respect to capital expenditures, to prioritize investments correctly (particularly in the electronics
businesses); (viii) Sony’s ability to maintain product quality; (ix) the effectiveness of Sony’s strategies and their execution,
including but not limited to the success of Sony’s acquisitions, joint ventures and other strategic investments (in particular
the recent acquisition of Sony Ericsson Mobile Communications AB); (x) Sony’s ability to forecast demands, manage
timely procurement and control inventories; (xi) the outcome of pending and/or future legal and/or regulatory proceedings;
(xii) shifts in customer demand for financial services such as life insurance and Sony’s ability to conduct successful asset
liability management in the Financial Services segment; (xiii) the impact of unfavorable conditions or developments
(including market fluctuations or volatility) in the Japanese equity markets on the revenue and operating income of the
Financial Services segment; and (xiv) risks related to catastrophic disasters or similar events, including the Great East Japan
Earthquake and its aftermath as well as the floods in Thailand. Risks and uncertainties also include the impact of any future
events with material adverse impact.

- 2 -
I Corporate Information
(1) Selected Consolidated Financial Data
Yen in millions, Yen per share amounts
Six Months Ended
September 30, 2011
Six Months Ended
September 30, 2012
Fiscal Year Ended
March 31, 2012
Sales and operating revenue 3,069,910 3,119,842 6,493,212
Operating income (loss) 25,865 36,526 (67,275)
Income (loss) before income taxes 23,214 29,063 (83,186)Net loss attributable to Sony Corporation’s stockholders
(42,479) (40,111) (456,660)
Comprehensive loss (140,401) (77,441) (428,413)
Total equity 2,777,826 2,328,229 2,490,107
Total assets 12,869,832 13,254,028 13,295,667Net loss attributable to Sony Corporation’s stockholders per share of common stock, basic (yen)
(42.33) (39.97) (455.03)
Net loss attributable to Sony Corporation’s stockholders per share of common stock, diluted (yen)
(42.33) (39.97) (455.03)
Ratio of stockholders’ equity to total assets (%) 18.4 14.1 15.3
Net cash provided by operating activities 149,312 49,437 519,539
Net cash used in investing activities (417,735) (470,826) (882,886)
Net cash provided by financing activities 23,950 147,974 257,336
Cash and cash equivalents at end of the period 719,020 588,827 894,576
Yen in millions, Yen per share amounts
Three months Ended
September 30, 2011
Three months Ended
September 30, 2012
Sales and operating revenue 1,574,989 1,604,659
Net loss attributable to Sony Corporation’s stockholders (26,977) (15,470) Net loss attributable to Sony Corporation’s stockholders per share of common stock, basic (yen)
(26.88) (15.41)
Notes:
1. The Company’s consolidated financial statements are prepared in conformity with U.S. GAAP.
2. The Company reports equity in net income (loss) of affiliated companies as a component of operating income (loss).
3. Consumption taxes are not included in sales and operating revenue.
4. Total equity is presented based on U.S. GAAP.
5. Ratio of stockholders’ equity to total assets is calculated by using total equity attributable to the stockholders of the
Company.
6. The Company prepares consolidated financial statements. Therefore parent-only selected financial data is not
presented.

- 3 -
(2) Business Overview
There was no significant change in the business of Sony during the six months ended September 30, 2012. Sony realigned its reportable segments effective from the first quarter of the fiscal year ending March 31, 2013. For
further information on the realignment, please refer to “IV Financial Statements – Notes to Consolidated Financial Statements – 11. Business segment information”.
As of September 30, 2012, the Company had 1,316 subsidiaries and 108 affiliated companies, of which 1,292
companies are consolidated subsidiaries (including variable interest entities) of the Company. The Company has applied the equity accounting method for 100 affiliated companies.

- 4 -
II State of Business
(1) Risk Factors
Note for readers of this English translation:
There was no significant change from the information presented in the Risk Factors section of the Annual Report on Form 20-F filed with the Securities and Exchange Commission (the “SEC”) on June 27, 2012, as amended by Amendment No.1 on Form 20-F/A filed with the SEC on July 20, 2012. Any forward-looking statement included in the descriptions below is based on the current judgment of management. URL: The Annual Report on Form 20-F filed with the SEC on June 27, 2012 http://www.sec.gov/Archives/edgar/data/313838/000119312512284981/d305818d20f.htm URL: The Amendment No.1 on Form 20-F/A filed with the SEC on July 20, 2012 http://www.sec.gov/Archives/edgar/data/313838/000119312512308053/d305818d20fa.htm
(2) Material Contracts
There were no material contracts executed during the three months ended September 30, 2012.
Note for readers of this English translation:
There was no significant change from the information presented in the Annual Report on Form 20-F (“Patents and Licenses” in item 4) filed with the SEC on June 27, 2012, as amended by the Amendment No.1 on Form 20-F/A filed with the SEC on July 20, 2012. URL: The Annual Report on Form 20-F filed with the SEC on June 27, 2012
http://www.sec.gov/Archives/edgar/data/313838/000119312512284981/d305818d20f.htm
URL: The Amendment No.1 on Form 20-F/A filed with the SEC on July 20, 2012
http://www.sec.gov/Archives/edgar/data/313838/000119312512308053/d305818d20fa.htm
(3) Management’s Discussion and Analysis of Financial Condition, Results of Operations and Status of Cash Flows
i) Results of Operations
Note for readers of this English translation:
Except for information specifically included in this English translation, this document omits certain information set out in the Japanese-language Quarterly Securities Report for the three-month period ended September 30, 2012, since it is the same as described in a press release previously submitted to the SEC. Please refer to “Consolidated Financial Results for the Second Quarter Ended September 30, 2012” submitted to the SEC on Form 6-K on November 1, 2012. URL: The press release titled “Consolidated Financial Results for the Second Quarter Ended September 30, 2012” http://www.sec.gov/Archives/edgar/data/313838/000115752312005596/a50459459.htm
- 5 -
Foreign Exchange Fluctuations and Risk Hedging
Note for readers of this English translation:
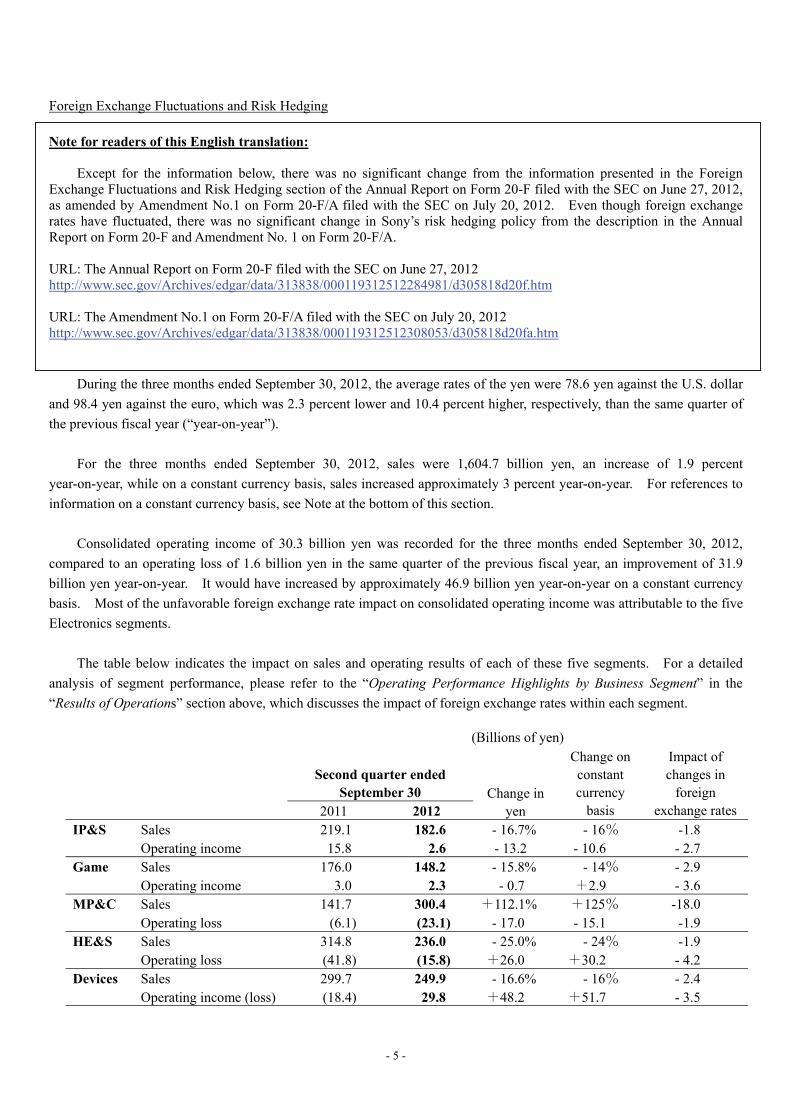
Except for the information below, there was no significant change from the information presented in the Foreign Exchange Fluctuations and Risk Hedging section of the Annual Report on Form 20-F filed with the SEC on June 27, 2012, as amended by Amendment No.1 on Form 20-F/A filed with the SEC on July 20, 2012. Even though foreign exchange rates have fluctuated, there was no significant change in Sony’s risk hedging policy from the description in the Annual Report on Form 20-F and Amendment No. 1 on Form 20-F/A. URL: The Annual Report on Form 20-F filed with the SEC on June 27, 2012 http://www.sec.gov/Archives/edgar/data/313838/000119312512284981/d305818d20f.htm URL: The Amendment No.1 on Form 20-F/A filed with the SEC on July 20, 2012 http://www.sec.gov/Archives/edgar/data/313838/000119312512308053/d305818d20fa.htm
During the three months ended September 30, 2012, the average rates of the yen were 78.6 yen against the U.S. dollar
and 98.4 yen against the euro, which was 2.3 percent lower and 10.4 percent higher, respectively, than the same quarter of
the previous fiscal year (“year-on-year”).
For the three months ended September 30, 2012, sales were 1,604.7 billion yen, an increase of 1.9 percent
year-on-year, while on a constant currency basis, sales increased approximately 3 percent year-on-year. For references to
information on a constant currency basis, see Note at the bottom of this section.
Consolidated operating income of 30.3 billion yen was recorded for the three months ended September 30, 2012,
compared to an operating loss of 1.6 billion yen in the same quarter of the previous fiscal year, an improvement of 31.9
billion yen year-on-year. It would have increased by approximately 46.9 billion yen year-on-year on a constant currency
basis. Most of the unfavorable foreign exchange rate impact on consolidated operating income was attributable to the five
Electronics segments.
The table below indicates the impact on sales and operating results of each of these five segments. For a detailed
analysis of segment performance, please refer to the “Operating Performance Highlights by Business Segment” in the
“Results of Operations” section above, which discusses the impact of foreign exchange rates within each segment.
(Billions of yen) Change on
constant currency
basis
Impact of changes in
foreign exchange rates
Second quarter ended September 30 Change in
yen 2011 2012 IP&S Sales 219.1 182.6 - 16.7% - 16% -1.8
Operating income 15.8 2.6 - 13.2 - 10.6 - 2.7 Game Sales 176.0 148.2 - 15.8% - 14% - 2.9
Operating income 3.0 2.3 - 0.7 +2.9 - 3.6 MP&C Sales 141.7 300.4 +112.1% +125% -18.0
Operating loss (6.1) (23.1) - 17.0 - 15.1 -1.9 HE&S Sales 314.8 236.0 - 25.0% - 24% -1.9
Operating loss (41.8) (15.8) +26.0 +30.2 - 4.2 Devices Sales 299.7 249.9 - 16.6% - 16% - 2.4
Operating income (loss) (18.4) 29.8 +48.2 +51.7 - 3.5

- 6 -
In addition, sales for the Pictures segment decreased 3.7 percent year-on-year to 163.0 billion yen, approximately 6
percent on a constant currency (U.S. dollar) basis. In the Music segment, sales decreased 4.3 percent year-on-year to 99.2
billion yen, approximately 6 percent on a constant currency basis. Sony’s Financial Services segment consolidates the
yen-based results of Sony Financial Holdings Inc. As most of the operations in this segment are based in Japan, Sony’s
management analyzes the performance of the Financial Services segment on a yen basis only.
Note: In this section, the descriptions of sales on a constant currency basis reflect sales obtained by applying the yen’s
monthly average exchange rates from the same quarter of the previous fiscal year to local currency-denominated monthly
sales in the three months ended September 30, 2012. The impact of foreign exchange rate fluctuations on operating
income (loss) described herein is estimated by deducting cost of sales and SGA expenses on a constant currency basis from
sales on a constant currency basis. Cost of sales and SGA expenses on a constant currency basis are obtained by applying
the yen’s monthly average exchange rates in the same quarter of the previous fiscal year to the corresponding local
currency-denominated monthly cost of sales and SGA expenses for the three months ended September 30, 2012. In
certain cases, most significantly in the Pictures segment, and Sony Music Entertainment and Sony/ATV Music Publishing
LLC in the Music segment, the constant currency amounts are after aggregation on a U.S. dollar basis. Sales and
operating income (loss) on a constant currency basis are not reflected in Sony’s consolidated financial statements and are
not measured in accordance with U.S. GAAP. Sony does not believe that these measures are a substitute for U.S. GAAP
measures. However, Sony believes that disclosing sales and operating income (loss) information on a constant currency
basis provides additional useful analytical information to investors regarding the operating performance of Sony.
Status of Cash Flows
Note for readers of this English translation:
Except for information specifically included in this English translation, this document omits certain information set out in the Japanese-language Quarterly Securities Report for the six-month period ended September 30, 2012, since it is the same as described in a press release previously submitted to the SEC. Please refer to “Consolidated Financial Results for the Second Quarter Ended September 30, 2012” submitted to the SEC on Form 6-K on November 1, 2012.
URL: The press release titled “Consolidated Financial Results for the Second Quarter Ended September 30, 2012” http://www.sec.gov/Archives/edgar/data/313838/000115752312005596/a50459459.htm
ii) Issues Facing Sony and Management’s Response to those Issues
Note for readers of this English translation:
Except as set forth below, there was no significant change from the information presented as the Issues Facing Sony and Management’s Response to those Issues in the Trend Information section of the Annual Report on Form 20-F filed with the SEC on June 27, 2012, as amended by Amendment No.1 on Form 20-F/A filed with the SEC on July 20, 2012. The change during the three months ended September 30, 2012 is indicated by underline below. Any forward-looking statement included in the descriptions below is based on the current judgment of management. URL: The Annual Report on Form 20-F filed with the SEC on June 27, 2012 http://www.sec.gov/Archives/edgar/data/313838/000119312512284981/d305818d20f.htm URL: The Amendment No.1 on Form 20-F/A filed with the SEC on July 20, 2012 http://www.sec.gov/Archives/edgar/data/313838/000119312512308053/d305818d20fa.htm

- 7 -
4. Creating new businesses and accelerating innovation
Sony will continue to aggressively promote innovation intended to deliver mid- to long-term growth, as well as the development of differentiating technologies that enhance core product value. For example, Sony is targeting mid- to long-term growth in the medical and 4K businesses. In the medical business Sony has already launched a range of medical peripherals such as printers, monitors, cameras, and recorders. Sony also plans to enter the medical equipment business, where its strengths in various core digital imaging technologies offer significant competitive advantages in applications such as endoscopes. Furthermore, Sony plans to enter the life science business where it can leverage its expertise in technologies such as semiconductor lasers, image sensors and micro fabrication. Sony is also drawing on its comprehensive strengths in audio and visual technologies to aggressively promote the growth of 4K technology, which delivers more than four times the resolution of Full HD. Incorporation of Sony-developed technologies, such as image sensors, image processing compression LSIs and high-speed optical transmission modules into its professional-use and high-end consumer products will pave the way for Sony to continue to expand and enrich its 4K-compatible product lineup. In an effort to create new businesses, Sony and Olympus Corporation (“Olympus”) entered into a business alliance agreement and a capital alliance agreement through a third-party allotment of Olympus’s common shares to Sony in September 2012, and the two companies agreed to establish a medical business venture. (For further information on the capital alliance agreement, please refer to “IV Financial Statements – Notes to Consolidated Financial Statements – 10. Commitments, contingent liabilities and other”.) Through the utilization of its leading-edge electronics technologies, such as digital imaging, 4K and 3D, Sony believes that it can create new business opportunities by offering innovative and competitive products in the area of surgical endoscopes and other related areas where future growth is anticipated.
iii) Research and Development
Note for readers of this English translation:
Excluding the below, there was no significant change from the information presented as the Research and Development
in the Annual Report on Form 20-F filed with the SEC on June 27, 2012, as amended by the Amendment No.1 on Form
20-F/A filed with the SEC on July 20, 2012.
URL: The Annual Report on Form 20-F filed with the SEC on June 27, 2012
http://www.sec.gov/Archives/edgar/data/313838/000119312512284981/d305818d20f.htm
URL: The Amendment No.1 on Form 20-F/A filed with the SEC on July 20, 2012
http://www.sec.gov/Archives/edgar/data/313838/000119312512308053/d305818d20fa.htm
There were the following significant changes in research and development activities for the period.
The R&D Platform and Common Software Platform were realigned in April 2012, as the System & Software Technology
Platform, the Advanced Device Technology Platform and the Corporate R&D to implement a process of stringent selection
and focus in the area of R&D, to enable the Company to optimize resource allocation, and to enhance R&D which leads to
generation of new businesses and establishment of next generation basic technology .
In addition, System Technology Laboratory and New Business Creating Division were integrated and realigned in July
2012, as Business Design and Innovation Laboratory to strengthen the development of new businesses.
Research and development costs for the six months ended September 30, 2012 totaled 236.6 billion yen.

- 8 -
iv) Liquidity and Capital Resources
Note for readers of this English translation:
Except for the information related to the commitment line and execution of syndicated loans below, there was no significant change from the information presented in the Annual Report on Form 20-F filed with the SEC on June 27, 2012, as amended by Amendment No.1 on Form 20-F/A filed with the SEC on July 20, 2012. The changes are indicated by underline below. Any forward-looking statement included in the descriptions below is based on the current judgment of management.
URL: The Annual Report on Form 20-F filed with the SEC on June 27, 2012 http://www.sec.gov/Archives/edgar/data/313838/000119312512284981/d305818d20f.htm URL: The Amendment No.1 on Form 20-F/A filed with the SEC on July 20, 2012 http://www.sec.gov/Archives/edgar/data/313838/000119312512308053/d305818d20fa.htm
Sony typically raises funds through straight bonds, CP programs and bank loans (including syndicated loans). If
market disruption and volatility occur and if Sony could not raise sufficient funds from these sources, Sony may also draw
down funds from contractually committed lines of credit from various financial institutions. Sony has a total, translated
into yen, of 748.2 billion yen in unused committed lines of credit as of September 30, 2012. Details of those committed
lines of credit are: a 475.0 billion yen committed line of credit contracted with a syndicate of Japanese banks, effective until
November 2014, a 1.5 billion U.S. dollar multi-currency committed line of credit also with a syndicate of Japanese banks,
effective until December 2013, and a 2.02 billion U.S. dollar multi-currency committed line of credit contracted with a
syndicate of foreign banks, effective until April 2015, in all of which Sony Corporation and its consolidated subsidiary,
Sony Global Treasury Services Plc are defined as borrowers. These contracts are aimed at securing sufficient liquidity in
a quick and stable manner even in the event of turmoil within the financial and capital markets.
Sony executed a syndicated loan totaling 65.0 billion yen in July 2012 (with a maturity of 3 to 6 years). The
proceeds of the loan were used for general corporate purposes.

- 9 -
Ⅲ Company Information
(1) Information on the Company’s Shares
i) Total Number of Shares
1) Total Number of Shares
Class Total number of shares authorized to be issued
Common stock 3,600,000,000
Total 3,600,000,000
2) Number of Shares Issued
Class
Number of shares issued Name of Securities Exchanges
where the shares are listed or
authorized Financial
Instruments Firms Association
where the shares are registered
Description
As of the end of the
second quarterly
period
(September 30, 2012)
As of the filing date of
the Quarterly
Securities Report
(November 9, 2012)
Common
stock 1,004,638,164 1,004,638,164
Tokyo Stock Exchange
Osaka Securities Exchange
New York Stock Exchange
London Stock Exchange
The number of
shares constituting
one full unit is one
hundred (100).
Total 1,004,638,164 1,004,638,164 — —
Notes: 1. The Company’s shares of common stock are listed on the First Sections of the Tokyo Stock Exchange and the Osaka
Securities Exchange in Japan. 2. The number of shares issued as of the filing date of this Quarterly Securities Report does not include shares issued
upon the exercise of stock acquisition rights (“SARs”) during November 2012, the month in which this Quarterly Securities Report (Shihanki Houkokusho) was filed.
ii) Stock Acquisition Rights
Not applicable.
Note for readers of this English translation:
The above means that there was no issuance of SARs during the three months ended September 30, 2012.
iii) Status of the Exercise of Moving Strike Convertible Bonds
Not applicable.
iv) Description of Rights Plan
Not applicable.

- 10 -
v) Changes in the Total Number of Shares Issued and the Amount of Common Stock, etc.
Period
Change in the
total number of
shares issued
Balance of the
total number of
shares issued
Change in
the amount of
common stock
Balance of
the amount of
common stock
Change in the
legal capital
surplus
Balance of the
legal capital
surplus
(Thousands) (Thousands) (Yen in Millions) (Yen in Millions) (Yen in Millions) (Yen in Millions)
From July 1 to
September 30,
2012
- 1,004,638 - 630,923 - 837,611
Note: The total number of shares issued, the amount of common stock and the legal capital surplus did not change during the period from October 1, 2012 to October 31, 2012.

- 11 -
vi) Status of Major Shareholders
(As of September 30, 2012)
Name Address
Number of
shares held
(Thousands)
Percentage
of shares held
to total shares
issued (%)
Moxley and Co. LLC *1
(Local Custodian: The Bank of Tokyo-Mitsubishi
UFJ, Ltd.)
New York, U.S.A.
(2-7-1, Marunouchi, Chiyoda-ku,
Tokyo)
69,745 6.94
Japan Trustee Services Bank, Ltd.
(Trust account) *2 1-8-11, Harumi, Chuo-ku, Tokyo 62,660 6.24
The Master Trust Bank of Japan, Ltd.
(Trust account) *2
2-11-3, Hamamatsu-cho, Minato-ku,
Tokyo 49,363 4.91
SSBT OD05 Omnibus Account - Treaty Clients *3
(Local Custodian: The Hongkong and Shanghai
Banking Corporation Limited)
Sydney, Australia
(3-11-1, Nihonbashi, Chuo-ku,
Tokyo)
22,958 2.29
Japan Trustee Services Bank, Ltd.
(Trust account 9) *2 1-8-11, Harumi, Chuo-ku, Tokyo 13,683 1.36
Japan Trustee Services Bank, Ltd.
(Trust account 1) *2 1-8-11, Harumi, Chuo-ku, Tokyo 11,373 1.13
State Street Bank and Trust Company *3
(Local Custodian: The Hongkong and Shanghai
Banking Corporation Limited)
Boston, U.S.A.
(3-11-1, Nihonbashi, Chuo-ku,
Tokyo)
10,977 1.09
Japan Trustee Services Bank, Ltd.
(Trust account 6) *2 1-8-11, Harumi, Chuo-ku, Tokyo 10,970 1.09
Japan Trustee Services Bank, Ltd.
(Trust account 3) *2 1-8-11, Harumi, Chuo-ku, Tokyo 10,330 1.03
Tam Two *3
(Local Custodian: The Bank of Tokyo-Mitsubishi
UFJ, Ltd.)
Riyadh, Kingdom of Saudi Arabia
(2-7-1, Marunouchi, Chiyoda-ku,
Tokyo)
9,982 0.99
Total 272,040 27.08
Notes: *1. Moxley and Co. LLC is the nominee of JPMorgan Chase Bank, N.A., which is the Depositary for holders of the
Company’s American Depositary Receipts (“ADRs”). *2. The shares held by each shareholder are held in trust for investors, including shares in securities investment trusts. *3. Each shareholder provides depositary services for shares owned by institutional investors, mainly in Europe and North
America. They are also the nominees for these investors.
- 12 -
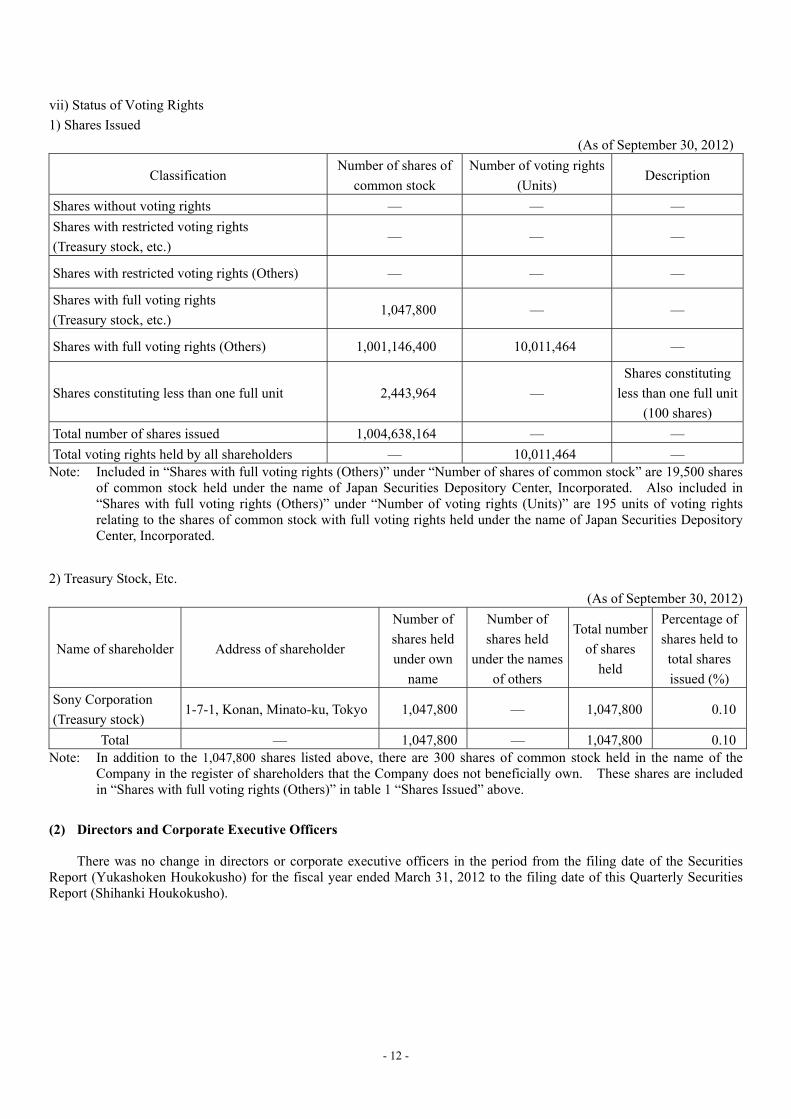
vii) Status of Voting Rights
1) Shares Issued
(As of September 30, 2012)
Classification Number of shares of
common stock
Number of voting rights
(Units) Description
Shares without voting rights — — —
Shares with restricted voting rights
(Treasury stock, etc.) — — —
Shares with restricted voting rights (Others) — — —
Shares with full voting rights
(Treasury stock, etc.) 1,047,800 — —
Shares with full voting rights (Others) 1,001,146,400 10,011,464 —
Shares constituting less than one full unit 2,443,964 —
Shares constituting
less than one full unit
(100 shares)
Total number of shares issued 1,004,638,164 — —
Total voting rights held by all shareholders — 10,011,464 — Note: Included in “Shares with full voting rights (Others)” under “Number of shares of common stock” are 19,500 shares
of common stock held under the name of Japan Securities Depository Center, Incorporated. Also included in “Shares with full voting rights (Others)” under “Number of voting rights (Units)” are 195 units of voting rights relating to the shares of common stock with full voting rights held under the name of Japan Securities Depository Center, Incorporated.
2) Treasury Stock, Etc.
(As of September 30, 2012)
Name of shareholder Address of shareholder
Number of
shares held
under own
name
Number of
shares held
under the names
of others
Total number
of shares
held
Percentage of
shares held to
total shares
issued (%)
Sony Corporation
(Treasury stock) 1-7-1, Konan, Minato-ku, Tokyo 1,047,800 — 1,047,800 0.10
Total — 1,047,800 — 1,047,800 0.10Note: In addition to the 1,047,800 shares listed above, there are 300 shares of common stock held in the name of the
Company in the register of shareholders that the Company does not beneficially own. These shares are included in “Shares with full voting rights (Others)” in table 1 “Shares Issued” above.
(2) Directors and Corporate Executive Officers
There was no change in directors or corporate executive officers in the period from the filing date of the Securities Report (Yukashoken Houkokusho) for the fiscal year ended March 31, 2012 to the filing date of this Quarterly Securities Report (Shihanki Houkokusho).

- 13 -
IV Financial Statements Page
(1) Consolidated Financial Statements 14
(i) Consolidated Balance Sheets 14
(ii) Consolidated Statements of Income 16
(iii) Consolidated Statements of Comprehensive Income 18
(iv) Consolidated Statements of Cash Flows 19
(2) Other Information 40

- 14 -
(1) Consolidated Financial Statements (i) Consolidated Balance Sheets (Unaudited) Sony Corporation and Consolidated Subsidiaries
Yen in millions
At March 31, 2012
At September 30, 2012
ASSETS Current assets: Cash and cash equivalents 894,576 588,827
Marketable securities 680,913 634,395Notes and accounts receivable, trade 840,924 791,297Allowance for doubtful accounts and sales returns (71,009) (56,246)Inventories 707,052 838,102Other receivables 202,044 207,592Deferred income taxes 36,769 37,258Prepaid expenses and other current assets 463,693 430,412
Total current assets 3,754,962 3,471,637
Film costs 270,048 253,460
Investments and advances:
Affiliated companies 36,800 60,235
Securities investments and other 6,282,676 6,644,691
6,319,476 6,704,926
Property, plant and equipment: Land 139,413 138,168
Buildings 817,730 800,354
Machinery and equipment 1,957,134 1,944,492
Construction in progress 35,648 38,691
2,949,925 2,921,705
Less – Accumulated depreciation 2,018,927 2,011,272
930,998 910,433
Other assets: Intangibles, net 503,699 470,965
Goodwill 576,758 579,219
Deferred insurance acquisition costs 441,236 446,530
Deferred income taxes 100,460 102,490
Other 398,030 314,368
2,020,183 1,913,572
Total assets 13,295,667 13,254,028
(Continued on following page.)
- 15 -
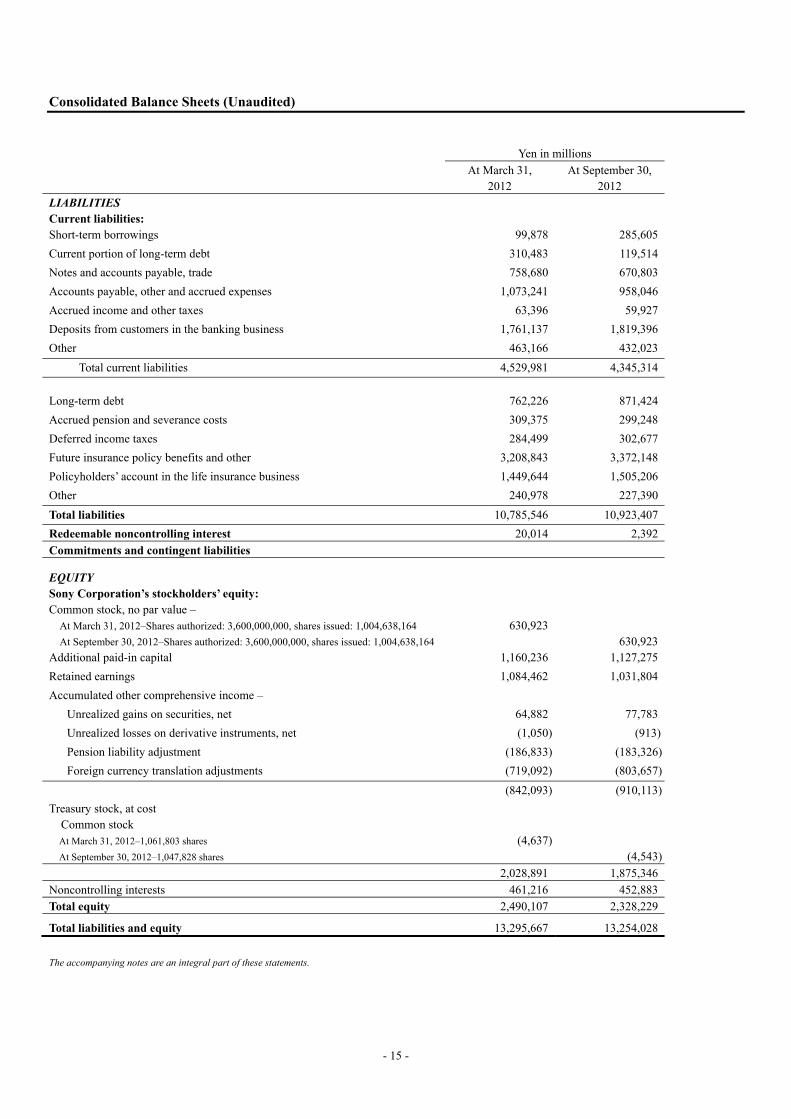
Consolidated Balance Sheets (Unaudited)
Yen in millions
At March 31, 2012
At September 30, 2012
LIABILITIES Current liabilities: Short-term borrowings 99,878 285,605
Current portion of long-term debt 310,483 119,514
Notes and accounts payable, trade 758,680 670,803
Accounts payable, other and accrued expenses 1,073,241 958,046
Accrued income and other taxes 63,396 59,927
Deposits from customers in the banking business 1,761,137 1,819,396
Other 463,166 432,023
Total current liabilities 4,529,981 4,345,314
Long-term debt 762,226 871,424
Accrued pension and severance costs 309,375 299,248
Deferred income taxes 284,499 302,677
Future insurance policy benefits and other 3,208,843 3,372,148
Policyholders’ account in the life insurance business 1,449,644 1,505,206
Other 240,978 227,390
Total liabilities 10,785,546 10,923,407
Redeemable noncontrolling interest 20,014 2,392
Commitments and contingent liabilities
EQUITY Sony Corporation’s stockholders’ equity: Common stock, no par value –
At March 31, 2012–Shares authorized: 3,600,000,000, shares issued: 1,004,638,164
At September 30, 2012–Shares authorized: 3,600,000,000, shares issued: 1,004,638,164
630,923630,923
Additional paid-in capital 1,160,236 1,127,275
Retained earnings 1,084,462 1,031,804
Accumulated other comprehensive income –
Unrealized gains on securities, net 64,882 77,783
Unrealized losses on derivative instruments, net (1,050) (913)
Pension liability adjustment (186,833) (183,326)
Foreign currency translation adjustments (719,092) (803,657)
(842,093) (910,113)
Treasury stock, at cost Common stock
At March 31, 2012–1,061,803 shares
At September 30, 2012–1,047,828 shares (4,637)
(4,543)
2,028,891 1,875,346
Noncontrolling interests 461,216 452,883
Total equity 2,490,107 2,328,229
Total liabilities and equity 13,295,667 13,254,028
The accompanying notes are an integral part of these statements.
- 16 -
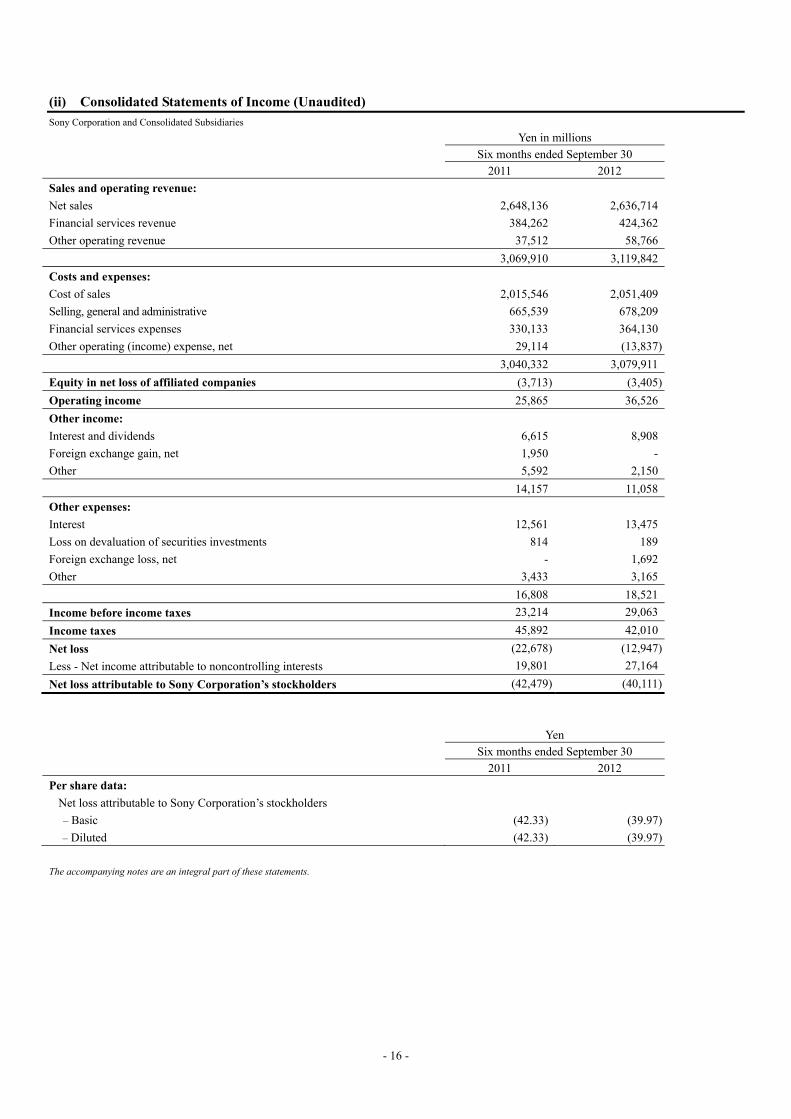
(ii) Consolidated Statements of Income (Unaudited) Sony Corporation and Consolidated Subsidiaries
Yen in millions
Six months ended September 30
2011 2012
Sales and operating revenue:
Net sales 2,648,136 2,636,714
Financial services revenue 384,262 424,362
Other operating revenue 37,512 58,766
3,069,910 3,119,842
Costs and expenses:
Cost of sales 2,015,546 2,051,409
Selling, general and administrative 665,539 678,209
Financial services expenses 330,133 364,130
Other operating (income) expense, net 29,114 (13,837)
3,040,332 3,079,911
Equity in net loss of affiliated companies (3,713) (3,405)
Operating income 25,865 36,526
Other income:
Interest and dividends 6,615 8,908
Foreign exchange gain, net 1,950 -
Other 5,592 2,150
14,157 11,058
Other expenses:
Interest 12,561 13,475
Loss on devaluation of securities investments 814 189
Foreign exchange loss, net - 1,692
Other 3,433 3,165
16,808 18,521
Income before income taxes 23,214 29,063
Income taxes 45,892 42,010
Net loss (22,678) (12,947)
Less - Net income attributable to noncontrolling interests 19,801 27,164
Net loss attributable to Sony Corporation’s stockholders (42,479) (40,111)
Yen
Six months ended September 30
2011 2012
Per share data: - -
Net loss attributable to Sony Corporation’s stockholders
– Basic (42.33) (39.97)
– Diluted (42.33) (39.97)
The accompanying notes are an integral part of these statements.

- 17 -
Consolidated Statements of Income (Unaudited) Sony Corporation and Consolidated Subsidiaries
Yen
Three months ended September 30
2011 2012
Per share data: -
Net loss attributable to Sony Corporation’s stockholders
– Basic (26.88) (15.41)
– Diluted (26.88) (15.41)
The accompanying notes are an integral part of these statements.
Yen in millions
Three months ended September 30
2011 2012
Sales and operating revenue:
Net sales 1,372,196 1,341,262
Financial services revenue 183,359 230,645
Other operating revenue 19,434 32,752
1,574,989 1,604,659
Costs and expenses:
Cost of sales 1,041,977 1,044,996
Selling, general and administrative 345,393 331,459
Financial services expenses 158,485 198,478
Other operating (income) expense, net 31,891 (3,651)
1,577,746 1,571,282
Equity in net income (loss) of affiliated companies 1,122 (3,126)
Operating income (loss) (1,635) 30,251
Other income:
Interest and dividends 2,341 3,198
Foreign exchange gain, net 5,585 -
Other 3,274 953
11,200 4,151
Other expenses:
Interest 6,449 5,912
Loss on devaluation of securities investments 536 187
Foreign exchange loss, net - 7,114
Other 2,485 1,539
9,470 14,752
Income before income taxes 95 19,650
Income taxes 18,358 22,008
Net loss (18,263) (2,358)
Less - Net income attributable to noncontrolling interests 8,714 13,112
Net loss attributable to Sony Corporation’s stockholders (26,977) (15,470)

- 18 -
(iii) Consolidated Statements of Comprehensive Income (Unaudited) Sony Corporation and Consolidated Subsidiaries
Yen in millions
Six months ended September 30
2011 2012
Net loss (22,678) (12,947)
Other comprehensive income, net of tax ―
Unrealized gains on securities 19,095 18,652
Unrealized gains on derivative instruments 1,829 137
Pension liability adjustment 2,078 2,046
Foreign currency translation adjustments (140,725) (85,329)
Total comprehensive loss (140,401) (77,441)
Less – Comprehensive income attributable to noncontrolling interests 25,842 30,690
Comprehensive loss attributable to Sony Corporation's stockholders (166,243) (108,131)
Yen in millions
Three months ended September 30
2011 2012
Net loss (18,263) (2,358)
Other comprehensive income, net of tax ―
Unrealized gains on securities 706 18,545
Unrealized gains (losses) on derivative instruments 1,377 (29)
Pension liability adjustment 1,505 436
Foreign currency translation adjustments (111,302) (6,190)
Total comprehensive income (loss) (125,977) 10,404
Less – Comprehensive income attributable to noncontrolling interests 8,255 16,821
Comprehensive loss attributable to Sony Corporation's stockholders (134,232) (6,417)
The accompanying notes are an integral part of these statements.

- 19 -
(iv) Consolidated Statements of Cash Flows (Unaudited) Sony Corporation and Consolidated Subsidiaries
(Continued on following page.)
Yen in millions
Six months ended September 30
2011 2012
Cash flows from operating activities:
Net loss (22,678) (12,947) Adjustments to reconcile net loss to net cash
provided by operating activities –
Depreciation and amortization, including amortization of deferred insurance acquisition costs 161,566 163,521
Amortization of film costs 77,394 85,707 Stock-based compensation expense 1,165 764 Accrual for pension and severance costs, less payments 127 (3,120) Other operating (income) expense, net 29,114 (13,837) Loss on devaluation of securities investments 814 189
Loss on revaluation of marketable securities held in the financial service business for trading purpose, net 24,513 16,538
Loss on revaluation or impairment of securities investments held in the financial service business, net 8,770 3,175
Deferred income taxes (15,759) 3,905 Equity in net loss of affiliated companies, net of dividends 19,078 3,734
Changes in assets and liabilities:
Increase in notes and accounts receivable, trade (26,568) (16,944) Increase in inventories (197,318) (159,456) Increase in film costs (91,296) (84,164) (Decrease) increase in notes and accounts payable, trade 75,387 (55,729) (Decrease) increase in accrued income and other taxes 10,265 (5,786) Increase in future insurance policy benefits and other 140,622 161,526 Increase in deferred insurance acquisition costs (35,172) (36,011) Increase in marketable securities held in the
financial service business for trading purpose (16,304) (13,725) (Increase) decrease in other current assets (91,790) 3,863 (Decrease) increase in other current liabilities 16,539 (48,879) Other 80,843 57,113
Net cash provided by operating activities 149,312 49,437

- 20 -
Consolidated Statements of Cash Flows (Unaudited)
Yen in millions
Six months ended September 30
2011 2012
Cash flows from investing activities:
Payments for purchases of fixed assets (184,209) (151,314) Proceeds from sales of fixed assets 6,124 17,801Payments for investments and advances by financial service business (503,407) (528,155)Payments for investments and advances (other than financial service business) (11,095) (33,884)
Proceeds from sales or return of investments and collections of advances by financial service business 247,931
178,266
Proceeds from sales or return of investments and collections of advances (other than financial service business) 21,344
21,403
Proceeds from sales of businesses 2,502 51,831Other 3,075 (26,774)
Net cash used in investing activities (417,735) (470,826)
Cash flows from financing activities:
Proceeds from issuance of long-term debt 839 149,521 Payments of long-term debt (77,737) (227,185) Increase in short-term borrowings, net 77,897 185,580Increase in deposits from customers in the financial service business, net 42,346 115,590
Dividends paid (12,505) (12,488) Payment for purchase of So-net shares from noncontrolling interests - (54,920) Other (6,890) (8,124)
Net cash provided by financing activities 23,950 147,974
Effect of exchange rate changes on cash and cash equivalents (50,919) (32,334)
Net decrease in cash and cash equivalents (295,392) (305,749)Cash and cash equivalents at beginning of the fiscal year 1,014,412 894,576
Cash and cash equivalents at end of the period 719,020 588,827
The accompanying notes are an integral part of these statements.

- 21 -
Index to Notes to Consolidated Financial Statements Sony Corporation and Consolidated Subsidiaries
Notes to Consolidated Financial Statements Page
1. Summary of significant accounting policies 22
2. Marketable securities and securities investments 24
3. Fair value measurements 25
4. Supplemental equity and comprehensive income information 27
5. Thai Floods 28
6. EMI Music Publishing investment 28
7. Chemical products related business divestiture 28
8. Acquisition of Gaikai 28
9. Reconciliation of the differences between basic and diluted EPS 29
10. Commitments, contingent liabilities and other 30
11. Business segment information 32
12. Subsequent events 39

- 22 -
Notes to Consolidated Financial Statements (Unaudited) Sony Corporation and Consolidated Subsidiaries
1. Summary of significant accounting policies
The accompanying consolidated financial statements are presented in accordance with accounting principles generally accepted in the United States of America (“U.S. GAAP”), except for certain disclosures which have been omitted. Certain adjustments and reclassifications have been incorporated in the accompanying consolidated financial statements to conform with U.S. GAAP. These adjustments were not recorded in the statutory books and records as Sony Corporation and its subsidiaries in Japan maintain their records and prepare their statutory financial statements in accordance with accounting principles generally accepted in Japan while its foreign subsidiaries maintain their records and prepare their financial statements in conformity with accounting principles generally accepted in the countries of their domiciles.
(1) Recently adopted accounting pronouncements:
Accounting for costs associated with acquiring or renewing insurance contracts -
In October 2010, the Financial Accounting Standards Board (“FASB”) issued new accounting guidance for costs associated with acquiring or renewing insurance contracts. Under the new guidance, acquisition costs are to include only those costs that are directly related to the acquisition or renewal of insurance contracts by applying a model similar to the accounting for loan origination costs. An entity may defer incremental direct costs of contract acquisitions that are incurred in transactions with independent third parties or employees as well as the portion of employee compensation and other costs directly related to underwriting, policy issuance and processing, medical inspection, and contract selling for successfully negotiated contracts. Additionally, an entity may capitalize as a deferred acquisition cost only those advertising costs meeting the capitalization criteria for direct-response advertising. This guidance was effective for Sony as of April 1, 2012. Sony applied this guidance prospectively from the date of adoption. The adoption of this guidance did not have a material impact on Sony’s results of operations and financial position.
Testing goodwill for impairment -
In September 2011, the FASB issued a new standard to simplify how an entity tests goodwill for impairment. The new standard allows companies an option to first assess qualitative factors to determine whether it is more likely than not that the fair value of a reporting unit is less than its carrying amount as a basis for determining if it is necessary to perform the two-step quantitative goodwill impairment test. Under the new standard, a company is no longer required to calculate the fair value of a reporting unit unless the company determines, based on the qualitative assessment, that it is more likely than not that its fair value is less than its carrying amount. The new standard is effective for annual and interim goodwill impairment tests performed for fiscal years beginning after December 15, 2011. This standard was effective for Sony as of April 1, 2012. The adoption of this standard did not have a material impact on Sony’s results of operations and financial position.
Presentation of comprehensive income -
In June 2011, the FASB issued new accounting guidance for the presentation of comprehensive income. The amendments require reporting entities to report components of comprehensive income in either a continuous statement of comprehensive income or two separate but consecutive statements. This change is effective for fiscal years, and interim periods within those years, beginning after December 15, 2011 and is applied retrospectively. Subsequently, in December 2011, the FASB issued updated accounting guidance for deferral of the effective date for amendments to the presentation of reclassifications of items out of accumulated other comprehensive income. The remaining requirements of the guidance issued in June 2011 become effective as originally issued. The guidance was effective for Sony as of April 1, 2012. Since this guidance impacts disclosures only, its adoption did not have an impact on Sony’s results of operations and financial position.
(2) Change in depreciation method:
Effective April 1, 2012, Sony Corporation and its Japanese subsidiaries changed the depreciation method for property, plant and equipment, except for certain semiconductor manufacturing facilities and buildings whose depreciation is computed on the straight-line method, from the declining-balance method to the straight-line method. Concurrently, estimated useful lives for certain assets were also changed. Sony believes that the straight-line method better reflects the pattern of consumption of the estimated future benefits to be derived from those assets being depreciated and provides a better matching of costs and revenues over the assets’ estimated useful lives.
- 23 -
In accordance with the accounting guidance for a change in accounting estimate effected by a change in accounting
principle, a change in depreciation method is treated on a prospective basis as a change in estimate and prior period results have not been restated. The net effect of the changes caused a decrease in depreciation expense of 2,493 million yen and 5,233 million yen for the three and six months ended September 30, 2012, respectively, which is primarily included in cost of sales in the consolidated statements of income. Net loss attributable to Sony Corporation’s stockholders, basic net loss per share attributable to Sony Corporation’s stockholders and diluted net loss per share attributable to Sony Corporation’s stockholders decreased by 2,307 million yen, 2.30 yen and 2.30 yen, respectively, for the three ended September 30, 2012, and decreased by 4,103 million yen, 4.09 yen and 4.09 yen, respectively, for the six months ended September 30, 2012.
(3) Accounting methods used specifically for interim consolidated financial statements:
Income Taxes -
Sony estimates the annual effective tax rate (“ETR”) derived from a projected annual net income before taxes and calculates the interim period income tax provision based on the year-to-date income tax provision computed by applying the ETR to the year-to-date net income before taxes at the end of each interim period. The income tax provision based on the ETR reflects anticipated income tax credits and net operating loss carryforwards; however, it excludes the income tax provision related to significant unusual or extraordinary transactions. Such income tax provision is separately reported from the provision based on the ETR in the interim period in which they occur.
(4) Out of period adjustment:
In the first quarter of the fiscal year ended March 31, 2012, Sony recorded an out of period adjustment to correct an error in the calculation of indirect taxes at a subsidiary. The indirect tax calculation error began in 2005 and continued until it was identified by Sony in the first quarter of the fiscal year ended March 31, 2012. The adjustment, which primarily related to the Home Entertainment & Sound segment, impacted net sales, selling, general and administrative expenses and interest expenses and, in the aggregate, decreased income before income taxes in consolidated statements of income by 4,413 million yen for the six months ended September 30, 2011. Sony determined that the adjustment was not material to the consolidated financial statements for the three and six months ended September 30, 2011 or any prior annual or interim periods and for the year ended March 31, 2012.

- 24 -
2. Marketable securities and securities investments Marketable securities and securities investments, mainly included in the Financial Services segment, are comprised of debt
and equity securities of which the aggregate cost, gross unrealized gains and losses and fair value pertaining to available-for-sale securities and held-to-maturity securities are as follows:
Yen in millions March 31, 2012 September 30, 2012
Cost
Gross unrealized
gains
Gross unrealized
losses Fair value Cost
Gross unrealized
gains
Gross unrealized
losses Fair value Available-for-sale: Debt securities:
Japanese national government bonds
1,036,946
55,384 (879) 1,091,451 1,082,571
76,594
(750) 1,158,415
Japanese local government bonds
33,513
163 (1) 33,675 66,810
174
(16) 66,968
Japanese corporate bonds
293,885
1,489
(224) 295,150 250,953
1,397
(134) 252,216
Foreign corporate bonds 377,609 4,705 (7,063) 375,251 386,333 3,384 (6,463) 383,254 Other 22,383 1,548 (6) 23,925 21,341 1,501 - 22,842
1,764,336 63,289 (8,173) 1,819,452 1,808,008 83,050 (7,363) 1,883,695
Equity securities 60,694 53,016 (1,513) 112,197 52,660 54,174 (7,114) 99,720 Held-to-maturity securities:
Japanese national government bonds
3,404,069
157,740
(4,499) 3,557,310 3,634,427
206,922
(1,161) 3,840,188
Japanese local government bonds
12,592
277 - 12,869 10,968
339
(0) 11,307
Japanese corporate
bonds
31,379
1,501 - 32,880 30,145
1,887
- 32,032
Foreign corporate bonds 46,441 10 - 46,451 43,709 12 - 43,721 3,494,481 159,528 (4,499) 3,649,510 3,719,249 209,160 (1,161) 3,927,248
Total 5,319,511 275,833 (14,185) 5,581,159 5,579,917 346,384 (15,638) 5,910,663

- 25 -
3. Fair value measurements
The fair value of Sony’s assets and liabilities that are measured at fair value on a recurring basis are as follows:
Yen in millions March 31, 2012 Presentation in the consolidated balance sheets
Level 1 Level 2 Level 3 Total Marketable securities
Securities investments
and other
Other current assets/
liabilities
Other noncurrent
assets/ liabilities
Assets:
Trading securities 214,036 219,455 - 433,491 433,491 - - -Available-for-sale
securities
Debt securities Japanese national
government bonds
-
1,091,451 - 1,091,451 23,267
1,068,184
- - Japanese local
government bonds
-
33,675 - 33,675 1,405
32,270
- - Japanese corporate
bonds
-
293,637 1,513 295,150 123,434
171,716
- - Foreign corporate
bonds
-
359,960 15,291 375,251 75,764
299,487
- - Other - 23,616 309 23,925 - 23,925 - - Equity securities 111,517 680 - 112,197 - 112,197 - -
Other investments *1 5,475 4,592 73,451 83,518 - 83,518 - -Derivative assets *2 - 18,518 - 18,518 - - 18,513 5Total assets 331,028 2,045,584 90,564 2,467,176 657,361 1,791,297 18,513 5
Liabilities: Derivative liabilities *2 - 41,218 - 41,218 - - 40,034 1,184Total liabilities - 41,218 - 41,218 - - 40,034 1,184

- 26 -
Yen in millions September 30, 2012 Presentation in the consolidated balance sheets
Level 1 Level 2 Level 3 Total Marketable securities
Securities investments
and other
Other current assets/
liabilities
Other noncurrent
assets/ liabilities
Assets:
Trading securities 205,732 224,381 - 430,113 430,113 - - -Available-for-sale
securities
Debt securities Japanese national
government bonds
-
1,158,415 - 1,158,415 29,484
1,128,931
- - Japanese local
government bonds
-
66,968 - 66,968 1,402
65,566
- - Japanese corporate
bonds
-
250,002 2,214 252,216 88,580
163,636
- - Foreign corporate
bonds
-
365,309 17,945 383,254 68,860
314,394
- - Other - 22,526 316 22,842 178 22,664 - - Equity securities 98,898 822 - 99,720 - 99,720 - -
Other investments *1 5,251 4,280 70,252 79,783 - 79,783 - -Derivative assets *2 - 13,919 - 13,919 - - 13,872 47Total assets 309,881 2,106,622 90,727 2,507,230 618,617 1,874,694 13,872 47
Liabilities: Derivative liabilities *2 - 43,359 - 43,359 - - 42,443 916Total liabilities - 43,359 - 43,359 - - 42,443 916
*1 Other investments include certain hybrid financial instruments and certain private equity investments.
*2 Derivative assets and liabilities are recognized and disclosed on a gross basis.
- 27 -
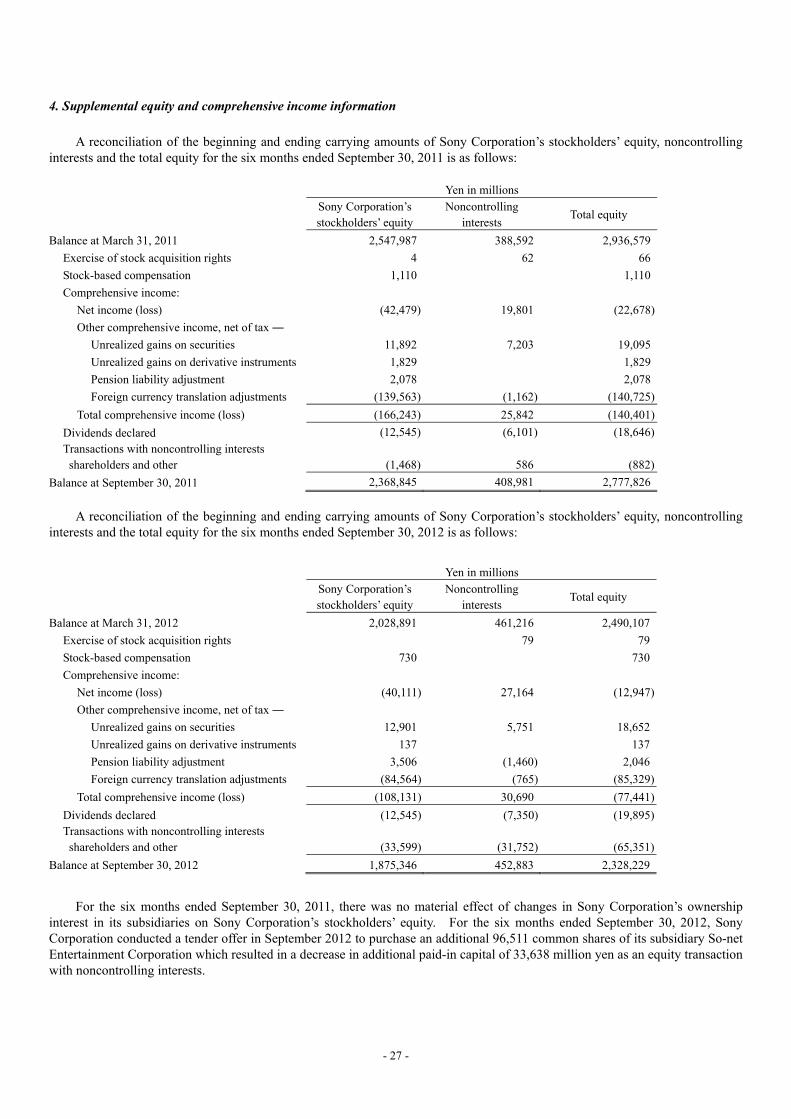
4. Supplemental equity and comprehensive income information
A reconciliation of the beginning and ending carrying amounts of Sony Corporation’s stockholders’ equity, noncontrolling
interests and the total equity for the six months ended September 30, 2011 is as follows: Yen in millions
Sony Corporation’s stockholders’ equity
Noncontrolling interests
Total equity
Balance at March 31, 2011 2,547,987 388,592 2,936,579
Exercise of stock acquisition rights 4 62 66
Stock-based compensation 1,110 1,110
Comprehensive income:
Net income (loss) (42,479) 19,801 (22,678)
Other comprehensive income, net of tax ―
Unrealized gains on securities 11,892 7,203 19,095
Unrealized gains on derivative instruments 1,829 1,829
Pension liability adjustment 2,078 2,078
Foreign currency translation adjustments (139,563) (1,162) (140,725)
Total comprehensive income (loss) (166,243) 25,842 (140,401)
Dividends declared (12,545) (6,101) (18,646)
Transactions with noncontrolling interests shareholders and other (1,468) 586 (882)
Balance at September 30, 2011 2,368,845 408,981 2,777,826
A reconciliation of the beginning and ending carrying amounts of Sony Corporation’s stockholders’ equity, noncontrolling
interests and the total equity for the six months ended September 30, 2012 is as follows:
Yen in millions
Sony Corporation’s stockholders’ equity
Noncontrolling interests
Total equity
Balance at March 31, 2012 2,028,891 461,216 2,490,107
Exercise of stock acquisition rights 79 79
Stock-based compensation 730 730
Comprehensive income:
Net income (loss) (40,111) 27,164 (12,947)
Other comprehensive income, net of tax ―
Unrealized gains on securities 12,901 5,751 18,652
Unrealized gains on derivative instruments 137 137
Pension liability adjustment 3,506 (1,460) 2,046
Foreign currency translation adjustments (84,564) (765) (85,329)
Total comprehensive income (loss) (108,131) 30,690 (77,441)
Dividends declared (12,545) (7,350) (19,895)Transactions with noncontrolling interests shareholders and other (33,599) (31,752) (65,351)
Balance at September 30, 2012 1,875,346 452,883 2,328,229
For the six months ended September 30, 2011, there was no material effect of changes in Sony Corporation’s ownership interest in its subsidiaries on Sony Corporation’s stockholders’ equity. For the six months ended September 30, 2012, Sony Corporation conducted a tender offer in September 2012 to purchase an additional 96,511 common shares of its subsidiary So-net Entertainment Corporation which resulted in a decrease in additional paid-in capital of 33,638 million yen as an equity transaction with noncontrolling interests.

- 28 -
5. Thai Floods
In October 2011, certain of Sony’s Thailand subsidiaries temporarily closed operations due to significant floods (the
“Floods”). The Floods caused significant damage to certain fixed assets including buildings, machinery and equipment as well as inventories in manufacturing sites and warehouses located in Thailand. In addition, the Floods impacted the operations of certain Sony subsidiaries in Japan and other countries.
Insurance claims in the amount of 41,172 million yen were agreed to by the insurance carriers for the six months ended
September 30, 2012 and were fully received by October 2012. Insurance claims agreed to by the insurance carriers for the three months ended September 30, 2012 were 19,365 million yen and a substantial portion was received in October 2012. Of the total agreed amount of 41,172 million yen, 33,553 million yen related to insurance recoveries for fixed assets, inventories and additional expenses, and business interruption insurance recoveries which applied to the lost profit that occurred from January 1, 2012 to May 31, 2012 in addition to the unsettled portion of insurance claimed in the fiscal year ended March 31, 2012. The remaining 7,619 million yen mainly related to insurance claims deemed probable of collection and recorded as receivables in the fiscal year ended March 31, 2012. The recoveries were primarily recorded in other operating revenue and other operating (income) expense, net in the consolidated statements of income and offset charges relating to damages and losses, resulting in a net benefit of 13,230 million yen and 29,676 million yen during the three and six months ended September 30, 2012, respectively.
6. EMI Music Publishing investment
On June 29, 2012, an investor group which included a wholly owned subsidiary of Sony Corporation completed its
acquisition of EMI Music Publishing. To effect the acquisition, the investor group formed DH Publishing, L.P. (“DHP”) which acquired EMI Music Publishing for total consideration of 2.2 billion U.S. dollars. Sony invested 320 million U.S. dollars in DHP, through Nile Acquisition LLC, for a 39.8% equity interest. Nile Acquisition LLC is a joint venture with the third party investor of Sony’s U.S. based music publishing subsidiary in which Sony holds a 74.9% ownership interest. In addition, DHP entered into an agreement with Sony’s U.S. based music publishing subsidiary in which the subsidiary will provide administration services to DHP (the “Administration Agreement”). Sony accounts for its interest in DHP under the equity method. DHP was determined to be a variable interest entity (“VIE”) as many of the decision making rights for the entity do not reside within the entity’s equity interests, but rather are embedded in the Administration Agreement. Under the terms of the Administration Agreement, the largest non-Sony shareholder has approval rights over decisions regarding the activities that most significantly impact DHP, including the acquision and retention of copyrights and the licensing of songs. These approval rights result in Sony and the largest non-Sony shareholder sharing the power to direct the activities of DHP, and as such Sony is not the primary beneficiary of the VIE. At September 30, 2012, the only amounts recorded on Sony’s consolidated balance sheet that relate to the VIE is Sony’s net investment of 286 million U.S. dollars and a net receivable balance of 9 million U.S. dollars. Sony’s maximum exposure to losses as of September 30, 2012 are the aggregate amounts recorded on its balance sheet of 295 million U.S. dollars.
7. Chemical products related business divestiture
On September 28, 2012, Sony sold the chemical products related business, which was included in the Devices segment, to
the Development Bank of Japan (“DBJ”). As a result of the transaction, the transfer of Sony's domestic and overseas operations of the chemical products related business, including all shares in Sony Chemical & Information Device Corporation, to DBJ has been completed. The sale resulted in net cash proceeds of 51,831 million yen, subject to the finalization of certain post-closing conditions and adjustments, and a gain of 8,184 million yen, recorded in other operating (income) expense in the consolidated statements of income, for the three months ended September 30, 2012.
8. Acquisition of Gaikai
On August 10, 2012, Sony acquired Gaikai Inc. (“Gaikai”) for total cash consideration of 28,167 million yen. Gaikai has
developed a high quality, fast interactive cloud-streaming platform that enables streaming of a broad array of content ranging from immersive core games with rich graphics to casual content to a wide variety of devices via the internet.

- 29 -
9. Reconciliation of the differences between basic and diluted EPS Reconciliation of the differences between basic and diluted net income (loss) attributable to Sony Corporation’s stockholders
per share (“EPS”) for the six and three months ended September 30, 2011 and 2012 is as follows:
Yen in millions
Six months ended September 30
2011 2012
Net loss attributable to Sony Corporation’s stockholders for basic and diluted EPS computation
(42,479) (40,111)
Thousands of shares
Weighted-average shares outstanding 1,003,577 1,003,583
Effect of dilutive securities:
Stock acquisition rights - -
Convertible bonds - -
Weighted-average shares for diluted EPS computation 1,003,577 1,003,583
Yen
Basic EPS (42.33) (39.97)
Diluted EPS (42.33) (39.97)
Potential shares of common stock upon the exercise of stock acquisition rights and convertible bonds, which were excluded
from the computation of diluted EPS for the six months ended September 30, 2011 and 2012 were 19,887 thousand shares and 21,882 thousand shares, respectively. All potential shares were excluded as anti-dilutive for the six months ended September 30, 2011 and 2012 due to Sony incurring a net loss attributable to Sony Corporation’s stockholders for these periods. Yen in millions
Three months ended September 30
2011 2012
Net loss attributable to Sony Corporation’s stockholders for basic and diluted EPS computation
(26,977) (15,470)
Thousands of shares
Weighted-average shares outstanding 1,003,582 1,003,591
Effect of dilutive securities:
Stock acquisition rights - -
Convertible bonds - -
Weighted-average shares for diluted EPS computation 1,003,582 1,003,591
Yen
Basic EPS (26.88) (15.41)
Diluted EPS (26.88) (15.41)
Potential shares of common stock upon the exercise of stock acquisition rights and convertible bonds, which were excluded
from the computation of diluted EPS for the three months ended September 30, 2011 and 2012 were 19,887 thousand shares and 21,882 thousand shares, respectively. All potential shares were excluded as anti-dilutive for the three months ended September 30, 2011 and 2012 due to Sony incurring a net loss attributable to Sony Corporation’s stockholders for these periods.

- 30 -
10. Commitments, contingent liabilities and other
(1) Commitments:
A. Loan commitments
Subsidiaries in the Financial Services segment have entered into loan agreements with their customers in accordance with the condition of the contracts. As of September 30, 2012, the total unused portion of the lines of credit extended under these contracts was 19,659 million yen. The aggregate amounts of future year-by-year payments for these loan commitments cannot be determined.
B. Purchase commitments and other
Purchase commitments and other outstanding at September 30, 2012 amounted to 290,571 million yen. The major components of these commitments are as follows:
In the ordinary course of business, Sony makes commitments for the purchase of property, plant and equipment. As of
September 30, 2012, such commitments outstanding were 29,211 million yen. Certain subsidiaries in the Pictures segment have entered into agreements with creative talent for the development and
production of motion pictures and television programming as well as agreements with third parties to acquire completed motion pictures, or certain rights therein, and to acquire the rights to broadcast certain live action sporting events. These agreements cover various periods mainly within 5 years. As of September 30, 2012, these subsidiaries were committed to make payments under such contracts of 100,786 million yen.
Certain subsidiaries in the Music segment have entered into long-term contracts with recording artists and companies for
the production and/or distribution of prerecorded music and videos. These contracts cover various periods mainly within 5 years. As of September 30, 2012, these subsidiaries were committed to make payments of 42,320 million yen under such long-term contracts.
Sony has entered into long-term sponsorship contracts related to advertising and promotional rights. These contracts
cover various periods mainly within 10 years. As of September 30, 2012, Sony has committed to make payments of 50,519 million yen under such long-term contracts.
In addition to the above, Sony has other commitments as follows: During the fiscal year ended March 31, 2012, there was a receipt of an advance payment from a commercial customer.
As a result, as of September 30, 2012, Sony recorded 22,698 million yen in other current liabilities and 25,220 million yen in other long-term liabilities based on anticipated delivery dates. The advance payment is subject to reimbursement under certain contingent conditions of the contract, including a downgrade of Sony’s credit rating by either S&P (lower than “BBB”) or Moody’s (lower than “Baa2”). The advance payment amounts will be reduced at the time of future product sales to the commercial customer.
On June 12, 2012, Sony entered into an agreement to acquire approximately 32% of shares of Multi Screen Media Private
Limited (“MSM”), which operates television networks in India. The agreement will bring Sony’s interest in MSM to approximately 94%. The closing for this transaction is expected to take place by the end of December 2012, subject to receipt of any necessary government approval and customary closing conditions. Sony will pay total cash consideration of 271 million U.S. dollars, with 145 million U.S. dollars expected to be paid by Sony at the closing of the acquisition and the remaining 126 million U.S. dollars to be paid in three equal annual installments starting from the fiscal year ending March 31, 2014.
On September 28, 2012, Sony entered into a business alliance agreement and capital alliance agreement with Olympus
Corporation (“Olympus”). Under the terms of the capital alliance agreement, Olympus will issue 34,387,900 common shares at 1,454 yen per share to Sony through a third-party allotment in two tranches. Accordingly, Sony made an investment of 19,047 million yen on October 23, 2012 for the first third-party allotment of 13,100,000 shares and acquired 4.35% of the total voting rights of Olympus. The payment period for the second third-party allotment of 21,287,900 shares is October 23, 2012 through February 28, 2013. Subject to all closing conditions, including necessary regulatory approvals, under the capital

- 31 -
alliance agreement, Sony will make the additional investment of 30,953 million yen. For the second third-party allotment, Sony expects to acquire an additional 7.07% of the total voting rights of Olympus. As a result, Sony expects to increase its ownership of the total voting rights of Olympus to 11.46%.
(2) Contingent liabilities:
Sony had contingent liabilities, including guarantees given in the ordinary course of business, which amounted to 77,017 million yen at September 30, 2012. The major components of these contingent liabilities are as follows:
Sony has agreed to repay the outstanding principal plus accrued interest up to a maximum of 303 million U.S. dollars to
the creditor of the third-party investor of Sony’s U.S. based music publishing subsidiary should the third-party investor default on its obligation. The obligation of the third-party investor is collateralized by its 50% interest in Sony’s music publishing subsidiary. Should Sony have to make a payment under the terms of the guarantee, Sony would assume the creditor’s rights to the underlying collateral. At September 30, 2012, the fair value of the collateral exceeded 303 million U.S. dollars.
In May 2011, Sony Corporation’s U.S. subsidiary, Sony Electronics Inc., received a subpoena from the DOJ Antitrust
Division seeking information about its secondary batteries business. Sony understands that the DOJ and agencies outside the United States are investigating competition in the secondary batteries market. Subsequently, a number of purported class action lawsuits were filed in certain jurisdictions, including the United States, in which the plaintiffs allege that Sony Corporation and certain of its subsidiaries violated antitrust laws and seek recovery of damages and other remedies. Based on the stage of these proceedings, it is not possible to estimate the amount of loss or range of possible loss, if any, that might result from adverse judgments, settlements or other resolution of these matters.
Beginning in early 2011, the network services of PlayStation®Network, Qriocity™, Sony Online Entertainment LLC and
websites of other subsidiaries came under cyber-attack. As of November 9, 2012, Sony has not received any confirmed reports of customer identity theft issues or misuse of credit cards from such cyber-attacks. However, in connection with certain of these matters, Sony has received inquiries from authorities in a number of jurisdictions, including orders for reports issued by the Ministry of Economy, Trade and Industry of Japan as well as the Financial Services Agency of Japan, formal and/or informal requests for information from Attorneys General from a number of states in the United States and the U.S. Federal Trade Commission, various U.S. congressional inquiries and others. Additionally, Sony Corporation and/or certain of its subsidiaries have been named in a number of purported class actions in certain jurisdictions, including the United States. Based on the stage of these inquiries and proceedings, it is not possible to estimate the amount of loss or range of possible loss, if any, that might result from adverse judgments, settlements or other resolution of all of these matters.
In October 2009, Sony Corporation’s U.S. subsidiary, Sony Optiarc America Inc., received a subpoena from the DOJ
seeking information about its optical disk drive business. Sony understands that the DOJ and agencies outside the United States are investigating competition in optical disk drives. Subsequently, a number of purported class action lawsuits were filed in certain jurisdictions, including the United States, in which the plaintiffs allege that Sony Corporation and certain of its subsidiaries violated antitrust laws and seek recovery of damages and other remedies. Based on the stage of these proceedings, it is not possible to estimate the amount of loss or range of possible loss, if any, that might result from adverse judgments, settlements or other resolution of these matters.
In addition, Sony Corporation and certain of its subsidiaries are defendants or otherwise involved in other pending legal
and regulatory proceedings. However, based upon the information currently available, Sony believes that the outcome from such legal and regulatory proceedings would not have a material effect on Sony’s consolidated financial statements.
(3) Redeemable noncontrolling interest:
In April 2009, Sony sold a portion of its 50% ownership interest in Game Show Network, LLC (“GSN”), which operates a U.S. cable network and online business, to the other investor in GSN. In March 2011, Sony acquired an additional 5% equity interest in GSN from the successor in interest to the other investor (the “Current Investor”). As part of the acquisition, Sony obtained a controlling interest in GSN and, as a result, consolidated GSN. In connection with this transaction, Sony granted a put right to the Current Investor for an additional 18% interest in GSN. In September 2012, the Current Investor exercised its put right to sell an 18% interest in GSN to Sony for 234 million U.S. dollars (the “GSN Share Purchase”). The GSN Share Purchase is subject to regulatory and other approvals. Prior to exercise, the put right was accounted for as redeemable securities and was reported in the mezzanine equity section in the consolidated balance sheets. After exercise, the put right is accounted for as a liability and is reported within other current liabilities and other liabilities in the consolidated balance sheets.

- 32 -
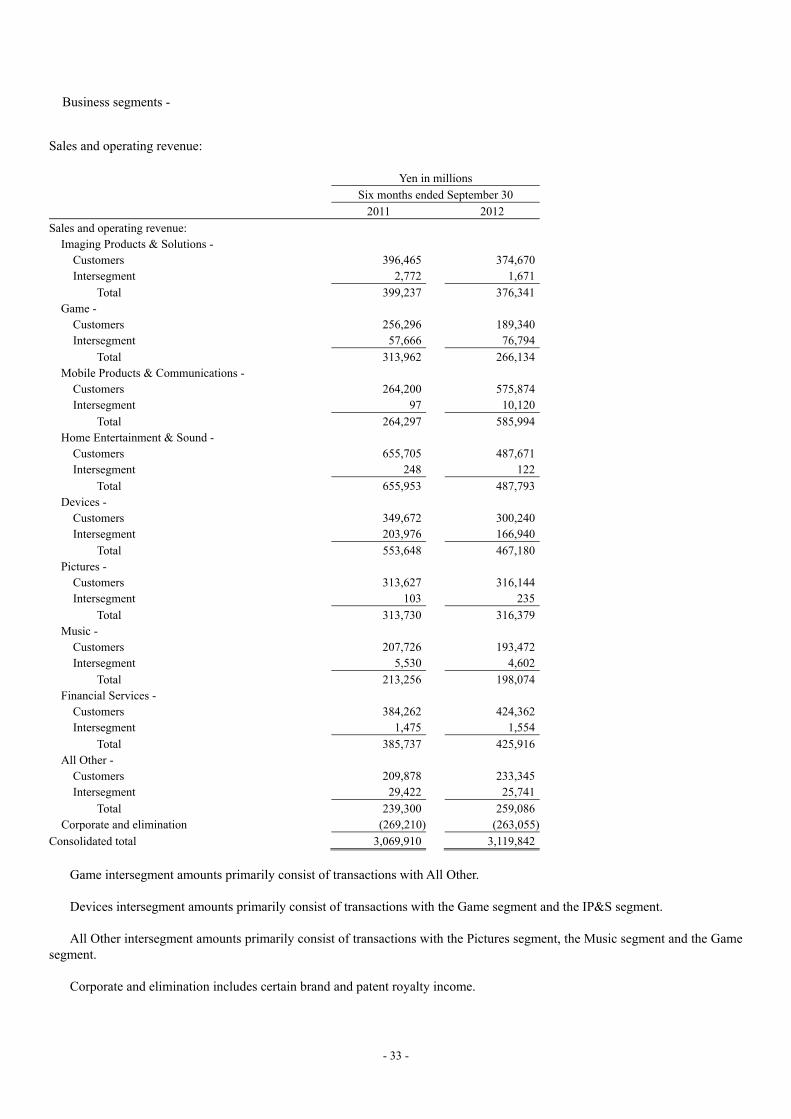
11. Business segment information
The reportable segments presented below are the segments of Sony for which separate financial information is available and for which operating profit or loss amounts are evaluated regularly by the chief operating decision maker (“CODM”) in deciding how to allocate resources and in assessing performance. The CODM does not evaluate segments using discrete asset information. Sony’s CODM is its Chief Executive Officer and President.
Sony realigned its business segments from the first quarter of the fiscal year ending March 31, 2013, to reflect
modifications to the organizational structure as of April 1, 2012, primarily repositioning the operations of the previously reported Consumer, Products & Services (“CPS”), Professional, Device & Solutions (“PDS”) and Sony Mobile Communications segments. In connection with this realignment, the operations of the former CPS, PDS and Sony Mobile Communications segments are included in five newly established segments, namely the Imaging Products & Solutions (“IP&S”), Game, Mobile Products & Communications (“MP&C”), Home Entertainment & Sound (“HE&S”), and Devices segments, as well as All Other. The network business previously included in the CPS segment and the medical business previously included in the PDS segment are now included in All Other. In connection with this realignment, both sales and operating revenue and operating income (loss) of each segment in the second quarter ended September 30, 2011 have been restated to conform to the current quarter’s presentation. The Pictures, Music and Financial Services segments remain unchanged.
- 33 -
Business segments -
Sales and operating revenue:
Yen in millions
Six months ended September 30
2011 2012
Sales and operating revenue: Imaging Products & Solutions -
Customers 396,465 374,670Intersegment 2,772 1,671
Total 399,237 376,341Game -
Customers 256,296 189,340Intersegment 57,666 76,794
Total 313,962 266,134Mobile Products & Communications -
Customers 264,200 575,874Intersegment 97 10,120
Total 264,297 585,994Home Entertainment & Sound -
Customers 655,705 487,671Intersegment 248 122
Total 655,953 487,793Devices -
Customers 349,672 300,240Intersegment 203,976 166,940
Total 553,648 467,180Pictures -
Customers 313,627 316,144Intersegment 103 235
Total 313,730 316,379Music -
Customers 207,726 193,472Intersegment 5,530 4,602
Total 213,256 198,074Financial Services -
Customers 384,262 424,362Intersegment 1,475 1,554
Total 385,737 425,916All Other -
Customers 209,878 233,345Intersegment 29,422 25,741
Total 239,300 259,086Corporate and elimination (269,210) (263,055)
Consolidated total 3,069,910 3,119,842
Game intersegment amounts primarily consist of transactions with All Other. Devices intersegment amounts primarily consist of transactions with the Game segment and the IP&S segment. All Other intersegment amounts primarily consist of transactions with the Pictures segment, the Music segment and the Game
segment. Corporate and elimination includes certain brand and patent royalty income.

- 34 -
Yen in millions
Three months ended September 30
2011 2012
Sales and operating revenue: Imaging Products & Solutions -
Customers 217,329 181,364Intersegment 1,803 1,209
Total 219,132 182,573Game -
Customers 140,863 106,451Intersegment 35,154 41,702
Total 176,017 148,153Mobile Products & Communications -
Customers 141,595 293,755Intersegment 55 6,618
Total 141,650 300,373Home Entertainment & Sound -
Customers 314,658 235,966Intersegment 142 39
Total 314,800 236,005Devices -
Customers 181,359 162,358Intersegment 118,383 87,537
Total 299,742 249,895Pictures -
Customers 169,251 162,846Intersegment 80 146
Total 169,331 162,992Music -
Customers 100,396 96,770Intersegment 3,242 2,462
Total 103,638 99,232Financial Services -
Customers 183,359 230,645Intersegment 740 776
Total 184,099 231,421All Other -
Customers 109,928 121,523Intersegment 14,578 13,234
Total 124,506 134,757Corporate and elimination (157,926) (140,742)
Consolidated total 1,574,989 1,604,659
Game intersegment amounts primarily consist of transactions with All Other. Devices intersegment amounts primarily consist of transactions with the Game segment and the IP&S segment. All Other intersegment amounts primarily consist of transactions with the Pictures segment, the Music segment and the Game
segment. Corporate and elimination includes certain brand and patent royalty income.

- 35 -
Segment profit or loss:
Yen in millions
Six months ended September 30
2011 2012
Operating income (loss): Imaging Products & Solutions 28,293 15,202Game 7,053 (1,270)Mobile Products & Communications (4,501) (51,237)Home Entertainment & Sound (55,392) (25,798)Devices (13,106) 45,721Pictures 24,906 3,005Music 18,420 15,125Financial Services 53,174 58,792All Other (23,168) (15,015)
Total 35,679 44,525Corporate and elimination (9,814) (7,999)
Consolidated operating income 25,865 36,526Other income 14,157 11,058Other expenses (16,808) (18,521)
Consolidated income before income taxes 23,214 29,063
Operating income (loss) is Sales and operating revenue less Costs and expenses, and includes Equity in net income (loss) of
affiliated companies.
Corporate and elimination includes headquarters restructuring costs and certain other corporate expenses, including the amortization of certain intellectual property assets such as the cross-licensing intangible assets acquired from Telefonaktiebolaget LM Ericsson at the time of the acquisition of Sony Mobile Communications AB (formerly known as Sony Ericsson Mobile Communications AB), which are not allocated to segments.
Within the HE&S segment, the operating losses of Televisions, which primarily consists of LCD televisions, for the six
months ended September 30, 2011 and 2012 were 55,504 million yen and 16,814 million yen, respectively. The operating losses of Televisions exclude restructuring charges which are included in the overall segment results and not allocated to product categories.

- 36 -
Yen in millions
Three months ended September 30
2011 2012
Operating income (loss): Imaging Products & Solutions 15,809 2,593Game 2,989 2,279Mobile Products & Communications (6,057) (23,098)Home Entertainment & Sound (41,763) (15,812)Devices (18,409) 29,775Pictures 20,604 7,877Music 6,326 7,850Financial Services 24,478 31,207All Other (8,187) (5,912)
Total (4,210) 36,759Corporate and elimination 2,575 (6,508)
Consolidated operating income (loss) (1,635) 30,251Other income 11,200 4,151Other expenses (9,470) (14,752)
Consolidated income before income taxes 95 19,650
Operating income (loss) is Sales and operating revenue less Costs and expenses, and includes Equity in net income (loss) of
affiliated companies.
Corporate and elimination includes headquarters restructuring costs and certain other corporate expenses, including the amortization of certain intellectual property assets such as the cross-licensing intangible assets acquired from Telefonaktiebolaget LM Ericsson at the time of the acquisition of Sony Mobile Communications AB (formerly known as Sony Ericsson Mobile Communications AB), which are not allocated to segments.
Within the HE&S segment, the operating losses of Televisions, which primarily consists of LCD televisions, for the three
months ended September 30, 2011 and 2012 were 40,720 million yen and 10,175 million yen, respectively. The operating losses of Televisions exclude restructuring charges which are included in the overall segment results and not allocated to product categories.

- 37 -
Other Significant Items:
The following table includes a breakdown of sales and operating revenue to external customers by product category in the following segments: IP&S, MP&C, HE&S and Devices. The IP&S, MP&C, HE&S and Devices segments are each managed as a single operating segment by Sony’s management.
Yen in millions
Six months ended September 30
Sales and operating revenue: 2011 2012
Imaging Products & Solutions
Digital Imaging Products 270,302 238,486
Professional Solutions 121,472 126,991
Other 4,691 9,193
Total 396,465 374,670
Game 256,296 189,340
Mobile Products & Communications
Mobile Communications - 352,149
Personal and Mobile Products 261,394 220,996
Other 2,806 2,729
Total 264,200 575,874
Home Entertainment & Sound
Televisions 455,774 303,698
Audio and Video 195,691 180,947
Other 4,240 3,026
Total 655,705 487,671
Devices
Semiconductors 193,968 145,264
Components 153,523 147,940
Other 2,181 7,036
Total 349,672 300,240
Pictures 313,627 316,144
Music 207,726 193,472
Financial Services 384,262 424,362
All Other 209,878 233,345
Corporate 32,079 24,724
Consolidated total 3,069,910 3,119,842

- 38 -
Yen in millions
Three months ended September 30
Sales and operating revenue: 2011 2012
Imaging Products & Solutions
Digital Imaging Products 141,432 108,570
Professional Solutions 73,437 66,184
Other 2,460 6,610
Total 217,329 181,364
Game 140,863 106,451
Mobile Products & Communications
Mobile Communications - 181,045
Personal and Mobile Products 140,091 111,361
Other 1,504 1,349
Total 141,595 293,755
Home Entertainment & Sound
Televisions 214,038 146,682
Audio and Video 98,341 87,197
Other 2,279 2,087
Total 314,658 235,966
Devices
Semiconductors 102,849 75,779
Components 77,213 79,799
Other 1,297 6,780
Total 181,359 162,358
Pictures 169,251 162,846
Music 100,396 96,770
Financial Services 183,359 230,645
All Other 109,928 121,523
Corporate 16,251 12,981
Consolidated total 1,574,989 1,604,659
Sony has realigned its product category configuration from the first quarter of the fiscal year ending March 31, 2013. In
connection with the realignment, all prior period sales amounts by product category in the table above have been restated to conform to the current presentation.
In the IP&S segment, Digital Imaging Products includes compact digital cameras, video cameras and interchangeable single
lens cameras; Professional Solutions includes broadcast- and professional-use products. In the MP&C segment, Mobile Communications includes mobile phones; Personal and Mobile Products includes personal computers. In the HE&S segment, Televisions includes LCD televisions; Audio and Video includes home audio, Blu-ray disc players and recorders, and memory-based portable audio devices. In the Devices segment, Semiconductors includes image sensors; Components includes batteries, recording media and data recording systems.

- 39 -
Geographic Information -
Sales and operating revenue attributed to countries based on location of external customers are as follows:
Yen in millions Six months ended September 30
Sales and operating revenue: 2011 2012
Japan 968,474 996,620
United States 570,954 472,946
Europe 560,328 593,279
China 268,207 259,599
Asia-Pacific 331,222 382,128
Other Areas 370,725 415,270
Total 3,069,910 3,119,842
Yen in millions Three months ended September 30
Sales and operating revenue: 2011 2012
Japan 482,461 525,109
United States 296,556 230,531
Europe 293,486 300,238
China 154,041 137,807
Asia-Pacific 155,177 190,926
Other Areas 193,268 220,048
Total 1,574,989 1,604,659
Major areas in each geographic segment excluding Japan, United States and China are as follows: (1) Europe: United Kingdom, France, Germany, Russia, Spain and Sweden (2) Asia-Pacific: India, South Korea and Oceania (3) Other Areas: The Middle East/Africa, Brazil, Mexico and Canada There are not any individually material countries with respect to the sales and operating revenue included in Europe,
Asia-Pacific and Other Areas. Transfers between reportable business segments or geographic areas are made at amounts which Sony’s management
believes approximate as arms-length transactions. There were no sales and operating revenue with any single major external customer for the six and three months ended
September 30, 2011 and 2012.
12. Subsequent events
On October 19, 2012, as a part of its restructuring of the electronics business operations in Japan, Sony announced the consolidation of manufacturing operations and closure of a manufacturing site to further enhance efficiency. Sony also announced a headcount reduction at Sony Corporation and major consolidated electronics subsidiaries in Japan to streamline those organizations and increase operational efficiency. The resulting impact of the restructuring to Sony’s consolidated results for the fiscal year ending March 31, 2013 is currently being evaluated.

- 40 -
(2) Other Information (1) Dividends declared
An interim cash dividend for Sony Corporation’s common stock was approved at the Board of Directors meeting held on October 31, 2012 as below:
1. Total amount of interim cash dividends:
12,545 million yen 2. Amount of interim cash dividends per share:
12.50 yen 3. Payment date:
December 3, 2012 Interim cash dividends for the fiscal year ending March 31, 2013 have been incorporated in the accompanying consolidated financial statements.
Note: Interim cash dividends are to be distributed to the shareholders recorded or registered as the holders or pledgees of shares in Sony Corporation’s register of shareholders at the end of September 30, 2012. (2) Litigation
In May 2011, Sony Corporation’s U.S. subsidiary, Sony Electronics Inc., received a subpoena from the DOJ Antitrust Division seeking information about its secondary batteries business. Sony understands that the DOJ and agencies outside the United States are investigating competition in the secondary batteries market. Subsequently, a number of purported class action lawsuits were filed in certain jurisdictions, including the United States, in which the plaintiffs allege that Sony Corporation and certain of its subsidiaries violated antitrust laws and seek recovery of damages and other remedies. Based on the stage of these proceedings, it is not possible to estimate the amount of loss or range of possible loss, if any, that might result from adverse judgments, settlements or other resolution of these matters.
Beginning in early 2011, the network services of PlayStation®Network, Qriocity™, Sony Online Entertainment LLC and websites of other subsidiaries came under cyber-attack. As of November 9, 2012, Sony has not received any confirmed reports of customer identity theft issues or misuse of credit cards from such cyber-attacks. However, in connection with certain of these matters, Sony has received inquiries from authorities in a number of jurisdictions, including orders for reports issued by the Ministry of Economy, Trade and Industry of Japan as well as the Financial Services Agency of Japan, formal and/or informal requests for information from Attorneys General from a number of states in the United States and the U.S. Federal Trade Commission, various U.S. congressional inquiries and others. Additionally, Sony Corporation and/or certain of its subsidiaries have been named in a number of purported class actions in certain jurisdictions, including the United States. Based on the stage of these inquiries and proceedings, it is not possible to estimate the amount of loss or range of possible loss, if any, that might result from adverse judgments, settlements or other resolution of all of these matters.
In October 2009, Sony Corporation’s U.S. subsidiary, Sony Optiarc America Inc., received a subpoena from the DOJ seeking information about its optical disk drive business. Sony understands that the DOJ and agencies outside the United States are investigating competition in optical disk drives. Subsequently, a number of purported class action lawsuits were filed in certain jurisdictions, including the United States, in which the plaintiffs allege that Sony Corporation and certain of its subsidiaries violated antitrust laws and seek recovery of damages and other remedies. Based on the stage of these proceedings, it is not possible to estimate the amount of loss or range of possible loss, if any, that might result from adverse judgments, settlements or other resolution of these matters.
In addition, Sony Corporation and certain of its subsidiaries are defendants or otherwise involved in other pending legal and
regulatory proceedings. However, based upon the information currently available, Sony believes that the outcome from such legal and regulatory proceedings would not have a material effect on Sony’s consolidated financial statements.