fy2013 housing production trust fund annual report and the
TRANSCRIPT
FY2013 Housing Production Trust Fund Annual Report
and the
Affordable Housing Report
Government of the District of Columbia
Department of Housing and Community Development 1800 Martin Luther King Jr. Avenue, SE, Washington, DC 20020

FY2013 HPTF ANNUAL REPORT
Cover photos:
Progression Place Apartments 50 Units Reserved and Restricted | 7th and S Street NW

FY2013 HOUSING PRODUCTION TRUST FUND REPORT
Contents
FY2013 Housing Production Trust Fund Report
Legislative Reporting Requirements and Activity Responses 2
Financial and Production Highlights 2
Overall Fund Activities 3
Statements of Revenues and Expenditures 4
FY2013 Cash Disbursement Activities 4
Comparative Statements: Revenues and Expenditures 6
Housing Production Trust Fund Balance, FY2001 – FY2013 7
Annual Summary Tables 8
Preliminary Utilization Plan for FY2014 10
FY2013 Obligated Project Descriptions 11
FY2013 Affordable Housing Production Report
Affordable Housing Production Report 28
Annual Activity Statutory Responses 29
Multi-Family Non-HPTF Housing 30
Home Purchase Assistance Program (HPAP) Loans 33
Lead Safe Washington Program (LSW) 33
Single-Family Residential Rehabilitation Program (SFRRP) 33
1

FY2013 HPTF ANNUAL REPORT
Legislative Reporting Requirements
The Housing Production Trust Fund was authorized
under the Housing Production Trust Fund Act of
1988, DC Law 7 - 202. Section 4a requires the Mayor
to file an annual report with the Council of the
District of Columbia that details the sources and
uses of HPTF monies in the creation and
preservation of affordable housing by the
Department of Housing and Community
Development (DHCD) in the District of Columbia.
Overall Fund Activities
The Fiscal Year 2013 opening balance (October 1,
2012) of the Housing Production Trust Fund (“HPTF”
or the “Fund”) was $74,379,000. In FY2013, the Fund
recorded the following:
revenues from deed and recordation taxes
of $53,218,889;
loan repayments of $2,032,000;
interest earnings and other revenues of
$66,931,000; and
expenditures of $62,590,889.
The Fund balance includes $17,932,036, which is
obligated for projects, resulting in a balance of
$121,798,964 available in the Fund.
Against the closing balance of $121,798,964 are
potential expenditures of $82,761,614 in projects
currently earmarked (selected for underwriting).
Please see:
Appendix A for HPTF Fund Balance FYs 2002-
2013;
Appendix B for HPTF Preliminary Utilization Plan
for FY 2014 as of September 30, 2013; and
Appendix C for Status of HPTF Pipeline Projects
by Funding Stages.
Financial and Production Highlights/
Summary
In FY2013, DHCD closed seven multi-family project
loans totaling $16,616,023. The loans provided
subsidy to projects with a projected total
development cost of $42,136,275 to produce 209
affordable units of housing; or approximately
$79,502 per unit of affordable housing and 3.8% of
the total project development cost.
Additionally, in FY2013 DHCD made cash
expenditures of $62,590,889 from the Fund. Of this
amount:
$50,028,012 was spent on housing related
projects;
$6,664,889 was spent on the New Communities
Debt Service payment; and
$5,897,988 was spent on administrative
expenditures, which accounted for 10% of
FY2013 HPTF revenues.
Of the multi-family project funds expended in
FY2013:
$3,465,072 (20.9%) went toward the
construction of three homeownership projects;
and
$13,150,951 (79.1%) went toward four rental
projects.
At the end of the Fiscal Year:
there was an obligated unexpended balance
of $17,932,036; and
$82,761,614 was earmarked for eight projects
accounting for 1,404 housing units.
Income Levels Served
Most of the HPTF multi-family project expenditures
went toward affordable housing options for those
DC residents most in need: households at or below
2
FY2013 Housing Production Trust Fund Report

FY2013 HOUSING PRODUCTION TRUST FUND REPORT
50% of the Area Median Income (AMI), a standard
set by the U.S. Department of Housing and Urban
Development (HUD). In FY2013:
$8,696,948 (52.1%) was expended on housing
for households with incomes at or below 30% of
AMI; and
an additional $5,882,072 (35.4%) went toward
households with incomes between 31% and
50% AMI.
These expenditures created 80 units of housing for
households under 30% AMI and 77 units for those
between 31% and 50% AMI. These expenditures
met the statutory requirements. At least 80% of the
HPTF expenditures went toward District residents at
or below 50% AMI.
The remaining $2,007,703 (12.5%) of HPTF multi-
family housing project funds went to the creation or
preservation of 54 units to benefit households with
incomes between 51% and 80% AMI.
It should be noted that although the statutory limit
is 80% of AMI, the majority of households served in
this category have incomes between 51% and 60%
of AMI.
Status of Project Pipeline
During FY2013, cash expenditures were made on
existing and seven new multi-family project loans
totaling $15,532,161. The seven multi-family project
loans, which closed in the Fiscal Year, financed the
construction/rehabilitation of 209 rental and
homeownership units. All rental units will be
restricted and reserved for low to moderate
income households for a term of 40 years. All
homeownership units will be restricted and
reserved for a term of 15 years.
Site Acquisition Funding Initiative
(SAFI)
The SAFI initiative, which was established to assist
nonprofit developers to acquire properties in the
rapidly escalating neighborhood real estate
market, closed two projects during FY2013.
Major Program Challenge
The major challenge facing the HPTF continues to
be how to provide affordable housing in the face
of rising housing costs in the District. DHCD
continues to creatively manage the available
resources to meet its mission of creating and
preserving opportunities for affordable housing and
economic development and to revitalize
underserved communities in the District of
Columbia. ■■■
Comparison of FY2013 and FY2012 Units
Fiscal Year
0%-30%
Extremely
Low 31%-50%
Very Low 51%-80%
Low Total
Units
FY2013 80 77 52 209
FY2012 159 135 54 348
Increase/ (Decrease) (79) (58) (2) (139)
% Increase/ (Decrease)
over FY2013 (50%) (43%) 0% (40%)
FY2013 Housing Production Trust Fund Annual Report
3

FY2013 HPTF ANNUAL REPORT
STATEMENTS OF REVENUES AND EXPENDITURES October 1, 2012 - September 30, 2013
1st Quarter
2nd
Quarter
3rd
Quarter
4th
Quarter FY2013
REVENUE Revenue from Recordation and Deed Taxes 9,298,317 13,293,981 12,957,843 17,668,748 53,218,889
Miscellaneous 5,761,000 5,761,000
Total Revenue 9,298,317 13,293,981 12,957,843 23,429,748 58,979,889
EXPENDITURES Multi-Family Project (1,732,166) (3,318,701) (5,169,433) (5,311,861) (15,532,161)
Other Multi-Family Projects 0 0 0 0 0
Tenant Purchase 0 0 0 0 0
HPAP 0 0 0 0 0
Lead Safe 0 0 0 0 0
Single-Family 0 0 0 0 0
Other Expenditures (34,495,851) (34,495,851)
Administrative Expenses (1,474,497) (1,474,497) (1,474,497) (1,474,497) (5,897,988)
Total Expenditures (3,206,663) (4,793,198) (6,643,930) (41,282,209) (55,926,000)
Excess / (Deficiency) Revenue over Expenditure 6,091,654 8,500,783 6,313,913 (17,852,461) 3,053,889
OTHER FINANCING SOURCES (Uses) New Communities Bond Debt Payment (6,664,889) 0 0 0 (6,664,889)
Other Finance Sources (Uses) 0 0 0 2,032,000 2,032,000
Transfers In 0 0 0 66,931,000 66,931,000
0 0 0 Total Other Financing Sources and (Uses) (6,664,889) 0 0 68,963,000 62,298,111
NET REVENUES OVER/(UNDER) EXPENDITURES (573,235) 8,500,783 6,313,913 51,110,539 65,352,000
FY2013 CASH DISBURSEMENT
ACTIVITIES (MULTI-FAMILY) October 1, 2012 - September 30, 2013
Project Name Ward Amount
1417 N. Street NE Cooperative 1 53,876
Crestwood Cooperative Inc. 1 206,830
Jubilee Reentry Housing Initiative 1 2,318,922
LIHTC Senior Housing LLC (Senior Housing @ O) 2 1,400,000
Ivy City Rehabilitation Project (DC Habitat for Humanity) 5 457,190
Some Scattered Site II 6,8 2,065,209
Bass Circle 7 416,180
Carver 2000 Tenants Association 7 47,553
Dix Street Gateway 7 89,519
Parkside Senior LP 7 221,418
Pollin Memorial Community Development 7 2,940,510
The Elizabeth Ministry 7 1,024
Buxton Condos 8 481,701
L'Enfant Square Apartments (CVE II LLC) 8 353,488
River East @Anacostia Metro (Grand View Estates II) 8 455,000
Trinity Plaza LLC 8 2,428,005
W Street Condos 8 1,498,500
Total Multi-family Project Disbursement Activities 15,532,161
4
O Street Senior Housing Rendering

FY2013 HOUSING PRODUCTION TRUST FUND REPORT
FY2013 QUARTERLY ACTIVITIES
Quarter
Starting
Balance Recordation Tax
Other
Income
Loan
Repayments
Transfers from
Mayor's Office Disbursements Ending Balance
Oct-Dec 2012 $74,379,000 $9,298,317 $0 $0 -$9,871,552 $73,805,765
Jan-Mar 2013 $73,805,765 $13,293,981 $0 $0 -$4,793,198 $82,306,548
Apr-Jun 2013 $82,306,548 $12,957,843 $0 $0 -$6,643,935 $88,620,456
Jul-Sep 2013 $88,620,456 $17,668,748 $5,761,000 $2,032,000 $66,931,000 -$41,282,204 $139,731,000
5
$9
,29
8,3
17
$1
3,2
93
,98
1
$1
2,9
57
,84
3
$1
7,6
68
,74
8
1 S T Q T R 2 N D Q T R 3 R D Q T R 4 T H Q T R
RECORDATION TAX ES AND MISCELLANEOUS INCOME
O Street Senior Housing Under Construction

FY2013 HPTF ANNUAL REPORT
COMPARATIVE STATEMENTS OF REVENUES AND EXPENDITURES FYs 2013 and 2012
FY2013 FY2012 Variance % Variance
REVENUE
Revenue from Recordation and Deed Taxes $53,218,889 $42,736,220 $10,482,669 25%
Interest Income (HPTF, SAFI and Other Revenues) $5,761,000 $3,898,274 $1,862,726 48%
Donations (Section 1706.5(b) of DC Zoning Regulations) $0 N/A Total Revenue $58,979,889 $46,634,494
EXPENDITURES
Project Disbursement ($50,028,012) ($40,791,378) ($9,236,634) -23%
Administrative Expenses ($5,897,988) ($5,256,622) ($641,366) -12%
Total Expenditures ($55,926,000) ($46,048,000)
Excess/Deficiency Revenue over Expenditure $3,053,889 $586,494
OTHER FINANCING SOURCES (Uses)
New Communities Bond Debt Payment ($6,664,889) ($5,574,220) ($1,090,669) -20%
Loan Repayments $2,032,000 $1,850,000 $182,000 10%
Workforce Housing Land Trust Refund $4,080,726 Transfers in $66,931,000 $0 N/A Total Other Financing Sources and (Uses) $62,298,111 $356,506
NET REVENUES OVER/(UNDER) EXPENDITURES $65,352,000 $943,000
# HOUSEHOLDS ASSISTED / FUNDING BY INCOME GROUP (Multi-family) Extremely Low Income Very Low Income Low Income
0 - 30% AMI 31 - 50% AMI 51 - 80% AMI
FY2013
80 Units 77 Units 52 Units
$8,696,948 $5,882,072 $2,077,003
52.1% of units 35.4% of units 12.5% of Units
FY2012
159 Units 135 Units 54 Units
$2,235,133 $2,230,185 $1,005,682
41% of units 41% of units 18% of Units
# MULTI-FAMILY PROJECTS AWARDED, UNITS, FUNDING, AND PROJECT TYPE
# Projects, Units and
Award Amounts
Project Type
Loans Grants Homeownership Rental
FY2013
7 Projects 7 Projects 0 Projects 3 Project 4 Projects
209 units 209 units 0 Units 50 Units 159 Units
$16,616,023 $16,616,023 $0 $3,465,432 $13,150,591
FY2012
4 Projects 4 Projects 0 Projects 1 Project 3 Projects
348 units 348 units 0 Units 125 Units 223 Units
$5,470,000 $5,470,000 $0 $1,118,000 $4,290,000
6
FY2013 HOUSING PRODUCTION TRUST FUND REPORT
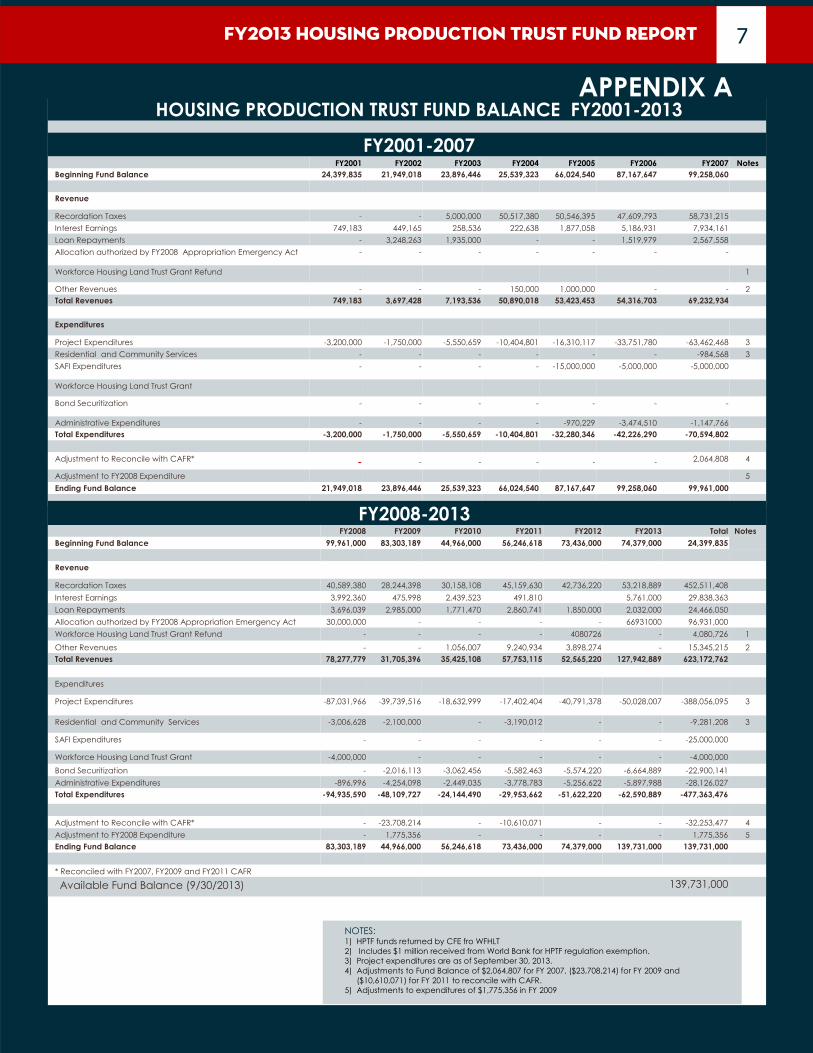
HOUSING PRODUCTION TRUST FUND BALANCE FY2001-2013
FY2001-2007 FY2001 FY2002 FY2003 FY2004 FY2005 FY2006 FY2007 Notes
Beginning Fund Balance 24,399,835 21,949,018 23,896,446 25,539,323 66,024,540 87,167,647 99,258,060
Revenue Recordation Taxes - - 5,000,000 50,517,380 50,546,395 47,609,793 58,731,215
Interest Earnings 749,183 449,165 258,536 222,638 1,877,058 5,186,931 7,934,161
Loan Repayments - 3,248,263 1,935,000 - - 1,519,979 2,567,558
Allocation authorized by FY2008 Appropriation Emergency Act - - - - - - -
Workforce Housing Land Trust Grant Refund 1
Other Revenues - - - 150,000 1,000,000 - - 2
Total Revenues 749,183 3,697,428 7,193,536 50,890,018 53,423,453 54,316,703 69,232,934
Expenditures Project Expenditures -3,200,000 -1,750,000 -5,550,659 -10,404,801 -16,310,117 -33,751,780 -63,462,468 3
Residential and Community Services - - - - - - -984,568 3
SAFI Expenditures - - - - -15,000,000 -5,000,000 -5,000,000
Workforce Housing Land Trust Grant
Bond Securitization - - - - - - -
Administrative Expenditures - - - - -970,229 -3,474,510 -1,147,766
Total Expenditures -3,200,000 -1,750,000 -5,550,659 -10,404,801 -32,280,346 -42,226,290 -70,594,802
Adjustment to Reconcile with CAFR* - - - - - 2,064,808 4 - Adjustment to FY2008 Expenditure 5
Ending Fund Balance 21,949,018 23,896,446 25,539,323 66,024,540 87,167,647 99,258,060 99,961,000
FY2008-2013
FY2008 FY2009 FY2010 FY2011 FY2012 FY2013 Total Notes
Beginning Fund Balance 99,961,000 83,303,189 44,966,000 56,246,618 73,436,000 74,379,000 24,399,835
Revenue
Recordation Taxes 40,589,380 28,244,398 30,158,108 45,159,630 42,736,220 53,218,889 452,511,408
Interest Earnings 3,992,360 475,998 2,439,523 491,810 5,761,000 29,838,363
Loan Repayments 3,696,039 2,985,000 1,771,470 2,860,741 1,850,000 2,032,000 24,466,050
Allocation authorized by FY2008 Appropriation Emergency Act 30,000,000 - - - - 66931000 96,931,000
Workforce Housing Land Trust Grant Refund - - - - 4080726 - 4,080,726 1
Other Revenues - - 1,056,007 9,240,934 3,898,274 - 15,345,215 2
Total Revenues 78,277,779 31,705,396 35,425,108 57,753,115 52,565,220 127,942,889 623,172,762
Expenditures Project Expenditures -87,031,966 -39,739,516 -18,632,999 -17,402,404 -40,791,378 -50,028,007 -388,056,095 3
Residential and Community Services -3,006,628 -2,100,000 - -3,190,012 - - -9,281,208 3
SAFI Expenditures - - - - - - -25,000,000
Workforce Housing Land Trust Grant -4,000,000 - - - - - -4,000,000
Bond Securitization - -2,016,113 -3,062,456 -5,582,463 -5,574,220 -6,664,889 -22,900,141
Administrative Expenditures -896,996 -4,254,098 -2,449,035 -3,778,783 -5,256,622 -5,897,988 -28,126,027
Total Expenditures -94,935,590 -48,109,727 -24,144,490 -29,953,662 -51,622,220 -62,590,889 -477,363,476
Adjustment to Reconcile with CAFR* - -23,708,214 - -10,610,071 - - -32,253,477 4
Adjustment to FY2008 Expenditure - 1,775,356 - - - - 1,775,356 5
Ending Fund Balance 83,303,189 44,966,000 56,246,618 73,436,000 74,379,000 139,731,000 139,731,000
* Reconciled with FY2007, FY2009 and FY2011 CAFR
139,731,000 Available Fund Balance (9/30/2013)
7
NOTES: 1) HPTF funds returned by CFE fro WFHLT
2) Includes $1 million received from World Bank for HPTF regulation exemption.
3) Project expenditures are as of September 30, 2013.
4) Adjustments to Fund Balance of $2,064,807 for FY 2007, ($23,708,214) for FY 2009 and
($10,610,071) for FY 2011 to reconcile with CAFR.
5) Adjustments to expenditures of $1,775,356 in FY 2009
APPENDIX A

FY2013 HPTF ANNUAL REPORT
HISTORICAL OVERVIEW: ANNUAL SUMMARY TABLE, FY2001- FY2013
Fiscal
Year
Starting
Balance
Recordation
Tax and Misc.
Income
Interest
Income
Loan
Repayments Expenditures Adjustments
Ending
Balance
2001 - $24,399,835 $749,183 - ($3,200,000) - $21,949,018
2002 $21,949,018 - $449,165 $3,248,263 ($1,750,000) - $23,896,446
2003 $23,896,446 $5,000,000 $258,536 $1,935,000 ($5,550,659) - $25,539,323
2004 $25,539,323 $50,517,380 $222,638 $150,000 ($10,404,801) - $66,024,540
2005 $66,024,540 $50,546,395 $1,877,058 $1,000,000 ($32,280,346) - $87,167,647
2006 $87,167,647 $47,609,793 $5,186,931 $1,519,979 ($42,226,289) - $99,258,061
2007 $99,258,061 $58,731,215 $7,934,161 $2,567,558 ($70,594,802) $2,064,808 $99,961,001
2008 $99,961,001 $40,589,380 $3,992,360 $3,696,039 ($94,935,590) $30,000,000 * $83,303,190
2009 $83,303,190 $28,244,398 $475,998 $2,985,000 ($48,109,727) ($21,932,859) $44,966,000
2010 $44,966,000 $30,158,108 $3,495,530 $1,771,470 ($24,144,490) - $56,246,618
2011 $56,246,618 $45,159,630 $491,810 $12,101,675 ($29,953,662) ($10,610,071) $73,436,000
2012 $73,436,000 $42,736,220 $7,979,000 $1,850,000 ($51,622,220) $74,379,000
2013 $74,379,000 $53,218,889 $5,761,000 $2,032,000 ($62,590,889) $66,931,000 ** $139,731,000
* Allocation authorized by FY2008 Appropriations Emergency Act of 2007
** Allocation authorized by FY2013 Appropriations from Mayor's Office
8
# of Units Closed FY2001-2013 # of Projected Closed FY2001-2013
Value of Loans Closed FY2001-2013

FY2013 HOUSING PRODUCTION TRUST FUND REPORT
FISCAL YEARS 2000-2013 QUARTERLY SUMMARY TABLE October 2000 Through September 2013
Quarter Starting Balance Recordation Tax
and Misc. Income Interest/Other
Income Loan
Repayments Transfers from
Mayor's Office Disbursements Adjustments Ending Balance
Oct - Dec 2000 0 0 0 0 0 0 0
Jan - Mar 2001 0 24,399,835 0 0 0 0 24,399,835
Apr - Jun 2001 24,399,835 0 546,717 0 0 0 24,946,552
Jul - Sep 2001 24,946,552 0 202,467 0 -3,200,000 0 21,949,018
Oct - Dec 2001 21,949,018 0 96,776 0 0 0 22,045,794
Jan - Mar 2002 22,045,794 0 156,083 3,248,263 -1,750,000 0 23,700,140
Apr - Jun 2002 23,700,140 0 110,925 0 0 0 23,811,065
Jul - Sep 2002 23,811,065 0 85,381 0 0 0 23,896,446
Oct - Dec 2002 23,896,446 0 76,145 0 0 0 23,972,591
Jan - Mar 2003 23,972,591 0 59,681 0 -500,000 0 23,532,273
Apr - Jun 2003 23,532,273 0 58,885 0 -426,721 0 23,164,436
Jul - Sep 2003 23,164,436 5,000,000 63,825 1,935,000 -4,623,938 0 25,539,323
Oct - Dec 2003 25,539,323 0 29,957 0 -985,000 0 24,584,280
Jan - Mar 2004 24,584,280 0 45,575 2,115,260 -5,380,096 0 21,365,020
Apr - Jun 2004 21,365,020 0 43,838 0 -1,519,529 0 19,889,329
Jul - Sep 2004 19,889,329 50,667,380 103,268 0 -4,635,436 0 66,024,540
Oct - Dec 2004 66,024,540 11,032,805 0 0 -4,601,017 0 72,456,328
Jan - Mar 2005 72,456,328 12,100,692 562,706 0 -4,204,298 0 80,915,428
Apr - Jun 0205 80,915,428 13,109,836 558,708 0 -1,953,215 0 92,630,757
Jun - Sep 2005 92,630,757 15,303,062 755,644 0 -21,521,816 0 87,167,646
Oct - Dec 2005 87,167,646 12,707,080 898,664 0 29,536 0 100,802,926
Jan - Mar 2006 100,802,926 11,402,834 433,345 0 -5,158,564 0 107,480,541
Apr - Jun 2006 107,480,541 12,744,588 2,166,707 369,345 -10,161,633 0 112,599,547
Jul - Sep 2006 112,599,547 35,910,528 1,688,216 1,150,634 -26,935,628 -25,155,237 99,258,060
Oct - Dec 2006 99,258,060 12,319,997 0 1,551,562 -19,214,906 0 93,914,713
Jan - Mar 2007 93,914,713 15,001,980 0 451,689 -3,917,820 0 105,450,562
Apr - Jun 2007 105,450,562 19,846,407 1,822,053 224,395 -14,467,976 0 112,875,441
Jul - Sep 2007 112,875,441 11,562,832 6,112,108 339,912 -32,994,100 2,064,807 99,961,000
Oct - Dec 2007 99,961,000 11,249,477 0 138,677 -8,197,936 0 103,197,856
Jan - Mar 2008 103,197,856 8,911,192 0 579,156 -9,857,496 0 102,830,708
Apr - Jun 2008 102,830,708 11,342,124 771,179 901,083 -30,969,930 30,000,000 114,875,164
Jul - Sep 2008 114,875,164 9,086,587 3,221,181 2,077,123 -45,910,228 0 83,303,189
Oct - Dec 2008 83,303,189 7,271,965 116,099 426,324 -5,731,286 1,775,356* 87,161,647
Jan - Mar 2009 87,161,647 6,081,660 160,454 1,080,697 -12,743,645 0 81,740,813
Apr - Jun 2009 81,740,813 4,814,198 107,965 729,541 -16,771,504 0 70,621,013
Jul - Sep 2009 70,621,013 10,076,575 91,480 748,438 -12,863,292 -23,708,214 44,966,000
Oct - Dec 2009 44,966,000 5,368,998 19,681 350,626 -5,607,673 0 45,097,632
Jan - Mar 2010 45,097,632 6,175,529 41,382 900,844 -4,437,808 0 47,777,579
Apr - Jun 2010 44,777,579 4,566,085 512,660 0 -2,144,325 0 50,711,999
Jul - Sep 2010 50,711,999 14,047,496 2,921,808 520,000 -11,954,685 -15,931,618 40,315,000
Oct - Dec 2010 40,315,000 5,858,167 13,605 188,012 -8,045,282 0 38,329,502
Jan - Mar 2011 38,329,502 21,847,948 45874 1010795 -670,748 0 60,563,371
Apr - Jun 2011 60,563,371 15,645,909 367,100 164,069 -3,120,731 0 73,619,718
Jul - Sep 2011 73,619,718 22,889,721 23,565 1,497,865 -24,594,869 0 73,436,000
Oct - Dec 2011 73,436,000 7,776,896 5,055,293 462,500 -15,911,463 0 70,819,226
Jan - Mar 2012 70,819,226 10,528,031 974,569 462,500 -10,337,242 0 72,447,084
Apr - Jun 2012 72,447,084 9,718,953 974,569 462,500 -10,337,241 0 73,265,865
Jul - Sep 2012 73,265,865 14,712,340 974,569 462,500 -15,036,274 0 74,379,000
Oct - Dec 2012 74,379,000 9,298,317 0 0 0 -9,871,552 0 73,805,765
Jan - Mar 2013 73,805,765 13,293,981 0 0 0 -4,793,198 0 82,306,548
Apr - Jun 2013 82,306,548 12,957,843 0 0 0 -6,643,935 0 88,620,456
Jul - Sep 2013 88,620,456 17,668,748 5,761,000 2,032,000 66,931,000 -41,282,204 0 139,731,000
9

FY2013 HPTF ANNUAL REPORT 10
PRELIMINARY UTILIZATION PLAN FOR FY2014 As of September 30, 2013
FUND BALANCE
Projected Available Funding Totals Notes
Fund Balance September 30, 2013 $139,731,000
Carryover Obligations September 30, 2013 ($17,932,036)
Available Fund Balance September 30, 2013 $121,798,964
Projected Revenue from Recordation Taxes FY2014 $51,445,000 1
Projected Interest Income FY2013 $1,300,000
Total Available Funds FY2014 $174,543,964
FY2014 HPTF Budget $68,603,751
Projected Expenditures FY2014 Administrative Expenditures @10% ($5,274,500)
Proposed New Communities Bond Debt Payment ($6,664,880)
Transfer to Fund Rent Subsidies $0
Projected Other Project related Expenditures FY2014 ($15,532,156)
Projected Project Expenditures FY2014 ($18,061,651)
Projected Obligated Projects 9/30/2014 ($18,000,000)
SubTotal Projected Expenditures ($63,533,187)
Projected Balance of Budget Authority September 30, 2014 $5,070,564
Projected (Over)/ Under Subscription
Projected Fund Balance September 30, 2014 $111,010,777
Projects Earmarked/Committed (Projected 9/30/2014) Earmarked Projects $30,000,000
Committed Projects $10,000,000
Sub-Total Projects Earmarked/Committed $40,000,000
FY2014 Estimated (Over)/ Under Subscription $71,010,777 2
Notes:
(1) Based upon revised revenue estimates 9/30/2013.
(2) Represents total potential draw on HPTF resources. DHCD recognizes that not all projects will be approved
for funding or advanced, and that this amount may also be reduced by shifting funding for some projects to
other DHCD funding sources.
APPENDIX B

FY2013 HOUSING PRODUCTION TRUST FUND REPORT
Jubilee Re-entry
Housing Initiative
Developer: Jubilee Housing Inc. Location: 2720 Ontario Road NW
2448 18th Street NW
Number of Units: 24
Amount: $2,922,451
Total Project Cost: $3,258,463
Funding Type: Loan
Use: Acquisition and Rehabilitation
Closing Date: December 2012
Beneficiaries: Low-income persons re-entering
the community from jail; and other persons
at or below 30% of AMI
Affordability Term: All units to be restricted and
reserved for low income households for a term
of 40 years
Status: Acquisition completed, rehabilitation in
progress
Ivy City Home
Rehabilitation
Project Developer: DC Habitat for Humanity Location: 1955 Capitol Avenue NE
1830 Providence Street NE
1825 Corcoran Street NE
Number of Units: 4
Amount: $489,040
Total Project Cost: $1,219,040
Funding Type: Loan
Use: Substantial Rehabilitation
Closing Date: December 2012
Beneficiaries: Homeownership for families at or
below 60% of AMI
Affordability Term: 15 years
Status: Rehabilitation in progress
11
FY2013 OBLIGATED PROJECT DESCRIPTIONS AS OF 9-30-2013

FY2013 HPTF ANNUAL REPORT
Buxton
Condos Developer: MANNA Inc.
Location: 1700 W Street SE
Number of Units: 24
Amount:$1,525,000
Total Project Cost: $4,612,787
Funding Type: Loan
Use: Rehabilitation
Closing Date: March 2013
Beneficiaries: Homeowners at or
below 80% of AMI
Affordability Term: 15 years
Status: Rehabilitation in progress
W Street
Apartments (Additional Funding)
Developer: Anthony Washington Location: 1751-1759 W Street SE Number of Units: 15
Amount: $1,498,500
Total Project Cost: $2,222,350
Funding Type: Loan
Use: Construction
Closing Date: February 2013
Beneficiaries: Families at or below 80% of AMI
Affordability Term: Restricted and reserved
for low income families for 40 years
Status: Construction in progress
12
FY2013 OBLIGATED PROJECT DESCRIPTIONS AS OF 9-30-2013

FY2013 HOUSING PRODUCTION TRUST FUND REPORT
Trinity Plaza Retail
Worker Housing Initiative Developer: Far SW-SE CDC Location: 3939 South Capitol Street SW
Number of Units: 49
Amount: $3,950,000
Total Project Cost: $16,438,042
Funding Type: Loan
Use: Substantial Rehabilitation
Closing Date: September 2013
Beneficiaries: Households at or below 80% of AMI
Affordability Term: Reserved and restricted for households
at 80% of AMI for 40 years
Status: Rehabilitation in progress
Crestwood Cooperative Developer: Crestwood Cooperative/
MiCasa Inc. Location: 1630 Irving Street NE
Number of Units: 22
Amount: $1,451,032
Total Project Cost: $6,167,886
Funding Type: Loan
Use: Substantial Rehabilitation
Closing Date: August 2013
Beneficiaries: Cooperative Members at or
below 80% of AMI
Affordability Term: Reserved and restricted for
households at 80% of AMI or lower
Status: Rehabilitation in progress
SOME Scattered Site II Developer: SOME Inc. Location: 2025 Fendell Street SE
523-525 Mellon Street SE
115 New Jersey Avenue NW
216 New York Avenue NW
Number of Units: 103
Amount: $4,780,000
Total Project Cost: $27,949,593
Funding Type: Loan
Use: Rehabilitation
Closing Date: May 2013
Beneficiaries: Households at or below 80% of AMI
Affordability Term: Reserved and restricted for
households at 80% of AMI for 40 years
Status: Rehabilitation in progress
13
FY2013 OBLIGATED PROJECT DESCRIPTIONS AS OF 9-30-2013

FY2013 HPTF ANNUAL REPORT
14
STAGE REQUEST FOR PROPOSAL PROCESS
#1 Earmarked Stage
Projects selected for underwriting.
#2 Commitment Stage
Projects that have completed underwriting and have received
letters of commitment.
#3 Obligation Stage
Projects that have closed and funding has been obligated in the
District’s financial system.
#4 Completion Stage
Projects where all obligated funding have been disbursed.
Withdrawn Projects
Projects selected for underwriting, but withdrawn by the
Applicant, deemed inactive by DHCD, or funded with other
DHCD resources.
HPTF FOUR FUNDING STAGES Status of HPTF Pipeline Projects
APPENDIX C
FY2013 HOUSING PRODUCTION TRUST FUND REPORT
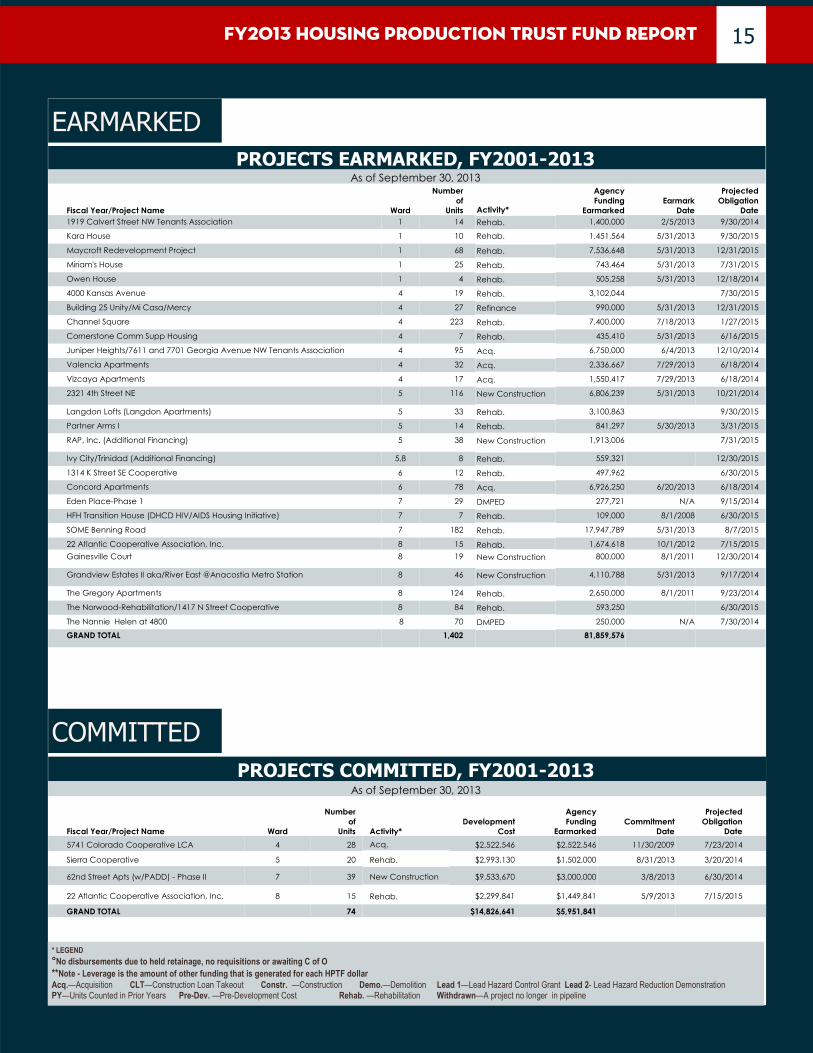
PROJECTS EARMARKED, FY2001-2013 As of September 30, 2013
Fiscal Year/Project Name Ward
Number
of
Units Activity*
Agency
Funding
Earmarked
Earmark
Date
Projected
Obligation
Date
1919 Calvert Street NW Tenants Association 1 14 Rehab. 1,400,000 2/5/2013 9/30/2014
Kara House 1 10 Rehab. 1,451,564 5/31/2013 9/30/2015
Maycroft Redevelopment Project 1 68 Rehab. 7,536,648 5/31/2013 12/31/2015
Miriam's House 1 25 Rehab. 743,464 5/31/2013 7/31/2015
Owen House 1 4 Rehab. 505,258 5/31/2013 12/18/2014
4000 Kansas Avenue 4 19 Rehab. 3,102,044 7/30/2015
Building 25 Unity/Mi Casa/Mercy 4 27 Refinance 990,000 5/31/2013 12/31/2015
Channel Square 4 223 Rehab. 7,400,000 7/18/2013 1/27/2015
Cornerstone Comm Supp Housing 4 7 Rehab. 435,410 5/31/2013 6/16/2015
Juniper Heights/7611 and 7701 Georgia Avenue NW Tenants Association 4 95 Acq. 6,750,000 6/4/2013 12/10/2014
Valencia Apartments 4 32 Acq. 2,336,667 7/29/2013 6/18/2014
Vizcaya Apartments 4 17 Acq. 1,550,417 7/29/2013 6/18/2014
2321 4th Street NE 5 116 New Construction 6,806,239 5/31/2013 10/21/2014
Langdon Lofts (Langdon Apartments) 5 33 Rehab. 3,100,863 9/30/2015
Partner Arms I 5 14 Rehab. 841,297 5/30/2013 3/31/2015
RAP, Inc. (Additional Financing) 5 38 New Construction 1,913,006 7/31/2015
Ivy City/Trinidad (Additional Financing) 5,8 8 Rehab. 559,321 12/30/2015
1314 K Street SE Cooperative 6 12 Rehab. 497,962 6/30/2015
Concord Apartments 6 78 Acq. 6,926,250 6/20/2013 6/18/2014
Eden Place-Phase 1 7 29 DMPED 277,721 N/A 9/15/2014
HFH Transition House (DHCD HIV/AIDS Housing Initiative) 7 7 Rehab. 109,000 8/1/2008 6/30/2015
SOME Benning Road 7 182 Rehab. 17,947,789 5/31/2013 8/7/2015
22 Atlantic Cooperative Association, Inc. 8 15 Rehab. 1,674,618 10/1/2012 7/15/2015
Gainesville Court 8 19 New Construction 800,000 8/1/2011 12/30/2014
Grandview Estates II aka/River East @Anacostia Metro Station 8 46 New Construction 4,110,788 5/31/2013 9/17/2014
The Gregory Apartments 8 124 Rehab. 2,650,000 8/1/2011 9/23/2014
The Norwood-Rehabilitation/1417 N Street Cooperative 8 84 Rehab. 593,250 6/30/2015
The Nannie Helen at 4800 8 70 DMPED 250,000 N/A 7/30/2014
GRAND TOTAL 1,402 81,859,576
15
EARMARKED
PROJECTS COMMITTED, FY2001-2013 As of September 30, 2013
Fiscal Year/Project Name Ward
Number
of
Units Activity*
Development
Cost
Agency
Funding
Earmarked
Commitment
Date
Projected
Obligation
Date
5741 Colorado Cooperative LCA 4 28 Acq. $2,522,546 $2,522,546 11/30/2009 7/23/2014
Sierra Cooperative 5 20 Rehab. $2,993,130 $1,502,000 8/31/2013 3/20/2014
62nd Street Apts (w/PADD) - Phase II 7 39 New Construction $9,533,670 $3,000,000 3/8/2013 6/30/2014
22 Atlantic Cooperative Association, Inc. 8 15 Rehab. $2,299,841 $1,449,841 5/9/2013 7/15/2015
GRAND TOTAL 74 $14,826,641 $5,951,841
* LEGEND
°No disbursements due to held retainage, no requisitions or awaiting C of O
**Note - Leverage is the amount of other funding that is generated for each HPTF dollar
Acq.—Acquisition CLT—Construction Loan Takeout Constr. —Construction Demo.—Demolition Lead 1—Lead Hazard Control Grant Lead 2- Lead Hazard Reduction Demonstration PY—Units Counted in Prior Years Pre-Dev. —Pre-Development Cost Rehab. —Rehabilitation Withdrawn—A project no longer in pipeline
COMMITTED

FY2013 HPTF ANNUAL REPORT
PROJECTS WITH OBLIGATIONS, FY2001 - 2013 As of September 30, 2013
Project Name Ward
Number
of Units Activity*
Development
Cost
Agency
Approved
Funding
Obligation
Date
Remaining
Obligated
Funding
Cumulative
Disbursements
1703 Euclid Street NW (Phase I) 1 3 Rehab. 664,719 286,147 11/30/2008 96,549 189,598
1417 N Street Northwest DC Tenants Association 1 84 Acq. 9,729,479 3,624,286 7/25/2011 301,024 3,323,262
Crestwood Cooperative 1 22 Acq. 1,451,032 1,451,032 8/26/2013 1,244,202 206,830
Jubilee Re-entry Housing Initiative 1 24 Rehab./ Acq. 5,472,857 2,922,451 12/13/2012 603,529 2,318,922
E and G Tenant First Right To Purchase Pool 1,6,7 134 Rehab 33,175,762 5,385,361 3/22/2011 - 5,385,361
Progression Place Apartments 2 50 New Constr. 44,000,000 2,700,000 2/9/2012 270,000 2,430,000
Senior Housing at O 2 90 New Constr. 35,158,271 6,279,412 11/29/2012 - 6,279,412
Voices of Madison Cooperative 4 15 Rehab. 636,334 636,334 7/3/2007 125,350 510,984
Longfellow Arms NWDC LLC 4 30 Rehab. 9,041,379 3,854,000 7/1/2008 59,591 3,794,409
4000 Kansas Phase 2 4 19 Rehab. 1,653,665 1,653,665 4/30/2009 1,361,559 292,106
4100 Georgia Ave Apartments 4 72 Constr. 15,817,636 8,136,031 8/6/2007 588,787 7,547,244
Webster Gardens 4 52 Acq./ Rehab. 12,042,459 4,000,000 4/14/2010 1,568,445 2,431,555
The Elizabeth Ministry 5 27 Rehab. 7,000,000 2,406,986 7/1/2008 - 2,406,986
Ivy City Home Rehabilitation Project (Habitat Phase II 5 4 Rehab. 489,040 489,040 12/31/2012 - 489,040
Ivy City Home Demonstration Initiative (Habitat Phase III) 5 11 Constr. 2,984,722 1,505,900 10/9/2012 - 1,505,900
St. Martins 5 178 Constr. 42,577,454 9,512,000 9/30/2008 450,116 9,061,884
The Dunbar- Open Arms 5 19 Sp. Needs-Rehab. 2,654,970 1,124,475 11/13/2009 154,475 970,000
SOME Scattered Site II 6,8 71 Rehab. 5,680,000 4,780,000 5/31/2013 2,714,796 2,065,204
GW Carver Seniors Apartments 7 Demo. 4,558,300 2,777,000 2/13/2006 588,645 2,188,355
Carver 2000 Tenants Association 7 125 Pre-development 3,950,000 1,118,000 2/26/2012 2,394 1,115,606
Four Walls Development, Inc. 7 15 Rehab. 1,573,000 773,808 6/1/2005 93,752 680,056
Foote Street Renovation 7 6 Acq. 863,125 345,312 9/30/2008 11,312 334,000
Victory Square (Parkside View Seniors) Apartments 7 98 New Constr. 18,798,648 3,667,887 2/9/2011 1,689,384 1,978,503
The Community Builders 7 98 Rehab. 20,162,500 1,059,234 8/1/2008 36,173 1,023,061
The Elizabeth Ministry 7 21 Rehab. 2,400,000 7/30/2010 2,398,976 1,024
Linda Joy and Kenneth Jay Pollin Community Center 7 83 New Constr. 27,214,743 8,000,000 8/31/2011 1,059,490 6,940,510
62nd Street Apartments - Phase I 7 39 Pre-Dev. 8,000,000 354,410 9/30/2011 166,149 188,261
L'Enfants Square Apartments 8 13 Rehab. 1,321,109 640,000 5/31/2012 - 640,000
Hyacinth's Place 8 15 New Constr. 2,364,393 753,652 1/31/2009 229,320 1,524,332
1320 Mississippi Avenue 8 19 Rehab. 6,583,525 4,026,684 8/30/2010 247,206 2,727,007
Buxton Condominium 8 24 Rehab. 1,525,000 1,525,000 3/6/2013 - 481,701
St. Paul Senior Living I 8 56 Constr. 5,323,772 825,000 8/1/2003 82,500 742,500
Community of Hope 8 10 Rehab. 2,565,000 1,300,000 7/1/2005 116,023 1,183,977
Graceview/House of Help City of Hope 8 12 Acq. 2,166,900 2,166,900 2/25/2005 23,259 2,143,641
Park Southern Apartments 8 360 Rehab. 3,076,641 3,076,641 5/25/2006 179,306 2,897,335
Trinity Plaza - Retail Worker 8 49 Rehab. 3,950,000 3,950,000 9/30/2013 1,521,996 2,428,004
W Street Apartments (Additional Funding) 8 15 New Constr. 1,498,500 1,498,500 2/13/2013 - 1,498,500
Wheeler Terrace 8 118 Acq./ Rehab. 33,395,427 5,725,086 7/1/2008 44,277 5,680,809
GRAND TOTAL 2,018 379,120,362 107,730,234 17,932,036 87,605,879
16
OBLIGATIONS
* LEGEND
°No disbursements due to held retainage, no requisitions or awaiting C of O
**Note - Leverage is the amount of other funding that is generated for each HPTF dollar
Acq.—Acquisition CLT—Construction Loan Takeout Constr. —Construction Demo.—Demolition Lead 1—Lead Hazard Control Grant Lead 2- Lead Hazard Reduction Demonstration PY—Units Counted in Prior Years Pre-Dev. —Pre-Development Cost Rehab. —Rehabilitation Withdrawn—A project no longer in pipeline

FY2013 HOUSING PRODUCTION TRUST FUND REPORT
PROJECTS WITH COMPLETED DISBURSEMENTS, FY2001 - 2013 As of September 30, 2013
Project Name Ward
Number
of
Units Activity*
Development
Cost
Funding
Requested
Funding
Disbursements
Obligation
Date
Date of
Completion
Time to
Complete
Disbursement
3128 Sherman Avenue NW 1 13 Acq. $665,000 $665,000 $665,000 3/1/2004 3/11/2004 11 days
Claiborne Apt Tenants Association 1 92 Acq. $11,912,076 $11,912,076 $11,912,076 7/1/2008 7/1/2008 1 day
Hope and a Home I 1 14 Acq. $1,885,183 $1,885,183 $1,885,183 12/30/2005 7/11/2011 67
Neighborhood Consejo 1 6 New Constr. $239,211 $100,000 $100,000 6/1/2005 6/1/2005 1 day
Jubilee Phase Housing IA 1 118 Rehab. $1,620,503 $1,620,503 $1,620,503 7/1/2005 7/6/2006 12 months
Jubilee Housing Phase IB 1 Rehab. $20,894,188 $1,933,803 $1,933,803 7/1/2006 8/31/2011 49 months
Immaculate Conception Apartments 1 136 Acq. $19,770,379 $2,187,557 $2,187,557 1/4/2004 1/11/2004 8 days
Kara House Cooperative 1 13 Acq. $1,194,000 $1,194,000 $1,194,000 6/30/2006 7/13/2006 13 days
Crestwood Tenants Association 1 22 Acq. $3,595,928 $3,595,928 $3,595,928 7/31/2006 8/9/2006 9 days
New Beginning Apartments 1 15 Acq. $1,812,700 $1,812,700 $1,812,700 9/30/2006 9/30/2006 1 day
Green Door - 3471 14th Street NW 1 6 Acq./Rehab. $521,160 $368,504 $368,504 4/1/2004 3/5/2005 11 months
Las Marias Cooperative, Inc. 1 50 Acq. $1,815,000 $1,815,000 $1,815,000 7/7/2005 9/14/2007 26 months
Ontario Court Apartments 1 27 Rehab. $9,267,065 $3,428,019 $3,428,019 12/3/2007 12/3/2007 1 day
Ailanthus Cooperative, Inc. 1 9 Acq. $925,000 $925,000 $925,000 1/3/2008 1/31/2008 31 days
New Fairmont I and II 1 102 Rehab. $31,710,171 $4,750,000 $4,750,000 12/1/2002 1/31/2008 61 months
Fairmont I and II - Additional Funding 1 102 Rehab. $35,710,000 $4,000,000 $4,000,000 7/14/2006 1/31/2008 18 months
Sankofa Cooperative, Inc. 1 48 Acq. $7,073,017 $5,194,061 $5,194,061 5/29/2008 5/29/2008 1 day
Quest Cooperative, Inc. 1 23 Rehab. $2,135,000 $2,135,000 $2,135,000 8/1/2008 7/30/2011 35 months
E and G 1,6,7 134 Acq./Rehab. $33,175,762 $5,385,361 $5,385,361 3/22/2011 2/31/2012 12 months
MLK Jr. Latino Cooperative 2 74 Acq. $13,542,009 $8,398,000 $8,398,000 9/30/2006 9/30/2006 1 day
Martin L King Jr Latino Cooperative 2 Rehab. $6,498,120 $6,498,120 $6,498,120 2/28/2008 8/30/2011 54 months
Phyllis Wheatley YWCA Inc. 2 117 Rehab. $674,200 $674,200 $674,200 9/30/2005 6/5/2008 32 months
R Street Apt. 2 124 Rehab. $19,673,973 $6,500,000 $6,500,000 7/31/2007 9/24/2007 2 months
Woodley House 3 31 Rehab. $5,410,437 $1,016,750 $1,016,750 8/30/2008 12/17/2010 13 months
4211 2nd Street Apts (Victory Hills) 4 23 Rehab. $3,011,232 $425,000 $425,000 2/16/2007 4/28/2009 26 months
4000 Kansas Avenue 4 19 Acq. $2,817,415 $1,125,000 $1,125,000 9/1/2008 9/1/2008 1 day
Georgia Commons 4 130 Acq. /Rehab. $23,100,000 $3,755,000 $3,755,000 6/30/2009 7/1/2009 1day
Green Door - 6411 Piney Branch Road 4 6 Rehab. $86,500 $74,162 $74,162 4/21/2006 5/31/2006 1 month
Kentucky Scott, LLC (Kennedy St) 4 21 Rehab. $2,003,641 $2,003,641 $2,003,641 7/31/2007 1/27/2010 30 months
The Duncan Cooperative 4 27 Acq. $2,565,400 $2,565,400 $2,565,400 8/1/2006 10/30/2006 2 months
Colorado Cooperative 4 36 Acq. $3,150,000 $3,150,000 $3,150,000 2/28/2007 4/9/2007 2 months
Brightwood Gardens Cooperative 4 52 Acq. $3,676,357 $3,676,357 $3,676,357 6/30/2007 7/24/2007 24 days
1029 Perry Street NE 5 16 Acq. $2,888,557 $600,000 $600,000 8/25/2009 8/26/2009 1 day
Bates Street Townhomes 5 5 Acq./Rehab. $1,705,403 $1,705,403 $1,705,403 12/26/2006 10/1/2008 21 months
Edgewood IV 5 258 Acq. $21,735,657 $3,200,000 $3,200,000 7/1/2001 7/8/2001 8 days
Carver Terrace Apartments 5 312 CLT $27,096,789 $985,000 $985,000 12/1/2003 12/10/2003 10 days
North Capitol Plymouth Senior
Apartments 5 69 New Constr. $6,842,470 $1,629,067 $1,629,067 8/1/2003 3/29/2006 31 months
Carver Terrace Community Center 5 New Constr. $27,096,789 $350,000 $350,000 11/3/2005 12/22/2006 11 months
Shalom House 5 - Special Needs $1,981,713 $1,981,713 $1,981,713 5/2/2008 12/24/2008 7 months
The Elizabeth Ministry - Foster Care 5 Pre-Dev. $292,327 $292,327 $292,327 2/28/2007 8/28/2007 6 months
Wesley House (Union Wesley) 5 57 New Constr. $16,146,587 $3,101,787 $3,101,787 12/13/2006 9/18/2008 18 months
Peaceoholics Inc. 5,6,8 32 Pre-Dev. $5,600,000 $600,000 $600,000 8/12/2008 11/21/2008 2 months
Peaceoholics Inc. 2 5,6,8 Acq. Rehab. $4,400,000 $4,400,000 $4,400,000 4/302009 10/31/2012 42 months
17
COMPLETIONS
* LEGEND
°No disbursements due to held retainage, no requisitions or awaiting C of O
**Note - Leverage is the amount of other funding that is generated for each HPTF dollar
Acq.—Acquisition CLT—Construction Loan Takeout Constr. —Construction Demo.—Demolition Lead 1—Lead Hazard Control Grant Lead 2- Lead Hazard Reduction Demonstration PY—Units Counted in Prior Years Pre-Dev. —Pre-Development Cost Rehab. —Rehabilitation Withdrawn—A project no longer in pipeline

FY2013 HPTF ANNUAL REPORT
PROJECTS WITH COMPLETED DISBURSEMENTS, FY2001-2013 As of September 30, 2013
Project Name Ward
Number
of
Units Activity*
Development
Cost
Funding
Requested
Funding
Disbursements
Obligation
Date
Date of
Completion
Time to
Complete
Disbursement
1314 K Street 6 12 Acq. $1,499,265 $1,499,265 $1,499,265 9/1/2008 9/1/2008 1 day
Golden Rule Apartments 6 170 Pre-Dev. $55,773,855 $950,000 $950,000 12/3/2007 7/23/2010 33 months
Bethune House 7 44 Rehab. $3,477,659 $3,477,659 $3,477,659 11/21/2006 6/1/2010 43 months
Copeland Manor Cooperative 7 61 Acq. $4,083,606 $4,083,606 $4,083,606 4/28/2008 4/28/2008 1 day
Green Door - 2721 Pennsylvania Avenue SE 7 6 Acq. $294,548 $174,548 $174,548 3/1/2004 3/10/2004 10 days
GW Carver Seniors Apartments 7 Pre-Dev. $13,542,000 $1,199,492 $1,199,492 7/1/2004 2/14/2006 19 months
GW Carver Seniors Apartments 7 104 New Constr. $14,950,000 $950,000 $950,000 12/31/2007 5/1/2009 16 months
Hacienda Cooperative 7 59 Acq. $7,485,440 $1,419,219 $1,419,219 3/31/2009 4/1/2009 1 day
SOME - Independence Place 7 21 New Constr. $3,028,833 $1,300,000 $1,300,000 5/1/2004 5/24/2006 24 months
Amber Overlook 7 50 New Constr. $17,874,124 $1,200,000 $1,200,000 7/31/2006 7/31/2006 1 day
A Street Manor Cooperative 7 16 Acq. $1,045,110 $1,045,110 $1,045,110 9/22/2005 6/14/2007 21 months
Mayfair Mansions 3 (Additional) 7 0 Rehab. $950,000 $950,000 $950,000 10/31/2011 10/31/2011 0
Mayfair Mansions 3 7 160 Rehab. $6,913,646 $6,913,646 $6,913,646 9/24/2007 9/24/2007 1 day
Mayfair Mansions 2 7 Acq. $24,550,000 $24,550,000 $24,550,000 12/7/2006 12/7/2006 1 day
Pleasant Park Cooperative 7 60 Acq. $4,710,265 $4,710,265 $4,710,265 4/25/2008 4/25/2008 1 day
The Community Builders 2 7 Acq. $5,000,000 $5,000,000 $5,000,000 1/31/2009 1/31/2009 1 day
The Elizabeth Ministry Foster Care 7 27 Acq. $7,000,000 $2,406,986 $2,406,986 7/1/2008 7/1/2008 1 day
SOME -Scattered Project 7,8 241 Acq./Rehab. $35,706,015 $11,503,000 $11,503,000 8/18/2010 8/1/2010 1 day
Archer Park Apartments 8 214 Rehab. $60,685,486 $5,648,000 $5,648,000 2,406,986 7/1/2008 1 day
Far SW/SE - Retail Housing (Trinity Plaza) 8 Pre-Dev. $600,000 $600,000 $600,000 11/22/2006 5/26/2009 30 months
Far SW/SE - Retail Housing (Trinity Plaza) 8 28 Acq./ Pre-Dev. $780,000 $780,000 $780,000 11/22/2006 12/3/2010 36 months
Freedom House 8 30 Rehab. $1,912,823 $1,177,500 $1,177,500 2/23/2006 3/29/2006 34 days
Henson Ridge HOPE VI ADA Accessible 8 22 Rehab. $10,710,000 $2,900,000 $2,900,000 3/15/2010 3/15/2010 1 day
Howard Hill Apartments 8 74 Constr. $2,726,630 $2,062,497 $2,062,497 12/23/2004 2/22/2006 14 months
Langston Lane 8 114 Constr. $6,980,500 $6,980,500 $6,980,500 3/15/2007 4/28/2009 25 months
Trenton Park 8 259 Acq. $11,862,090 $1,750,000 $1,750,000 12/1/2001 12/10/2001 10 days
Stanton View Townhomes 8 31 Constr. $11,628,631 $4,000,000 $4,000,000 7/1/2008 7/1/2008 1 day
St. Paul's Senior Living II - Add’l Funding 8 56 New Constr. $6,924,000 $1,600,000 $1,600,000 6/1/2005 7/1/2005 1 month
Wingate Tower Apartments 8 717 Acq./Rehab. $66,746,000 $2,500,000 $2,500,000 8/1/2003 UNK N/A
Arthur Capper Senior II 8 136 Constr. $19,105,637 $1,700,000 $1,700,000 12/28/2005 12/29/2005 2 days
Bowling Green Royal Courts 8 126 New Constr. $18,300,000 $1,600,000 $1,600,000 6/1/2003 3/15/2006 33 months
J.W. King Senior Center 8 74 New Constr. $11,656,237 $2,120,000 $2,120,000 5/1/2004 4/12/2006 23 months
Renaissance 8 12 Rehab. $1,626,547 $1,626,547 $1,626,547 12/1/2004 3/15/2008 39 months
Renaissance - Addt'l Funding 8 Pre-Dev. $2,876,547 $1,040,000 $1,040,000 10/20/2006 3/15/2008 17 months
Zagami House 8 12 Rehab. $3,846,637 $1,000,000 $1,000,000 4/3/2008 4/3/2008 1 day
2300 Pennsylvania Avenue 8 118 Constr. $32,500,000 $7,500,000 $7,500,000 8/1/2008 8/1/2010 24 months
Parkside Terrace Redevelopment 8 316 Constr. $75,000,000 $21,452,064 $21,452,064 11/3/2007 8/21/2010 45 months
SAFI - City First Bank '05 Var - Acq. $10,000,000 $5,000,000 $5,000,000 8/15/2005 9/1/2005 17 days
SAFI - Enterprise Fin Svcs '05 Var - Acq. $10,000,000 $5,000,000 $5,000,000 8/15/2005 9/1/2005 17 days
SAFI - Unitarian Unvrslst Bank '05 Var - Acq. $10,000,000 $5,000,000 $5,000,000 8/15/2005 9/1/2005 17 days
SAFI II - Cornerstone '06 Var - Acq. $3,000,000 $3,000,000 $3,000,000 3/8/2006 5/31/2006 2 months
SAFI II - Washington Area Hsg Trust '06 Var - Acq. $2,000,000 $2,000,000 $2,000,000 3/8/2006 5/31/2006 2 months
SAFI III - Washington Area Hsg Trust '07 Var - Acq. $2,000,000 $2,000,000 $2,000,000 2/15/2007 3/30/2007 43 days
SAFI III - Enterprise Community Loan '07 Var - Acq. $3,000,000 $3,000,000 $3,000,000 5/9/2007 6/29/2007 1 month
Workforce Community Land Trust (DMPED) Var - Acq. $4,000,000 $4,000,000 $4,000,000 11/2/2007 11/2/2007 1 day
GRAND TOTAL 3,459 $948,693,288 $274,199,165 $274,199,165
18
COMPLETIONS
* LEGEND
°No disbursements due to held retainage, no requisitions or awaiting C of O
**Note - Leverage is the amount of other funding that is generated for each HPTF dollar
Acq.—Acquisition CLT—Construction Loan Takeout Constr. —Construction Demo.—Demolition Lead 1—Lead Hazard Control Grant Lead 2- Lead Hazard Reduction Demonstration PY—Units Counted in Prior Years Pre-Dev. —Pre-Development Cost Rehab. —Rehabilitation Withdrawn—A project no longer in pipeline

FY2013 HOUSING PRODUCTION TRUST FUND REPORT
PROJECTS SELECTED BUT WITHDRAWN BY APPLICANT/DHCD FY2001-2013 As of September 30, 2013
Project
Category Project Name Developer Ward
Number
of
Units Activity*
Funding
Requested
APP
With-
drawl
DHCD
With-
drawl
Resub-
mitted
Project
Other
Funding
Source
Rental Jubilee Housing Phase II Pentacle Partners 1 96 Rehab. 4,211,000 X
Rental Quest Cooperative Quest Cooperative 1 26 Acq. 1,500,000 X
Rental 1773 Lanier Place Tenants Association 1773 Lanier Place Tenants Assoc. 1 24 Acq. 3,840,000 X
Rental/LIHTC 1372 Kenyon Street NW TA 1372 Kenyon Street NW TA 1 18 Acq. 1,775,000 X
Homeowner 1340 Fairmont Street Cooperative Manna, Inc. 1 16 Constr. 375,000 X
Rental CARECEN/ Oscar Romero TA Central American Resource Ctr. 1 10 Constr. 330,000 X
Rental 1703 Euclid NW 1 5 Rehab. 379,000 X
Rental 4th and Rhode Island Avenue NE 1 170 Constr. 1,881,770 X
Rental The Heights of Columbia 1 56 New Constr. 5,200,000 X
Rental 1025 Park Road 1 8 Rehab. 661,000 X
Rental Broadcast Residential Partners LLC Broadcast Center Residents 1 39 Rehab. 4,250,000 X
Rental Cavalier Apartments 1 230 Rehab. 8,500,000 X
Rental Jubilee Housing Phase II Jubilee Housing 1 70 Rehab 8,000,000 X
Rental Chinatown East Bundy Development Corp. 2 30 Constr. 1,000,000 X
Rental 1107 11th Street Apartments Nat'l Housing Trust Enterprise 2 31 Rehab. 1,780,123 X
Rental Phyllis Wheatley, YWCA Inc. 2 PY Acq. 3,733,000 X
Rental Ashbury Dwellings 2 147 Rehab. 2,245,963 X
Rental Tewkesbury Apartments ETDH Associates 4 26 Constr. 1,300,000 X
Rental Woodley House 4 36 Rehab. 772,023 X
Rental Rittenhouse Nat'l Children's Ctr. 4 5 Acq. 344,374 X
Rental 8th Street Apartments 4 39 Rehab. 2,586,660 X
Homeowner Metropolitan Tenants Association Metropolitan Tenants Association 5 162 Acq. 7,800,000 X
Rental Prince Hall Family Apartments Prince Hall Family Apts 5 126 Pre-Dev. 220,000 X
Artist/Live Work Dance Place Space 5 TBD PreDev./Acq. 5,000,000 X
Special Needs Mt. Olivet Road Special Needs Community Connections 5 12 Spec Needs 1,637,000 X
Rental/LIHTC St. Matthew's Square St. Matthew's Square LLC 6 90 Constr. 3,625,000 X
Elderly VIF Senior Housing Venture in Faith, Inc. 6 15 Rehab. 1,175,000 X
Rental Family Homes I Homes for Hope, Inc. 6 4 Rehab. 2,600,000 X
Rental VIF Senior Housing Complex 6 15 Rehab. 1,808,709 X
Rental Apartment Homes I-Homes for Hope 6 4 Rehab. 600,000 X
Rental 801 Pennsylvania Ave. SE 6 N/A Acq. 5,000,000 X
Constr. 54th Street Apartments 7 8 Constr. 466,407 X
Acquisition Mayfair Mansions MHCDO and CPDC 7 - Acq. 1,200,000 X
Rental Glendale Plaza Apartments 7 82 Rehab. 975,000 X
Homeowner Northeast Parcel Development DC Habitat for Humanity 7 7 New Constr. 475,000 X
Homeowner Northeast Parcel Development DC Habitat for Humanity 7 7 New Constr. 126,500 X
Rental Apartment Homes II-Homes for Hope 7 2 Rehab. 400,000 X
DC Scattered Site Preservation 7 55 Acq. 4,566,771 X
Rental Southview Apartments Southview Redevelopment Ltd. 8 256 Constr. 2,850,000 X
Rental Second Family Home Second Family Home 8 36 Constr. 3,355,000 X
Homeowner Stanton Square 8 119 Rehab. 8,326,283 X
Rental Hunter Pines W.C. Smith 8 102 Constr. 900,000 X
Rental Miriam's House 8 16 Rehab/Constr. 2,000,000 X
Rental Danbury Station 8 11 Constr. 713,000 X
Owner Stanton Square Stanton Square, LLC 8 127 Rehab. 8,445,500 X
Rental Veteran's Center Annex Renovation 8 16 Rehab 2,900,000 X
Rental Sayles Place Homes Redevelopment Sayles Place Homes, Inc. 8 61 Constr. 1,339,225 X
Rental 2300 Pennsylvania Avenue 2300 Pennsylvania Ave, LLC 8 115 Constr. 7,500,000 X
Rental Wheeler Terrace 8 114 Rehab. 3,250,000 X
Rental Finankra Place Independent Living 8 8 Rehab. 445,000 X
Artist/Live Work Marshall Heights MHCDO 7 TBD PreDev./Acq. 5,000,000 X X
Special Needs Finankara Independent Living 8 12 Rehab. 260,171 X
Rental DC Chamber of Commerce - Housing DC Chamber of Commerce 8 TBD PreDev/ Acq 500,000 X
Rental SOME - Naylor Road SOME 8 40 Rehab. 3,500,000 X
GRAND TOTAL 1,224 143,624,479
19
WITHDRAWN
* LEGEND
°No disbursements due to held retainage, no requisitions or awaiting C of O
**Note - Leverage is the amount of other funding that is generated for each HPTF dollar
Acq.—Acquisition CLT—Construction Loan Takeout Constr. —Construction Demo.—Demolition Lead 1—Lead Hazard Control Grant Lead 2- Lead Hazard Reduction Demonstration PY—Units Counted in Prior Years Pre-Dev. —Pre-Development Cost Rehab. —Rehabilitation Withdrawn—A project no longer in pipeline

FY2013 HPTF ANNUAL REPORT
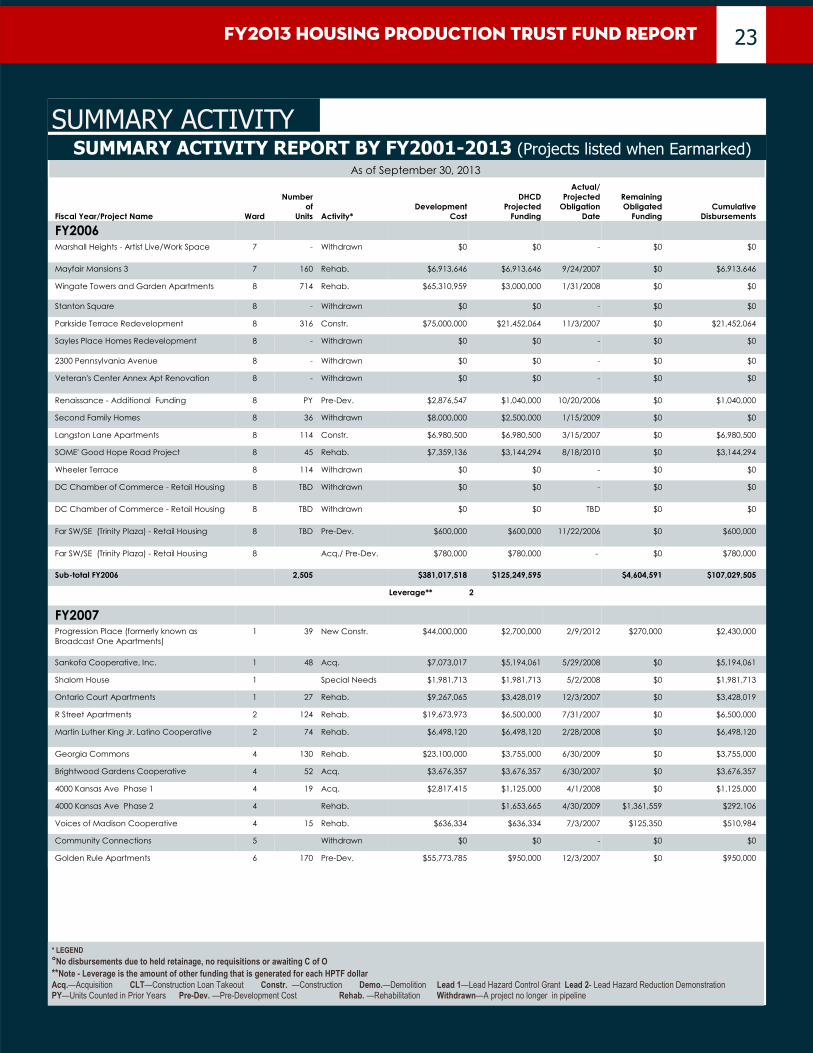
SUMMARY ACTIVITY REPORT BY FY2001-2013 (Projects listed when Earmarked) As of September 30, 2013
Fiscal Year/Project Name Ward
Number
of
Units Activity*
Development
Cost
DHCD
Projected
Funding
Actual/
Projected
Obligation
Date
Remaining
Obligated
Funding
Cumulative
Disbursements
FY2001
Edgewood IV 5 258 Acq. $21,735,657 $3,200,000 7/1/2001 $0 $3,200,000
Sub-total FY2001 258 $21,735,657 $3,200,000 $0 $3,200,000
Leverage** 5.8
FY2002 Trenton Park 8 259 Acq. $11,862,090 $1,750,000 12/1/2001 $0 $1,750,000
Sub-total FY2002 259 $11,862,090 $1,750,000 $0 $1,750,000
Leverage** 5.8
FY2003 Fairmont I and II 1 205 Rehab. $31,710,171 $4,750,000 12/1/2002 $0 $4,750,000
Green Door - 3471 14th Street NW 1 4 Acq./Rehab. $521,160 $368,504 4/1/2004 $0 $368,504
Immaculate Conception 1 136 Acq. $19,770,379 $2,187,557 1/1/2004 $0 $2,187,557
Green Door - 6411 Piney Branch Road NW 4 6 Rehab. $86,500 $74,162 4/21/2006 $0 $74,162
Carver Terrace Community Center 5 312 CLT. $27,096,789 $985,000 12/1/2003 $0 $985,000
North Capitol Plymouth Senior 5 69 New Constr. $6,842,470 $1,629,067 8/1/2003 $0 $1,629,067
Four Walls Development, Inc. 7 15 Rehab. $1,573,000 $773,808 6/1/2005 $93,752 $680,056
Green Door 2721 Pennsylvania Avenue SE 7 6 Acq. $294,548 $174,548 3/1/2004 $0 $174,548
SOME - Independence Place 7 21 New Constr. $3,028,833 $1,300,000 5/1/2004 $0 $1,300,000
Bowling Green Royal Courts 8 126 New Constr. $18,300,000 $1,600,000 6/1/2003 $0 $1,600,000
Community of Hope 8 10 Rehab. $2,565,000 $1,300,000 7/1/2005 $116,023 $1,183,977
Howard Hill 8 44 Constr. $2,726,630 $2,062,497 12/23/2004 $0 $2,062,497
J.W. King Senior Center 8 74 New Constr. $11,656,237 $2,120,000 5/1/2004 $0 $2,120,000
St. Paul Senior Living 8 56 Constr. $5,323,772 $825,000 8/1/2003 $82,500 $742,500
Sub-total FY2003 1,084 $131,495,489 $20,150,143 $292,275 $19,857,868
Leverage** 5.5
FY2004 3128 Sherman Avenue NW 1 13 Acq. $665,000 $665,000 3/1/2004 $0 $665,000
Jubilee Housing Phase IB 1 118 Rehab. $20,894,188 $1,933,803 7/1/2005 $0 $1,933,803
Jubilee Housing Phase IA 1 PY Rehab. $1,620,503 $1,620,503 7/1/2005 $0 $1,620,503
Neighborhood Consejo 1 6 New Constr. $239,211 $100,000 6/1/2005 $0 $100,000
1372 Kenyon Street NW Tenant Purchase 1 - Withdrawn $0 $0 - $0 $0
1340 Fairmont Street Cooperative 1 - Withdrawn $0 $0 - $0 $0
Chinatown East 2 - Withdrawn $0 $0 - $0 $0
Tewkesbury 4 - Withdrawn $0 $0 - $0 $0
Amber Overlook 7 50 New Constr. $17,874,124 $1,200,000 7/31/2006 $0 $1,200,000
GW Carver Seniors 7 103 Pre-Dev. $13,542,000 $1,199,492 7/1/2004 $0 $1,199,492
Graceview/House of Help City of Hope 8 42 Acq. $2,166,900 $2,166,900 2/25/2005 $23,259 $2,143,641
Renaissance 8 12 Rehab. $1,626,547 $1,626,547 12/1/2004 $0 $1,626,547
Residential Rehab/HUD Match to LSW and
WASA Line Replacement Var -
Lead 1/ Lead
2 $16,593,174 $3,950,000 Var $20,000 $3,930,000
Sub-total FY2004 344 $75,221,647 $14,462,245 $43,259 $14,418,986
Leverage** 4.2
20
SUMMARY ACTIVITY
* LEGEND
°No disbursements due to held retainage, no requisitions or awaiting C of O
**Note - Leverage is the amount of other funding that is generated for each HPTF dollar
Acq.—Acquisition CLT—Construction Loan Takeout Constr. —Construction Demo.—Demolition Lead 1—Lead Hazard Control Grant Lead 2- Lead Hazard Reduction Demonstration PY—Units Counted in Prior Years Pre-Dev. —Pre-Development Cost Rehab. —Rehabilitation Withdrawn—A project no longer in pipeline

FY2013 HOUSING PRODUCTION TRUST FUND REPORT
SUMMARY ACTIVITY REPORT BY FY2001-2013 (Projects listed when Earmarked)
As of September 30, 2013
Fiscal Year/Project Name Ward
Number
of
Units Activity*
Development
Cost
DHCD
Projected
Funding
Actual/
Projected
Obligation
Date
Remaining
Obligated
Funding
Cumulative
Disbursements
FY2005
Hope and a Home I 1 PY Acq. $1,885,183 $1,885,183 12/30/2005 $0 $1,885,183
Kara House Cooperative 1 13 Acq. $1,194,000 $1,194,000 6/30/2006 $0 $1,194,000
CARECEN/ Oscar Romero TA 1 - Withdrawn $0 $0 - $0 $0
Jubilee Housing Phase II 1 - Withdrawn $0 $0 - $0 $0
Crestwood TA 1 22 Acq. $3,595,928 $3,595,928 7/31/2006 $0 $3,595,928
1773 Lanier Place TA 1 - Withdrawn $0 $0 - $0 $0
Las Marias Coop, Inc. TA 1 50 Rehab. $1,815,000 $1,815,000 7/7/2005 $0 $1,815,000
Quest Coop TA 1 - Withdrawn $0 $0 - $0 $0
4th and Rhode Island Avenue NE 1 - Withdrawn $0 $0 - $0 $0
Fairmont I and II - Additional Funding 1 102 Rehab. $35,710,000 $4,000,000 7/14/2006 $0 $4,000,000
Phyllis Wheatley, YWCA Inc. 2 117 Rehab. $674,200 $674,200 9/30/2005 $0 $674,200
4100 Georgia Avenue 4 78 Constr. $15,817,636 $8,136,031 8/6/2007 $588,787 $7,547,244
Metropolitan TA 5 - Withdrawn $0 $0 - $0 $0
Wesley House (Union Wesley) 5 57 New Constr. $16,146,587 $3,101,787 12/13/2006 $0 $3,101,787
Prince Hall Family Apartments 5 - Withdrawn $0 $0 - $0 $0
St. Matthew's Square 6 - Withdrawn $0 $0 - $0 $0
VIF Senior Housing 6 - Withdrawn $0 $0 - $0 $0
Arthur Capper Senior II 8 138 Constr. $19,105,637 $1,700,000 12/28/2005 $0 $1,700,000
A Street Manor Cooperative 7 16 Acq. $1,045,110 $1,045,110 9/22/2005 $0 $1,045,110
Foote Street Renovation 7 2 Rehab./
Constr. $863,125 $345,312 9/30/2008 $11,312 $334,000
George Washington Carver 2000 (Demo) 7 73 Demo. $4,558,300 $2,777,000 1/6/2006 $588,645 $2,188,355
54th Street Apartments 7 - Withdrawn $0 $0 - $0 $0
HFH Transition House 7 12 New Constr. $1,324,000 $470,500 TBD $0 $0
Second Family Home 8 - Withdrawn $0 $0 - $0 $0
Stanton Square 8 - Withdrawn $0 $0 - $0 $0
Park Southern Apartments 8 360 Rehab. $3,076,641 $3,076,641 5/25/2006 $179,306 $2,897,335
Southview 8 - Withdrawn $0 $0 - $0 $0
St. Paul's Senior Living II - Additional Funding 8 PY New Constr. $6,924,000 $1,600,000 6/1/2005 $0 $1,600,000
Archer Park 8 PY New Constr. $60,685,486 $5,648,000 7/1/2008 $0 $5,648,000
Hunter Pines 8 - Withdrawn $0 $0 - $0 $0
Miriam's House 8 - Withdrawn $0 $0 - $0 $0
Freedom House 8 30 Rehab. $1,912,823 $1,177,500 2/23/2006 $0 $1,177,500
Danbury Station 8 - Withdrawn $0 $0 - $0 $0
SAFI Lender - City First Bank Var - Acq. $10,000,000 $5,000,000 8/15/2005 $0 $5,000,000
SAFI Lender - Enterprise Financial Services Var - Acq. $10,000,000 $5,000,000 8/15/2005 $0 $5,000,000
SAFI Lender - Unitarian Universal/United Bank Var - Acq. $10,000,000 $5,000,000 8/15/2005 $0 $5,000,000
SAFI II - Cornerstone Var - Acq. $3,000,000 $3,000,000 3/8/2006 $0 $3,000,000
SAFI II - Washington Area Hsg Trust Var - Acq. $2,000,000 $2,000,000 3/8/2006 $0 $2,000,000
Sub-total FY2005 1,070 $211,333,656 $62,242,192 $1,368,050 $60,403,642
Leverage** 2.4
21
SUMMARY ACTIVITY
* LEGEND
°No disbursements due to held retainage, no requisitions or awaiting C of O
**Note - Leverage is the amount of other funding that is generated for each HPTF dollar
Acq.—Acquisition CLT—Construction Loan Takeout Constr. —Construction Demo.—Demolition Lead 1—Lead Hazard Control Grant Lead 2- Lead Hazard Reduction Demonstration PY—Units Counted in Prior Years Pre-Dev. —Pre-Development Cost Rehab. —Rehabilitation Withdrawn—A project no longer in pipeline

FY2013 HPTF ANNUAL REPORT
SUMMARY ACTIVITY REPORT BY FY2001-2013 (Projects listed when Earmarked)
As of September 30, 2013
Fiscal Year/Project Name Ward
Number
of
Units Activity*
Development
Cost
DHCD
Projected
Funding
Actual/
Projected
Obligation
Date
Remaining
Obligated
Funding
Cumulative
Disbursements
FY2006
Jubilee Housing Phase II 1 70 Withdrawn $0 $0 - $0 $0
1703 Euclid NW 1 - Withdrawn $0 $0 - $0 $0
New Beginning Cooperative 1 15 Acq. $1,812,700 $1,812,700 9/30/2006 $0 $1,812,700
1025 Park Road 1 - Withdrawn $0 $0 - $0 $0
The Heights of Columbia 1 56 Withdrawn $0 $0 - $0 $0
Cavalier Apartments 1 - Withdrawn $0 $0 - $0 $0
1025 Park Road 1 8 Rehab. $1,297,726 $661,000 1/31/2008 $0 $0
MLK Jr. Latino Cooperative 2 74 Acq. $13,542,009 $8,398,000 9/30/2006 $0 $8,398,000
1107 11th Street Apartments 2 - Withdrawn $0 $0 - $0 $0
Phyllis Wheatley, YWCA Inc. 2 - Withdrawn $0 $0 - $0 $0
Ashbury Dwellings 2 - Withdrawn $0 $0 - $0 $0
Parcel 42 (RLA Revitalization Corporation) 2 97 New Constr. $27,794,677 $7,454,500 TBD $0 $0
Woodley House 3 - Withdrawn $0 $0 - $0 $0
4211 2nd Street Apartments (Victory Hills) 4 23 Rehab. $3,011,232 $425,000 2/16/2007 $0 $425,000
Rittenhouse - Nat'l Children's Center 4 5 Withdrawn $0 $0 - $0 $0
The Duncan Cooperative 4 27 Acq. $2,565,400 $2,565,400 8/6/2009 $0 $2,565,400
Kentucky Scott, LLC (Kennedy Apartments) 4 21 Rehab. $2,003,641 $2,003,641 7/31/2007 $0 $1,979,051
8th Street Apartments 4 - Withdrawn $0 $0 - $0 $0
Colorado Cooperative 4 36 Acq. $3,150,000 $3,150,000 2/28/2007 $0 $3,150,000
St. Martin's Project 5 184 New Constr. $42,577,454 $9,512,000 9/30/2008 $450,116 $9,061,884
Bates Street Townhomes Cooperative 5 5 Acq./Rehab. $1,705,403 $1,705,403 12/26/2006 $0 $1,705,403
Carver Terrace Community Center 5 PY New Constr. $27,096,789 $350,000 11/3/2005 $0 $350,000
The Elizabeth Ministry - Foster Care 5 27 Rehab. $7,000,000 $2,406,986 7/1/2008 $0 $2,406,986
The Elizabeth Ministry - Foster Care 5 - Pre-Dev. $292,327 $292,327 2/28/2007 $0 $292,327
Dance Place - Artist Live/Work Space 5 - Withdrawn $0 $0 - $0 $0
The Dunbar 6 19 Acq./Rehab. $2,654,970 $1,124,475 7/31/2009 $154,475 $970,000
VIF Senior Housing Complex 6 15 Withdrawn $0 $0 - $0 $0
Family Homes I 6 - Withdrawn $0 $0 - $0 $0
Apartment Homes I - Homes for Hope 6 - Withdrawn $0 $0 - $0 $0
801 Pennsylvania Avenue SE 6 N/A Withdrawn $0 $0 - $0 $0
Apartment Homes II - Homes for Hope 7 N/A Withdrawn $0 $0 - $0 $0
Linda Joy and Kenneth Jay Pollin Memorial
Community Center
7 83 Constr. $27,714,743 $8,000,000 8/31/2011 $4,000,000 $4,000,000
HFH Transition House 7 11 Withdrawn $0 $0 - $0 $0
Glendale Plaza Apartments 7 82 Withdrawn $0 $0 - $0 $0
GW Carver Seniors 7 104 New Constr. $14,950,000 $950,000 5/12/2006 $0 $950,000
Bethune House 7 44 Rehab. $3,477,659 $3,477,659 12/3/2007 $0 $3,477,659
Northeast Parcel Development 7 - Withdrawn $0 $0 - $0 $0
Mayfair Mansions 2 7 PY Rehab. $24,550,000 $24,550,000 12/7/2006 $0 $24,550,000
22
SUMMARY ACTIVITY
* LEGEND
°No disbursements due to held retainage, no requisitions or awaiting C of O
**Note - Leverage is the amount of other funding that is generated for each HPTF dollar
Acq.—Acquisition CLT—Construction Loan Takeout Constr. —Construction Demo.—Demolition Lead 1—Lead Hazard Control Grant Lead 2- Lead Hazard Reduction Demonstration PY—Units Counted in Prior Years Pre-Dev. —Pre-Development Cost Rehab. —Rehabilitation Withdrawn—A project no longer in pipeline
FY2013 HOUSING PRODUCTION TRUST FUND REPORT
SUMMARY ACTIVITY REPORT BY FY2001-2013 (Projects listed when Earmarked)
As of September 30, 2013
Fiscal Year/Project Name Ward
Number
of
Units Activity*
Development
Cost
DHCD
Projected
Funding
Actual/
Projected
Obligation
Date
Remaining
Obligated
Funding
Cumulative
Disbursements
FY2006
Marshall Heights - Artist Live/Work Space 7 - Withdrawn $0 $0 - $0 $0
Mayfair Mansions 3 7 160 Rehab. $6,913,646 $6,913,646 9/24/2007 $0 $6,913,646
Wingate Towers and Garden Apartments 8 714 Rehab. $65,310,959 $3,000,000 1/31/2008 $0 $0
Stanton Square 8 - Withdrawn $0 $0 - $0 $0
Parkside Terrace Redevelopment 8 316 Constr. $75,000,000 $21,452,064 11/3/2007 $0 $21,452,064
Sayles Place Homes Redevelopment 8 - Withdrawn $0 $0 - $0 $0
2300 Pennsylvania Avenue 8 - Withdrawn $0 $0 - $0 $0
Veteran's Center Annex Apt Renovation 8 - Withdrawn $0 $0 - $0 $0
Renaissance - Additional Funding 8 PY Pre-Dev. $2,876,547 $1,040,000 10/20/2006 $0 $1,040,000
Second Family Homes 8 36 Withdrawn $8,000,000 $2,500,000 1/15/2009 $0 $0
Langston Lane Apartments 8 114 Constr. $6,980,500 $6,980,500 3/15/2007 $0 $6,980,500
SOME' Good Hope Road Project 8 45 Rehab. $7,359,136 $3,144,294 8/18/2010 $0 $3,144,294
Wheeler Terrace 8 114 Withdrawn $0 $0 - $0 $0
DC Chamber of Commerce - Retail Housing 8 TBD Withdrawn $0 $0 - $0 $0
DC Chamber of Commerce - Retail Housing 8 TBD Withdrawn $0 $0 TBD $0 $0
Far SW/SE (Trinity Plaza) - Retail Housing 8 TBD Pre-Dev. $600,000 $600,000 11/22/2006 $0 $600,000
Far SW/SE (Trinity Plaza) - Retail Housing 8 Acq./ Pre-Dev. $780,000 $780,000 - $0 $780,000
Sub-total FY2006 2,505 $381,017,518 $125,249,595 $4,604,591 $107,029,505
Leverage** 2
FY2007
Progression Place (formerly known as
Broadcast One Apartments)
1 39 New Constr. $44,000,000 $2,700,000 2/9/2012 $270,000 $2,430,000
Sankofa Cooperative, Inc. 1 48 Acq. $7,073,017 $5,194,061 5/29/2008 $0 $5,194,061
Shalom House 1 Special Needs $1,981,713 $1,981,713 5/2/2008 $0 $1,981,713
Ontario Court Apartments 1 27 Rehab. $9,267,065 $3,428,019 12/3/2007 $0 $3,428,019
R Street Apartments 2 124 Rehab. $19,673,973 $6,500,000 7/31/2007 $0 $6,500,000
Martin Luther King Jr. Latino Cooperative 2 74 Rehab. $6,498,120 $6,498,120 2/28/2008 $0 $6,498,120
Georgia Commons 4 130 Rehab. $23,100,000 $3,755,000 6/30/2009 $0 $3,755,000
Brightwood Gardens Cooperative 4 52 Acq. $3,676,357 $3,676,357 6/30/2007 $0 $3,676,357
4000 Kansas Ave Phase 1 4 19 Acq. $2,817,415 $1,125,000 4/1/2008 $0 $1,125,000
4000 Kansas Ave Phase 2 4 Rehab. $1,653,665 4/30/2009 $1,361,559 $292,106
Voices of Madison Cooperative 4 15 Rehab. $636,334 $636,334 7/3/2007 $125,350 $510,984
Community Connections 5 Withdrawn $0 $0 - $0 $0
Golden Rule Apartments 6 170 Pre-Dev. $55,773,785 $950,000 12/3/2007 $0 $950,000
23
SUMMARY ACTIVITY
* LEGEND
°No disbursements due to held retainage, no requisitions or awaiting C of O
**Note - Leverage is the amount of other funding that is generated for each HPTF dollar
Acq.—Acquisition CLT—Construction Loan Takeout Constr. —Construction Demo.—Demolition Lead 1—Lead Hazard Control Grant Lead 2- Lead Hazard Reduction Demonstration PY—Units Counted in Prior Years Pre-Dev. —Pre-Development Cost Rehab. —Rehabilitation Withdrawn—A project no longer in pipeline

FY2013 HPTF ANNUAL REPORT
SUMMARY ACTIVITY REPORT BY FY2001-2013 (Projects listed when Earmarked) As of September 30, 2013
Fiscal Year/Project Name Ward
Number
of
Units Activity*
Development
Cost
DHCD
Projected
Funding
Actual/
Projected
Obligation
Date
Remaining
Obligated
Funding
Cumulative
Disbursements
FY2007
Hyacinth's Place 8 15 New Constr. $2,364,393 $1,753,652 1/31/2009 $229,320 $1,524,332
NE Parcel Development - Storm Water
Infrastructure
7 - Withdrawn $0 $0 - $0 $0
Copeland Manor Cooperative 7 61 Acq. $4,083,606 $4,083,606 4/28/2008 $0 $4,083,606
DC Scattered Site Preservation 7 - Withdrawn $0 $0 - $0 $0
Hacienda Cooperative 7 59 Acq. $7,485,440 $1,419,219 3/31/2009 $0 $1,419,219
Hilltop Terrace Phases I and II 7 14 Withdrawn $4,738,123 $2,282,923 TBD $0 $0
Pleasant Park Cooperative 7 60 Acq. $4,710,265 $4,710,265 4/25/2008 $0 $4,710,265
Far SW/SE (Trinity Plaza) - Retail Housing 8 28 New Constr. $19,831,635 $2,970,000 TBD $0 $0
Finankra Place Independent Living 8 12 Withdrawn $0 $0 TBD $0 $0
Brothers Place 8 30 Withdrawn $2,769,413 $2,769,413 TBD $0 $0
Wheeler Terrace Apartments 8 118 Acq. $33,395,427 $5,725,086 7/1/2008 $44,277 $5,680,809
2300 Pennsylvania Avenue, LLC 8 118 Acq. $32,500,000 $7,500,000 8/1/2008 $0 $7,500,000
Zagami House 8 12 Rehab. $3,846,637 $1,000,000 4/3/2008 $0 $1,000,000
Henson Ridge HOPE VI ADA Accessible 8 22 Rehab. $10,710,000 $2,900,000 3/15/2010 $0 $2,900,000
Workforce Community Land Trust (DMPED) Var - Acq. $4,000,000 $4,000,000 11/2/2007 $0 $4,000,000
SAFI III - Washington Area Housing Trust Var - Acq. $2,000,000 $2,000,000 2/15/2007 $0 $2,000,000
SAFI III - Enterprise Community Loan Var - Acq. $3,000,000 $3,000,000 6/29/2007 $0 $3,000,000
Sub-total FY2007 1,247 $309,932,692 $84,212,433 $2,030,506 $71,729,591
Leverage** 2.4
FY2008 1703 Euclid Street NW 1 3 Rehab. $664,719 $286,147 11/30/2008 $96,549 $189,598
Ailanthus Cooperative, Inc. 1 9 TOPA - Acq. $925,000 $925,000 1/31/2008 $0 $925,000
Claiborne Apartments 1 92 TOPA - Acq. $11,912,076 $11,912,076 7/1/2008 $0 $11,912,076
Quest Cooperative Inc. 1 23 TOPA - Rehab. $2,135,000 $2,135,000 8/1/2008 $0 $2,135,000
Samuel J. Simmons NCBA Estates 1 297 Withdrawn $67,000,000 $3,500,000 TBD
Woodley House 3 31 Special Needs $5,410,437 $1,016,750 9/30/2008 $0 $1,016,750
Brightwood Gardens Cooperative - Rehab. 4 52 Withdrawn $4,907,831 $4,907,831 TBD $0 $0
Webster Gardens 4 52 Acq. / Rehab $12,042,459 $4,000,000 4/30/2010 $1,568,445 $2,431,555
Longfellow Arms Apartments 4 30 Rehab. $9,041,379 $3,854,000 7/31/2008 $59,591 $3,794,409
Big Dreamz - Rehab 5 Withdrawn $251,640 $251,640 TBD $0 $0
Carolton Tenant Association 5 Withdrawn $3,507,704 $3,507,704 TBD $0 $0
Peaceaholics Inc. 5,6,8 32 Pre-Dev. $5,600,000 $600,000 8/1/2008 $0 $600,000
Peaceoholics Inc. 2 5,6,8 32 Acquisition $4,400,000 $4,400,000 4/30/2009 $0 $4,400,000
1314 K Street SE 6 12 Acq. $1,499,265 $1,499,265 9/1/2008 $0 $1,499,265
God is in Control Cooperative - Rehab 6 4 Withdrawn $781,853 $781,853 TBD $0 $0
2711 Q Street - Rehab 7 Withdrawn $635,000 $444,500 TBD $0 $0
Copeland Manor Cooperative - Rehab 7 61 Withdrawn $9,252,295 $5,118,689 TBD $0 $0
Texas Ave SE Project 7 48 Special Needs $7,035,494 $1,913,600 6/30/2009 $0 $1,913,600
The Community Builders Scattered Sites 7 98 Rehab. $20,162,500 $1,059,234 8/1/2008 $36,173 $1,023,061
The Community Builders Scattered Sites 2 7 Acq. $5,000,000 $5,000,000 1/31/2009 $0 $5,000,000
24
SUMMARY ACTIVITY
* LEGEND
°No disbursements due to held retainage, no requisitions or awaiting C of O
**Note - Leverage is the amount of other funding that is generated for each HPTF dollar
Acq.—Acquisition CLT—Construction Loan Takeout Constr. —Construction Demo.—Demolition Lead 1—Lead Hazard Control Grant Lead 2- Lead Hazard Reduction Demonstration PY—Units Counted in Prior Years Pre-Dev. —Pre-Development Cost Rehab. —Rehabilitation Withdrawn—A project no longer in pipeline

FY2013 HOUSING PRODUCTION TRUST FUND REPORT
SUMMARY ACTIVITY REPORT BY FY2001-2013 (Projects listed when Earmarked)
As of September 30, 2013
Fiscal Year/Project Name Ward
Number
of
Units Activity*
Development
Cost
DHCD
Projected
Funding
Actual/
Projected
Obligation
Date
Remaining
Obligated
Funding
Cumulative
Disbursements
FY2008
50th Street NE Project 7 73 Special Needs $9,229,139 $3,348,654 6/30/2009 $0 $3,609,254
BCI Dix Street Phase III 7 Withdrawn $6,600,000 TBD $0 $0
Hacienda Cooperative - Rehab 7 59 Withdrawn $7,485,440 $5,985,440 TBD $0 $0
Victory Square (Parkside View Senior
Apartments
7 98 New Constr. $18,798,648 $3,667,887 2/9/2011 $1,910,802 $1,757,085
Chesapeake Street SOME 8 22 Special Needs $6,355,802 $2,498,600 6/30/2009 $0 $2,498,600
Safe Haven Special Needs Housing 8 Withdrawn $4,250,000 $1,732,366 9/18/2010 $0 $0
SO ME - South Capitol Street 8 53 Special Needs $5,726,444 $337,252 8/18/2010 $0 $337,252
SOME - Naylor Road 8 40 Withdrawn $11,788,881 $3,500,000 TBD $0 $0
Stanton View Townhouses 8 31 New Constr. $11,628,631 $4,000,000 7/1/2008 $0 $4,000,000
22 Atlantic Cooperative 8 15 TOPA - Acq. $1,732,631 $1,732,631 TBD
1029 Perry Street NE 5 16 Acq. $2,888,557 $600,000 8/25/2009 $0 $600,000
E and G Tenant First Right To Purchase Pool 1 ,6, 7 134 Rehab. $33,175,762 $5,385,361 3/22/2011 $0 $5,385,361
Other Obligations Var $196,384
Sub-total FY2008 1417 $285,224,587 $96,501,480 $3,867,944 $18,187,552
Leverage** 2.0
FY2010 1320 Mississippi Avenue 8 19 Rehab. $6,583,525 $4,026,684 8/30/2010 $1,052,371 $2,974,313
Sub-total FY2010 8 19 $6,583,525 $4,026,684 $1,052,371 $2,974,313
Leverage** 0.6
FY2011
1417 N Street NW DC Tenants Association 1 84 Acq. $9,729,479 $3,624,286 7/25/2011 $301,024 $3,323,262
Sierra Cooperative 5 15 Rehab. $2,993,450 $1,116,000 6/30/2012
Benning Station 7 124 Rehab. $31,503,495 $3,000,000 3/4/2012
Carver 2000 Tenants Association Phase II 7 125 New Constr. $3,950,000 1,118,000 3/31/2012 209,158 908842
62nd Street Apartments 7 39 New Constr. $8,000,000 $354,410 9/30/2011 $213,702 $140,708
Agape Apartments 8 12 Rehab. $600,000 $6,000,000 2/28/2012
Sub-total FY2011 399 $56,776,424 $15,212,696 723,884 $4,372,812
Leverage** 2.7
FY2012 Israel Manor Senior Residences 4 49 New Construction $12,835,910 $1,513,000 TBD $0
Ivy City Rehabilitation Projects 7 4 Rehab. $1,219,040 $489,040 TBD
Ivy City Demonstration Projects 7 11 Rehab. $2,984,722 $1,505,900 TBD
Maplewood Apartments 8 94 Rehab. $12,202,432 $2,000,000 TBD
L'Enfant Square Apartments 8 13 Rehab. $1,321,209 $640,000 5/31/2012 $0 $640,000
North Capital Commons 8 123 New Construction $26,430,242 $5,029,426 TBD
Sub-total FY2012 294 $56,993,555 $11,177,366 $0
FY2013 Jubilee Re-Entry Housing Initiative 1 24 Rehab. $3,258,453 $2,922,451 12/13/2012 $603,529 $2,318,922
Crestwood Cooperative, Inc. 1 22 Rehab. $6,167,886 $1,451,032 8/26/2013 $1,244,202 $206,830
Trinity Plaza LLC 8 49 Rehab. $16,438,042 3950000 9/30/2013 $1,521,995 $2,428,005
Some Scattered Site II 6, 8 103 Rehab. $27,949,598 $4,780,000 5/31/2013 $2,714,791 $2,065,209
Buxton Condos 8 24 Rehab. $4,512,787 $1,525,000 3/6/2013 $1,043,299 $481,701
W Street Condos 8 15 Rehab. $2,222,350 $1,498,500 2/13/2013 $0 $1,498,500
Ivy City Rehabilitation 5 4 Rehab. $1,219,040 $489,040 12/31/2012 $31,850 $457,190
Sub-total 241 $61,768,156 $16,616,023 $7,159,666 $9,456,357
Leverage** 2.80
GRAND TOTAL $9,137 $1,609,944,996 $454,800,857 $17,932,036 $313,633,894
Portfolio Leverage** 2.5
25
* LEGEND
°No disbursements due to held retainage, no requisitions or awaiting C of O
**Note - Leverage is the amount of other funding that is generated for each HPTF dollar
Acq.—Acquisition CLT—Construction Loan Takeout Constr. —Construction Demo.—Demolition Lead 1—Lead Hazard Control Grant Lead 2- Lead Hazard Reduction Demonstration PY—Units Counted in Prior Years Pre-Dev. —Pre-Development Cost Rehab. —Rehabilitation Withdrawn—A project no longer in pipeline
SUMMARY ACTIVITY

FY2013 HPTF ANNUAL REPORT 26
* Marshall Heights CDC's parcel Home Again Bundle 16 Property was acquired by the City and the SAFI funds were repaid through an MOU executed between DHCD and the Office of the Deputy Mayor for Planning and Economic Development.
** SAFI Loans to East of the River CDC were written off as a result of foreclosure by the lender, Open Door Housing Fund, resulting in a loss of 4,,811,858 to SAFI. ERCDC filed for bankruptcy soon after the foreclosure.
SITE ACQUISITION FUNDING INITIATIVE CLOSED PROJECTS FY2005-2013
As of September 30, 2013
Lender
Lender Match
Total
SAFI
Loan
Type of
Project
Reserved Units
Developer / Project Name
Address Ward
# of
Project
Units
DHCD
SAFI Amount <30% 31%-50% 51%-80%
DHCD Funds
Disbursed
to Lender
Funds
Repaid to
Lenders Fund Balance
CITY FIRST BANK OF DC
1 THC Affordable Housing Inc.
Ft Stevens 13th Place
6030-6050 13th Place
4 32 $1,995,000 $1,995,000 $3,990,000 Rental 9 23 - $1,995,000
2 SOME
Zagami
1701 19th Street SE
8 13 $498,750 $498,750 $997,500 Rental 13 - - 498,750
3 Marshall Heights CDC
4th & Mississippi Avenue SE
8 95 $1,900,000 $3,850,000 $5,750,000 Ownership - - 95 $1,900,000
4 SOME
Naylor Road
2765 Naylor Road SE
8 45 $1,450,000 $1,450,000 $2,900,000 Rental 45 - - $1,450,000
5 SOME
Mellon Street
523-525 Mellon Street
8 49 $780,936 $780,939 $1,561,875 Rental 49 - -
6 Building Futures
Daffodil House Inc.
3237 Hiatt Place NW
8 32 $900,000 $900,000 $1,800,000 Rental 32 - -
7 Cornerstone Community DC
4800 Arkansas Avenue NW
4 7 $354,375 $354,375 $708,750 Rental 5 2
Sub-total—City First Bank 273 $7,879,061 $9,829,064 $16,999,375 153 23 97 $5,000,000 $5,843,750 $2,964,689
CORNERSTONE, INC.
1 Building Futures
Daffodil House Inc.
3237 Hiatt Place NW
1 32 $1,000,000 $80,000 $1,080,000 Rental 32
2 SOME
Mary Claire House Extended
1511/1513 North Capitol NE
5 7 $407,500 $407,500 $815,000 Rental 7 - - 407,500
3 Community Connections
1255-1261 Mount Olivet Road NE
5 16 $675,000 $700,000 $1,375,000 Rental 16 - - 675,000
4 Community Connections
1820 Fort Davis Street SE
8 11 $500,000 $500,000 Rental 11
5 Community Connections
4715-21 Texas Avenue SE
8 27 $1,500,000 $1,500,000 $3,000,000 Rental 27
6 THC Affordable Inc.
925-935 Kennedy Street NW
4 14 $315,000 $840,000 $1,155,000 Rental 14 315000
Sub-total—Cornerstone 107 $4,397,500 $3,527,500 $7,925,000 107 0 0 $3,000,000 $1,397,500 $0
ENTERPRISE
1 Mi Casa / NDC
Georgia & Lamont LLC
3234-3226, 3228 -3234 Georgia
Avenue, 704 -712 Lamont NW
1 67 $950,000 $950,000 $1,900,000 Rental - - 67 950,000
2 NHT Enterprise
NHTE Kenyon St Preservation LLC
1636 Kenyon Street NW
1 37 $1,845,000 $1,845,000 $3,690,000 Rental 37
3 Manna, Inc.
Douglas Art Building
2414 Douglas Street NE
5 28 $781,065 $781,065 $1,562,130 Ownership - - 28
4 Israel Manor Seniors
Israel Manor
Rhode Island and 10th Street NE
5 33 $247,325 $247,325 $494,650 Rental 33
* 5 Marshall Heights CDC
Home Again Bundle 16
Scattered Sites
$0 $0 $0 - -
6 SOME
Texas Avenue Project
2810-2871 Texas Avenue SE
7 17 $654,945 $942,556 $1,597,501 Rental 17 - - 654,945
SAFI

FY2013 HOUSING PRODUCTION TRUST FUND REPORT
SAFI
27
* Marshall Heights CDC's parcel Home Again Bundle 16 Property was acquired by the City and the SAFI funds were repaid through an MOU executed between DHCD and the Office of the Deputy Mayor for Planning and Economic Development.
** SAFI Loans to East of the River CDC were written off as a result of foreclosure by the lender, Open Door Housing Fund, resulting in a loss of 4,,811,858 to SAFI. ERCDC filed for bankruptcy soon after the foreclosure.
SITE ACQUISITION FUNDING INITIATIVE CLOSED PROJECTS FY2005-2013
Lender
Match
Total
SAFI
Loan
Type of
Project
Reserved Units
Lender
Developer / Project Name
Address Ward
# of
Project
Units
DHCD
SAFI
Amount <30% 31%-50% 51%-80%
DHCD Funds
Disbursed
to Lender
Funds
Repaid to
Lenders Fund Balance
7
The Community Builders
TCB Scattered Sites
5020, 5024, 5027, 5028 Call
Place ; 2700-02, 2701-03,2834 Q
Street, 2701-03 R Street SE
7 98 $2,000,000 $3,500,000 $5,500,000 Rental 43 55 - 2,000,000
8
CPDC
Wheeler Terrace Development LP
1217 Valley Avenue SE
8 113 $1,000,000 $3,000,000 $4,000,000 Rental - 113 - 1,000,000
** 9
East of the River CDC
Home Again Bundle 16
Scattered Sites
8 30 $0 $0 $0 -
10
Parkside Terrace Development
CDC
Parkside Terrace Development
3700 9th Street SE
8 316 $2,000,000 $2,500,000 $4,500,000 Rental 50 131 135 2,000,000
11
Far SW/ SE CDC
Trinity Plaza
3927-3937 South Capital Street
SW
8 49 $292,500 $292,500 $585,000 Ownership - 32 17
12 Jubilee Maycroft
1474 Columbia Road NW 1 48 $2,000,000 $8,800,000 $10,800,000 48
Sub-total—Enterprise 788 $4,292,500 $11,592,500 $15,885,000 50 163 200 $7,728,510 $2,000,000 $5,436,010
OPEN DOOR HOUSING FUND
1 Manna, Inc.
1029 Perry Street NE 5 16 $603,750 $603,750 $1,207,500 Ownership - - 16 $603,750
** 2
East of the River CDC
ERDC- Affordable Rental
1708-1710 T.Street SE
7 30 $0 $0 $0 Rental - - 0
3
SOME
Affordable Housing
Opportunities Inc.
1667 Good Hope Rd SE
8 16 $916,369 $916,369 $1,832,738 Rental 16 - - $916,369
4
SOME
Barnaby St Project
740 Barnaby Street SE
8 11 $892,500 $892,500 $1,785,000 Rental 11 - -
5
SOME
South Capitol Street Project
3828-3830 South Capitol Street
SE
8 54 $735,000 $735,000 $1,470,000 Rental 54 - - $735,000
6
SOME
Chesapeake Street
730-736 Chesapeake Street SE
8 24 $1,441,786 $1,928,114 $3,369,900 Rental 24 - - $1,441,786
** 7
East of the River CDC
ERDC- Affordable Rental
29th Street SE
1814-1816 29th Street SE
8 26 $0 $0 $0 Rental - - 0
** 8
East of the River CDC
Jasper Place
1350-1354 Jasper Place SE
8 40 $0 $0 $0 Rental - - 0
9 Emory Beacon of Light
6203 12th Street, 814 Tuckerman
4 4 $354,375 $354,375 $708,750 Rental 4
Sub-total—Open Door 221 $4,943,780 $5,430,108 $10,373,888 105 0 20 $4,589,405 $3,696,905 $3,342,530
GRAND TOTAL 29 1,389 $21,512,841 $30,379,172 $51,183,263 #VALUE! $415 $186 $317 $20,317,915 $12,938,155 $11,743,229

FY2013 AFFORDABLE HOUSING REPORT
Annual Activity
Statutory
Responses
Multi-Family Non-HPTF Housing
Projects
In FY2013 DHCD spent $13,600,540 of non-HPTF
funds for the acquisition and production of multi-
family, affordable housing in the form of seven
loans or grants. These projects produced 310
units total ($43,873 DHCD contribution per unit):
88 units were created for extremely low income
(under 30% AMI) households with a DHCD
contribution of $2,312,092 (17% of non-HPTF
funding); 108 units were created for very low
income (31%-50% AMI) households with a DHCD
contribution of $3,264,130 (24% of non-HPTF
funding); and 114 units were created for low
income (51%-80% AMI) households with a DHCD
contribution of $8,024,319 (59% of non-HPTF
funding).
Of these funds, $478,053 (4%) were spent on
homeownership projects that created 35 units
while $13,122,487 (96%) was spent on rental
housing projects that created 365 units of
affordable housing.
Non-HPTF HPAP and EAHP Funded
Projects
In FY2013 DHCD spent a total of $8,148,392 of
non-HPTF funds on the Home Purchase Assistance
Program (HPAP) and $1,021,526 in Employer
Assisted Housing Program (EAHP) that resulted
in 250 HPAP and 106 EAHP homeownership units
respectively in the District. The HPAP program
provides participants with a deferred loan that
does not require payment for five years after
closing and is for homeownership only; there is no
rental component. The EAHP provides down
payment and closing costs assistance to eligible
District Government employees who are first time
home purchasers in the District.
Of the 250 affordable homeownership units
produced by HPAP, seven units were funded for
extremely low income (under 30% AMI) households
with a DHCD contribution of $274,151 (3% of non-
HPTF funding), 68 units for very low income (31%-
50% AMI) households with a DHCD contribution of
$2,734,669 (36% of non-HPTF funding), 154 units for
low income (51%-80% AMI) households with a
DHCD contribution of $6,614,056 (63% of non-HPTF
funding) and three units for moderate income
(81%-110%) households with a DHCD non-HPTF
contribution of $19,900 (0.2% of non-HPTF funding).
Lead Safe Washington
In FY2013 DHCD spent $794,636 on the Lead Safe
Washington program, which educates District
residents about the dangers of lead based paint
in buildings built before 1978 as well as provides
funding to test for and remediate lead based
paint hazards in District buildings. The program
provides grants to households under 80% AMI
with 100% of FY2013 funding going toward
households at 50% or below AMI.
Of the 21 grants awarded by the Lead Safe
Washington program in FY2013, no grants went to
extremely low income (under 30% AMI) households,
21 grants went to very low income (31%-50% AMI)
households with a DHCD contribution of $794,636
(100% of funding), and no grants went to low
income (51%-80% AMI) households.
28
Affordable Housing Production Report Amendment Act of 2010, Section 2093
FY2013 AFFORDABLE HOUSING PRODUCTON REPORT

FY2013 AFFORDABLE HOUSING REPORT
Single-Family Residential
Rehabilitation Projects
In FY2013 DCHD spent a total of $525,314 on the
Single-Family Residential Rehabilitation Program
(SFRRP), which allowed for the rehabilitation of
10 single family homes in the District. This
program allows families at or below 80% of AMI
to address accessibility issues and/or bring their
homes up to current District of Columbia
Housing Code standards. This is accomplished
through grants to address roofing and
accessibility issues and loans with very favorable
interest rates and repayment terms for other
repairs needed to bring the home up to District
Housing Code standards. ■■■
DEVELOPMENT FINANCE DIVISION NON-HPTF PROJECTS CLOSED IN FY2013
# Project Name Ward Address Project Sponsor Units
DHCD Source of Funds
Total DHCD
Funding Loan/ Grant
1 6925 Georgia Avenue 4 6925 Georgia Ave NW MiCasa 27 HOME $130,316 Loan
2 5741 Colorado Cooperative LCA (Seed Money) 4 5741 Colorado Ave NW MiCasa 28 CDBG $23,053 Seed Money
3 4708 14th St NW (Cease Fire) Additional funding 4, 8 4708 14th Street NW Cease Fire N/A CDBG $168,410 Grant
4 Ivy City Trinidad 5, 8 1913 Gallaudet Street NE; 1645 Butler St SE
BDC Housing 1 LLC 8 NSP3 $455,000 Loan
5 The Severna II 6 43 K street NE The Severna II LLC 133 HOME $3,500,000 Loan
6 SOME Scattered Site II 6 210 New York Ave et al SOME 71 HOME $900,000 Loan
7 The Atlas Theatre 7 1333 H Street NE Atlas Performing Arts N/A CDBG $6,500,000 Loan
8 Park 22 (Parkside Courts) 8 1406 22nd Street SE Stanton View Development 7 NSP2 $455,000 Loan
9 Altamont Place 8 2335 Altamont Place SOME 36 NSP3 $1,468,761 Loan
TOTALS: 310 $13,600,540
$13,600,540
29
Ivy City Home Rehabilitation Project
DFD

FY2013 AFFORDABLE HOUSING REPORT
HPAP ASSISTANCE CLOSING HOME PURCHASE ASSISTANCE PROGRAM
AMI ADDRESS WARD HPAP EAHP DATE
0-30% 1029 PERRY STREET NE 5 38,835.51 0.00 6/27/2013
0-30% 1842 KENDALL STREET NE 5 34,049.06 0.00 6/28/2013
0-30% 4706 B STREET SE 7 39,494.10 0.00 11/30/2012
0-30% 206 54TH STREET SE 7 40,000.00 0.00 12/17/2012
0-30% 4057 BENNING ROAD NE 7 42,000.00 10,000.00 8/14/2013
0-30% 856 MARJORIE COURT SE 8 40,000.00 0.00 11/30/2012
0-30% 3315 22ND STREET SE 8 39,772.50 0.00 6/25/2013
31-50% 1458 COLUMBIA ROAD NW 1 40,000.00 0.00 12/28/2012
31-50% 4236 GAULT PLACE NE 3 37,525.50 0.00 4/23/2013
31-50% 5501 8TH STREET NW 4 38,042.00 0.00 12/13/2012
31-50% 804 TAYLOR STREET NW 4 50,000.00 10,000.00 1/22/2013
31-50% 4829 4TH STREET NW 4 38,020.00 0.00 6/7/2013
31-50% 1840 CENTRAL PLACE NE 5 37,750.00 0.00 12/27/2012
31-50% 718 DECATUR PLACE NE 5 40,000.00 0.00 2/7/2013
31-50% 1838 CENTRAL PLACE NE 5 37,174.40 0.00 3/22/2013
31-50% 802 DELAFIELD ST NE 5 48,250.00 10,000.00 3/26/2013
31-50% 2237 14TH ST NE 5 40,000.00 0.00 4/17/2013
31-50% 1825 CORCORAN ST NE 5 36,581.59 0.00 4/19/2013
31-50% 1925 CAPITOL AVENUE NE 5 13,212.06 0.00 5/16/2013
31-50% 1927 CAPITOL AVE. NE 5 38,938.00 0.00 5/29/2013
31-50% 1849 KENDALL STREET NE 5 40,000.00 0.00 5/31/2013
31-50% 1029 PERRY STREET NE 5 38,070.84 0.00 6/26/2013
31-50% 1927 CAPITOL AVE. NE 5 37,750.00 0.00 6/27/2013
31-50% 1955 CAPITOL AVE. NE 5 39,015.00 0.00 6/28/2013
31-50% 1840 KENDALL STREET NE 5 40,000.00 0.00 6/28/2013
31-50% 1849 KENDALL STREET NE 5 39,587.36 0.00 8/15/2013
31-50% 1840 KENDALL STREET NE 5 40,000.00 0.00 8/30/2013
31-50% 1854 L STREET NE 5 40,000.00 0.00 9/17/2013
31-50% 475 K STREET NW 6 38,273.00 0.00 11/30/2012
31-50% 800 DIVISION AVE. NE 7 38,870.18 0.00 11/30/2012
31-50% 470 EASTERN AVE. NE 7 38,190.25 0.00 12/5/2012
31-50% 416 EASTERN AVE. NE 7 40,000.00 0.00 12/6/2012
31-50% 5212 F STREET SE 7 36,996.49 0.00 12/12/2012
31-50% 4511 EADS PLACE NE 7 37,361.00 0.00 12/14/2012
31-50% 2760 NAYLOR ROAD SE 7 38,721.50 0.00 12/21/2012
31-50% 4003 BLAINE STREET NE 7 37,205.43 0.00 2/7/2013
31-50% 424 EASTERN AVE. NE 7 40,000.00 0.00 2/7/2013
31-50% 5110 HAYES STREET NE 7 40,000.00 0.00 2/7/2013
31-50% 5056 KIMI GRAY COURT SE 7 36,751.86 0.00 2/15/2013
31-50% 1111 46TH STREET NE 7 41,735.07 0.00 3/14/2013
31-50% 5437 B STREET SE 7 33,612.00 0.00 3/18/2013
31-50% 1047 48TH STREET NE 7 51,040.52 10,000.00 3/18/2013
31-50% 3352 BLAINE STREET NE 7 40,000.00 0.00 3/22/2013
31-50% 1119 46TH PLACE SE 7 32,000.00 0.00 3/29/2013
ASSISTANCE CLOSING HOME PURCHASE ASSISTANCE PROGRAM AMI WARD HPAP EAHP DATE
31-50% 3985 BLAINE STREET NE 7 38,000.00 0.00 4/5/2013
31-50% 5502 EADS STREET NE 7 40,000.00 0.00 4/17/2013
31-50% 4653 H STREET SE 7 34,328.79 0.00 4/17/2013
31-50% 4609 GAULT PLACE NE 7 36,744.08 0.00 5/10/2013
31-50% 410 EASTERN AVENUE NE 7 59,625.75 0.00 5/20/2013
31-50% 505 42ND STREET NE 7 55,585.18 10,000.00 6/20/2013
31-50% 311 59TH STREET NE 7 38,273.50 0.00 7/17/2013
31-50% 4534 DIX STREET NE 7 70,139.99 0.00 8/15/2013
31-50% 704 BARNES STREET NE 7 40,000.00 0.00 8/23/2013
31-50% 5530 BASS PLACE SE 7 48,320.50 10,000.00 8/29/2013
31-50% 245 57TH PLACE NE 7 34,858.02 0.00 8/30/2013
31-50% 859 51ST STREET SE 7 41,866.00 10,000.00 9/12/2013
31-50% 5208 F ST SE 7 38,351.10 0.00 9/18/2013
31-50% 1701 FT. DAVIS STREET SE 7 37,333.25 0.00 9/19/2013
31-50% 2216 HUNTER PLACE SE 8 43,218.97 10,000.00 10/4/2012
31-50% 1806 MORRIS ROAD SE 8 37,187.00 0.00 11/21/2012
31-50% 1216 BARNABY TERR. SE 8 49,040.24 10,000.00 12/7/2012
31-50% 602 GALVESTON PLACE SE 8 35,599.06 0.00 12/31/2012
31-50% 1904 TRENTON PLACE SE 8 47,750.00 10,000.00 1/22/2013
31-50% 342 RALEIGH STREET SE 8 38,075.50 0.00 1/29/2013
31-50% 1264 BARNABY TER. SE 8 50,000.00 10,000.00 3/6/2013
31-50% 124 YUMA STREET SE 8 38,076.10 0.00 3/22/2013
31-50% 3917 MLK JR. AVE. SW 8 31,000.00 0.00 3/27/2013
31-50% 3907 9TH STREET SE 8 39,650.00 0.00 3/29/2013
31-50% 300 50TH STREET SE 8 25,676.10 0.00 4/11/2013
31-50% 615 ATLANTIC STREET SE 8 35,615.13 0.00 4/30/2013
31-50% 2258 MOUNT VIEW PL. SE 8 34,248.78 0.00 6/7/2013
31-50% 315 ATLANTIC STREET SE 8 37,910.00 0.00 6/12/2013
31-50% 2248 CHESTER STREET SE 8 69,061.71 0.00 7/26/2013
31-50% 1432 BANGOR STREET SE 8 38,460.00 0.00 8/27/2013
31-50% 2230 HUNTER PLACE SE 8 40,000.00 0.00 9/23/2013
51-80% 1225 FAIRMONT STREET NW 1 19,750.00 0.00 4/25/2013
51-80% 1225 FAIRMONT STREET NW 1 0.00 10,000.00 4/26/2013
51-80% 1225 FAIRMONT STREET NW 1 9,986.00 0.00 5/24/2013
51-80% 1440 N STREET NW 2 37,750.00 0.00 2/4/2013
51-80% 712 MARIETTA PLACE NW 4 13,000.00 0.00 10/12/2012
51-80% 5551 ILLINOIS AVE. NW 4 48,105.00 10,000.00 11/6/2012
51-80% 723 SOMERSET PLACE NW 4 36,265.39 0.00 12/18/2012
51-80% 5731 CHILLUM PLACE NE 4 35,500.00 0.00 3/29/2013
51-80% 3902 14TH STREET NW 4 6,874.94 0.00 4/22/2013
51-80% 1301 LONGFELLOW STREET NW 4 37,750.00 0.00 4/23/2013
51-80% 961 RANDOLPH STREET NW 4 35,000.00 0.00 9/26/2013
51-80% 5107 12TH STREET NE 5 8,000.00 0.00 11/6/2012
51-80% 1304 GALLAUDET STREET NE 5 7,705.00 0.00 1/3/2013
30
269loans $9,169,918.24 HOME PURCHASE ASSISTANCE PROGRAM
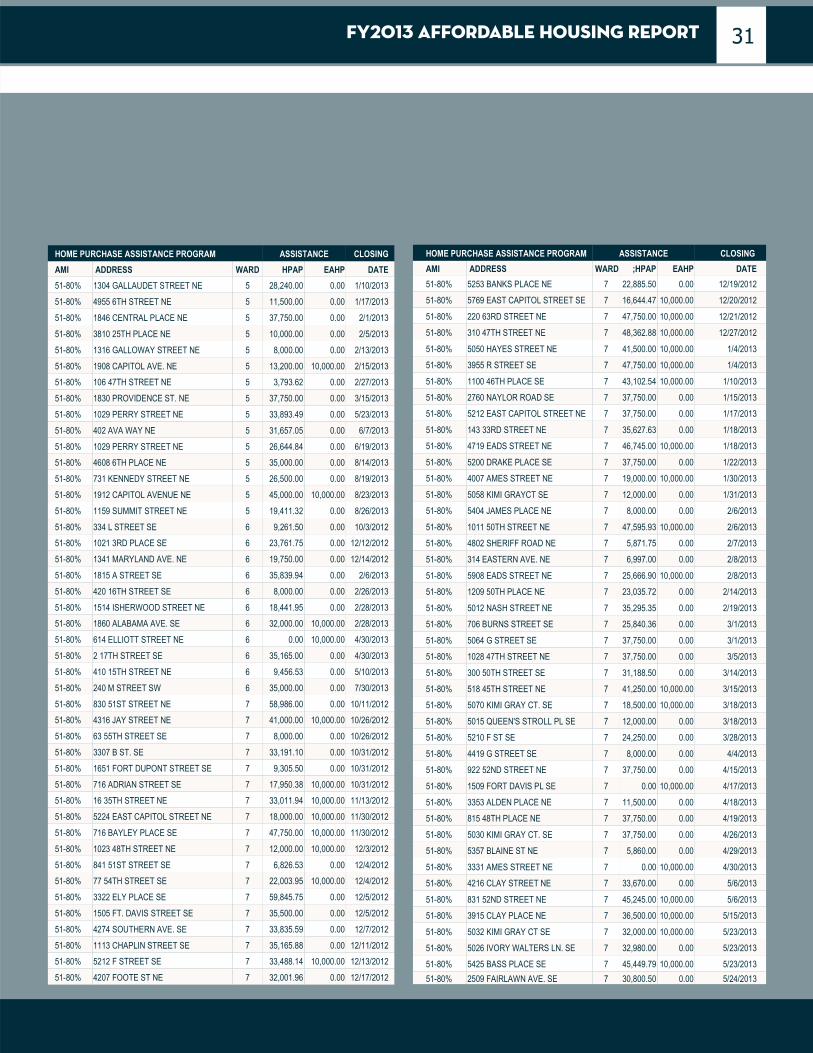
FY2013 AFFORDABLE HOUSING REPORT
ASSISTANCE CLOSING HOME PURCHASE ASSISTANCE PROGRAM
AMI ADDRESS WARD HPAP EAHP DATE
51-80% 1304 GALLAUDET STREET NE 5 28,240.00 0.00 1/10/2013
51-80% 4955 6TH STREET NE 5 11,500.00 0.00 1/17/2013
51-80% 1846 CENTRAL PLACE NE 5 37,750.00 0.00 2/1/2013
51-80% 3810 25TH PLACE NE 5 10,000.00 0.00 2/5/2013
51-80% 1316 GALLOWAY STREET NE 5 8,000.00 0.00 2/13/2013
51-80% 1908 CAPITOL AVE. NE 5 13,200.00 10,000.00 2/15/2013
51-80% 106 47TH STREET NE 5 3,793.62 0.00 2/27/2013
51-80% 1830 PROVIDENCE ST. NE 5 37,750.00 0.00 3/15/2013
51-80% 1029 PERRY STREET NE 5 33,893.49 0.00 5/23/2013
51-80% 402 AVA WAY NE 5 31,657.05 0.00 6/7/2013
51-80% 1029 PERRY STREET NE 5 26,644.84 0.00 6/19/2013
51-80% 4608 6TH PLACE NE 5 35,000.00 0.00 8/14/2013
51-80% 731 KENNEDY STREET NE 5 26,500.00 0.00 8/19/2013
51-80% 1912 CAPITOL AVENUE NE 5 45,000.00 10,000.00 8/23/2013
51-80% 1159 SUMMIT STREET NE 5 19,411.32 0.00 8/26/2013
51-80% 334 L STREET SE 6 9,261.50 0.00 10/3/2012
51-80% 1021 3RD PLACE SE 6 23,761.75 0.00 12/12/2012
51-80% 1341 MARYLAND AVE. NE 6 19,750.00 0.00 12/14/2012
51-80% 1815 A STREET SE 6 35,839.94 0.00 2/6/2013
51-80% 420 16TH STREET SE 6 8,000.00 0.00 2/26/2013
51-80% 1514 ISHERWOOD STREET NE 6 18,441.95 0.00 2/28/2013
51-80% 1860 ALABAMA AVE. SE 6 32,000.00 10,000.00 2/28/2013
51-80% 614 ELLIOTT STREET NE 6 0.00 10,000.00 4/30/2013
51-80% 2 17TH STREET SE 6 35,165.00 0.00 4/30/2013
51-80% 410 15TH STREET NE 6 9,456.53 0.00 5/10/2013
51-80% 240 M STREET SW 6 35,000.00 0.00 7/30/2013
51-80% 830 51ST STREET NE 7 58,986.00 0.00 10/11/2012
51-80% 4316 JAY STREET NE 7 41,000.00 10,000.00 10/26/2012
51-80% 63 55TH STREET SE 7 8,000.00 0.00 10/26/2012
51-80% 3307 B ST. SE 7 33,191.10 0.00 10/31/2012
51-80% 1651 FORT DUPONT STREET SE 7 9,305.50 0.00 10/31/2012
51-80% 716 ADRIAN STREET SE 7 17,950.38 10,000.00 10/31/2012
51-80% 16 35TH STREET NE 7 33,011.94 10,000.00 11/13/2012
51-80% 5224 EAST CAPITOL STREET NE 7 18,000.00 10,000.00 11/30/2012
51-80% 716 BAYLEY PLACE SE 7 47,750.00 10,000.00 11/30/2012
51-80% 1023 48TH STREET NE 7 12,000.00 10,000.00 12/3/2012
51-80% 841 51ST STREET SE 7 6,826.53 0.00 12/4/2012
51-80% 77 54TH STREET SE 7 22,003.95 10,000.00 12/4/2012
51-80% 3322 ELY PLACE SE 7 59,845.75 0.00 12/5/2012
51-80% 1505 FT. DAVIS STREET SE 7 35,500.00 0.00 12/5/2012
51-80% 4274 SOUTHERN AVE. SE 7 33,835.59 0.00 12/7/2012
51-80% 1113 CHAPLIN STREET SE 7 35,165.88 0.00 12/11/2012
51-80% 5212 F STREET SE 7 33,488.14 10,000.00 12/13/2012
51-80% 4207 FOOTE ST NE 7 32,001.96 0.00 12/17/2012
ASSISTANCE CLOSING HOME PURCHASE ASSISTANCE PROGRAM AMI ADDRESS WARD ;HPAP EAHP DATE
51-80% 5253 BANKS PLACE NE 7 22,885.50 0.00 12/19/2012
51-80% 5769 EAST CAPITOL STREET SE 7 16,644.47 10,000.00 12/20/2012
51-80% 220 63RD STREET NE 7 47,750.00 10,000.00 12/21/2012
51-80% 310 47TH STREET NE 7 48,362.88 10,000.00 12/27/2012
51-80% 5050 HAYES STREET NE 7 41,500.00 10,000.00 1/4/2013
51-80% 3955 R STREET SE 7 47,750.00 10,000.00 1/4/2013
51-80% 1100 46TH PLACE SE 7 43,102.54 10,000.00 1/10/2013
51-80% 2760 NAYLOR ROAD SE 7 37,750.00 0.00 1/15/2013
51-80% 5212 EAST CAPITOL STREET NE 7 37,750.00 0.00 1/17/2013
51-80% 143 33RD STREET NE 7 35,627.63 0.00 1/18/2013
51-80% 4719 EADS STREET NE 7 46,745.00 10,000.00 1/18/2013
51-80% 5200 DRAKE PLACE SE 7 37,750.00 0.00 1/22/2013
51-80% 4007 AMES STREET NE 7 19,000.00 10,000.00 1/30/2013
51-80% 5058 KIMI GRAYCT SE 7 12,000.00 0.00 1/31/2013
51-80% 5404 JAMES PLACE NE 7 8,000.00 0.00 2/6/2013
51-80% 1011 50TH STREET NE 7 47,595.93 10,000.00 2/6/2013
51-80% 4802 SHERIFF ROAD NE 7 5,871.75 0.00 2/7/2013
51-80% 314 EASTERN AVE. NE 7 6,997.00 0.00 2/8/2013
51-80% 5908 EADS STREET NE 7 25,666.90 10,000.00 2/8/2013
51-80% 1209 50TH PLACE NE 7 23,035.72 0.00 2/14/2013
51-80% 5012 NASH STREET NE 7 35,295.35 0.00 2/19/2013
51-80% 706 BURNS STREET SE 7 25,840.36 0.00 3/1/2013
51-80% 5064 G STREET SE 7 37,750.00 0.00 3/1/2013
51-80% 1028 47TH STREET NE 7 37,750.00 0.00 3/5/2013
51-80% 300 50TH STREET SE 7 31,188.50 0.00 3/14/2013
51-80% 518 45TH STREET NE 7 41,250.00 10,000.00 3/15/2013
51-80% 5070 KIMI GRAY CT. SE 7 18,500.00 10,000.00 3/18/2013
51-80% 5015 QUEEN'S STROLL PL SE 7 12,000.00 0.00 3/18/2013
51-80% 5210 F ST SE 7 24,250.00 0.00 3/28/2013
51-80% 4419 G STREET SE 7 8,000.00 0.00 4/4/2013
51-80% 922 52ND STREET NE 7 37,750.00 0.00 4/15/2013
51-80% 1509 FORT DAVIS PL SE 7 0.00 10,000.00 4/17/2013
51-80% 3353 ALDEN PLACE NE 7 11,500.00 0.00 4/18/2013
51-80% 815 48TH PLACE NE 7 37,750.00 0.00 4/19/2013
51-80% 5030 KIMI GRAY CT. SE 7 37,750.00 0.00 4/26/2013
51-80% 5357 BLAINE ST NE 7 5,860.00 0.00 4/29/2013
51-80% 3331 AMES STREET NE 7 0.00 10,000.00 4/30/2013
51-80% 4216 CLAY STREET NE 7 33,670.00 0.00 5/6/2013
51-80% 831 52ND STREET NE 7 45,245.00 10,000.00 5/6/2013
51-80% 3915 CLAY PLACE NE 7 36,500.00 10,000.00 5/15/2013
51-80% 5032 KIMI GRAY CT SE 7 32,000.00 10,000.00 5/23/2013
51-80% 5026 IVORY WALTERS LN. SE 7 32,980.00 0.00 5/23/2013
51-80% 5425 BASS PLACE SE 7 45,449.79 10,000.00 5/23/2013
51-80% 2509 FAIRLAWN AVE. SE 7 30,800.50 0.00 5/24/2013
31

FY2013 AFFORDABLE HOUSING REPORT
ASSISTANCE CLOSING HOME PURCHASE ASSISTANCE PROGRAM
AMI ADDRESS WARD HPAP EAHP DATE
51-80% 1024 50TH STREET NE 7 11,500.00 0.00 5/31/2013
51-80% 3211 M STREET SE 7 10,000.00 0.00 6/28/2013
51-80% 4143 ALABAMA AVE. SE 7 45,000.00 10,000.00 6/28/2013
51-80% 305 50TH STREET SE 7 15,970.96 0.00 7/3/2013
51-80% 5545 B STREET SE 7 41,000.00 10,000.00 7/12/2013
51-80% 4413 G STREET SE 7 24,000.00 10,000.00 7/18/2013
51-80% 4237 HILDRETH STREET SE 7 32,591.00 0.00 7/18/2013
51-80% 4644 EASY PLACE SE 7 34,190.25 0.00 7/18/2013
51-80% 3345 CROFFUT PLACE SE 7 35,000.00 0.00 7/22/2013
51-80% 4242 SOUTHERN AVE. SE 7 41,365.72 10,000.00 7/29/2013
51-80% 4924 MEADE STREET NE 7 18,515.83 10,000.00 7/31/2013
51-80% 4624 HANNA PLACE SE 7 6,350.00 0.00 8/1/2013
51-80% 3948 S STREET SE 7 10,000.00 0.00 8/19/2013
51-80% 3612 GRANT PACE NE 7 21,000.00 10,000.00 8/19/2013
51-80% 3610 GRANT PLACE NE 7 35,000.00 0.00 8/19/2013
51-80% 7373 2ND STREET SE 7 0.00 10,000.00 8/19/2013
51-80% 706 BARNES STREET NE 7 39,250.00 10,000.00 8/23/2013
51-80% 5527 C STREET SE 7 29,750.00 10,000.00 8/27/2013
51-80% 3345 DUBOIS PLACE SE 7 35,750.00 10,000.00 8/29/2013
51-80% 4533 C STREET SE 7 18,759.12 10,000.00 8/29/2013
51-80% 3604 GRANT PLACE NE 7 45,000.00 10,000.00 8/30/2013
51-80% 1023 50TH STREET NE 7 14,000.00 0.00 9/6/2013
51-80% 702 BARNES STREET NE 7 35,000.00 0.00 9/6/2013
51-80% 5303 D STREET SE 7 41,711.00 10,000.00 9/12/2013
51-80% 5732 SOUTHERN AVE. SE 7 36,397.36 10,000.00 9/23/2013
51-80% 3608 GRANT PLACE NE 7 25,750.00 10,000.00 9/27/2013
51-80% 4613 GAULT PLACE NE 7 52,680.00 10,000.00 9/30/2013
51-80% 5025 ASTOR PLACE SE 8 44,890.50 10,000.00 10/4/2012
51-80% 526 FOXHALL PLACE SE 8 48,750.00 10,000.00 12/5/2012
51-80% 2703 KNOX TERRACE SE 8 37,750.00 0.00 12/13/2012
51-80% 617 GALVESTON STREET SE 8 45,205.81 10,000.00 12/19/2012
51-80% 2506 BOWEN RD. SE 8 36,598.63 0.00 12/20/2012
51-80% 1928 GOOD HOPE RD. SE 8 37,750.00 0.00 12/27/2012
51-80% 3020 24TH PLACE SE 8 8,000.00 0.00 1/3/2013
51-80% 2500 SAYLES PLACE SE 8 15,250.00 0.00 1/4/2013
51-80% 1342 BARNABY TERRACE SE 8 37,750.00 0.00 1/14/2013
51-80% 4615 6TH STREET SE 8 11,500.00 0.00 2/7/2013
51-80% 1751 TOBIAS DR. SE 8 37,750.00 0.00 2/8/2013
51-80% 1447 RIDGE PLACE SE 8 45,039.48 10,000.00 2/22/2013
51-80% 609 MELLON STREET SE 8 37,750.00 0.00 2/27/2013
51-80% 2208 GOOD HOPE RD. SE 8 28,577.60 10,000.00 2/28/2013
51-80% 2018 TREMONT STREET SE 8 35,588.25 0.00 4/23/2013
51-80% 3472 24TH STREET SE 8 713,965.30 10,000.00 4/26/2013
51-80% 2525 NAYLOR ROAD SE 8 43,410.00 10,000.00 5/13/2013
ASSISTANCE CLOSING HOME PURCHASE ASSISTANCE PROGRAM
AMI ADDRESS WARD HPAP EAHP DATE
51-80% 1345 DEXTER TERRACE SE 8 18,000.00 10,000.00 5/21/2013
51-80% 4004 COLE BLVD SE 8 26,690.63 10,000.00 6/13/2013
51-80% 893 BELLEVUE STREET SE 8 20,000.00 10,000.00 6/28/2013
51-80% 1004 BARNABY TERRACE SE 8 60,687.86 0.00 7/11/2013
51-80% 1421 RIDGE PLACE SE 8 10,360.50 0.00 7/18/2013
51-80% 1612 Q STREET SE 8 29,999.00 10,000.00 7/19/2013
51-80% 725 ATLANTIC STREET SE 8 40,000.00 0.00 7/22/2013
51-80% 709 CONGRESS ST SE 8 23,500.00 10,000.00 7/29/2013
51-80% 4131 4TH STREET SE 8 29,548.76 10,000.00 7/31/2013
51-80% 1808 GAINESVILLE STREET SE 8 32,091.10 0.00 8/2/2013
51-80% 4406 BARNABY ROAD SE 8 35,000.00 0.00 8/26/2013
51-80% 811 CHESAPEAKE ST SE 8 40,031.50 10,000.00 8/29/2013
51-80% 1915 SAVANNAH PL. SE 8 25,750.00 0.00 9/11/2013
51-80% 2205 HARTFORD STREET SE 8 7,525.50 0.00 9/26/2013
81-110% 732 LAMONT STREET NW 1 0.00 10,000.00 1/4/2013
81-110% 1308 CLIFTON STREET NW 1 0.00 5,363.54 2/5/2013
81-110% 1441 EUCLID STREET NW 1 0.00 10,000.00 3/26/2013
81-110% 3900 14TH STREET NW 4 0.00 3,200.00 12/4/2012
81-110% 3921 7TH STREET NW 4 11,900.00 10,000.00 12/7/2012
81-110% 5009 SOUTH DAKATA AVE. NE 5 4,000.00 10,000.00 12/6/2012
81-110% 1910 CAPITOL AVE. NE 5 4,000.00 10,000.00 12/19/2012
81-110% 3821 COMMODORE JOSHUA BARNEYNE 5 0.00 10,000.00 3/8/2013
81-110% 5041 11TH STREET NE 5 0.00 10,000.00 6/3/2013
81-110% 724 EMERSON STREET NE 5 0.00 8,465.38 8/30/2013
81-110% 1621 EAST CAPITOL ST SE 6 0.00 10,000.00 7/11/2013
81-110% 4226 Eads Street NE 7 0.00 10,000.00 11/9/2012
81-110% 3937 AMES STREET NE 7 0.00 0.00 1/15/2013
81-110% 500 25TH PLACE NE 7 0.00 10,000.00 1/15/2013
81-110% 1195 46TH PLACE SE 7 0.00 10,000.00 5/22/2013
81-110% 908 HILLTOP TERRACE SE 7 0.00 3,300.64 5/31/2013
81-110% 4920 MINNESOTA AVE. NE 7 0.00 8,000.00 6/4/2013
81-110% 5030 CENTRAL AVE. SE 7 6,500.00 7/10/2013
81-110% 4619 HILLSIDE RD. SE 7 0.00 10,000.00 7/12/2013
81-110% 5808 F STREET SE 7 0.00 0.00 7/16/2013
81-110% 4846 TEXAS AVE. SE 7 0.00 7,492.00 7/31/2013
81-110% 823 YUMA STREET SE 7 0.00 3,200.00 8/9/2013
81-110% 4341 GORMAN TERRACE SE 7 0.00 10,000.00 8/9/2013
81-110% 2106 MINNESOTA AVE. SE 8 0.00 9,924.97 11/21/2012
110-120% 708 BARNES STREET NE 7 0.00 11,500.00 9/12/2013
110-120% 1841 WOODMONT PLACE SE 8 0.00 7,825.82 12/21/2012
>120% 150 V STREET NW 2 0.00 10,000.00 12/3/2012
>120% 1231 ROCK CREEK FORD RD NW 4 0.00 10,000.00 1/18/2013
>120% 1114 STAPLES STREET NE 5 10,000.00 12/7/2012
>120% 3715 HANSBERRY CT. NE 5 0.00 10,000.00 8/7/2013
>120% 3720 FORT LINCOLN DR. NE 5 0.00 10,000.00 8/16/2013
>120% 800 4TH STREET SW 6 0.00 6,753.40 10/5/2012
>120% 1732 E STREET NE 6 0.00 10,000.00 2/22/2013
>120% 5114 QUEENS STROLL PL. SE 7 0.00 10,000.00 8/7/2013
>120% 1806 GAINESVILLE STREET SE 8 0.00 10,000.00 8/2/2013
TOTAL 8,148,392.49 1,021,525.75
32
HPAP, continued

FY2013 AFFORDABLE HOUSING REPORT
Property Address Ward
Date
Completed Amount
1 6300 North Capitol Street NW 4 2/13/2013 10,393.90
2 1947 H Street NE 5 6/27/2013 74,270.00
3 29 Todd Place NE 5 8/2/2013 74,154.50
4 1205 Kearney Street NE 5 8/2/2013 72,770.00
5 1701 38th Street SE 7 6/27/2013 74,270.00
6 4219 Gault Place NE 7 7/2/2013 8,668.00
7 220 33rd Street NE 7 7/2/2013 5,503.30
8 3046 N Street SE 7 9/24/2013 57,820.40
9 2303 16th Street SE 8 2/13/2013 73,194.20
10 1416 18th Street SE 8 8/2/2013 74,270.00
525,314.30
Property Address Ward Date
Completed Amount
1 1720 Irving Street NW 1 5/1/2013 12,362.50
2 3635 Warder Street NW 1 5/8/2013 22,970.57
3 746 Gresham Place NW 1 5/8/2013 20,069.00
4 765 Princeton Place NW 1 7/10/2013 24,030.85
5 1007 Monroe Street NW 1 7/31/2013 34,891.56
6 3149 Mt. Pleasant Street NW 1 9/16/2013 322,097.88
7 1390 Nicholson Street NW 4 2/5/2013 59,574.11
8 211 Varnum Street NW 4 2/14/2013 14,719.76
9 722 Tuckerman Street 4 7/10/2013 19,632.80
10 110 Varnum Street NW 4 8/16/2013 36,036.50
11 712 Farragut Street NW 4 8/30/2013 26,653.28
12 29 Franklin Street NE 5 1/18/2013 23,957.86
13 3802 Eastern Avenue NE 5 4/3/2013 23,588.00
14 71 U Street NW 5 4/5/2012 33,099.34
15 3705 South Dakota Avenue NE 5 7/3/2013 19,858.40
16 712 4th Street NE 6 2/1/2013 13,002.53
17 702 4th Street NE 6 8/23/2013 19,062.80
18 5112 East Capital Street NE 7 7/15/2013 11,389.00
19 4918 Fitch Place NE 7 7/31/2013 17,250.29
20 1706 Frankford Street SE 8 7/3/2013 10,911.44
21 2019 Naylor Road SE 8 7/10/2013 29,477.15
794,635.62
$794,635.62
$525,314.30
33
LEAD-SAFE WASHINGTON RROGRAM
SINGLE-FAMILY RESIDENTIAL REHABILITATION PROGRAM
SFRRP
LSW

FY2013 AFFORDABLE HOUSING REPORT
Brian T. Kenner Deputy Mayor for Planning and Economic Development
Polly Donaldson, Director DC Department of Housing and Community Development 1800 Martin Luther King Jr. Avenue, SE, Washington, DC 20020 www.dhcd.dc.gov
The financial data in this report was supplied
to DHCD by the Office of the Chief Financial
Officer, District of Columbia.
For information regarding this Housing
Production Trust Fund and Affordable
Housing Annual Report, please contact:
Oke Anyaegbunam
HPTF Manager
Department of Housing and
Community Development (202) 442-7142 [email protected]