fy2018 business results and future outlook · 2019-05-15 · fy2018 business results and future...
TRANSCRIPT

FY2018 Business Results and Future Outlook
(April 1, 2018 – March 31, 2019)
May 14, 2019

Please be aware of the following: * The financial information provided on this material has been prepared in accordance with Japanese GAAP
in principle. * Profit/loss attributable to owners of parent may be mentioned as net profit/loss. * Figures and ratio in this material are rounded to the appropriate unit in principle, and the sums of the
individual figures in each table do not always correspond to the total, because of rounding. * Abbreviations:
CLT: Clinical Laboratory Testing IVD: In Vitro Diagnostics HR: Healthcare Related SR: Sterilization and Related Services ENB: Emerging New Business and others Op. income: Operating income Or. income: Ordinary income
※ Exchange rate: FY2017: 1USD = 110.88JPY 1EURO = 129.70JPY FY2018: 1USD = 110.92JPY 1EURO = 128.41JPY FY2019 (forecast): 1USD = 110.00JPY 1EURO = 127.00JPY

2
Transition of Consolidated Sales (excl. CLT Global)
(¥ billion)
176.3 180.3 175.4 178.8 181.4
0
50
100
150
200
FY14 FY15 FY16 FY17 FY18

3
178.8 181.4 +2.72 +0.13 -0.20 -0.04
170
180
190
FY17 CLT IVD HR FY18
Breakdown of Sales (excl. CLT Global)
(¥ billion)
Exchange impact
4
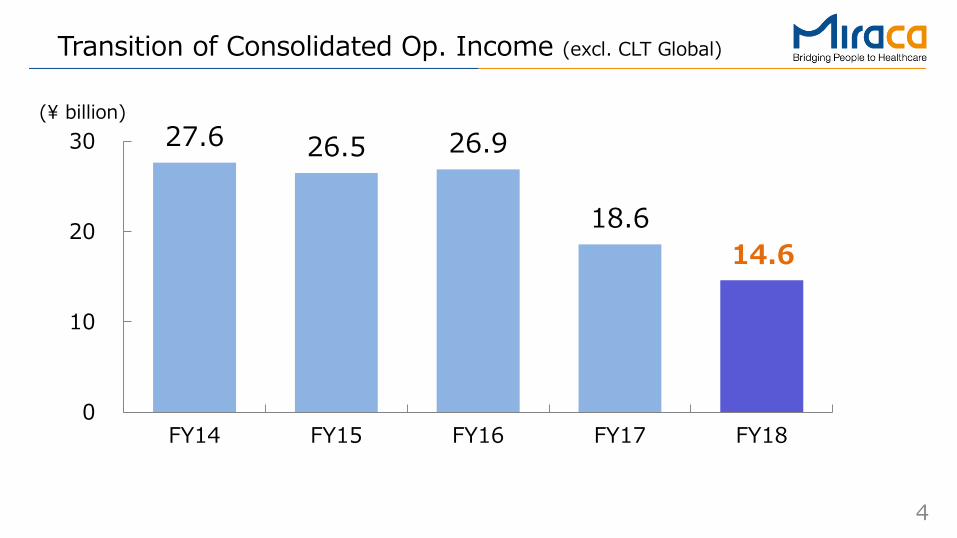
Transition of Consolidated Op. Income (excl. CLT Global)
(¥ billion) 27.6 26.5 26.9
18.6 14.6
0
10
20
30
FY14 FY15 FY16 FY17 FY18

5
18.6
14.6
-2.91 +0.59 -0.98 +0.74 +0.01 -1.32
5
10
15
20
FY17 CLT IVD HR Miraca FY18
Breakdown of Op. Income (excl. CLT Global)
Other factors: Improvement of facilities, optimization of operations, consulting expenses, etc. 1H: ¥1.32 billion (1Q: ¥0.93 billion, 2Q: ¥0.39 billion)
(¥ billion)
Exchange impact
Other factors

6
Transition of Consolidated EBITDA (excl. CLT Global)
EBITDA = Operating income + Depreciation + Amortization of goodwill
(¥ billion) 36.2 35.3 35.5
25.7 24.4
0
10
20
30
40
FY14 FY15 FY16 FY17 FY18

7
45.2 45.3 45.1 43.2 45.0 44.7 45.6 46.2
7.2 6.0
3.4 2.0
3.4 3.6 4.4
3.3
8.8 7.6
5.2 4.1
5.6 6.0 6.9
5.9
0
4
8
12
0
20
40
60
1Q 2Q 3Q 4Q 1Q 2Q 3Q 4Q 1Q 2Q 3Q 4Q 1Q 2Q 3Q 4Q
FY15 FY16 FY17 FY18
Net sales Op. income EBITDA
• Both full-year and quarterly net sales were record-high • Net sales and Op. income increased compared to 4Q/FY17
Quarterly Transition (excl. CLT Global)
Net sales (¥ billion)
Op. income, EBITDA (¥ billion)

8
26.6 23.8 26.4 16.6
11.5
0
10
20
30
FY14 FY15 FY16 FY17 FY18
Transition of Consolidated Ord. Income
【FY17】 【FY18】 Share of loss of entities accounted for
using equity method -¥1.1 bn
Major items of non-operating losses
Share of loss of entities accounted for using equity method -¥3.5 bn
(¥ billion)
(incl. loss between the fair value and book value of BMGL)
9
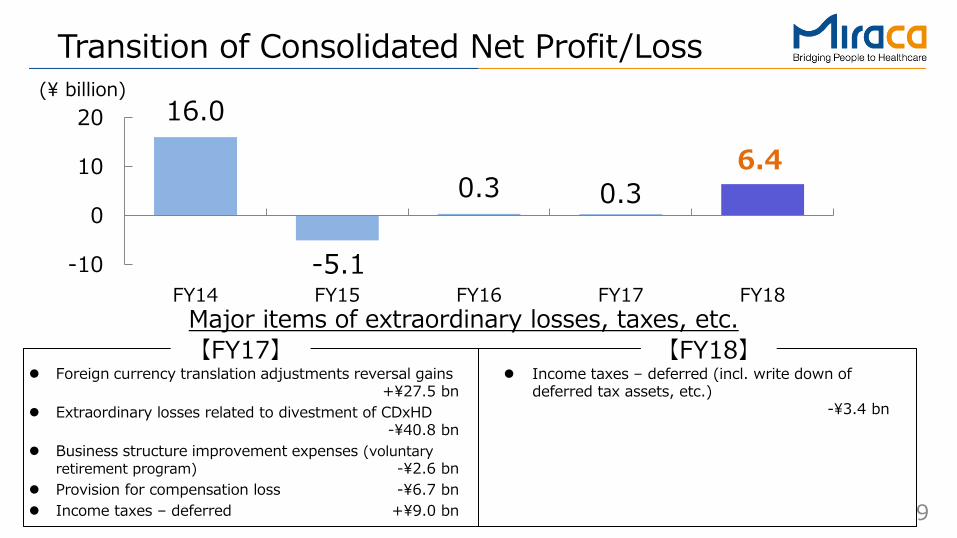
Transition of Consolidated Net Profit/Loss
【FY17】 【FY18】 Major items of extraordinary losses, taxes, etc.
(¥ billion) 16.0
-5.1
0.3 0.3 6.4
-10
0
10
20
FY14 FY15 FY16 FY17 FY18
Income taxes – deferred (incl. write down of deferred tax assets, etc.) -¥3.4 bn
Foreign currency translation adjustments reversal gains +¥27.5 bn
Extraordinary losses related to divestment of CDxHD -¥40.8 bn
Business structure improvement expenses (voluntary retirement program) -¥2.6 bn
Provision for compensation loss -¥6.7 bn Income taxes – deferred +¥9.0 bn

10
Net Sales 195.4 181.4 -13.99 -7.2%
Op. Income 17.6 9.0% 14.6 8.1% -3.05 -17.0%
Ord. Income 16.6 8.5% 11.5 6.4% -5.04 -30.4%
0.3 0.1% 6.4 3.5% +6.13 -
EBITDA 27.3 14.0% 24.4 13.4% -2.93 -10.8%
ROE 0.2% 5.7% +5.5% -
ROIC 7.2% 6.3% -1.0% -
FY2017 FY2018 Variation
Profit/loss attributable toowners of parent
Comparison with FY17 (incl. CLT Global)
1. Op. income includes Miraca Holdings and Miraca Research institute, as well as segmentation adjustments (FY17: -¥2.15 bn, FY18: -¥1.48 bn) 2. EBITDA = Operating income + Depreciation + Amortization of goodwill 3. ROIC=Net operating profit after tax (NOPAT : Operating income – Estimated effective income tax) /
Invested capital (Yearly average of [Net assets + Interest-bearing liabilities (incl. lease obligation) + other fixed liabilities]) 4. Small blue figures shown in the upper right corners are the individual profit margins
(¥ billion)
2
1 1
3
11
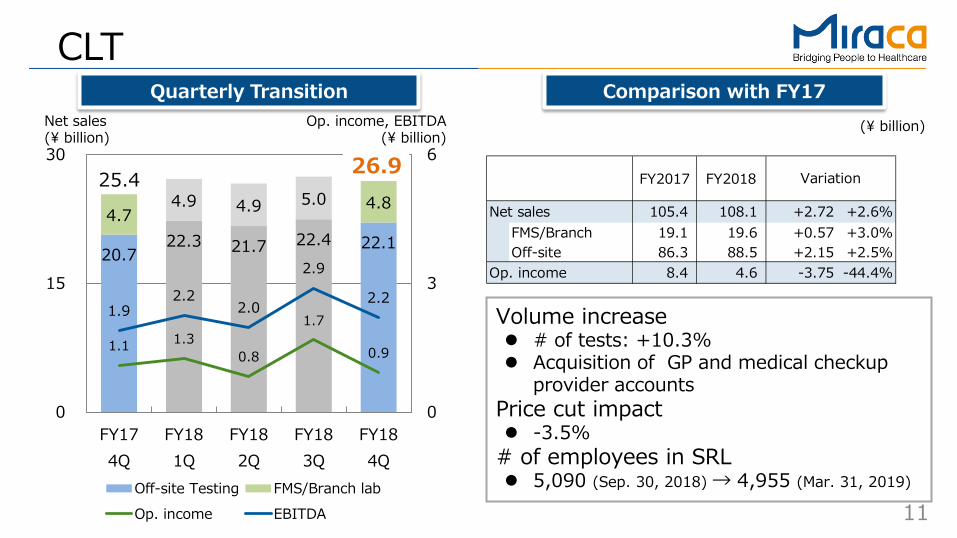
20.7 22.3 21.7 22.4 22.1
4.7 4.9 4.9 5.0 4.8
1.1 1.3 0.8
1.7
0.9
1.9 2.2
2.0
2.9
2.2
0
3
6
0
15
30
FY174Q
FY181Q
FY182Q
FY183Q
FY184Q
Off-site Testing FMS/Branch labOp. income EBITDA
CLT Comparison with FY17 Quarterly Transition
Volume increase # of tests: +10.3% Acquisition of GP and medical checkup
provider accounts Price cut impact -3.5%
# of employees in SRL 5,090 (Sep. 30, 2018) → 4,955 (Mar. 31, 2019)
Net sales (¥ billion)
Op. income, EBITDA (¥ billion)
(¥ billion)
25.4 26.9 FY2017 FY2018
Net sales 105.4 108.1 +2.72 +2.6%FMS/Branch 19.1 19.6 +0.57 +3.0%Off-site 86.3 88.5 +2.15 +2.5%
Op. income 8.4 4.6 -3.75 -44.4%
Variation

12
CLT Comparison with 4Q/FY17 Net sales Op. income EBITDA
20.7 22.1
4.7 4.8
10
20
30
40
FY174Q
FY184Q
0.0
2.5
5.0
FY174Q
FY184Q
0.0
2.5
5.0
FY174Q
FY184Q
0 0 0
+¥1.53 bn +6.0%
26.9 25.4
FMS/ Branch
Off- site
-¥0.17 bn -15.4%
0.9 1.1
+¥0.30 bn +16.1%
2.2 1.9
(¥ billion) (¥ billion) (¥ billion)

13
CLT Quarterly Transition
+1.4% -0.4%
+3.5% +6.0%
26.8 26.7 26.5 25.4
27.2 26.6 27.4 26.9
20
25
30
1Q 2Q 3Q 4Q
FY17 FY18 • Net sales increased due to new accounts’ acquisition, test volume increase and new testing items (e.g. new genome related testing) Growth rate
accelerated as time goes on
Slight decrease in 2Q due to natural disaster
(¥ billion)

14
CLT Progress on Key Strategy
FNS/ Branch
GP
The net # of clients increased • Reinforcement of value-added services
Establishment of satellite labs in manly Tokyo metropolitan area
Collaboration with external services • Acceleration of new clients acquisition and
sales growth through specialist sales unit Net increase # of clients
+516 (FY17) → +933 (FY18) Sales growth compared to previous year
FY17: +0.7% FY18: +2.5%
516
933
0
500
1000
FY17 FY18
15
33
0
20
40
FY17 FY18
Solution proposal as a package utilizing Miraca-IVD product
FNS/Branch customer # increased Net increase # of clients
+15 (FY17) → +33 (FY18) Sales growth compared to previous year
FY17: +2.5%, FY18: +3.0%
Net increase # of GP clients
Net increase # of FNS/Branch clients
15
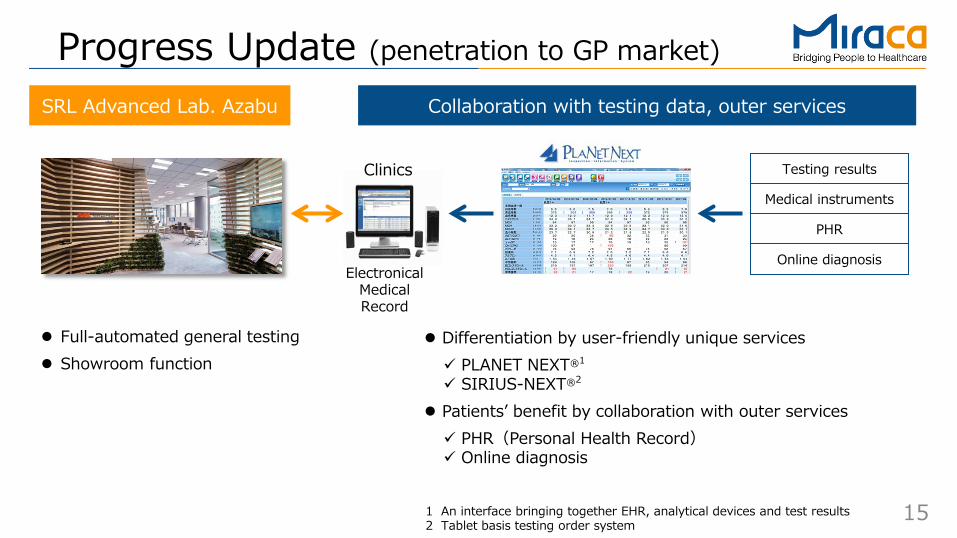
Progress Update (penetration to GP market)
PHR
Clinics Testing results
Electronical Medical Record
SRL Advanced Lab. Azabu Collaboration with testing data, outer services
Differentiation by user-friendly unique services PLANET NEXT®1
SIRIUS-NEXT®2
Patients’ benefit by collaboration with outer services PHR(Personal Health Record) Online diagnosis
Medical instruments
Online diagnosis
1 An interface bringing together EHR, analytical devices and test results 2 Tablet basis testing order system
Full-automated general testing Showroom function

16
IVD Comparison with FY17 Quarterly Transition
Net sales (¥ billion)
11.8 10.9
(¥ billion)
Lumipulse OEM etc. Others Op. income EBITDA
FY2017 FY2018
Net sales 45.3 45.4 +0.09 +0.2%Lumipulse 18.8 19.5 +0.61 +3.3%OEM etc. 15.5 16.2 +0.79 +5.1%Others 11.0 9.6 -1.38 -12.5%
Op. income 9.8 10.0 +0.20 +2.0%
Variation
4.7 4.8 4.8 4.9 4.9
3.6 3.7 4.3 3.9 4.4 2.5 2.4 2.3 2.5 2.4
1.1 2.1 2.8 2.8
2.4 1.9
2.8 3.6 3.5 3.2
0
5
10
0
7
14
FY174Q
FY181Q
FY182Q
FY183Q
FY184Q
Op. income, EBITDA (¥ billion)
Factors for sales increase Lumipulse:+3.3% Growth both in Japan and Overseas
OEM etc.:+5.1% Steady growth incl. front-loaded sales
occurrence from FY19 Factors for sales decrease Others:-12.5% Sales termination of non-core products in
overseas market Decrease in manual testing products in
European and American markets

17
IVD Progress on Key Strategy
Lumipulse Japan
Lumipulse Global
15.9% 14.2%
57.7% 54.6%
26.4% 31.2%
0%
20%
40%
60%
80%
100%
16年度末 18年度末
Ratio by installed instrument size
Small Middle Large
Mar. 31, 2017
Mar. 31, 2019
Annual installation units (incl. both inside and outside group): 147 (FY17) →150 (FY18)
Annual net increase units: +30 Shift from small/middle-sized to large-
sized instrument • Large instrument ratio increased by 4.8%
compared to Mar. 31, 2017
Reagent sales increased according to increased installed units • Annual installation units
Asia: 25 (FY17) → 48 (FY18)
Europe and US: 55 (FY17) → 87 (FY18)
• Annual net increase units Asia: +44 units Europe and US: +73 units

18
4.6 4.7 4.5 4.7 5.1
1.0 0.9 0.8 0.9 1.0
1.4 1.3 1.4 1.2 1.4
0.51 0.52 0.38
0.25 0.31
0.93 0.83
0.72 0.66 0.75
0
1
2
0
4
8
FY174Q
FY181Q
FY182Q
FY183Q
FY184Q
Sterilizing Clinical Trials OthersOp. income EBITDA
HR Comparison with FY17 Quarterly Transition
Sterilizing Sales increase through product sales growth Clinical Trials Sales decrease in clinical trials testing Deconsolidation of Asmo Clinical Pharmacology
Laboratories: approx. -¥0.2 bn compared to FY17 Others Divestment of the pharmacy business (the end of
Oct.): approx. -¥0.8 bn compared to FY17
Net sales (¥ billion)
7.5 7.0
(¥ billion)
FY2017 FY2018
Net sales 28.1 27.9 -0.20 -0.7%Sterilizing 18.4 19.0 +0.54 +2.9%Clinical Trials 4.2 3.6 -0.58 -13.8%Others 5.5 5.4 -0.16 -3.0%
Op. income 2.4 1.5 -0.99 -40.3%
Variation
Op. income, EBITDA (¥ billion)
19
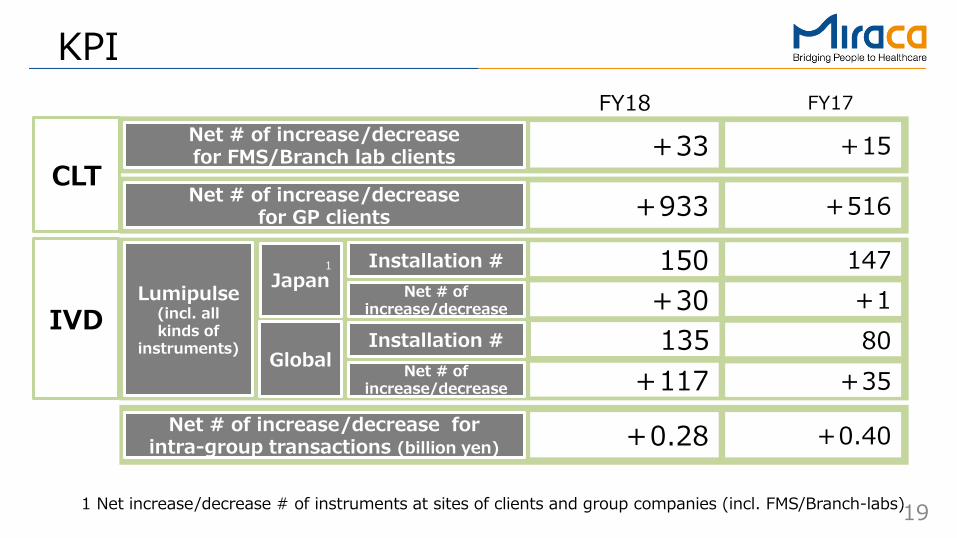
KPI
Net # of increase/decrease for FMS/Branch lab clients
CLT +33 +15
Net # of increase/decrease for GP clients +933 +516
IVD Lumipulse
(incl. all kinds of
instruments)
Japan
Global
150 147
135 80
Net # of increase/decrease for intra-group transactions (billion yen) +0.28 +0.40
1 Installation # Net # of
increase/decrease
Installation #
+30 +1
+117 +35 Net # of increase/decrease
FY18 FY17
1 Net increase/decrease # of instruments at sites of clients and group companies (incl. FMS/Branch-labs)

20
Transition of R&D, CAPEX, D&A (excl. CLT Global) (¥ billion)
Reinforcement of basic research in Miraca Research institute
Depreciation expenses increased by aggressive investments
5.3 5.6 4.7
5.3 5.9
0
4
8
FY14 FY15 FY16 FY17 FY18Plan
FY18
23.0 26.5 15.9
0.3
2.8
1.9
0
15
30
FY14 FY15 FY16 FY17 FY18Plan
FY18
7.5 7.8 7.6
6.1
8.7
0
5
10
FY14 FY15 FY16 FY17 FY18Plan
FY18
29.3 (plan) 9.3
(plan)
17.8
6.5 (plan)
New Lab
R&D CAPEX D&A
New Lab
New Lab 13.8 10.8
7.3
23.4
Focus on investment for sales growth and efficiency improvement Major investment to reform existing operational base has been completed

21
Transition of CAPEX (excl. CLT Global)
FY16: ¥7.3 bn FY17: ¥23.4 bn FY18: ¥17.8 bn
3.11 4.22
7.32
16.09
8.91 8.86
0
5
10
15
20
FY161H
FY162H
FY171H
FY172H
FY181H
FY182H
HR
IVD
CLT
(¥ billion)
MHD, etc.
New CLT Central Lab
Investment for New CLT Central Lab occurs mainly in FY19 and FY20 Total CAPEX: ¥25.0 bn
- Real estate finance scheme applies to land and buildings
Major investment to reform existing operational base has been completed in FY18 Instruments renewal for CLT business Working environment improvement, etc.

22
+13.2 +3.9
+6.0 +2.8 -0.8
160
200
240
Mar. 312018
Land/Buildings
Software Others Mar. 312019
+10.0
+17.6
+15.0 -9.9
-7.5
160
200
240
Mar. 312018
Loanspayable
Loanspayable
Bondspayable
Dividends&
Others
Mar. 312019
Consolidated Balance Sheet
(¥ billion)
Net assets Liabilities and net assets
Provision for
compensation loss (short-term) (long-term)
Cash/ Cash
Equivalents
Instrument /Facility
176.1
201.2
176.1
201.2
(¥ billion)
Diverse funding options were taken to implement various investments (loans, corporate bonds, real estate finance, etc.) WACC declined Maintain extra debt capacity by taking real estate finance option for New CLT Central Lab. Equity ratio: 64.2% (as of Mar.31, 2018) → 56.0% (as of Mar. 31, 2019) Net debt: ¥13.2 bn (excl. lease obligations)
23
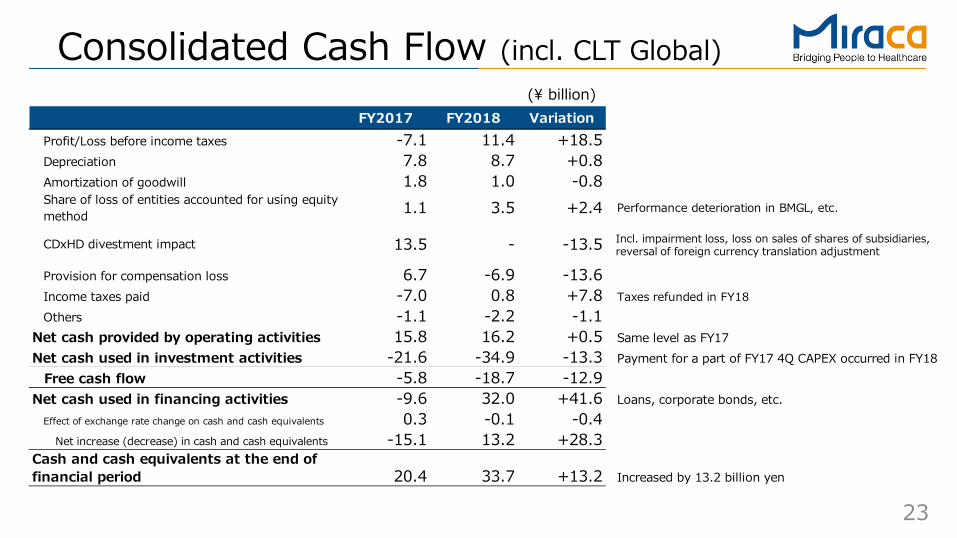
FY2017 FY2018 VariationProfit/Loss before income taxes -7.1 11.4 +18.5Depreciation 7.8 8.7 +0.8Amortization of goodwill 1.8 1.0 -0.8Share of loss of entities accounted for using equitymethod 1.1 3.5 +2.4 Performance deterioration in BMGL, etc.
CDxHD divestment impact 13.5 - -13.5
Provision for compensation loss 6.7 -6.9 -13.6Income taxes paid -7.0 0.8 +7.8 Taxes refunded in FY18Others -1.1 -2.2 -1.1
Net cash provided by operating activities 15.8 16.2 +0.5 Same level as FY17Net cash used in investment activities -21.6 -34.9 -13.3 Payment for a part of FY17 4Q CAPEX occurred in FY18
Free cash flow -5.8 -18.7 -12.9Net cash used in financing activities -9.6 32.0 +41.6 Loans, corporate bonds, etc.
Effect of exchange rate change on cash and cash equivalents 0.3 -0.1 -0.4Net increase (decrease) in cash and cash equivalents -15.1 13.2 +28.3
Cash and cash equivalents at the end offinancial period 20.4 33.7 +13.2 Increased by 13.2 billion yen
Consolidated Cash Flow (incl. CLT Global) (¥ billion)
Incl. impairment loss, loss on sales of shares of subsidiaries, reversal of foreign currency translation adjustment
24
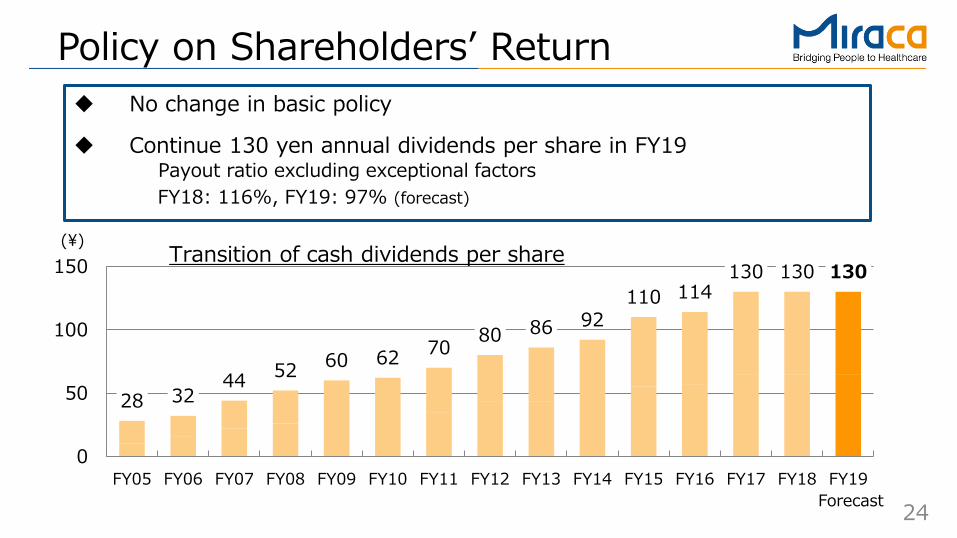
Policy on Shareholders’ Return
(¥)
No change in basic policy
Continue 130 yen annual dividends per share in FY19 Payout ratio excluding exceptional factors FY18: 116%, FY19: 97% (forecast)
Forecast
Transition of cash dividends per share
28 32 44 52 60 62 70 80 86 92
110 114 130 130 130
0
50
100
150
FY05 FY06 FY07 FY08 FY09 FY10 FY11 FY12 FY13 FY14 FY15 FY16 FY17 FY18 FY19

FY2019 Business Plan

26
Main Focus of FY19 FY17 FY18 FY19
Unification as one Miraca group FY16
Resolution of management issues
Update of operational facility, instrument, etc.
Transform! 2020: Create operational base for significant/sustainable growth from 2020
Continuous activities to transform organization culture Rebuilding infrastructure
• Consolidated back office function • IT communication platform • Recruiting reinforcement
Unify corporate systems & rules • New management philosophy • Unification of personnel system &
corporate rules
• Instrument renewal for CLT business
• Working environment improvement, etc.
Major investment for operation improvement has been completed
• Termination of Navi-Lab PJ
• Divestment of CDxHD • Voluntary retirement program
Focus on activities for
future growth
• New business development
• Accelerate investment for future growth

27
Medium-term Plan and FY19 Plan Medium-term target is hard to achieve
Sales Profit
Target revised on May 10, 2018 FY19 target Variation
Net sales 207.0 191.0 -16.0 Op. income 25.0 14.5 -10.5 EBITDA 38.0 26.5 -11.5 ROE 10% or more 6.8% - ROIC 8% or more 5.2% -
• Severe price cut impact than expected (CLT) • Shortfall in new clients acquisition and delay in
sales occurrence (CLT and IVD)
• Shortfall followed by under achievement of sales target (CLT and IVD)
• Delay in operation optimization (CLT) • Upfront investment for expansion in Asia(CLT) • Upfront investment for OEM production
reinforcement (IVD)
(¥ billion)

28
Pillars of FY19 Annual Plan
Further reinforcement
of main business
Upfront investment for future growth
Business development
Uphold basic policy for medium-term plan • Implementation of various strategy for
sales growth • Acceleration of optimization
Construction of New CLT Central Lab.
Sales growth acceleration
Investment to Chinese market Re-entry to food, environment and
cosmetics testing
Establishment of new business development organization
Accelerate group-wide business expansion
Operational base creation for
significant and sustainable
future growth

29
Existing business
Comprehensive Testing Wellness
Medical
Re-entry to food, environment, cosmetics testing industry
Esoteric test Cancer Genomic test
etc. Regenerative
medicine
Community-based care systems
GP Home-visit nursing
Self-medication Service
development through corporate health insurance assoc.
Expansion to Asian region Joint venture in China with Ping An Group
Oversea
Direction of Future Business Expansion
Technology utilization
Global expansion
Domain expansion
Technology development
Market expanstion
30
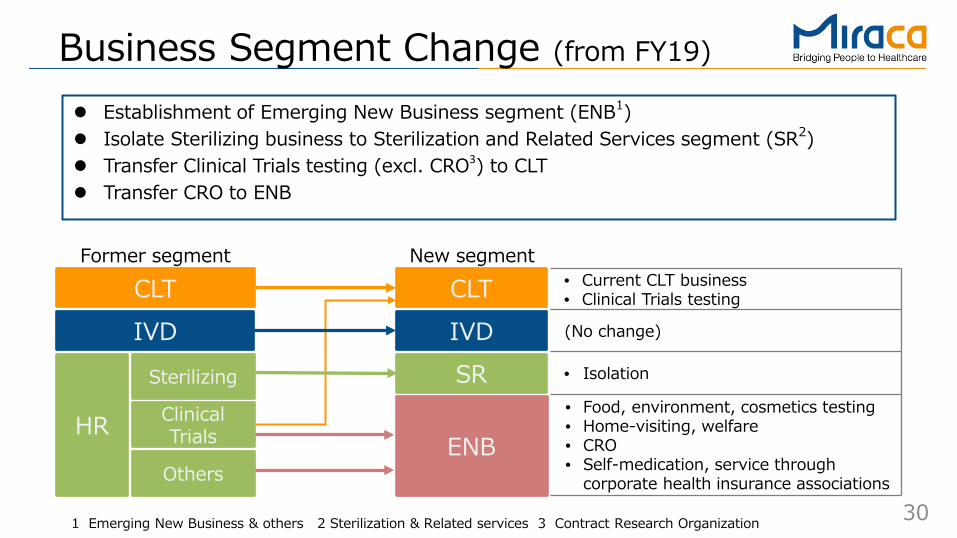
Business Segment Change (from FY19)
Former segment New segment
ENB
(No change)
• Isolation
Establishment of Emerging New Business segment (ENB1) Isolate Sterilizing business to Sterilization and Related Services segment (SR2) Transfer Clinical Trials testing (excl. CRO3) to CLT Transfer CRO to ENB
CLT IVD SR
• Food, environment, cosmetics testing • Home-visiting, welfare • CRO
• Self-medication, service through corporate health insurance associations
1 Emerging New Business & others 2 Sterilization & Related services 3 Contract Research Organization
• Current CLT business • Clinical Trials testing
IVD CLT
HR
Sterilizing
Clinical Trials
Others

31
Sales
Activities to obatin new accounts
Profit • Operation optimization through AI1/RPA2 • Sample collection and logistics function was isolated to
seek collaboration opportunity with others • Profit decrease: upfront investment for business expansion
in Asian countries (approx. -¥0.7 bn) 1 Artificial Intelligence 2 Robotic Process Automation
CLT FY19 Plan
Activities for existing accounts
GP • Value-added services leveraged by IT • Service collaboration with external vendors • Regional office expansion for service level improvement FMS/Branch-lab • Continue joint proposal strategy with Fujirebio Medical checkup • Customer base expansion through connection with
corporate health insurance associations
• Price cut impact: -1.5% (forecast) • New testing item introduction such as cancer genomic test • Sales promotion for existing testing items
111.3
4.9 9.5
FY2018Results
FY2019Plan
Net sales Op. income(¥ billion)
119.5
OP margin 4.4%
OP margin 7.9%
FY18 Results
FY19 Plan

32
IVD FY19 Plan Lumipulse Japan • Continue newly installation of large-sized instrument • Accelerate development of new test items • Impact of JRC1 contract end, etc.: approx. -¥4.0 bn
Factors for profit increase • Profit increase according to Lumipulse sales growth Factors for profit decrease • Profit decrease in domestic business due to JRC contract end and
investment to acquire large customers, etc.: approx. -¥3.0 bn • Transfer JRC business personnel to organic business growth and
application/registration function reinforcement • Reinforcement of OEM production in Europe and US
: approx. -¥ 0.7 bn • Increase in human resources and infrastructure investment
Lumipulse Global • Reinforcement of sales force in mainly Asian countries • Expansion in Chinese market through JV with Ping An group
OEM, etc. • Reinforcement of OEM production through new partners
Sales
Profit
45.4 42.9
10.0 6.3
FY2018Results
FY2019Plan
Net sales Op. income(¥ billion)
OP margin 14.7%
OP margin 22.1%
1 Japan Red Cross
FY18 Results
FY19 Plan

33
SR (Sterilization & Related services) FY19 Plan
Efficiency improvement • Review of operation in off-site facilities
Investment for profitability improvement • Operation optimization • Establishment of new off-site facility
19.0 20.0
1.0 1.3
FY2018Results
FY2019Plan
Net sales Op. income(¥ billion)
OP margin 6.5% OP margin
5.1%
Provide comprehensive support solution to surgery room and surgery supporting room • Additional services on top of sterilization • Transformation from labor-intensive operation
Full services for surgery supporting room • Miraca: Appropriate staffing and sales expansion
Clients: Cost-effective operation
Sales
Profit FY18 Results
FY19 Plan

34
CRO
ENB (Emerging New Business) FY19 Plan
Self-medication,
etc.
Re-organization and investment for CRO growth • Establishment of ideal organization toward
customer demands
Food, environment,
cosmetics testing
Home-visiting, welfare
Operation starts from July, 2019 • Utilization of know-how and re-allocation of staff
formerly engaged to the business • Group synergy with JIFE1
Acceleration of regional expansion in home-visiting business
• Opening of new offices, etc.
Pursuit of group synergy • Sales expansion leveraged by customer bases
(corporate health insurance associations)
5.7
8.6
0.2 -0.4
FY2018Results
FY2019Plan
Net sales Op. income(¥ billion)
OP margin -4.7%
OP margin 4.3%
1 Japan Institute of Foods Ecology, Inc.
FY18 Results
FY19 Plan

35
JV with Ping An group in China
JV (Shenzhen)
SRL
40%
Feb. 2019 Establishment of JV 2Q in FY19 Commencement of service (planned) ・ ・
FY22 Turn over target (equity profit basis)
Ping An group
• JV performance becomes equity profit/loss
• Sales & profit in IVD becomes consolidated results
FR
Schedule
Performance growth through CLT/IVD synergy
Testing labs that will be established
all over China
Equity profit/loss Sales & profit in IVD
60%
Consultation for lab operation Instrument
& reagent sales

36
-20
-10
0
10
20
-80
-40
0
40
80
FY14
FY15
FY16
FY17
FY18
FY19
Nes sales EBITDA
Results and forecast in BMGL
• Book value of BMGL : $US 93.0M (as of Mar. 31, 2019) Amount of intangible asset equivalent
: $US 80.7M (incl. goodwill)
• Amortization for intangible asset equivalent (incl. amortization for goodwill) : $US 7.7M per year
• FY18: Significant sales decline due to loss of the big customer
• FY19: Aim to monthly profit turn over through sales growth by channel partners expansion
BMGL undertakes R&D function in Miraca group Performance transition
(before amortization for goodwill and intangible asset equivalent)
(Plan)
EBITDA ($USM)
Net sales ($USM)

37
Net Sales 181.4 191.0 +9.58 +5.3%
CLT 111.3 119.5 +8.20 +7.4%IVD 45.4 42.9 -2.50 -5.5%SR 19.0 20.0 +1.03 +5.5%ENB 5.7 8.6 +2.85 +49.6%
Op. Income 14.6 8.1% 14.5 7.6% -0.15 -1.0%
CLT 4.9 4.4% 9.5 7.9% +4.62 +94.7%IVD 10.0 22.1% 6.3 14.7% -3.74 -37.2%HR 1.0 5.1% 1.3 6.5% +0.33 +34.3%ENB 0.2 4.3% -0.4 -4.7% -0.65 -
Ord. Income 11.5 6.4% 11.7 6.1% +0.18 +1.5%
6.4 3.5% 7.6 4.0% +1.22 +19.1%
EBITDA 24.4 13.4% 26.5 13.9% +2.15 +8.8%
ROE 5.7% 6.8% +1.1% -
ROIC 6.3% 5.2% -1.1% -
FY2018Result
FY2019Forecast Variation
Profit/loss attributable toowners of parent
FY19 Performance Target (new segment)
1. Op. income includes Miraca Holdings and Miraca Research institute, as well as segmentation adjustments (FY17: -¥1.48 bn, FY18: -¥2.12 bn)
1 1
(¥ billion)

38
Forecast (R&D, CAPEX, D&A)
• Continue reinforcement of R&D for future growth
• CLT: Investment for sales growth and optimization
• IVD:Investment for OEM production • SR:New off-site facility • New Lab:Major investment starts from
FY19
• Depreciation expenses increase followed by aggressive investment
5.6 4.7
5.3 5.9
6.4
0
4
8
FY15 FY16 FY17 FY18 FY19
23.0
15.9 16.8
0.3
1.9 4.6
0
15
30
FY15 FY16 FY17 FY18 FY19
7.8 7.6 6.1
8.7
11.2
0
5
10
15
FY15 FY16 FY17 FY18 FY19
R&D CAPEX D&A (¥ billion)
17.8
23.4
7.3
10.8
21.3 New Lab
New Lab New Lab

Appendix

40
FY19 Performance Target (1H/2H) (¥ billion)
Progress Progress
Net sales 93.4 49% + 3.7 +4% 97.6 51% + 5.8 +6% 191.0
Op. income 5.9 41% - 1.1 -16% 8.6 59% + 1.0 +13% 14.5 7.6%
Ord. income 5.0 43% - 0.8 -14% 6.7 57% + 1.0 +18% 11.7 6.1%
3.0 39% - 1.5 -33% 4.6 61% + 2.7 +141% 7.6 4.0%
EBITDA 11.6 44% + 5.8 +99% 14.9 56% + 9.2 +162% 26.5 13.9%
6.8%5.2%
1H Forecast 2H Forecast FY2019ForecastVariation Variation
ROE
ROIC
Profit/loss attributableto owners of parent
1. Small blue figures shown in the upper right corners are the individual profit margins 2. Comparison with FY18
1 2 2
41
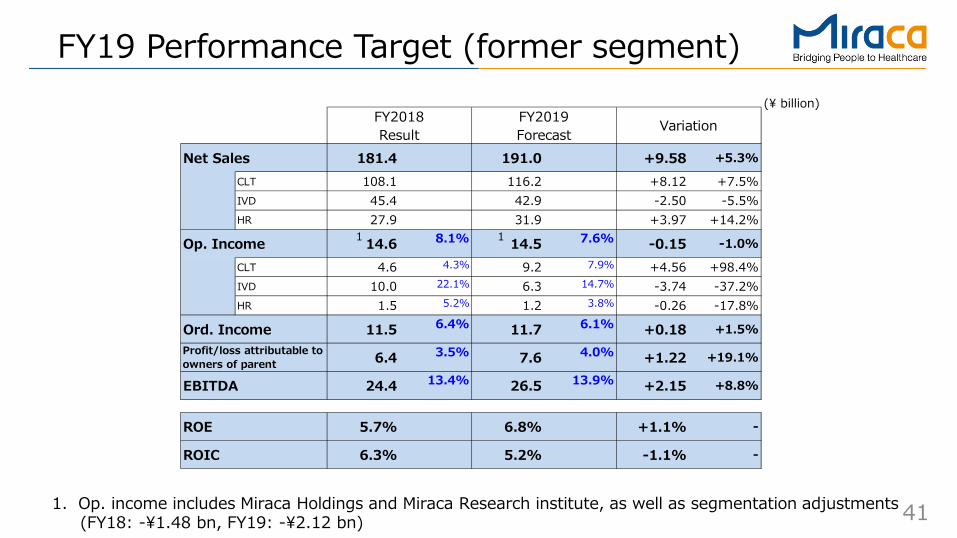
Net Sales 181.4 191.0 +9.58 +5.3%
CLT 108.1 116.2 +8.12 +7.5%IVD 45.4 42.9 -2.50 -5.5%HR 27.9 31.9 +3.97 +14.2%
Op. Income 14.6 8.1% 14.5 7.6% -0.15 -1.0%
CLT 4.6 4.3% 9.2 7.9% +4.56 +98.4%IVD 10.0 22.1% 6.3 14.7% -3.74 -37.2%HR 1.5 5.2% 1.2 3.8% -0.26 -17.8%
Ord. Income 11.5 6.4% 11.7 6.1% +0.18 +1.5%
6.4 3.5% 7.6 4.0% +1.22 +19.1%
EBITDA 24.4 13.4% 26.5 13.9% +2.15 +8.8%
ROE 5.7% 6.8% +1.1% -
ROIC 6.3% 5.2% -1.1% -
FY2019Forecast
FY2018Result Variation
Profit/loss attributable toowners of parent
FY19 Performance Target (former segment)
1. Op. income includes Miraca Holdings and Miraca Research institute, as well as segmentation adjustments (FY18: -¥1.48 bn, FY19: -¥2.12 bn)
1 1
(¥ billion)

42
Net Sales 195.4 181.4 -13.99 -7.2%
CLT 122.0 108.1 -13.87 -11.4%IVD 45.3 45.4 +0.09 +0.2%HR 28.1 27.9 -0.20 -0.7%
Op. Income 17.6 9.0% 14.6 8.1% -3.05 -17.0%
CLT 7.5 6.2% 4.6 4.3% -2.87 -38.2%IVD 9.8 21.7% 10.0 22.1% +0.20 +2.0%HR 2.4 8.7% 1.5 5.2% -0.99 -40.3%
EBITDA 27.3 14.0% 24.4 13.4% -2.93 -10.8%
VariationFY2017 FY2018
FY18 Results (incl. CLT Global) (¥ billion)
1. Op. income includes Miraca Holdings and Miraca Research institute, as well as segmentation adjustments (FY17: -¥2.15 bn, FY18: -¥1.48 bn)
1 1

43
FY18 Results (excl. CLT Global)
1. Op. income includes Miraca Holdings and Miraca Research institute, as well as segmentation adjustments (FY17: -¥2.15 bn, FY18: -¥1.48 bn)
Net Sales 178.8 181.4 +2.61 +1.5%
CLT 105.4 108.1 +2.72 +2.6%IVD 45.3 45.4 +0.09 +0.2%HR 28.1 27.9 -0.20 -0.7%
Op. Income 18.6 10.4% 14.6 8.1% -3.88 -20.9%
CLT 8.4 8.0% 4.6 4.3% -3.75 -44.4%IVD 9.8 21.7% 10.0 22.1% +0.20 +2.0%HR 2.4 8.7% 1.5 5.2% -0.99 -40.3%
EBITDA 25.7 14.4% 24.4 13.4% -1.31 -5.1%
VariationFY2017 FY2018
1 1
(¥ billion)

44
Segment Information (CLT) (incl. CLT Global)
(¥ billion)
FY2017 FY2018122.0 108.1 -13.87 -11.4%105.4 108.1 +2.72 +2.6%
FMS/Branch Lab 19.1 19.6 +0.57 +3.0%Off-site Testing 86.3 88.5 +2.15 +2.5%
Overseas (USA) 16.6 - -16.59 -100.0%
CLT net sales by business categoryJapan
Variation

45
Segment Information (IVD) (¥ billion)
FY2017 FY201845.3 45.4 + 0.09 +0.2%
Products 29.9 29.1 - 0.76 -2.6%Automated immunoassay(Lumipulse)
18.8 19.5 + 0.61 +3.3%
Non-automated immunoassay(HA・PA, EIA, etc.)
6.9 6.0 - 0.93 -13.4%
Rapid assay kits(EL, POCT) 1.1 0.9 - 0.24 -20.8%
Other products 2.9 2.7 - 0.21 -7.2%
15.5 16.2 + 0.79 +5.1%
FY2017 FY201845.3 45.4 + 0.09 +0.2%
Overseas 23.7 24.1 + 0.37 +1.6%Americas 11.9 12.0 + 0.05 +0.4%Europe 9.2 9.7 + 0.41 +4.4%Asia/Pacific 2.6 2.5 - 0.08 -3.2%
Japan 21.6 21.3 - 0.28 -1.3%
IVD net sales by sales destination
VariationIVD net sales by product category
OEM, raw materials, partly-finishedproducts, license, and etc.
Variation

46
R&D, CAPEX, D&A (excl. CLT Global) (¥ million)
R&D Expenses 5,326 5,937 +611 +11.5%CLT 212 320 +108 +50.6%IVD 4,740 4,845 +105 +2.2%HR - - - -MHD, etc. 373 771 +398 +106.6%
Capital Expenditure 23,413 17,768 -5,645 -24.1%CLT 14,580 11,577 -3,003 -20.6%IVD 4,801 3,146 -1,655 -34.5%HR 2,162 1,449 -713 -33.0%MHD, etc. 1,868 1,594 -274 -14.7%
6,081 8,692 +2,610 +42.9%CLT 2,327 4,327 +2,000 +86.0%IVD 2,320 2,598 +279 +12.0%HR 1,234 1,272 +38 +3.1%MHD, etc. 200 493 +293 +146.5%
FY2017 Variation
Depreciation andAmortization
FY2018

47
Number of Employees
Regular: refers to a permanent, fully-fledged employee with no end date to their employment Contract: refers to part-time, temporary or employees with a limited contract
Regular Contractor Regular Contractor Regular ContractorTotal 5,972 6,543 5,957 6,452 -15 - 91
CLT 2,937 3,150 2,906 3,113 -31 - 37IVD 1,093 123 1,116 121 +23 - 2HR 1,545 3,246 1,565 3,193 +20 - 53
Sterilizing 1,214 3,168 1,181 3,118 -33 - 50Clinical Trials 156 3 150 3 -6 ±0Others 175 75 234 72 +59 - 3
MHD, etc. 397 24 370 25 -27 + 1
End of Sep. 2018 End of Mar. 2019 Variation

Disclaimer regarding forward-looking statement: The performance forecast provided in this document is prepared by the management based on currently available information and various hypotheses and ideas including significant risks or uncertainties. Please be aware that the actual performance may turn out to be different from the forecast as a result of various contributing factors. Factors affecting the performance include, among others, aggravation of the economic situation, fluctuation of the exchange rate, change of regulatory, statutory, and administrative requirements, delayed launch of new products, pressures from the product strategies of competitive companies, and decline of the sales potential of existing products.
【Contact information】
IR/SR Department, Corporate Communications Division
Email : [email protected]