fy2017, fy2018, fy2019 economic outlook · 2018. 4. 3. · the global economy will continue to...
TRANSCRIPT

Copyright Mizuho Research Institute Ltd. All Rights Reserved.
February 15, 2018
FY2017, FY2018, FY2019 Economic Outlook- While the global economy will continue to expand, keep a close eye upon shifts in the financial market -

Key points of our forecast
1
The global economy will continue to follow an expansion track in 2018 and follow a firm footing in 2019. However, the growth momentumwill gradually moderate due to the slowdown of the Chinese economy and peak-out of the IT cycle.
Even though Oct-Dec quarter growth fell among major countries, economic conditions among each of the countries generally remain sound.Among the developed market (DM) countries, capital investment – which had led to concerns regarding secular stagnation – is showingsigns of recovery due in part to policy support in the US.
In the US, reform of the tax system is stimulating consumption and investment, thereby prolonging economic expansion. The FederalReserve Board (FRB) under its new Chair, Jerome H. Powell, will likely continue to pursue interest rate hikes during 2018. Even so, giventhe inflation target still has a long way to go, a policy review is likely from 2019.
The risks factors are a sharp fluctuation of the financial markets, slower-than-expected growth of the Chinese economy, and geopoliticalrisks in areas such as the Middle East. In particular, it will be necessary to keep a close eye upon US long-term interest rates and stock priceswhich are showing signs of a shift.
Turning to the Japanese economy in FY2018, even though exports are forecast to slow down along with the moderation of the pace ofrecovery of the IT sector and the Chinese economy, capital investment should continue to follow a gradual recovery, supported byinvestment related to the 2020 Tokyo Olympic and Paralympic Games and investment to boost productivity.
In FY2019, even though the consumption tax hike in October will serve as a drag upon the Japanese economy, the economy should continueto record positive growth for the fifth consecutive year.
Japan’s core inflation rate (excluding energy) should remain low, around 0.5%. In the absence of prospects of achieving its inflation target,the Bank of Japan (BOJ) will likely keep monetary policy on hold for some time.

I. General Overview
Extension of the global economic expansion
2

(Y-o-y % change) (Y-o-y % change) (% point)Calendar year 2015 2016 2017 2018 2019 2017 2018 2017 2018
(Actual) (Actual) (Estimate) (Forecast) (Forecast)
Total of forecast area 3.6 3.4 3.9 4.0 3.9 3.9 3.9 - 0.1
Japan, US, Eurozone 2.4 1.5 2.2 2.2 2.0 2.2 2.0 - 0.2
US 2.9 1.5 2.3 2.5 2.4 2.2 2.3 0.1 0.2
Eurozone 2.1 1.8 2.5 2.2 1.8 2.4 2.0 0.1 0.2
Japan 1.4 0.9 1.6 1.4 1.1 1.7 1.4 -0.1 -
Asia 6.2 6.2 6.1 6.2 6.0 6.1 6.1 - 0.1
China 6.9 6.7 6.9 6.5 6.4 6.8 6.4 0.1 0.1
NIEs 2.1 2.2 3.1 2.8 2.5 3.1 2.6 - 0.2
ASEAN5 4.9 4.9 5.3 5.3 5.1 5.3 5.3 - -
India 7.5 7.9 6.3 7.3 7.3 6.3 7.3 - -
Australia 2.5 2.6 2.3 2.8 2.7 2.3 2.8 - -
Brazil -3.5 -3.5 1.0 2.3 2.6 1.0 2.2 - 0.1
Mexico 3.3 2.9 2.1 2.1 2.4 2.0 2.0 0.1 0.1
Russia -2.8 -0.2 1.5 1.7 1.5 1.5 1.5 - 0.2
Japan (FY) 1.4 1.2 1.7 1.3 0.8 1.8 1.3 -0.1 -
Crude oil price (WTI, USD/bbl) 49 43 51 65 72 51 59 - 6
(Breadth of change fromDec 2017)(Forecast in Dec 2017)
(1) Overview of the global economy: an upward revision mainly with respect to the US economy
Note: The total of the forecast area is calculated upon the 2015 GDP share (PPP) by the IMFSources: Made by MHRI based upon releases by the International Monetary Fund (IMF) and statistics of relevant countries and regions
[ Outlook on the global economy ]
The global economy will continue to expand in 2018, and also enjoy the support from US policy. Despite a slight fall of growth in 2019, theglobal economy will remain on a firm footing.
3

Despite a slowdown of growth in the Oct-Dec quarter, economic conditions among the countries of the world generally remain sound. Considering that the sluggish growth in Japan and the US stems from the increase in imports, domestic demand is firm. Business sentiment
continues to improve, and the economies of developed market (DM) countries are doing well. China has also maintained growth on a par with the previous year due to increased external demand generated by the expansion of the global
economy.
Source: Made by MHRI based upon Markit
[ Global manufacturing PMI ]
Source: Made by MHRI based upon statistics of relevant countries and regions
[ Quarterly GDP growth rates (Japan, US, Eurozone, China ]
4
(2) Overall view of the global economy: the global economy is continuing to follow a recovery trend
6.0
6.2
6.4
6.6
6.8
7.0
7.2
7.4
-1
0
1
2
3
4
5
6
Ⅰ Ⅱ Ⅲ Ⅳ Ⅰ Ⅱ Ⅲ Ⅳ Ⅰ Ⅱ Ⅲ Ⅳ
2015 2016 2017
US Eurozone
Japan China (rhs)
(Q-o-q % change, annualized) (Y-o-y % change)
(Quarter)(Year)
48
50
52
54
56
58
2010 2011 2012 2013 2014 2015 2016 2017 2018
WorldDeveloped market (DM) countriesEmerging market (EM) countries
(Pt)
Expansion←Econom
ic Conditions→
Contraction
Improvement led by DM countries
(yyyy)

DM capital investment is recovering and expansionary fiscal policies such as in the US also provide support
There is a recovery trend for capital investment among DM countries, which had led to concerns regarding secular stagnation. Fiscal spending would normally be tightened when economies are recovering, but prospects of expansionary policies such as the US tax
system reforms underpin the rise of capital investment.
[ Capital investment among DM countries ]
5
Note: Forecast values from 2018. Japan, the US and Eurozone calculated by MHRI, with IMF forecasts used for others
Source: Made by MHRI based upon IMF and each country’s statistics
[ G7 structural fiscal balance ]
Note: Figures based on the IMF’s forecast structural fiscal balances adjusted for the assumed negative impact on fiscal policy due to the cut in taxes under US tax reforms calculated by the JCT and fiscal policy agreements made by the US Congress
Source: Made by MHRI based upon IMF, the US Joint Committee on Taxation (JCT), and the US Congressional Budget Office (CBO)
19
20
21
22
23
24
25
- 20
- 15
- 10
- 5
0
5
10
15
1996 1998 2000 2002 2004 2006 2008 2010 2012 2014 2016 2018
Investment amount (Y-o-y)
Investment amount as a proportion of GDP (rhs)
(%)
Downturn following Lehman shock
(%)
Improving
(yyyy)
- 5.5
- 5.0
- 4.5
- 4.0
- 3.5
- 3.0
- 2.5
- 2.0
2012 2013 2014 2015 2016 2017 2018 2019
(%) Forecast
Calculationsbased on US tax system reforms and fiscal policy agreements made by the US Congress
IMF forecast as of October
2017
(yyyy)

6
Despite awareness of the exit, monetary policy is comparatively accommodative
[ Central bank balance sheets for Japan, the US and Eurozone ] [ Policy interest rates in Japan, the US and the Eurozone ]
Note: Figures from 2018 estimated by MHRI Source: Made by MHRI based upon BOJ, FRB and ECB
While monetary policy among DM countries should gradually head towards the exit, the negative impact will likely be limited due to themoderate pace of the tightening and tapering process. Even if the effective tapering by the ECB and the BOJ is considered addition to the contraction of the FRB’s balance sheet, the aggregate
balance sheet for the three central banks will remain at high levels for the foreseeable future. Our main scenario forecasts that each of the central banks will be quite cautious towards interest rate hikes.
Note Forecasts by MHRISource: Made by MHRI based upon BOJ, FRB and ECB
0
2
4
6
8
10
12
14
16
99 00 01 02 03 04 05 06 07 08 09 10 11 12 13 14 15 16 17 18 19
BOJ
ECB
FRB
Forecast($ trillion)
- 1
0
1
2
3
4
5
6
7
1998 2000 2002 2004 2006 2008 2010 2012 2014 2016 2018
US
Eurozone
Japan
(%)
Forecast
(yyyy)(yyyy)

7
Low inflation is behind the accommodative monetary policy, and there is also the risk of higher inflation
[ Rate of price increases in Japan, the US and Eurozone ] [ Output gap among DM countries ]
Note Price indices focused on by each central bank. Japan: CPI y-o-y (general index, excluding fess food, excluding impact of consumption tax increase); US: PCE Deflator y-o-y (general index excluding energy and food); Eurozone: CPI y-o-y (general index). Forecasts by MHRI
Source: Made by MHRI based upon Ministry of Internal Affairs and Communications, US Department of Commerce and Eurostat
Note DM countries refer to the US, Eurozone, Japan, the UK, South Korea, Canada, Australia, Taiwan. Real GDP indexed to the 2015 standard, synthesized with the 2015 share of PPP base GDPFrom 2017, the figures for the US, Eurozone, Japan, South Korea, Australia and Taiwan are forecast by MHRI. IMF forecasts used for others. Potential GDP calculated with HP filter.
Source: Made by MHRI based upon IMF and each country’s statistics
Continued low inflation is behind the ongoing accommodative stance or cautious exit strategies at each central bank. Under our main scenario, we forecast Japan, the US and the Eurozone will be unable to achieve the 2% price target, and that they will remain
cautious towards monetary tightening. However, the output gap of developed countries, which had remained negative following the financial crisis, is improving. The inflation rate
could also rise in future.
- 3
- 2
- 1
0
1
2
3
4
5
75
80
85
90
95
100
105
110
115
2000 2002 2004 2006 2008 2010 2012 2014 2016 2018
Output gap (rhs)Real GDPPotential GDP
(2015=100)(%)
Forecast
- 2
- 1
0
1
2
3
4
1998 2000 2002 2004 2006 2008 2010 2012 2014 2016 2018
US
Eurozone
Japan
(%)
Forecast
Price target (2%)
(yyyy)

(3) Risk factors: need to watch out for wild fluctuations in the financial market
8
($ billion)
[ US stock prices and long-term yields ]
In the financial markets at the beginning of 2018, stocks rose, interest rates rose and the dollar fell. However, stocks plummeted in February onthe back of concerns about the rapid rise in long-term yields. There was a shift from the Goldilocks situation of strong stocks and higher bonds to strong stocks and lower bonds and more recently weak
stocks and lower bonds caused by the rise in yields. On the other hand, regardless of the widening interest rate differential caused by higher US yields, the dollar weakened due to concerns about
the US administration’s protectionist stance and speculation of a shift in Japanese and European monetary policy. These are serving as factorspushing crude oil prices and expected inflation rate higher, leading to the rise of US interest rates.
[ Nominal effective exchange rate of the US dollar ]
Source: Made by MHRI based upon BloombergSource: Made by MHRI based upon the Fed
1.0
1.5
2.0
2.5
3.0
3.5
4.0
10,000
12,000
14,000
16,000
18,000
20,000
22,000
24,000
26,000
28,000
2011 2012 2013 2014 2015 2016 2017 2018
Dow Average 10Y UST yields (rhs)($) (%)
(yyyy)
90
95
100
105
110
115
120
125
130
135
2011 2012 2013 2014 2015 2016 2017 2018
(Beginning of 2011= 100)
(yyyy)

9
While we forecast a moderate slowdown of the Chinese economy, there are downside risks due to excessive reforms
Despite the progress of reforms since 2018, we need to watch out for the potential overkill from excessive reforms. The Central Economic Work Conference set “eliminating significant risks” being mindful of financial risk as the key policy for the next three
years. This is also linked to controls on the real estate market and curbs on risks of regional government debt. The complexities of theinitiatives are not insignificant.
Apart from the foregoing, there are risks accompanying structural adjustments due to delay of reforms and the destabilization of the economyand the financial system due to overseas factors.
Source: Made by MHRI
[ Potential China risks ]
Main origins and impact on the economy
Domestic factors(in the case of excessive reforms)
• Deterioration of investment in real estate developments due to finance restrictions on real estate developers
• Investment in infrastructure stalls due to measures to curb regional government debt such as standardization of PPP
• Increase in default risks caused by the above measures and the rise of financial systemic risk triggered by measures to prevent financial risk such as shadow banking countermeasures
Domestic factors(in the case of insufficient reforms)
• Rise of risks due to resurgence of real estate speculation and the expansion of shadow banking and the rise of financial systemic risk and economic downturn in the course of such adjustments
External factors• Rise capital outflow pressures triggered by the normalization of monetary policy in the US
and Europe• Deterioration of exports reflecting stronger protectionist policies by the Trump administration

II. The Japanese Economy
10
The Japanese economy will continue to follow a gradual recovery track
11
The Japanese economy: economic recovery driven by overseas economic expansion and strong domestic demand
The First Preliminary Quarterly Estimates of GDP (“1st QE”) for the Oct-Dec quarter of 2017 revealed that the Japanese economy grew+0.5% q-o-q (annualized), recording growth in positive territory for the eight consecutive quarter. Even though the pace of economicgrowth itself moderated due to the sharp rise of imports, our view is that the economy is continuing to follow a firm recovery. Growth inFY2017 is forecast to reach a strong +1.7 %.
In FY2018, while export growth should slow down along with the moderation of the pace of recovery in the IT sector and the Chineseeconomy, capital investment will continue to pick up, supported by investment related to the 2020 Tokyo Olympic and Paralympic Gamesand productivity improvement. Even though higher energy prices will weigh down real wages, wage hikes primarily among small andmedium-sized enterprises should keep personal consumption on solid footing. The pace of economic growth in FY2018 is forecast to standat +1.3%.
In FY2019, the consumption tax hike in October will serve as a drag upon growth, leading to a contraction of growth to +0.8%. Even so,the Japanese economy will maintain growth in positive territory for the fifth consecutive year.
It will be necessary to keep a close eye upon the rise of uncertainties accompanying fluctuations in the financial market, the slower-than-expected growth of the Chinese economy due to structural reforms, and geopolitical risks mainly with respect to conditions surroundingNorth Korea.
Even though the core inflation rate will temporarily rise to the 1%-level due to upward pressures stemming from the rise of energy prices,the underlying trend in inflation excluding the impact of energy prices is forecast to remain around 0.5%.

[ Outlook on the Japanese economy ]
Notes: Figures in the shaded areas are forecasts.Source: Made by MHRI based upon Cabinet Office, Preliminary Quarterly Estimates of GDP.
12
Japan: forecast on growth for FY2017 (+1.7%), FY2018 (+1.3%) and FY2019 (+0.8%)
Even though the Japanese economy will slow down in FY2018 and FY2019, it will continue to follow a gradual recovery track. FY2018: export growth should slow in FY2018 along with the moderation of the pace of recovery in the IT sector and the Chinese economy.
Consumption will gradually slow down, reflecting the rise of prices. FY2019: the consumption tax hike in FY2019 (October 2019) will serve as a slight drag upon economic growth. In addition to the cyclical
slowdown of capital investment, growth is forecast to slow down to +0.8%.

[ Outlook on the Japanese economy (major economic indicators) ]
13
Japan: the underlying trend of consumer prices (excluding food and energy) will likely remain around 0.5%
2016 2017 2018 2019 2017 2018 2019 2020FY Jan-Mar Apr-Jun Jul-Sep Oct-Dec Jan-Mar Apr-Jun Jul-Sep Oct-Dec Jan-Mar Apr-Jun Jul-Sep Oct-Dec Jan-Mar
Q-o-q % ch 1.1 4.7 2.4 1.7 0.2 2.1 0.4 1.8 0.0 0.7 0.5 0.4 0.4 0.8 1.3 -1.2 -0.1
10.0 11.6 5.57.3 13.8 17.9
Nominal compensation of employees Y-o-y % ch 2.4 2.2 2.3 2.1 1.4 2.2 2.2 1.9 2.7 2.6 2.5 2.3 1.9 1.9 2.1 2.1 2.1
% 3.0 2.8 2.8 2.7 2.9 2.9 2.8 2.8 2.8 2.8 2.8 2.8 2.8 2.8 2.7 2.7 2.7
New housing starts P.a., 10,000 units 97.4 95.6 95.6 98.6 97.2 98.7 95.5 94.8 93.2 94.2 94.5 94.3 99.9 103.4 102.3 96.9 91.2
Current account balance P.a., JPY tril 20.4 20.8 17.9 17.2 21.7 19.1 24.7 22.5 17.7 18.6 19.0 18.6 16.2 16.2 14.8 19.0 19.8
Y-o-y % ch -2.3 2.6 2.3 2.0 1.0 2.1 2.9 3.4 2.3 2.1 2.6 2.6 1.9 1.4 1.0 2.7 2.7
Y-o-y % ch - - - 1.1 - - - - - - - - - - - 0.9 0.9
Y-o-y % ch -0.3 0.7 1.1 1.3 0.2 0.4 0.6 0.9 1.0 1.1 1.2 1.1 1.0 0.8 0.7 1.7 1.7
Y-o-y % ch - - - 0.8 - - - - - - - - - - - 0.7 0.6
Y-o-y % ch 0.4 0.2 0.4 1.0 0.1 0.0 0.1 0.3 0.4 0.4 0.4 0.4 0.4 0.4 0.5 1.4 1.5
Y-o-y % ch 0.3 - - 0.5 - - - - - - - - - - - 0.5 0.5
% -0.06 -0.05 -0.05 -0.05 -0.06 -0.07 -0.06 -0.06 -0.05 -0.05 -0.05 -0.05 -0.05 -0.05 -0.05 -0.05 -0.05
% -0.05 0.05 0.08 0.08 0.07 0.04 0.05 0.05 0.08 0.08 0.08 0.08 0.08 0.08 0.08 0.08 0.08
JPY 17,520 21,200 24,500 24,700 19,241 19,503 19,880 22,188 23,200 24,000 24,300 24,600 24,900 25,000 24,700 24,200 24,700
JPY/USD 108 111 111 109 114 111 111 113 109 111 112 111 111 110 109 109 108
USD/bbl 48 53 67 74 52 48 48 55 62 64 66 67 69 71 73 75 76
4.0 2.7 -1.7
Unemployment rate
Domestic corporate goods prices
Domestic corporate goods prices (ex consumptiontax)
Consumer prices, ex fresh food
Consumer prices, ex fresh food (ex consumptiontax)
Consumer prices, ex fresh food and energy
Consumer prices, ex fresh food and energy (exconsumption tax)
1.8 5.8 8.2 -0.622.626.6 11.8 1.95.07.46.5
Industrial production
Ordinary profits(Lower line: excludes impact of special factors) Y-o-y % ch
Crude oil price (WTI nearest term contract)
Exchange rate
Nikkei average
Yield on newly-issued 10-yr JGBs
Uncollateralized overnight call rate
Notes: 1. Figures in the shaded areas are forecasts.The readings above may differ from public releases because the rates of change are calculated by MHRI2. Ordinary profits are based upon the Financial Statements Statistics of Corporations by Industry (all industries basis) (ex finance & insurance)3. Quarterly data on the unemployment rate, new housing starts and current account balance are seasonally-adjusted4. Of the finance-related indices, the uncollateralized overnight call rate refers to the rate at the end of term, the yield on newly-issued 10-yr JGBs refers to the average of the end-of-month rates
during the relevant term, and all others are averages during the relevant termsSources: Made by MHRI based upon relevant statistics

Oct-Dec quarter real GDP grew +0.5% q-o-q p.a., recording the eight consecutive quarter of positive growth. Even though the pace of economicgrowth itself moderated due to the sharp increase of imports, our view is that the economy is continuing to follow firm footing with a recoveryin consumption and acceleration of exports.
FY2018: we forecast economic growth of +1.3% for FY2018. Despite a slowdown in exports and consumption, we forecast growth to remainabove the potential growth rate.
FY2019: we forecast economic growth of +0.8% for FY2019. The consumption tax hike will likely push down the growth rate by approximately0.2% points.
Core CPI will be boosted by energy prices throughout the forecast period. However, we forecast inflation excluding the impact of energy pricesto be low, at around 0.5%.
14
Current status and forecast: firm in FY2018, but a slowdown in FY2019 due to the consumption tax hike
[ Factor contribution to the rate of growth in real GDP ] [ Consumer Price Index forecast (excluding consumption tax) ]
Source: Made by MHRI based upon Cabinet Office, National AccountsNote: Forecast from MHRI used for Q1 2018 and beyondSource: Made by MHRI based upon Ministry of Internal Affairs and Communications,
Consumer Price Index
- 2
- 1
0
1
2
3
4
2012 2013 2014 2015 2016 2017 2018 2019
External demandPublic demandPrivate sector inventory investmentPrivate sector capital investmentHouseholds (Consumption + Housing)Real GDP
(Y-o-y % change)
(Forecast)
(FY)
No increase in consumption tax
- 1.5
- 1.0
- 0.5
0.0
0.5
1.0
1.5
Q1 Q2 Q3 Q4 Q1 Q2 Q3 Q4 Q1 Q2 Q3 Q4 Q1 Q2 Q3 Q4 Q12016 17 18 19 20
US-style Core CPI
Energy
Food (ex. Fresh Food and Alcohol)
General ex. Fresh Food
(Y-o-y % change)
(Quarter/Year)
Forecast

① Sustainability of exports and production: recent deterioration of inventory-shipment balance, particularly forelectronic parts & devices
Since 2016, the IT sector has generally boosted Japan’s exports. Growth accelerated in the Oct-Dec quarter of 2017. On the other hand, the inventory-shipment balance has recently deteriorated, particularly for electronic parts and devices. We are entering a period of build up in inventories. IT exports could slow in the near term. Sluggish demand for the new model iPhone is likely to serve as headwinds.
15
Source: Made by MHRI based upon Bank of Japan, Real Exports and Real Imports,
[ Inventory-shipment balance ][ Factor contribution to real exports ]
Source: Made by MHRI based upon Ministry of Economy, Trade and Industry, Indices of Industrial Production
-4
-3
-2
-1
0
1
2
3
2013 2014 2015 2016 2017
Others
IT-related
Automobile-related
Real exports
(Q-o-q % change)
(yyyy)
- 40
- 30
- 20
- 10
0
10
20
30
40
50
2013 2014 2015 2016 2017
Mechanical (excluding electronic parts & devices industry)
Electronic parts & devices industry
Basic materials
(Y-o-y % change)
(yyyy)

16
[ Inventory-shipment balance of electronic parts & devices ] [ Global semiconductor sales and US and Chinese semiconductor imports ]
However, it should be noted that the deterioration of the inventory-shipment balance is due to the increase in inventories and that shipmentsremain positive. The increase in inventories stems most likely from robust demand. The inventory-shipment balance resembles the period around 2006 to 2007, and a full-fledged correction appears unlikely.
In fact, semiconductor imports by China and the US are continuing to increase, where there is active promotion of IoT and measures to deal withlabor shortages..
While a slowdown from the high level of growth in 2017 is inevitable, demand for semiconductors should remain firm for the time being,against a backdrop of structural shifts over the medium- to long-term such as the expansion of uses such as in-vehicle installations, IoT and datacenters and measures to deal with labor shortages.
Source: Made by MHRI based upon Ministry of Economy, Trade and Industry, Indices of Industrial Production
Note: Backward 3-month moving average y-o-ySource: Made by MHRI based upon CEIC Data
① Sustainability of exports and production: final demand for IT remains firm
- 100
- 50
0
50
100
150
2000 2002 2004 2006 2008 2010 2012 2014 2016
Inventory-shipment balance
Shipments
Inventories
(Y-o-y % change)
Even though the inventory-shipment balance deteriorated, growth in shipments remained positive
(yyyy) - 40
- 20
0
20
40
60
80
2005 2006 2007 2008 2009 2010 2011 2012 2013 2014 2015 2016 2017
China semiconductor imports US semiconductor imports
Global semi-conductor sales
(Y-o-y % change)
(yyyy)

17
Shipments and orders for semiconductor manufacturing equipment have diverged since 2017. This suggests manufacturers of semiconductormanufacturing equipment are approaching the limits of their supply capacity. Manufacturers curbed investment following the Lehman shock, leading to considerable increase in their capacity utilization rates to deal with
the semiconductor boom without expanding capacity. We forecast increased capital investment by major semiconductor manufacturing equipment manufacturers with a gradual increase in the growth
rate for production as the capacity of supply is increased.
Note: As the amount of orders for semiconductor manufacturing equipment is not disclosed, we have used electronic calculation equipment in external demand as a proxy. Semiconductor manufacturing equipment accounted for about 91% of this figure in 2016.
Source: Made by MHRI based upon Cabinet Office, Machinery Orders; and Ministry of Economy, Trade and Industry, Indices of Industrial Production
Source: Made by MHRI based upon Ministry of Economy, Trade and Industry, Manufacturing Industry Statistics Survey
[ Investment in tangible fixed assets by semiconductor manufacturing equipment manufacturers ]
① Sustainability of exports and production: risk that supply capacity limits could dampen production
0
20
40
60
80
100
120
140
160
180
200
2008 2009 2010 2011 2012 2013 2014 2015 2016 2017
Overseas orders for eletronic calculation equipment (substituteindex for semconductor manufacturing equipment - orders)Semiconductor manufacturing equipment - production
(2010 = 100)
(yyyy)0
50,000
100,000
150,000
200,000
250,000
2002 2003 2004 2005 2006 2007 2008 2009 2010 2011 2012 2013 2014 2015
(JPY million)
(yyyy)
[ Semiconductor manufacturing equipment orders and production ]

[ Change in profitability and size of tangible fixed assets (fiscal year base) ]
Note: ROA = ordinary profits / total assets (average of previous year and current year). Investment in plant and equipment = new investment in fixed assets
Source: Made by MHRI based upon Ministry of Finance, Financial Statements Statistics of Corporations by Industry
Note: Red dots indicate the closing point for each period. The final point since 2013 is the 1H 2017 actual
Source: Made by MHRI based upon Ministry of Finance, Financial Statements Statistics of Corporations by Industry
A look at investment returns shows that the divergence between ROA and investment has gradually widened since 2000. Up until around the mid-2000s, when non-operating revenue was negative, investment in plant and equipment was determined on the basis of
profitability that included non-operating revenue. Since non-operating revenue turned positive, the decision to invest in plant and equipmentappears to have been made on the profitability of core business.
From the perspective of asset efficiency, investment since the introduction of Abenomics may be considered as falling within an appropriaterange. The high level of ordinary profit is unlikely to be a reason to accelerate investment.
18
[ Growth rate for ROA (ordinary profit base) and investment in plant and equipment ]
0
20
40
60
80
100
120
140
160
0 20 40 60 80 100 120 140
1970-1990
1991-1999
2000-2007
2008-2012
From 2013
Tangible fixed assets (2010 = 100)O
pera
tring
pro
fit (2
010
= 10
0)
(1) Path fo increase in scale
(2) Focus on profitability
(3) Focus on profitability + supplement demand
② Recovery momentum of capital investment: companies focused on asset efficiency; increased profits do not necessarily mean increase of capital investment
0.00.20.40.60.81.01.21.41.6
-30-20-10
01020304050
71 73 75 77 79 81 83 85 87 89 91 93 95 97 99 01 03 05 07 09 11 13 15 17
Investment in plant and equipment
ROA (ordinary profit base, rhs)
(Y-o-y % change) (%)
-0.5
0.0
0.5
1.0ROA spread (operating profit - ordinary profit, %)
Operating profit < ordinary profitOperating profit > ordinary profit
(yy)

[ Capital stock cycle ]
Note: Investment in plant and equipment is made real with the corporate goods price index (capital goods)
Source: Made by MHRI based upon Ministry of Economy, Trade and Industry, Indices of Industrial Production, Bank of Japan, Corporate Goods Price Index, and Ministry of Finance, Financial Statements Statistics of Corporations by Industry
Note: The dotted lines indicate the expected rate of growth calculated from the trend in the eliminations rate and the capital coefficient.
Source: Made by MHRI based upon Cabinet Office
The correlation coefficients and sensitivity for capital investment relative to the capacity utilization ratio have both fallen compared to before the1990s and after 2000, when companies pursued increased scale. This suggests investment in plant and equipment might not occur even when demand increases unless it is profitable.
In terms of the capital stock cycle, investment is increasing in a way that is somewhat reverse to the normal cycle. This is attributed to active labor saving investment and investment in projects related to the 2020 Tokyo Olympic Games. While the increase
should continue in the near term, we forecast the pace of growth will slow.
19
[ Correlation between the capacity utilization ratio and real investment in plant and equipment ]
0.0
0.1
0.2
0.3
0.4
0.5
0.6
0.7
0.8
0.9
0 1 2 3 4 5
(Time difference correlation)
(Quarter)
2000 to 2017
1979 to 1999
2000 to 2013
0.0
0.5
1.0
1.5
2.0
2.5
3.0
1979-1999
2000-2017
2000-2013
(Sensitivity)
② Recovery momentum for capital investment: even though capital investment will continue to grow, it will graduallyenter a cyclical slowdown
- 15
- 10
- 5
0
5
10
9.0 10.0 11.0 12.0 13.0 14.0
FY2007
(Y-o-y % change in investment in plant and equipment)
H1 FY2017
2%
1%
0%
-1%-2%
3%
(I/K ratio at end of previousl fiscal year, %)

[ Thrift-consciousness index (backward 3-month moving average ]
Note: Normal year ratio is the comparison to the 5-year average price for the survey price from food price trend survey operations for FY2012 to FY2016
Source: Made by MHRI based upon Ministry of Agriculture, Forestry and Fisheries, Consumer price trends survey (vegetables)
Note: The thrift-consciousness index is calculated by comparing the 137 items that are common to the CPI and the Family Income and Expenditure Survey, and taking the difference between the CPI (y-o-y) and the y-o-y rate of growth in the average price for each item weighting by the CPI (2015 standard). Backward 3-month moving average.
Source: Made by MHRI based upon Ministry of Internal Affaires and Communications, Consumer Price Index, Family Income and Expenditure Survey
Household thrift consciousness rose sharply due to factors such as the surge of vegetable prices. Poor weather in October and November pushed up the price of fresh vegetables. The price of gasoline is also rising due to the higher price of
crude oil. As a result, the thrift-consciousness index (the difference between the price increase in the CPI and in the average price in the household
expenditure survey) has risen sharply.
20
[ Price of fresh food ]
0
50
100
150
200
250
2-O
ct
9-O
ct
16-O
ct
23-O
ct
30-O
ct
6-N
ov
13-N
ov
20-N
ov
27-N
ov
4-D
ec
11-D
ec
18-D
ec
25-D
ec
8-Ja
n
15-J
an
22-J
an
29-J
an
5-Fe
b
2017 2018
CabbageLettuceTomatoChinese cabbageWhite radish
(Normal year ratio, %)
(Week)
(Year)
- 4
- 3
- 2
- 1
0
1
2
Jan-15 Jul-15 Jan-16 Jul-16 Jan-17 Jul-17
(%pt)
(mmm-yy)
Decrease in thrift conciousness
Increase in thrift conciousness
③ Thrift consciousness and consumption: recent surge in the thrift-consciousness index

[ Trends in perceived real wages and real consumption and correlation coefficient ]
Note: Households’ perceived inflation is the median value of the results to the survey question: By what percent do you think prices have changed compared with one year ago?
Source: Made by MHRI based upon Bank of Japan, Opinion Survey on the General Public’s Mindset and Behavior and Ministry of Internal Affairs and Communications, Consumer Price Index
The calculation of households’ perceived inflation indicates a trend that is closer to that of fresh food and energy than total consumer prices. “Perceived real wages” calculated by deflating nominal wages by households’ perceived inflation has a stronger correlation with real
consumption than CPI-based real wages (deflated by the CPI excluding imputed rents on homes). Perceived inflation is a much greater determinant of household consumption behavior than the CPI.
21
[ Households’ perceived inflation ]
- 15
- 10
- 5
0
5
10
15
Dec
-06
Jun-
07D
ec-0
7Ju
n-08
Dec
-08
Jun-
09D
ec-0
9Ju
n-10
Dec
-10
Jun-
11D
ec-1
1Ju
n-12
Dec
-12
Jun-
13D
ec-1
3Ju
n-14
Dec
-14
Jun-
15D
ec-1
5Ju
n-16
Dec
-16
Jun-
17D
ec-1
7Fresh food + energy
Households' perceived inflation(median value)
(Y-o-y % change)
(mmm-yy)
Note: Households’ perceived inflation is the median value of the results to the survey question: By what percent do you think prices have changed compared with one year ago?
Source: Made by MHRI based upon Bank of Japan, Opinion Survey on the General Public’s Mindset and Behavior, Ministry of Internal Affairs and Communications, Consumer Price Index and Cabinet Office, National Accounts (SNA)
③ Thrift consciousness and consumption: real consumption is determined by households’ perceived inflation
-12
-10
-8
-6
-4
-2
0
2
4
6
Jun-
06M
ar-0
7D
ec-0
7S
ep-0
8Ju
n-09
Mar
-10
Dec
-10
Sep
-11
Jun-
12M
ar-1
3D
ec-1
3S
ep-1
4Ju
n-15
Mar
-16
Dec
-16
Sep
-17
Perceived real wages
Real household consumption
(Y-o-y % change)
Perceived real wages are submerged in negative territory
(mmm-yy)0.4
0.5
0.6
The correlation with
houshold consumption is
higher for perceived real wages than for real wages
(Correlation coefficient)
Real wages
Perceived real wages

[ Perceived inflation, SRI-Hitotsubashi Unit Value Index, Core CPI ]
Note: Quarterly averageSource: Made by MHRI based upon SRI-Hitotsubashi Consumer Purchase Index
The rise of the SRI-Hitotsubashi Unit Value Index has recently surpassed the SRI-Hitotsubashi Price Index, suggesting hidden price increase(shrinkflation) may be progressing.
Households’ perceived inflation is highly correlated to the Unit Value Index (correlation coefficient of 0.87), demonstrating householdsensitivity to such hidden price increase.
22
[ SRI-Hitotsubashi Unit Value Index and Price Index ]
Note: Households’ perceived inflation is the median value of the results to the survey question: By what percent do you think prices have changed compared with one year ago?
Source: Made by MHRI based upon Bank of Japan, Opinion Survey on the General Public’s Mindset and Behavior, Ministry of Internal Affairs and Communications, Consumer Price Index and Cabinet Office, National Accounts (SNA)
③ Thrift consciousness and consumption: perceived inflation is also sensitive to shrinkflation
- 4
- 2
0
2
4
6
8
10
12
Jun-
06D
ec-0
6Ju
n-07
Dec
-07
Jun-
08D
ec-0
8Ju
n-09
Dec
-09
Jun-
10D
ec-1
0Ju
n-11
Dec
-11
Jun-
12D
ec-1
2Ju
n-13
Dec
-13
Jun-
14D
ec-1
4Ju
n-15
Dec
-15
Jun-
16D
ec-1
6Ju
n-17
Dec
-17
Core CPI
Households' perceived prices (median value)
SRI-Hitotsubashi Unit Value Index
(Y-o-y % change)
(mmm-yy)
- 3
- 2
- 1
0
1
2
3
4
Mar
-07
Sep
-07
Mar
-08
Sep
-08
Mar
-09
Sep
-09
Mar
-10
Sep
-10
Mar
-11
Sep
-11
Mar
-12
Sep
-12
Mar
-13
Sep
-13
Mar
-14
Sep
-14
Mar
-15
Sep
-15
Mar
-16
Sep
-16
Mar
-17
Sep
-17
SRI-Hitotsubashi Price Index
SRI-Hitotsubashi Unit Value Index
(Y-o-y % change)
(mmm-yy)

[ Outlook on consumer spending ]
Note: Estimates by MHRI for Jan-Mar 2018 quarter and beyondSource: Made by MHRI based upon Ministry of Internal Affairs and Communications,
Consumer Price Index
Source: Made by MHRI based upon Cabinet Office, First Preliminary Quarterly Estimates of GDP
Perceived real wages will decline in the event energy and fresh food prices continue to rise or shrinkflation has occurred. Given forecasts of the rise of energy prices, there are concerns that higher energy prices will push down consumption through the fall of
perceived real wages. However, real consumption should continue to follow firm footing since the rise of incomes, due primarily to the growth in nominal wages, will
offset the downward pressure from prices.
23
[ Outlook on energy prices ]
③ Thrift consciousness and consumption: higher prices weigh on consumption, but higher incomes are forecast to push up consumption
- 60
- 40
- 20
0
20
40
60
- 15
- 10
- 5
0
5
10
15
2014 2015 2016 2017 2018 2019
Energy
WTI Price (denominated in yen, rhs)
(Y-o-y % change) (Y-o-y % change)
Outlook
(yyyy)

[ Economic impact of the supplementary budget ]
Source: Made by MHRI based upon Ministry of Finance
Note: 1. Factors not having an impact on GDP are excluded from this calculation when considering the difference in the amount of expenditure in the supplementary budget
2. Calculated by MHRI based on information available at the time of writing. The results need to be considered allowing for considerable margin of error.
3. Some sections do not total due to rounding.Source: Made by MHRI based upon each Ministry and Agencies’ materials concerning the
FY2017 supplementary budget
The FY2017 supplementary budget, passed on February 1, includes 2.7 trillion yen in additional expenditures, mainly on public works. The supplementary budget was the smallest to date under the Abe administration. The contraction is attributed to the inability to secure the
financial resources because of the lack of increase in tax revenues. The expenditures are forecast to boost the FY2018 growth rate by 0.3% (cumulatively when including the impact on FY2019 and beyond, the
impact is a boost to GDP of about 0.5%) GDP is mainly boosted by public works such as disaster recovery projects. However, since the size is contracting on a year-on-year basis,
fiscal year public investment is negative. In addition, there is also the risk of a delay in the progress of public works (refer to the next page).
24
[ Overview of additional expenditure ]Government spending (billion yen)
I. Productivity revolution & human resources development revolution 482.2
(1) Productivity revolution 393.1
Support manufacturing, commerce and upgrading service-sector management skills; consolidate regional creation hubs
(2) Human resources development revolution 89.1
Prepare childcare arrangements (nursery schools, accredited centers for early childhood education and care, etc.)
II. Disaster recovery, disaster prevention and reduction projects 1256.7
(1) Disaster recovery projects 343.6
Restore damaged civil engineering facilities etc.(2) Disaster prevention and reduction projects 913.1
Disaster prevention and reduction measures for avoiding natural disaster risk; disaster prevention and reduction measures for schools etc.
III. Measures for realizing comprehensive fundamental principles of TPP, etc. 346.5
Consolidate small agricultural fields and convert paddies to dry field etc., cluster the livestock industry
IV. Measures for other urgent issues 621.9
(1) Secure peace and security of people's lives 306.4
Ensure stable operation of the Self-Defense Forces; cope with ballistic missile attacks
(2) Others 315.4
Total Additional Expenditure 2.7 trillion yen
④ Policy stimulus (1): FY2017 supplementary budget will push up FY2018 growth rate by 0.3%
Nationalexpenditure(Trillion yen)
Amount(Trillion yen)
Contribution toGDP
(% points)
Contribution to GDP(% points)
Total 2.55 2.73 0.50 0.29
Personal consumption + housing investment 0.16 0.04 0.01 0.01
Investment in plant and equipment 0.83 0.59 0.11 0.05
Public demand 1.56 2.09 0.38 0.23
Government consumption 0.43 0.43 0.08 0.08
Public investment 1.13 1.67 0.30 0.15
Economic impact
Cumulative total Boost to FY2018

[ Unspent public works-related expenditures ]
Source: Made by MHRI based upon Ministry of Finance
If progress in public works is delayed, it could limit the economic impact of the supplementary budget. Given the increase of public works under the Abe administration, the shortage ratio for public works occupations has been rising. The amount of unspent public works-related expenditures in the previous fiscal year (the unnecessary amount + amount brought forward to
the following fiscal year), more than 30% of the budget, is exceeding the amount of budget supplementation.
25
④ Policy stimulus (1): however, there are risks of delay in progress of public works due to labor constraints
200
210
220
230
240
250
260
270
280
290
300
- 4
- 3
- 2
- 1
0
1
2
3
4
2007 2008 2009 2010 2011 2012 2013 2014 2015 2016 2017
Amount of public works contracted per construction worker (rhs)
Formwork construction (public works)
Reinforcement works (public works)
Total of 8 occupations
(%) (10,000 yen)
(yyyy)
Note: The shortage ratio is (the number of workers the companies wanted, but were unable to secure - the number of workers that were secured but were surplus to requirements) / (the number of workers secured + the number of workers the companies wanted, but were unable to secure) x 100
Source: Made by MHRI based upon three construction surety companies, Public works prepayment surety statistics (in Japanese) and Ministry of Land, Infrastructure, Transport and Tourism, Survey on supply and demand of construction labor (in Japanese)
[ Amount of public works contracted + shortage ratio for public works occupations ]

[ Impact of wage hikes by industry ]
Note: Calculating the policy impact with reference to Kato, Motohashi and Tsutsumi (2017) by the proportion of companies whose decision to hike wages was boosted by “the amount applicable to the tax system / rate of tax deductions (0.1) x tax system” (18.8% for large enterprises, 7.7% for small enterprises).
Source: Made by MHRI based upon Ministry of Finance, Deloitte Tohmatsu Consulting LLC (2015), and Kato, T., Motohashi, N., Tsutsumi, M., 2017. “Extracting a wage and income related policy impact under Abenomics (in Japanese)
The wage hike effect from the tax system to spur income growth, introduced in FY2013, was approximately 453.9 billion yen in FY2012(approximately 8,000 yen per employee), equivalent to a wage hike rate of about 0.21% (relative to FY2012). By company size, whereas the wage hike among large enterprises was 353.5 billion yen (wage hike rate of 0.36%), the wage hike was
only100.4 billion yen (wage hike rate of 0.09%) among small enterprises. By industry, the wage hike impact was inadequate in industries with comparatively low nominal wages such as wholesale & retail, and food,
beverages & accommodation. Since the measures did not apply to loss-making companies, this tax system alone did not have much of an impact to raise wages.
26
[ Impact of wage hikes by size of enterprises ]
Category Amount of wage hike (100 million yen)
Wage hike rate (%)
Average annual wage hike rate (%)
Large enterprises 3,535 0.36 0.12
Small enterprises 1,004 0.09 0.03
Total 4,539 0.21 0.07
④ Policy stimulus (2): past tax system to spur income growth only had limited effect
0.0
0.1
0.2
0.3
0.4
0.5
0.6
0.7
0.8
0
5,000
10,000
15,000
20,000
25,000
30,000(Yen) (%)
Total
Transport, com
munications &
public utilities
Real estate
Finance& insurnace
Food, beverage & accom
modation
Wholesale & retail
Manufacturing
Construction
Mining
Amount of wage hike per person
Wage hike rate

[ Outline of revised tax system ]
Source: Made by MHRI based upon Ministry of Finance, Financial Statement Statistics of Corporations by Industry and National Tax Agency, Company Basic Survey
Source: Made by MHRI based upon Ministry of Finance
The amount of tax credits under the tax system to spur income growth has been expanded under the FY2018 tax reform framework. Considering that corporate profits are improving and the ratio of loss-making companies has fallen in recent years, the number of newly
qualifying companies may increase. However, the revised qualification criteria requires nominal wages (i.e., the average wages per employee, not the total amount of wages paid)
to increase by 3% against FY2017 levels. Given the high hurdles for qualification, the policy impact could be limited.
27
[ Corporate profits and ratio of loss-making companies ]
60
62
64
66
68
70
72
74
0
10
20
30
40
50
60
70
80
90
100
2008 2009 2010 2011 2012 2013 2014 2015 2016
Corporate ordinary profits (Total of all industries, all sizes)
Ratio of loss-making companies (rhs)
(Trillion yen) (%)
(FY)
④ Policy stimulus (2): FY2018 tax system reform raises the hurdles for application of the tax system to spur income growth
Old system New system (Main points of FY2018 Tax Reform)
Wage hike criteria
・ The proportion of increase in wages relative toFY2012 is 3% in FY2015, 4% in FY2016 and 5%or more in FY2017 (3% or more for small andmedium-sized companies)・ Amount of wages paid is above previous year・ Amount of average wages paid exceedsprevious year (2 % or more for large enterprisesin FY2017)
・ Growth in the average wage is 3% ormore from the previous year(1.5% or more for small and medium-sizedcompanies)
Other criteria・ Domestic investment counts for 90% ormore of depreciation cost in the currentfiscal year
Amount of taxcredits
・ 10% of the amount of increase in wages paid・ Upper limit of 10% of the corporations tax forthe current period (20% for small and medium-sized companies)・ Measures on top of the increase in the amountof wages paid in FY2017
・ 15% of the amount of increase in wagespaid* 20% of the amount of increase in wages paid,when the rate of increase in training costs is20% or more,* 25% of the amount of increase in wages paid,when small and medium-sized companiesachieve 25% or more in the rate of increase inthe average amount of wages paid,* Upper limit of 20% of the corporations tax forthe current period

[ Basic price trends ][ Outlook for Economic Activity and Prices (January 2018) ]
Monetary policy will most likely be left unchanged. The BOJ will monitor price trends during 2018 taking account of the wage hikes from theshunto spring labor-management wage negotiations and corporate stance on price setting. Policy adjustments are unlikely in the second half ofthe year ahead of the Abe administration’s decision on the consumption tax hike.
In view of the fact that the rate of rise of the CPI has only risen to about 1% despite progress in wage hikes in the shunto spring wagenegotiations, the BOJ will most likely maintain current policy during the forecast period. However, amid growing concerns about the side-effects of prolonged low interest rates, there could be a second comprehensive assessment.
28
BOJ: ongoing gap between the rate of increase in prices and the target level makes a policy shift unlikely
Real GDP
CPI (All items less fresh food)
Excluding effects of
consumption tax hike
FY2017 +1.8 to +2.0(+1.9)
+0.7 to +1.0(+0.8)
Forecasts made in October 2017
+1.7 to +2.0(+1.9)
+0.7 to +1.0(+0.8)
FY2018 +1.3 to +1.5(+1.4)
+1.3 to +1.6(+1.4)
Forecasts made in October 2017
+1.2 to +1.4(+1.4)
+1.1 to +1.6(+1.4)
FY2019 +0.7 to +0.9(+0.7)
+2.0 to +2.5(+2.3)
+1.5 to +2.0(+1.8)
Forecasts made in October 2017
+0.7 to +0.8(+0.7)
+2.0 to +2.5(+2.3)
+1.5 to +2.0(+1.8)
Note: Forecasts of the Majority of Policy Board members. Figures in brackets indicate the median of the Policy Board members' forecasts (point estimates)
Source: Made by MHRI based upon Bank of Japan materials
Note: 10% trimmed mean: calculated by deducting 10% on a weight base from each of the item with the largest value and item with the smallest value
Source: Made by MHRI based upon Bank of Japan
(Y-o-y % change)
‐ 1.5
‐ 1.0
‐ 0.5
0.0
0.5
1.0
1.5
General (less fresh food and energy)
10% trimmed average
Negative interest rates(Jan 2016)
Additional easing (Oct 2014)
Implementation of QQE (Apr 2013)
- 50- 40- 30- 20- 10
01020304050
2011 2012 2013 2014 2015 2016 2017
(% Points)
(yyyy)
Proportion of items that are rising minus proportion of items that are falling
Implementation of YCC
(Sep 2016)

10Y JGB yields are low due to the BOJ’s yield curve control. Speculation on a BOJ policy shift have a tendency to rise amid expectations thatthe BOJ will reduce the size of its outright purchases of JGBs, keeping yields close to 0.1%. The reduction in market issuance of JGBs is likelyto inhibit a rise in yields because of demand and supply factors. Ahead of the government’s decision on the consumption tax hike during 2018, the BOJ is likely to conduct fixed-rate operations when there is
increased upward pressure on yields. The yield curve has not steepened even after the introduction of the yield curve control policy. Investment conditions remain difficult for life
insurance companies and pension funds.
29
[ Principal component analysis of the yield curve ]
Japanese interest rates: 10Y JGB yields are close to 0.1%. Speculation is lingering on a BOJ policy shift
[ JGB yields and fixed-rate operations ]
Source: Made by MHRI based upon Bloomberg materials Source: Made by MHRI based upon Bloomberg materials
- 0.10
- 0.05
0.00
0.05
0.10
0.15
0.20
Nov Dec Jan Feb Mar Apr May Jun Jul Aug Sep Oct Nov Dec Jan Feb
Fixed-rate operation (Feb 3)Purchase yield: 0.110%Total subscribed: 723.9 bn yen
Fixed-rate operation (Jul 7)Purchase yield: 0.110%Total subscribed: zero
Increase in JGB outright purchase (Jul 7)
20172016
(%)
Fixed-rate operation (Feb 2)Purchase yield: 0.110%Total subscribed: zero
Increase in JGB outright purchase (Feb 2)
2018- 10
- 8
- 6
- 4
- 2
0
2
4
6
2000 2002 2004 2006 2008 2010 2012 2014 2016
Rise in yieldsS
teepeningD
ecline in curvatureIncrease in curvatureFlatteningD
cline in yields
First principal component (level)
Second principal component (gradient)
Third principal componet (curvature)
(yyyy)
(mmm)(yyyy)

[ Inflation expectations in the Japanese, US and German bond markets ][ VIX index ]
30
Financial markets: need to be wary of the risk of a rise in US and European long-term yields
The VIX Index, which is in an indicator of investor uncertainty, surged to above 50 due to the sudden drop in share prices. Market instabilitycould continue for awhile.
Inflation expectations have risen in the US bond market. In the US, expectations toward economic stimulus by tax cuts and infrastructure areprone to rise, making it necessary keep a close eye upon the risk of the rise of long-term yields. Amid a pause in investment in US Treasuries byoverseas investors, Japanese and European monetary policy will also serve as factors affecting US yields.
Note: US: 10Y BEI; Europe: 5 year-forward 5-year inflation swap; Japan: 10Y BEISource: Made by MHRI based upon Bloomberg materials
Note: The VIX Index is an indicator of investor anxiety conveyed by the volatility of the S&P500 stock index option prices.
Source: Made by MHRI based upon Bloomberg materials
10
15
20
25
30
35
40
J F M A M J J A S O N D J F M A M J J A S O N D J F
China Shock
Brexit Referendum
(Index)
US Presidential Election
201820172016
Stock price collapse
0.0
0.5
1.0
1.5
2.0
2.5
2016 2017 2018
(%)
US
Europe
Japan
(yyyy)(m)(yyyy)

[ Long-term trend in TOPIX and forecast EPS ]
31
Source: Made by MHRI based upon Thomson Reuters
[ TOPIX price matrix ]
While Japanese stocks have maintained a strong upward trend since the beginning of 2018, they have recently declined due to the appreciationof the yen and fall of US stocks.
The upside will be limited in the near term due to concerns regarding the appreciation of the yen and fall of US stocks. However, in the absenceof market perceptions that Japanese stocks are overvalued, stock price levels should step up along with the rise of expectations toward theimprovement of FY2018 earnings. Having said so, the pace of rise should slow down in 2019 in the runup to the consumption tax hike.
Japanese stocks: no sense of being overvalued, rising in line with the pace of improvement in earnings
Source: Made by MHRI based upon Datastream
Current level
13 14 15 16 17
110 1,430 1,540 1,650 1,760 1,870
115 1,500 1,610 1,730 1,840 1,960
120 1,560 1,680 1,800 1,920 2,040
125 1,630 1,750 1,880 2,000 2,130
130 1,690 1,820 1,950 2,080 2,210
135 1,760 1,890 2,030 2,160 2,300
140 1,820 1,960 2,100 2,240 2,380
Level anticipated for late 2018 to early 2019
12-month forward
forecast EPS ($)
PER (Multiple)
Recent market forecast
124.4
10
15
20
25
30
35
40
45
0
500
1,000
1,500
2,000
2,500
3,000
3,500TOPIX (intra-month average)
12-month forward forecast PER(rhs)
(Points) (Multiple)
(yyyy)

32
Foreign exchange: expectations toward tapering of monetary easing in Japan and Europe and interest rate hikes exert upward pressure on the yen and the euro
Source: Made by MHRI
[ Impact of monetary policy shifts upon foreign exchange rates ] [ Outlook for JPY/USD and USD/EUR ]
The yen and the euro are both expected to appreciate against the dollar toward FY2019. Expectations for tapering of US and European monetary easing exert upward pressure on the yen and the euro. While this has already been priced into the market to some extent, the euro is expected to appreciate even further once change in ECB
monetary policy is confirmed. Although a major change in BOJ monetary policy is unlikely, the yen remains subject to upward pressures due to lingering market
expectations for a tapering of monetary policy. The end of the period of US interest rate hikes will put downward pressure on the dollar along with the ebb of expectations toward future US
rate hikes.
Anticipated monetary policy shifts in FY2018-19
Impact on foreign exchange rates
US End of US interest rate hikesEbb of expectations toward future interest rate hikes serves as dollar-weakening pressure
Europe
End of ECB asset purchasesContraction in deposit facility rateIncrease in interest rate on major refinance operations
Upward pressure on the euro due to expectations for contraction in ECB monetary easing and interest rate hikes
Japan -Upward pressure on the yen persists due to lingering expectations for contraction in BOJ monetary easing
Source: Made by MHRI based upon Bloomberg
1.0
1.1
1.2
1.3
1.4
1.570
80
90
100
110
120
130
Jan-12 Jan-13 Jan-14 Jan-15 Jan-16 Jan-17 Jan-18 Jan-19 Jan-20
JPY/USD USD/EUR (rhs)(JPY/USD) (USD/EUR)
(mmm-yy)
Forecast
Weak dollar
Strong dollar

Even though Asia’s economic expansion will gradually moderate, China’s economic slowdown should be benign
III. The Asian Economies
33

The Asian Economies: the pace of economic growth is forecast to moderate in 2019
In the Oct-Dec quarter of 2017, the Chinese economy grew at the same pace as the previous quarter, maintaining firm growth. The fullyear growth rate accelerated for the first time in 7 years, mainly due to the boost from net exports. Despite firm domestic consumption,investment has slowed.
In terms of the outlook for China, the Central Economic Work Conference (December 2017), which deliberated policy direction, turnedout to tolerate a decline in the growth rate. We thus expect policies to curb speculation and excessive production capacity to be stepped up.The growth rate will gradually decline, but within the scope that ensures the plan to double incomes from 2010 to 2020.
In Asian economies (ex. China), while growth rates in the Oct-Dec quarter slowed from the high growth in the Jul-Sep quarter in somecountries, overall the economies remained firm. Throughout the year 2017, the global economy accelerated with exports among each ofthe countries serving as the drivers of growth. Furthermore, domestic demand also grew strongly in the ASEAN.
In terms of the outlook for the Asian economies (excluding China), we expect growth in the global economy to gradually peak toward2019. We anticipate a waning of overall momentum for economic expansion, particularly exports. However, consumption is firm in theASEAN5 on the back of favorable employment conditions. The Indian economy is also forecast to recover as the slowdown in 2017 dueto temporary factors runs its course.
As a result of the foregoing, the pace of Asia’s economic growth as a whole is forecast to moderate in 2019.
34

35
Asia: compared to China and the NIEs, ASEAN is firm and India is stable
China: in view of the reinforcement of reforms to curb speculation and adjust excessive production capacity, we expect the Chinese economy togradually slow down, albeit at a pace which ensures its plan to double income by 2020.
NIEs: given the NIEs high dependence upon exports, their pace of economic expansion will moderate, reflecting global economic trends. ASEAN: despite a slight slowdown of exports, the decline in economic growth will remain limited due to the support from domestic demand
such as firm consumption reflecting favorable employment conditions. India: the Indian economy will pick up in 2018, given the fading impact of factors such as the abolition of high-denomination bank notes. In
2019, the Indian economy will remain on stable footing supported mainly by domestic demand, given its low dependence upon exports.
Note: Real GDP growth rate (y-o-y). Average figures are calculated from the 2015 GDP share from the IMF (purchasing power parity base)Source: Made by MHRI based upon statistics of the relevant countries and regions
[ Outlook on the Asian economies ](Units: %) (Units: % points)
2014 2015 2016 2017 2018 2019 2017 2018(Actual) (Actual) (Actual) (Forecast) (Forecast) (Forecast)
6.4 6.2 6.2 6.1 6.2 6.0 6.1 6.1China 7.3 6.9 6.7 6.9 6.5 6.4 6.8 6.4NIEs 3.5 2.1 2.2 3.1 2.8 2.5 3.1 2.6
South Korea 3.3 2.8 2.8 3.1 3.0 2.6 3.2 2.9Taiwan 4.0 0.8 1.4 2.9 2.5 2.4 2.6 2.3Hong Kong 2.8 2.4 2.0 3.6 2.4 2.2 3.5 2.0Singapore 3.6 1.9 2.0 3.6 3.1 2.5 3.3 2.6
ASEAN5 4.6 4.9 4.9 5.3 5.3 5.1 5.3 5.3Indonesia 5.0 4.9 5.0 5.1 5.2 5.3 5.1 5.2Thailand 1.0 3.0 3.3 3.9 3.5 2.9 3.9 3.5Malaysia 6.0 5.0 4.2 5.9 5.4 5.0 5.9 5.4The Philippines 6.1 6.1 6.9 6.6 6.6 6.5 6.5 6.7Vietnam 6.0 6.7 6.2 6.8 6.6 6.5 6.7 6.6
India 7.0 7.5 7.9 6.3 7.3 7.3 6.3 7.3Australia 2.5 2.5 2.6 2.3 2.8 2.7 2.3 2.8(Reference) Asia ex. China and India 4.2 3.8 3.9 4.5 4.3 4.1 4.5 4.3(Reference) Asia ex. China 5.4 5.4 5.7 5.3 5.7 5.6 5.3 5.7
(Change from December forecast)Asia

36
Asia: overall economic expansion has been driven by exports to date
Economic growth among the countries of Asia generally remained firm in the Oct-Dec quarter of 2017 even though some countries fell short ofthe high levels of growth in the Jul-Sep quarter.
In the countries of Asia, economic expansion was generally driven by exports throughout 2017, backed by the improvement of the globaleconomy. ASEAN maintained strong domestic demand, but India was notable for its slowdown in domestic demand attributed to factors such as the
abolition of high-denomination bank notes.
[ Rate of growth in real GDP ]
Source: Made by MHRI based upon the relevant country’s and region’s statistics, and CEIC Data
[ Components of demand (contribution to growth rate) ]
Note: NIEs and ASEAN: the simple average for the level of contribution by each country. China’s exports are net exports.
Source: Made by MHRI based upon the relevant country and region’s statistics, and CEIC Data
(Y-o-y % change, annualized)
Jan-Mar Apr-Jun Jul-Sep Oct-Dec Jan-Mar Apr-Jun Jul-Sep Oct-Dec
South Korea 2.0 3.7 1.9 2.0 4.3 2.4 6.3 -0.9
Taiwan 3.2 1.8 4.0 2.6 2.3 1.1 5.7 4.3
Hong Kong -1.2 6.0 3.2 5.0 2.8 4.5 2.0 N/A
Singapore 2.9 1.5 0.8 9.7 -1.5 2.8 11.2 2.1
Thailand 4.0 3.8 2.2 2.0 5.3 5.7 4.0 N/A
Malaysia 3.1 4.3 5.7 5.1 7.5 5.2 7.2 3.6
The Philippines 6.1 7.9 5.5 7.0 5.5 7.9 6.9 6.2
(Y-o-y % change)
China 6.7 6.7 6.7 6.8 6.9 6.9 6.8 6.8
Indonesia 4.9 5.2 5.0 4.9 5.0 5.0 5.1 5.2
Vietnam 5.5 5.8 6.6 6.7 5.2 6.3 7.5 7.7
India 9.1 7.9 7.5 7.0 7.0 5.7 6.3 N/A
2016 2017
- 2
0
2
4
6
8
10
2015 2016 2017 2015 2016 2017 2015 2016 2017 2015 2016 2017China NIEs ASEAN India
Domestic demand
Exports
(% Points)
(yyyy)

37
China: the economy remains firm due to increased external demand; a moderate slowdown is forecast
China’s real GDP grew +6.8% y-o-y in the Oct-Dec quarter of 2017 (c.f., Jul-Sep quarter: +6.8%), remaining firm. 2017 full year growth was +6.9% y-o-y, the first increase in 7 years. The growth rate was boosted by the shift to positive net exports along
with the increase of exports. Even though final consumption remained firm, the contribution to total capital formation was at its lowest levelsince 2000.
As for investment in fixed assets (real terms), manufacturing and real estate development slumped over the year-end. Even though thegrowth of infrastructure investment was high, it slowed down.
The Central Economic Work Conference, held in December 2017 turned out to tolerate a moderation of economic growth. The economy isforecast to gradually slow in 2018 due to factors such as tighter regulatory controls.
[ Real GDP growth (contribution by components of demand ]
Source: Made by MHRI based upon National Bureau of Statistics China
[ Outcomes of Central Economic Work Conference ]
Source: Made by MHRI based upon websites of the Central People’s Government of the Republic of China
Previous time This time
Basic policy
・2017 is the year to deepen supply-side structural reforms・Progress in supply side structural reforms is key, and a victorious 19th National Congress of the Communist Party of China must be held with achievements of superior outcomes through appropriate expansion of total demand
・Promotion of "High quality development" is an indispensable foundation・Progress 'battle with the 3 challenges' of preventing major risks, targeted poverty reduction and pollution control, by sticking to reforms with a focus on supply-side structural reforms
Important principles
"Seeking progress while maintaining stability". Stability was made the basic tone for the year, with a certain degree of progress to be made in key sectors on the basis of stability
Continue with "Seeking progress while maintaining stability" . Stability and progress have become a single unit
Fiscal policy
Proactive fiscal to be more proactive and effective No change to initiatives for proactive fiscal policy
Monetary policy
Maintain prudent neutral monetary policy Prudent monetary policy should be kept neutral
Key activities
① Focus on progressing five tasks (cutting excess industrial capacity, destocking, de-leveraging, lowering corporate costs, and improving weak links in supply)②Deepen supply-side reform for agriculture③Stimulate the real economy④Promote steady and sound development of the real estate market
① Deepen supply-side structural reforms②Extract dynamism of each city③Implement strategy for promoting rural areas④Implement strategy for regional development and cooperation between cities⑤Promote the formation of a new framework for overall liberalization⑥Improve living standards and social security⑦Increase housing supply , accelerating the establishment of a housing system for both purchase and renting⑧Increase pace of ecological development and enhance environmental protection
4.85.9
4.3 3.6 3.6 4.1 4.5 4.1
7.1 4.4
3.4 4.33.4 2.9 2.9
2.2
-1.3-0.8
0.2
-0.1
0.3
-0.1-0.7
0.6
10.6
9.5
7.9 7.87.3
6.9 6.7 6.9
- 2
0
2
4
6
8
10
12
2010 2011 2012 2013 2014 2015 2016 2017
Final consumption
Total capital formation
Net exports
Rate of real GDP growth
(Y-o-y % change)
(yyyy)

38
China: imports are firm, particularly for semiconductor related imports. Imports of high-tech products will be firm
Although growth in the Import Volume Index for the Oct-Dec quarter of 2017 fell substantially, machinery imports grew. Looking forward,imports of high-tech products should remain firm. Semiconductors contributed to about 50% of the growth in machinery imports on a value basis for the FY2017 full year, while
semiconductor manufacturing equipment contributed 8%, revealing that semiconductor related imports account for more than half. Apart from computers, communications and materials, high-tech products still tend to be specialized imports. We forecast that high-tech
imports will remain firm for the near term due to upgrading in the manufacturing sector.
[ Breakdown of Import Volume Index ]
Note: Trade specialization coefficient = net export/ trade amountSource: Made by MHRI based upon Customs General Administration, China
Note: Factor contribution weighted using the FY2015 value indexSource: Made by MHRI based upon Customs General Administration, China
[ Trade specialization coefficient for high-tech products ]
- 10
- 5
0
5
10
15
20
2015 2016 2017
Primary products
Products by raw materials
Chemicals
Machinery & Transport Equipment
Other
Import volumes
(Y-o-y % change)
(yyyy)
(yyyy)
39
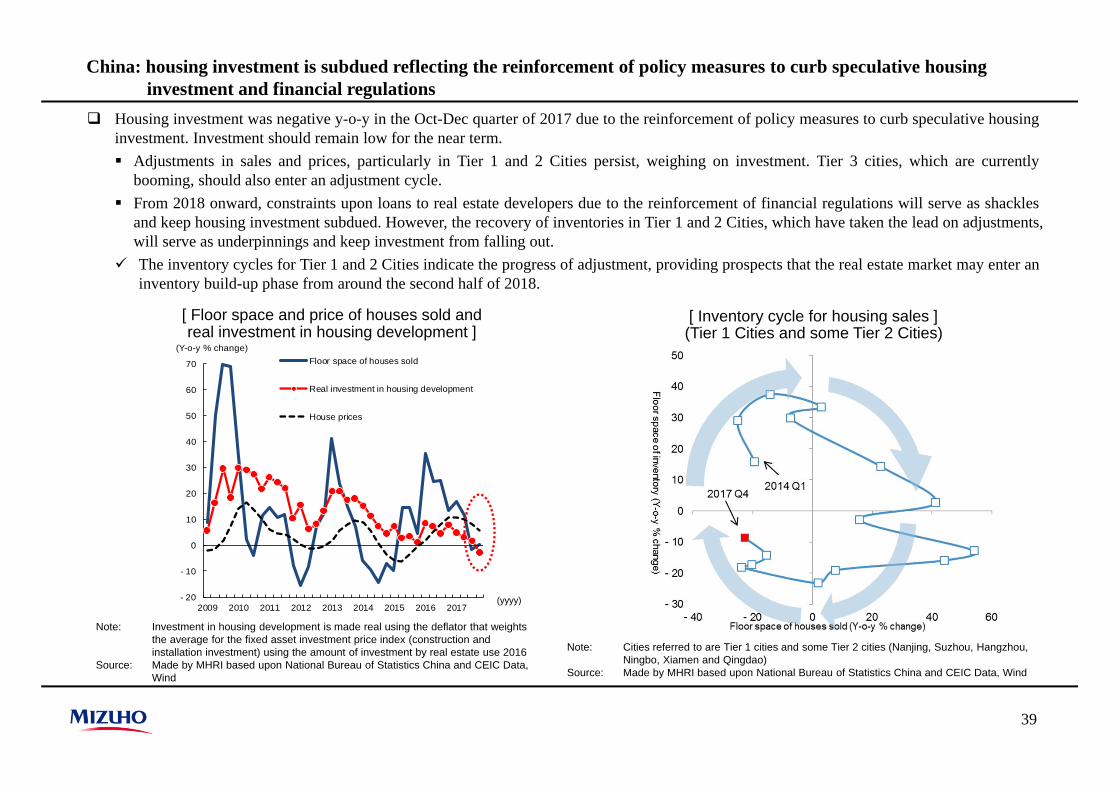
China: housing investment is subdued reflecting the reinforcement of policy measures to curb speculative housinginvestment and financial regulations
Housing investment was negative y-o-y in the Oct-Dec quarter of 2017 due to the reinforcement of policy measures to curb speculative housinginvestment. Investment should remain low for the near term. Adjustments in sales and prices, particularly in Tier 1 and 2 Cities persist, weighing on investment. Tier 3 cities, which are currently
booming, should also enter an adjustment cycle. From 2018 onward, constraints upon loans to real estate developers due to the reinforcement of financial regulations will serve as shackles
and keep housing investment subdued. However, the recovery of inventories in Tier 1 and 2 Cities, which have taken the lead on adjustments,will serve as underpinnings and keep investment from falling out.
The inventory cycles for Tier 1 and 2 Cities indicate the progress of adjustment, providing prospects that the real estate market may enter aninventory build-up phase from around the second half of 2018.
Note: Cities referred to are Tier 1 cities and some Tier 2 cities (Nanjing, Suzhou, Hangzhou, Ningbo, Xiamen and Qingdao)
Source: Made by MHRI based upon National Bureau of Statistics China and CEIC Data, Wind
[ Floor space and price of houses sold and real investment in housing development ]
Note: Investment in housing development is made real using the deflator that weights the average for the fixed asset investment price index (construction and installation investment) using the amount of investment by real estate use 2016
Source: Made by MHRI based upon National Bureau of Statistics China and CEIC Data, Wind
- 20
- 10
0
10
20
30
40
50
60
70
2009 2010 2011 2012 2013 2014 2015 2016 2017
Floor space of houses sold
Real investment in housing development
House prices
(Y-o-y % change)
(yyyy)
[ Inventory cycle for housing sales ](Tier 1 Cities and some Tier 2 Cities)

40
China: despite solid consumption growth, widening income disparities may weigh on consumption
While the growth of per capita consumption expenditure was firm in 2017, consumer spending slowed mainly in areas such as transport andcommunications. Although sales of communications equipment was on a par with the previous year, car sales grew only +1.9% y-o-y (c.f., +15.1% in 2016).
The sharp contraction stems from the avoidance of gasoline-powered cars triggered by the announcement of NEV regulations (policy topromote new energy vehicles) in September.
In addition to the avoidance of gasoline-powered cars, the widening disparity of incomes since 2016 such as the improvements in incomesfocused upon the high income bracket may also weigh on consumption. The shift of growth into high valued-added industries and increased contribution from property income appear to have exacerbated the
disparity in disposable incomes.
Note: Made real with each corresponding series in the CPISource: Made by MHRI based upon National Bureau of Statistics China
[ Real consumption expenditure per capita ] [ Growth in disposable incomes by income brackets ]
Note: Nominal valueSource: Made by MHRI based upon National Bureau of Statistics China

Mizuho Research Institute Ltd.This publication is compiled solely for the purpose of providing readers with information on a free‐of‐charge basis and is inno way meant to solicit transactions. Although this publication is compiled on the basis of sources which we believe to bereliable and correct, Mizuho Research Institute does not warrant its accuracy and certainty. Readers are requested toexercise their own judgment in the use of this publication. Please also note that the contents of this publication may besubject to change without prior notice. In the event readers do not wish to receive information free of charge fromMizuho Research Institute, readers are requested to notify their wish to suspend subscription.
41