fy2019 and 4q2019 financial results presentation
TRANSCRIPT
FY2019 and 4Q2019
Financial Results Presentation

2
AGENDA• Financial Highlights
• Key Developments
FY2019 FINANCIAL HIGHLIGHTS
3
FY2019 FINANCIAL HIGHLIGHTS
4
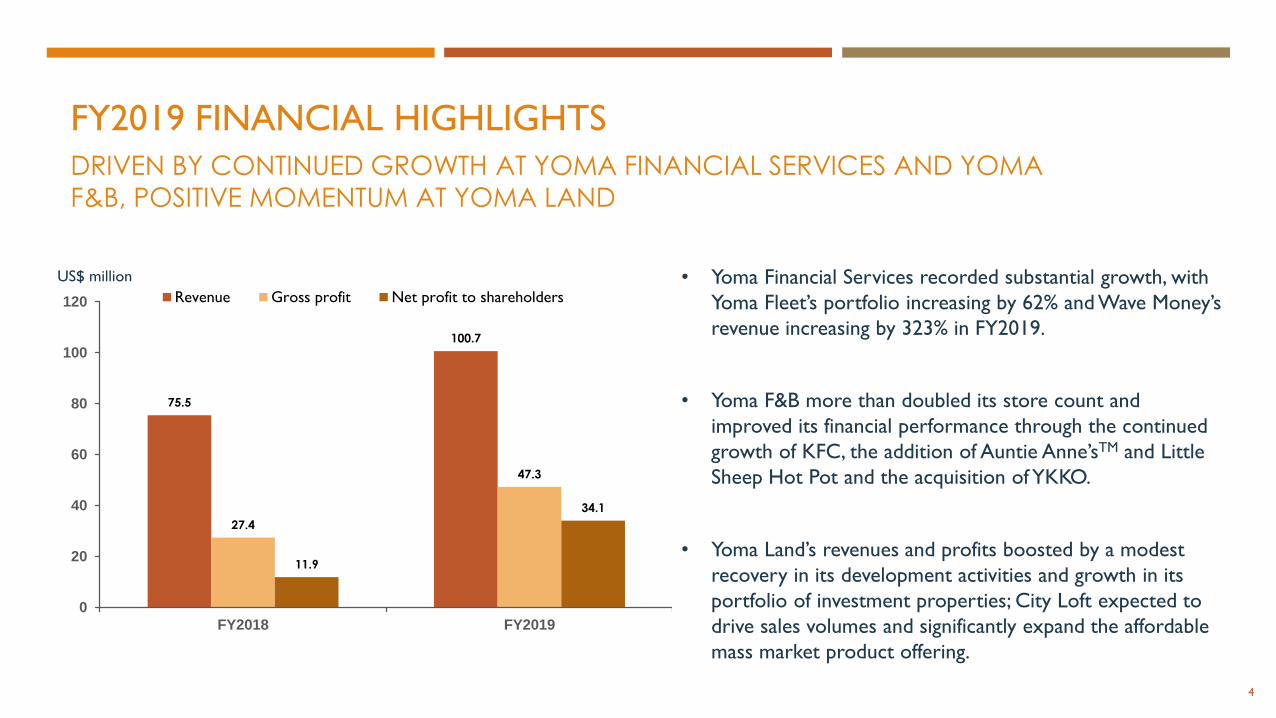
75.5
100.7
27.4
47.3
11.9
34.1
0
20
40
60
80
100
120
FY2018 FY2019
Revenue Gross profit Net profit to shareholders
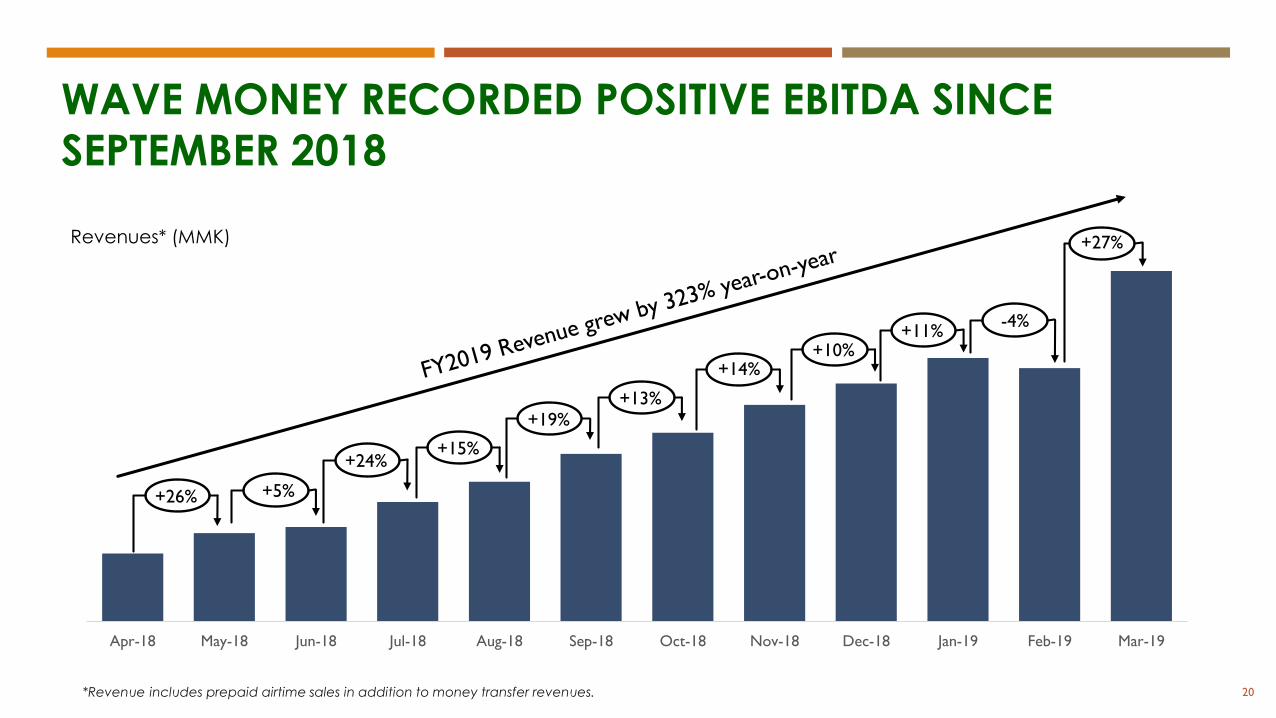
• Yoma Financial Services recorded substantial growth, with
Yoma Fleet’s portfolio increasing by 62% and Wave Money’s
revenue increasing by 323% in FY2019.
• Yoma F&B more than doubled its store count and
improved its financial performance through the continued
growth of KFC, the addition of Auntie Anne’sTM and Little
Sheep Hot Pot and the acquisition of YKKO.
• Yoma Land’s revenues and profits boosted by a modest
recovery in its development activities and growth in its
portfolio of investment properties; City Loft expected to
drive sales volumes and significantly expand the affordable
mass market product offering.
DRIVEN BY CONTINUED GROWTH AT YOMA FINANCIAL SERVICES AND YOMA
F&B, POSITIVE MOMENTUM AT YOMA LAND
US$ million
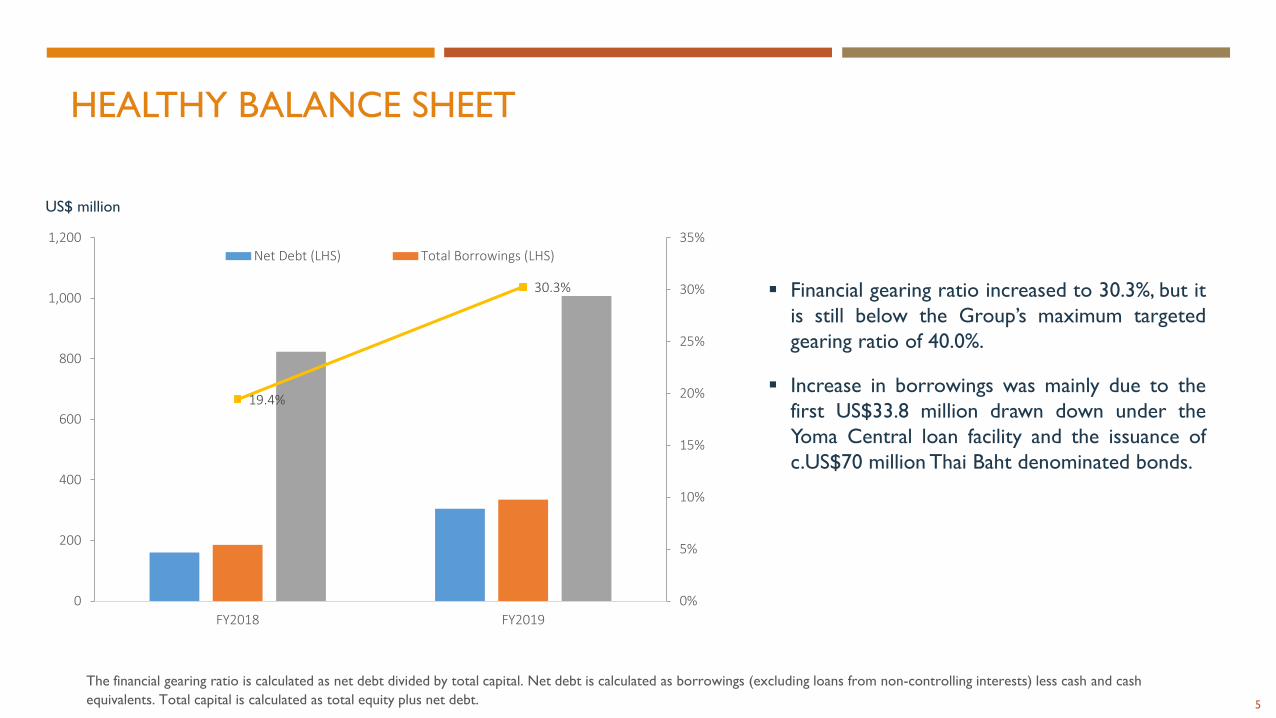
HEALTHY BALANCE SHEET
5
19.4%
30.3%
0%
5%
10%
15%
20%
25%
30%
35%
0
200
400
600
800
1,000
1,200
FY2018 FY2019
Net Debt (LHS) Total Borrowings (LHS)
The financial gearing ratio is calculated as net debt divided by total capital. Net debt is calculated as borrowings (excluding loans from non-controlling interests) less cash and cash
equivalents. Total capital is calculated as total equity plus net debt.
▪ Financial gearing ratio increased to 30.3%, but it
is still below the Group’s maximum targeted
gearing ratio of 40.0%.
▪ Increase in borrowings was mainly due to the
first US$33.8 million drawn down under the
Yoma Central loan facility and the issuance of
c.US$70 million Thai Baht denominated bonds.
US$ million
4Q2019 FINANCIAL HIGHLIGHTS
6
4Q2019 FINANCIAL HIGHLIGHTS
7
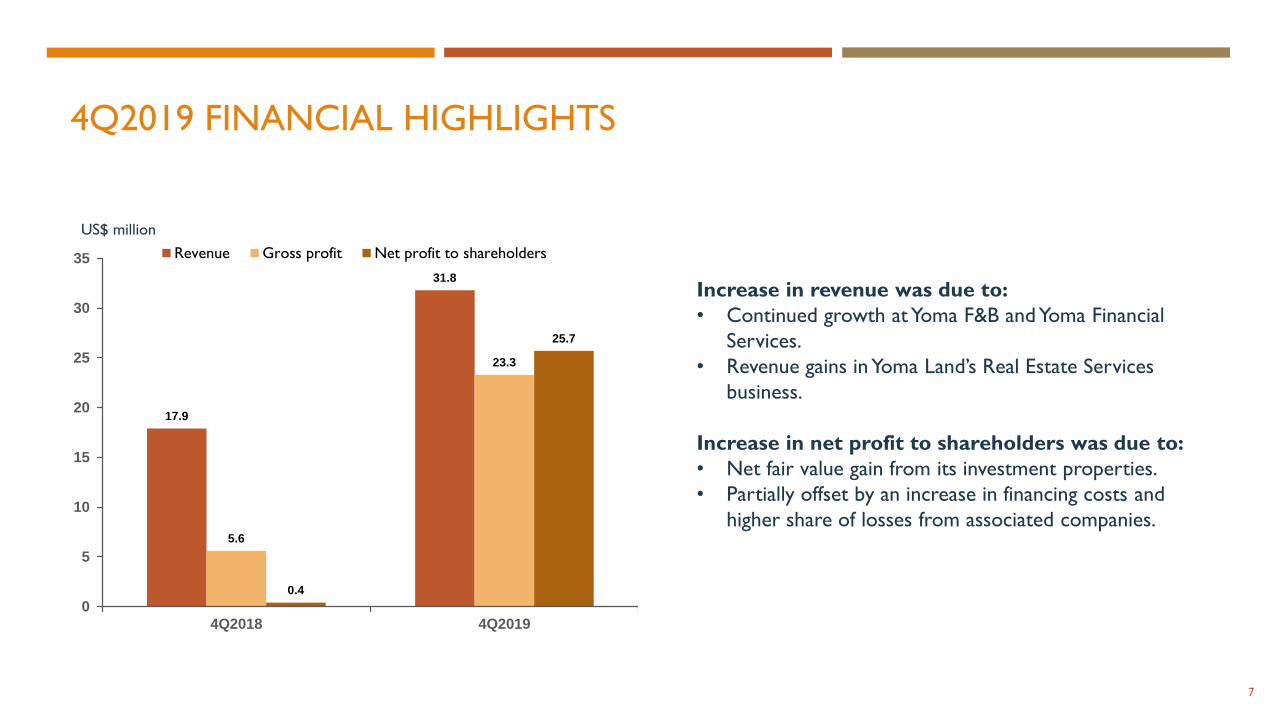
17.9
31.8
5.6
23.3
0.4
25.7
0
5
10
15
20
25
30
35
4Q2018 4Q2019
Revenue Gross profit Net profit to shareholders
US$ million
Increase in revenue was due to:
• Continued growth at Yoma F&B and Yoma Financial
Services.
• Revenue gains in Yoma Land’s Real Estate Services
business.
Increase in net profit to shareholders was due to:
• Net fair value gain from its investment properties.
• Partially offset by an increase in financing costs and
higher share of losses from associated companies.
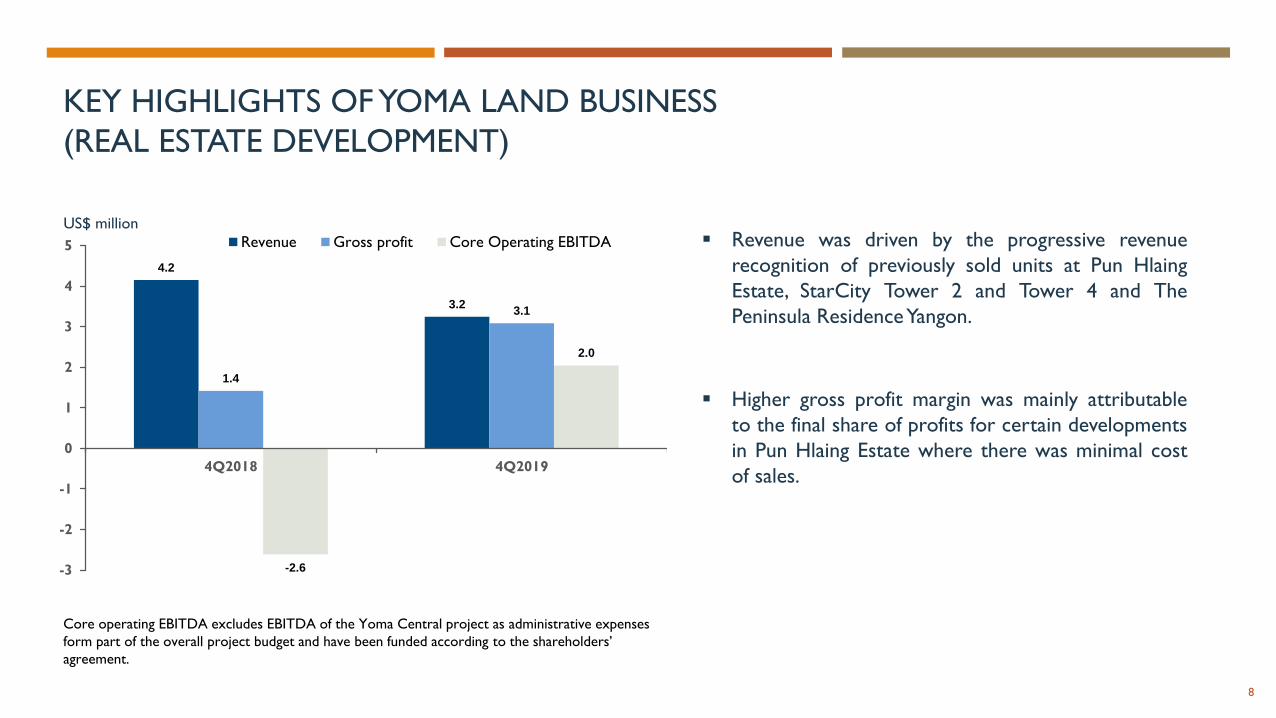
KEY HIGHLIGHTS OF YOMA LAND BUSINESS
(REAL ESTATE DEVELOPMENT)
▪ Revenue was driven by the progressive revenue
recognition of previously sold units at Pun Hlaing
Estate, StarCity Tower 2 and Tower 4 and The
Peninsula ResidenceYangon.
▪ Higher gross profit margin was mainly attributable
to the final share of profits for certain developments
in Pun Hlaing Estate where there was minimal cost
of sales.
8
4.2
3.2
1.4
3.1
-2.6
2.0
-3
-2
-1
0
1
2
3
4
5
4Q2018 4Q2019
Revenue Gross profit Core Operating EBITDA
US$ million
Core operating EBITDA excludes EBITDA of the Yoma Central project as administrative expenses
form part of the overall project budget and have been funded according to the shareholders’
agreement.
KEY HIGHLIGHTS OF YOMA LAND BUSINESS
(REAL ESTATE SERVICES)
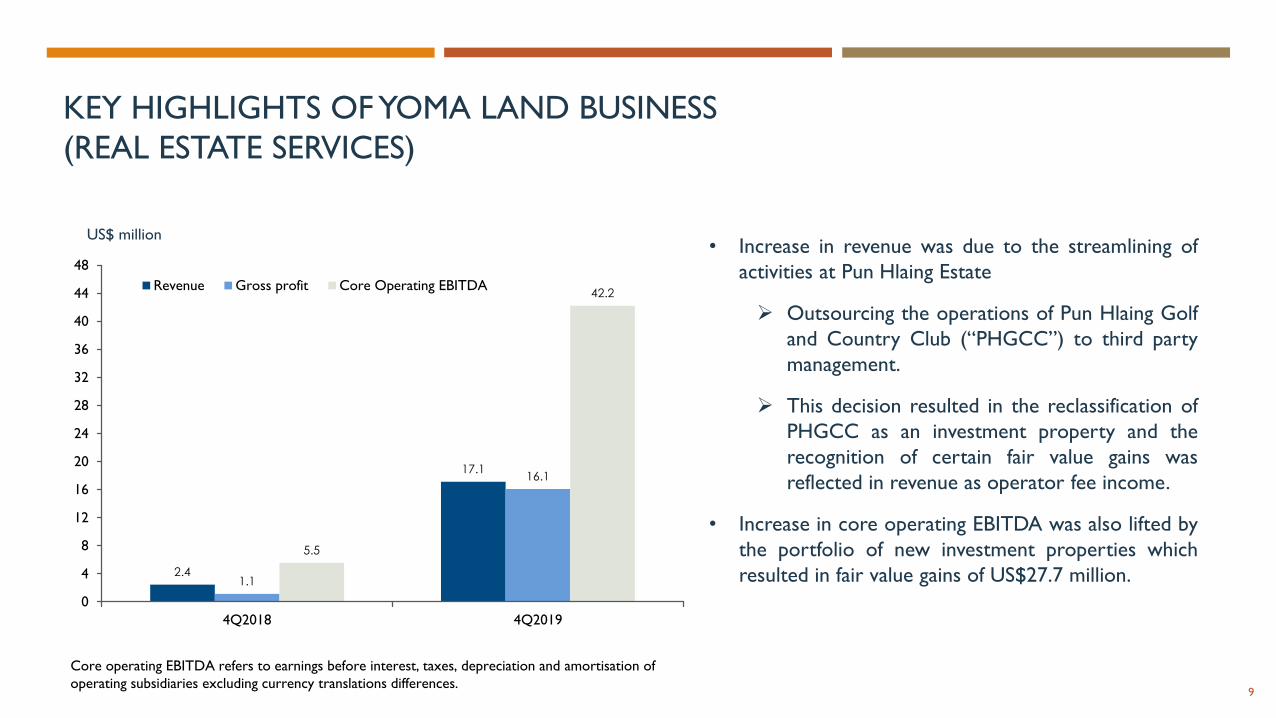
• Increase in revenue was due to the streamlining of
activities at Pun Hlaing Estate
➢ Outsourcing the operations of Pun Hlaing Golf
and Country Club (“PHGCC”) to third party
management.
➢ This decision resulted in the reclassification of
PHGCC as an investment property and the
recognition of certain fair value gains was
reflected in revenue as operator fee income.
• Increase in core operating EBITDA was also lifted by
the portfolio of new investment properties which
resulted in fair value gains of US$27.7 million.
9
2.4
17.1
1.1
16.1
5.5
42.2
0
4
8
12
16
20
24
28
32
36
40
44
48
4Q2018 4Q2019
Revenue Gross profit Core Operating EBITDA
US$ million
Core operating EBITDA refers to earnings before interest, taxes, depreciation and amortisation of
operating subsidiaries excluding currency translations differences.
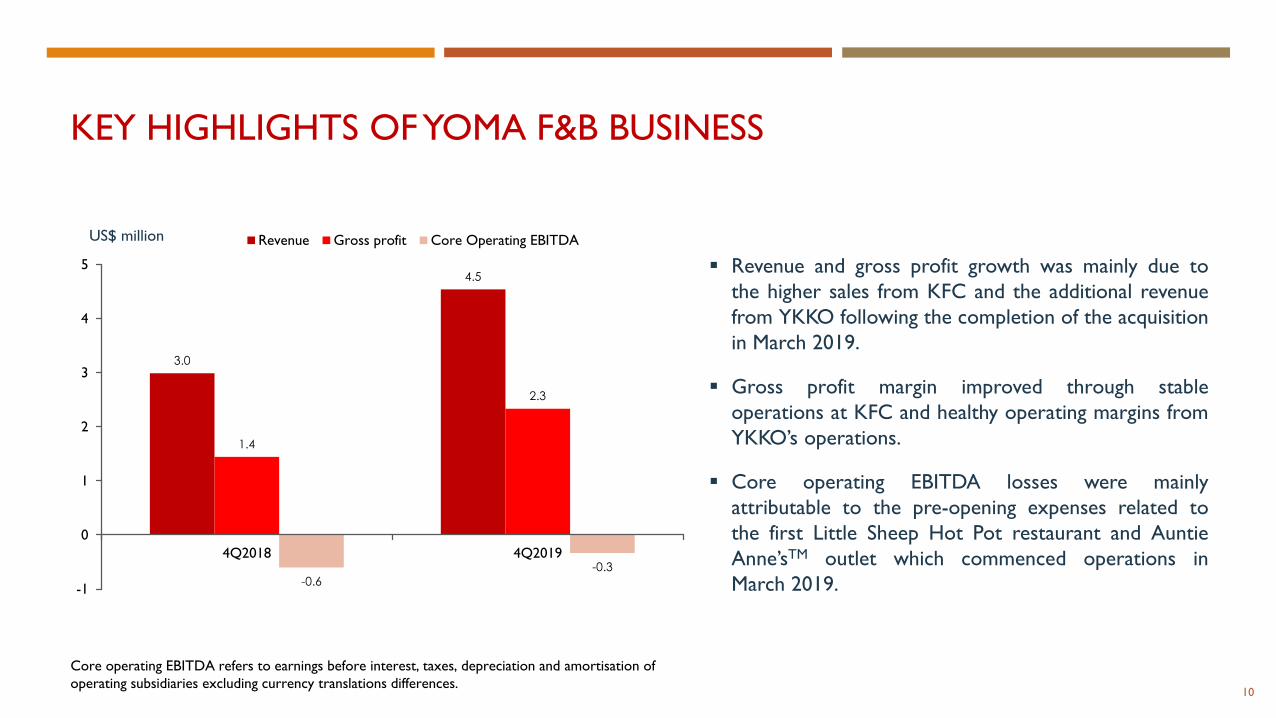
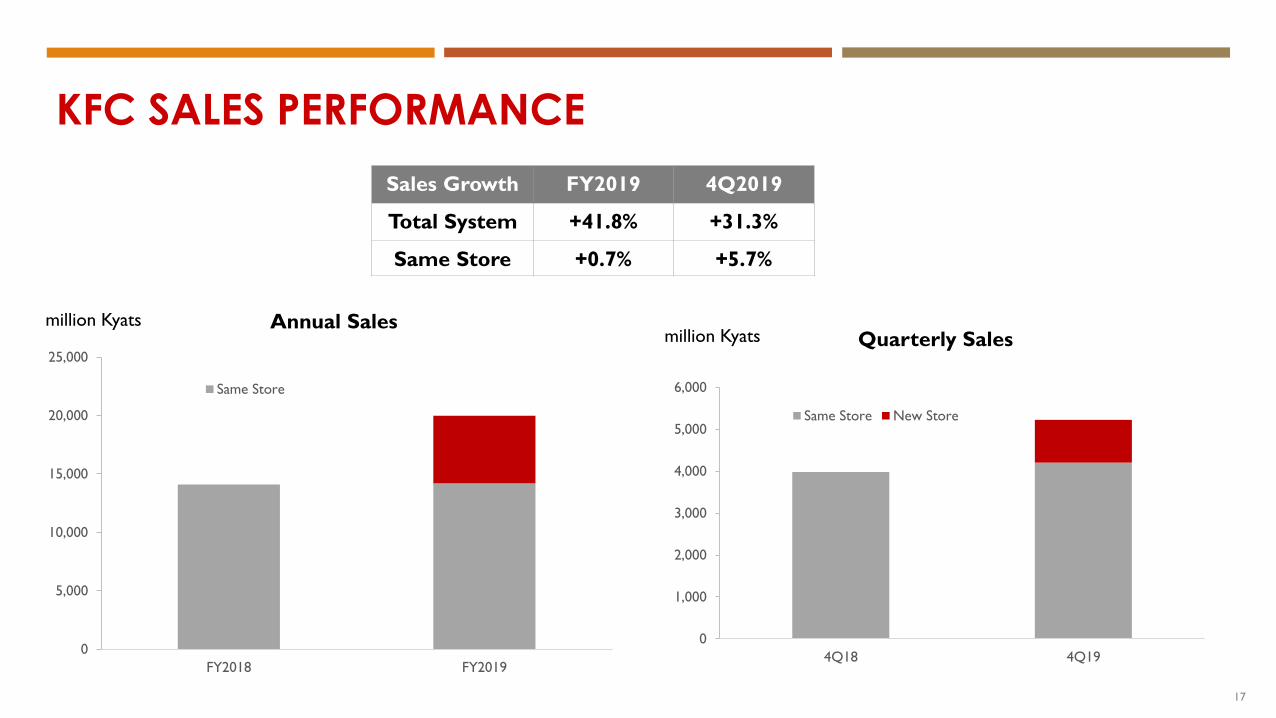
KEY HIGHLIGHTS OF YOMA F&B BUSINESS
▪ Revenue and gross profit growth was mainly due to
the higher sales from KFC and the additional revenue
from YKKO following the completion of the acquisition
in March 2019.
▪ Gross profit margin improved through stable
operations at KFC and healthy operating margins from
YKKO’s operations.
▪ Core operating EBITDA losses were mainly
attributable to the pre-opening expenses related to
the first Little Sheep Hot Pot restaurant and Auntie
Anne’sTM outlet which commenced operations in
March 2019.
10
3.0
4.5
1.4
2.3
-0.6
-0.3
-1
0
1
2
3
4
5
4Q2018 4Q2019
Revenue Gross profit Core Operating EBITDAUS$ million
Core operating EBITDA refers to earnings before interest, taxes, depreciation and amortisation of
operating subsidiaries excluding currency translations differences.
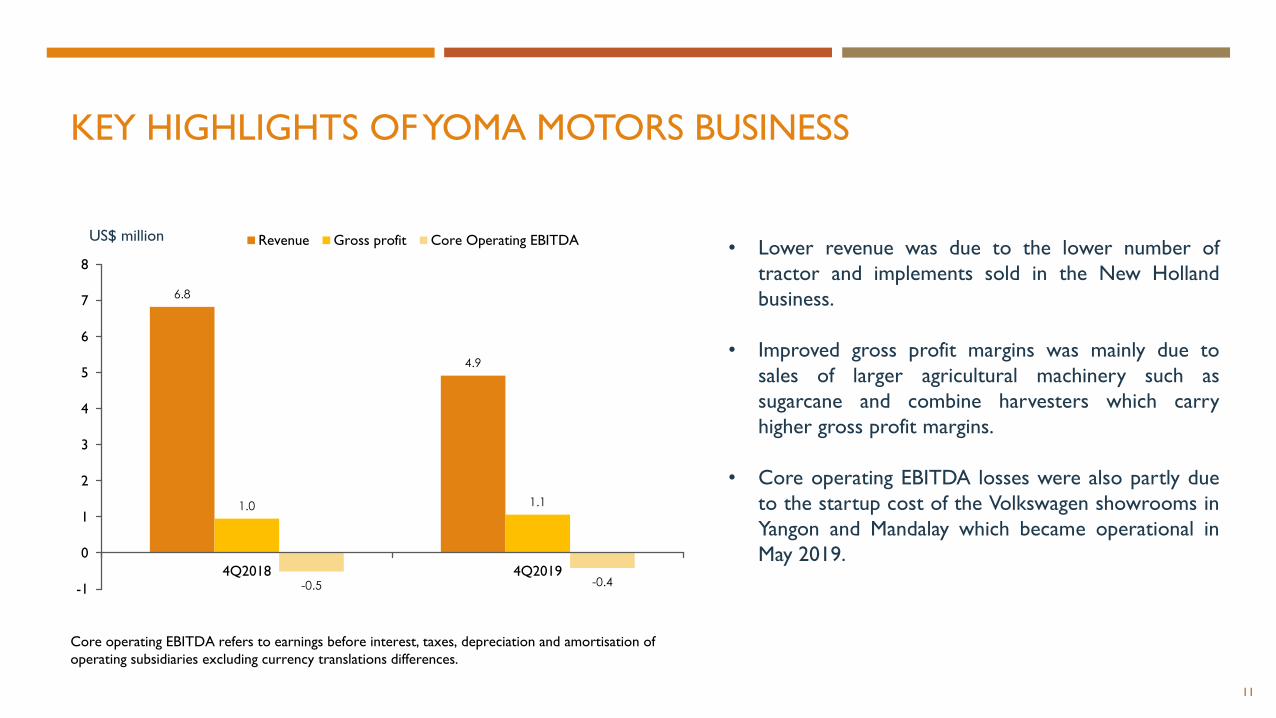
KEY HIGHLIGHTS OF YOMA MOTORS BUSINESS
• Lower revenue was due to the lower number of
tractor and implements sold in the New Holland
business.
• Improved gross profit margins was mainly due to
sales of larger agricultural machinery such as
sugarcane and combine harvesters which carry
higher gross profit margins.
• Core operating EBITDA losses were also partly due
to the startup cost of the Volkswagen showrooms in
Yangon and Mandalay which became operational in
May 2019.
11
6.8
4.9
1.0 1.1
-0.5 -0.4-1
0
1
2
3
4
5
6
7
8
4Q2018 4Q2019
Revenue Gross profit Core Operating EBITDAUS$ million
Core operating EBITDA refers to earnings before interest, taxes, depreciation and amortisation of
operating subsidiaries excluding currency translations differences.
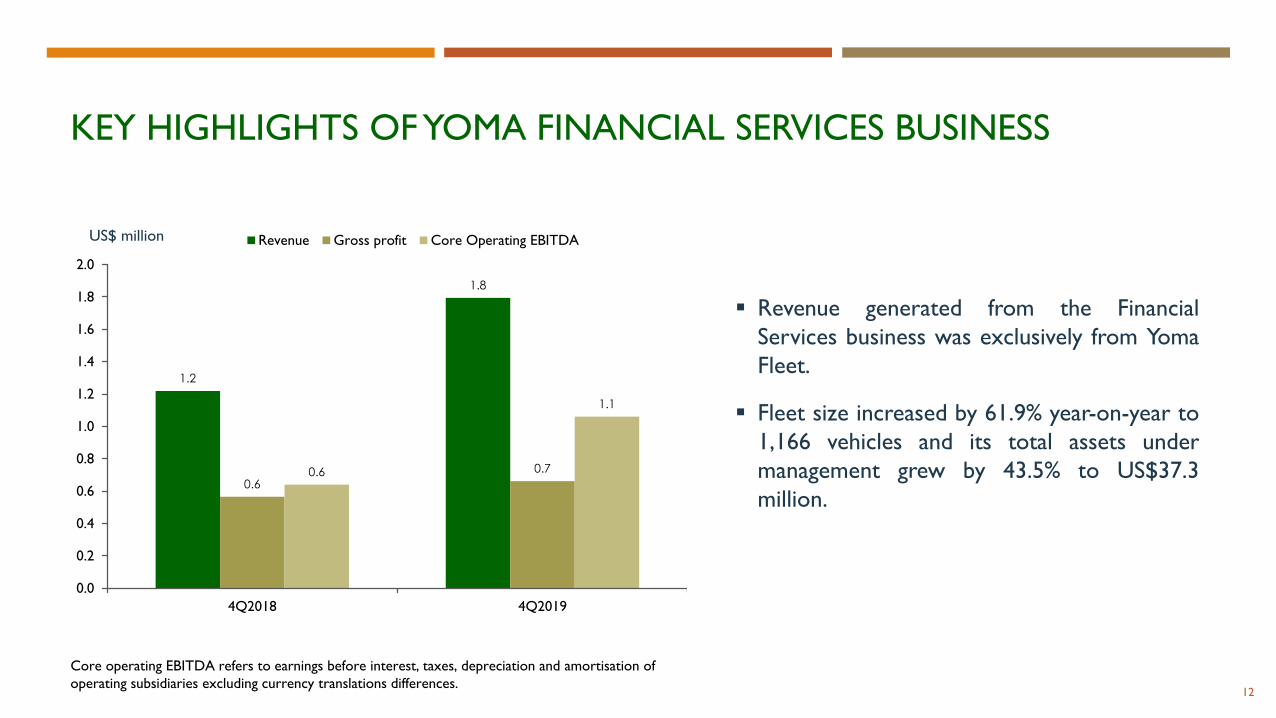
KEY HIGHLIGHTS OF YOMA FINANCIAL SERVICES BUSINESS
▪ Revenue generated from the Financial
Services business was exclusively from Yoma
Fleet.
▪ Fleet size increased by 61.9% year-on-year to
1,166 vehicles and its total assets under
management grew by 43.5% to US$37.3
million.
12
1.2
1.8
0.6
0.70.6
1.1
0.0
0.2
0.4
0.6
0.8
1.0
1.2
1.4
1.6
1.8
2.0
4Q2018 4Q2019
Revenue Gross profit Core Operating EBITDAUS$ million
Core operating EBITDA refers to earnings before interest, taxes, depreciation and amortisation of
operating subsidiaries excluding currency translations differences.
KEY DEVELOPMENTS
13
YOMA LANDPROGRESS OF YOMA CENTRAL
14
• As at 31 March 2019, the Group has sold 15 out of 30 units launched with another 3 being reserved at The
Peninsula Residences Yangon
• Both Christie’s International Real Estate and Success Realty were engaged in April 2019. Christie’s will focus
on the international market in particular the Japan, China and Hong Kong markets, while Success Realty
will focus on the domestic market.
• Retail market and leasing: Consultancy on leasing strategy has been completed and leasing activities to
start in1H2020.
• Office market and leasing: Strategy being finalized with leasing activities to start in 1H2021.
YOMA LANDFOCUSING SALES EFFORTS ON CITY LOFT @ STARCITY
15
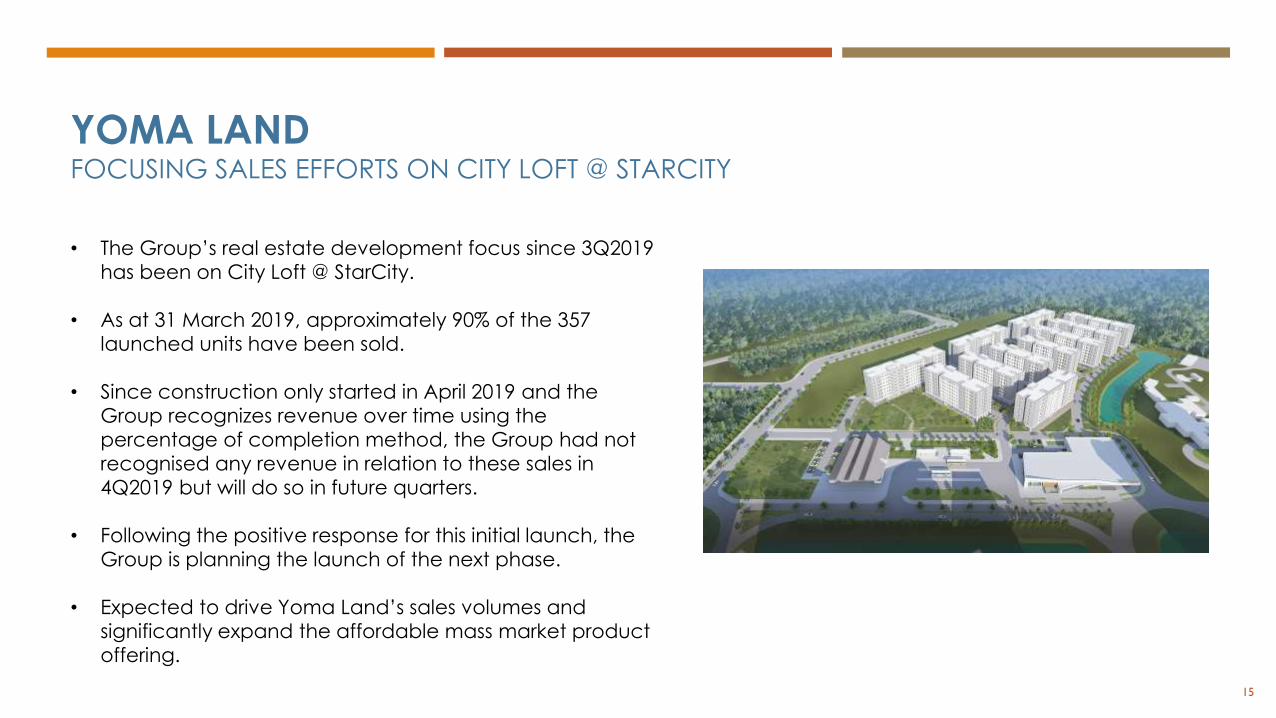
• The Group’s real estate development focus since 3Q2019
has been on City Loft @ StarCity.
• As at 31 March 2019, approximately 90% of the 357
launched units have been sold.
• Since construction only started in April 2019 and the
Group recognizes revenue over time using the
percentage of completion method, the Group had not
recognised any revenue in relation to these sales in
4Q2019 but will do so in future quarters.
• Following the positive response for this initial launch, the
Group is planning the launch of the next phase.
• Expected to drive Yoma Land’s sales volumes and
significantly expand the affordable mass market product
offering.
YOMA LANDGROWING ITS PORTFOLIO OF INVESTMENT PROPERTIES TO DRIVE RECURRING RENTAL
REVENUE
16
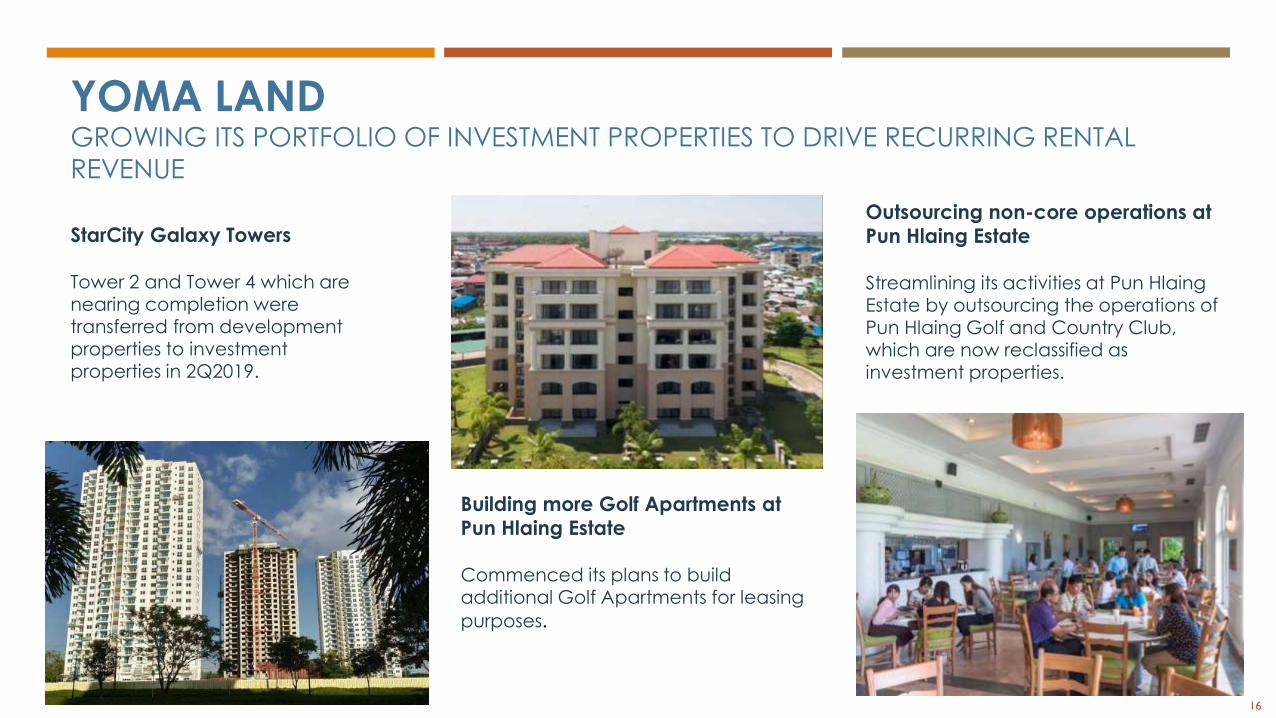
StarCity Galaxy Towers
Tower 2 and Tower 4 which are nearing completion were transferred from development properties to investment properties in 2Q2019.
Building more Golf Apartments at
Pun Hlaing Estate
Commenced its plans to build additional Golf Apartments for leasing
purposes.
Outsourcing non-core operations at
Pun Hlaing Estate
Streamlining its activities at Pun Hlaing Estate by outsourcing the operations of Pun Hlaing Golf and Country Club, which are now reclassified as investment properties.
17
KFC SALES PERFORMANCE
Sales Growth FY2019 4Q2019
Total System +41.8% +31.3%
Same Store +0.7% +5.7%
Quarterly SalesAnnual Sales
0
1,000
2,000
3,000
4,000
5,000
6,000
4Q18 4Q19
Same Store New Store
0
5,000
10,000
15,000
20,000
25,000
FY2018 FY2019
Same Store
million Kyatsmillion Kyats
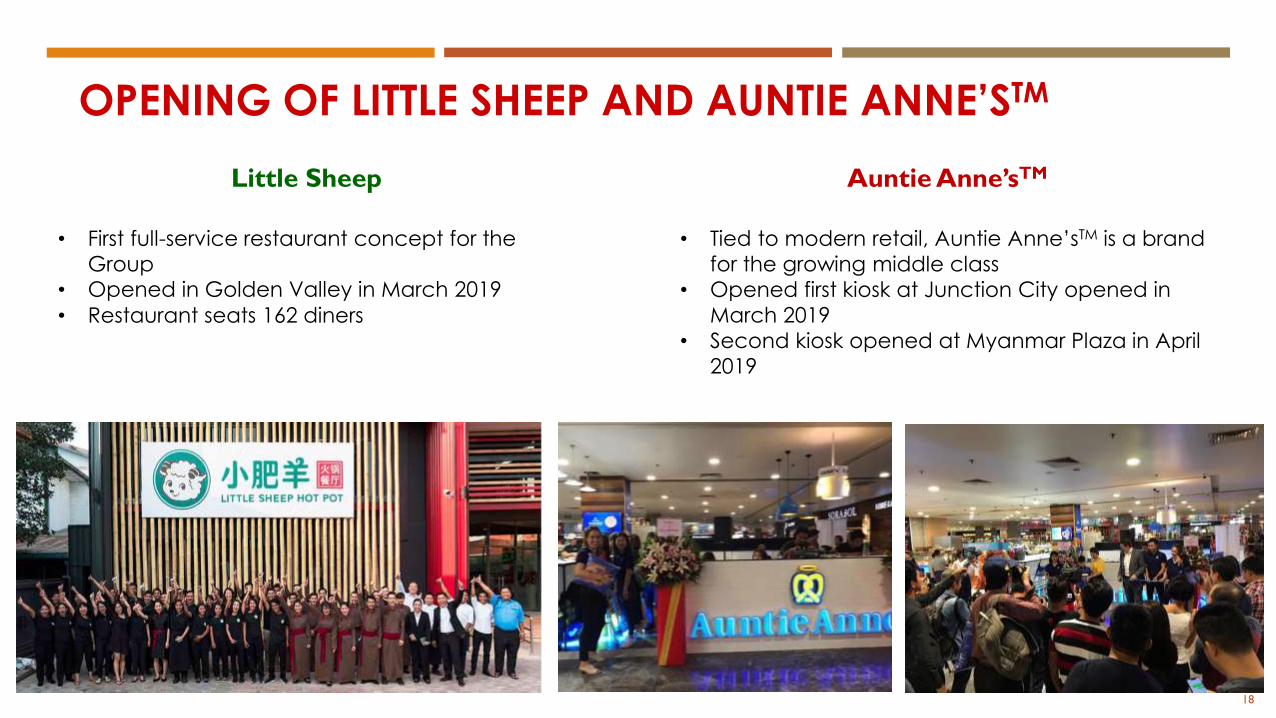
OPENING OF LITTLE SHEEP AND AUNTIE ANNE’STM
18
Little Sheep
• First full-service restaurant concept for the
Group• Opened in Golden Valley in March 2019
• Restaurant seats 162 diners
Auntie Anne’sTM
• Tied to modern retail, Auntie Anne’sTM is a brand
for the growing middle class
• Opened first kiosk at Junction City opened in
March 2019
• Second kiosk opened at Myanmar Plaza in April
2019
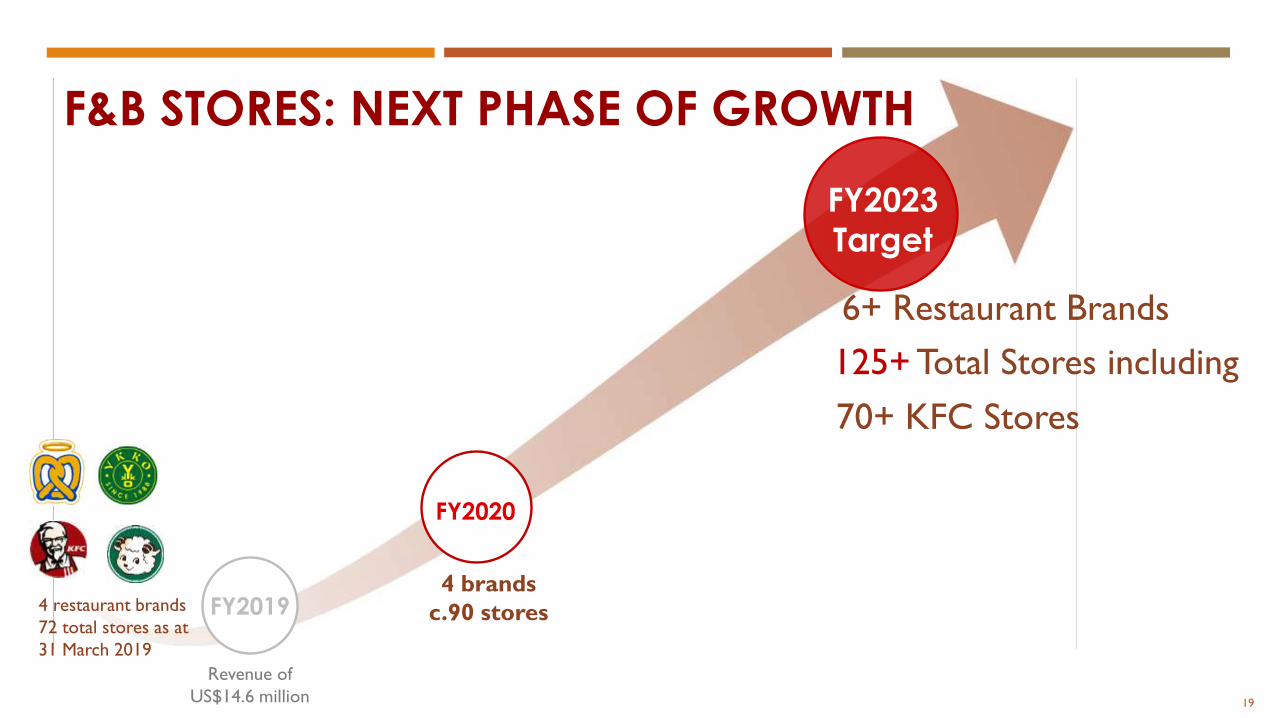
F&B STORES: NEXT PHASE OF GROWTH
FY2023
Target
Revenue of
US$14.6 million
FY20194 brands
c.90 stores
6+ Restaurant Brands
70+ KFC Stores
125+ Total Stores including
19
FY2020
4 restaurant brands
72 total stores as at
31 March 2019
Apr-18 May-18 Jun-18 Jul-18 Aug-18 Sep-18 Oct-18 Nov-18 Dec-18 Jan-19 Feb-19 Mar-19
+15%
+13%
+14%+10%
WAVE MONEY RECORDED POSITIVE EBITDA SINCE
SEPTEMBER 2018
20
Revenues* (MMK)
*Revenue includes prepaid airtime sales in addition to money transfer revenues.
+26% +5%
+24%
+19%
+11%-4%
+27%
Apr-18 May-18 Jun-18 Jul-18 Aug-18 Sep-18 Oct-18 Nov-18 Dec-18 Jan-19 Feb-19 Mar-19
+18%
+12%
+15%+6%
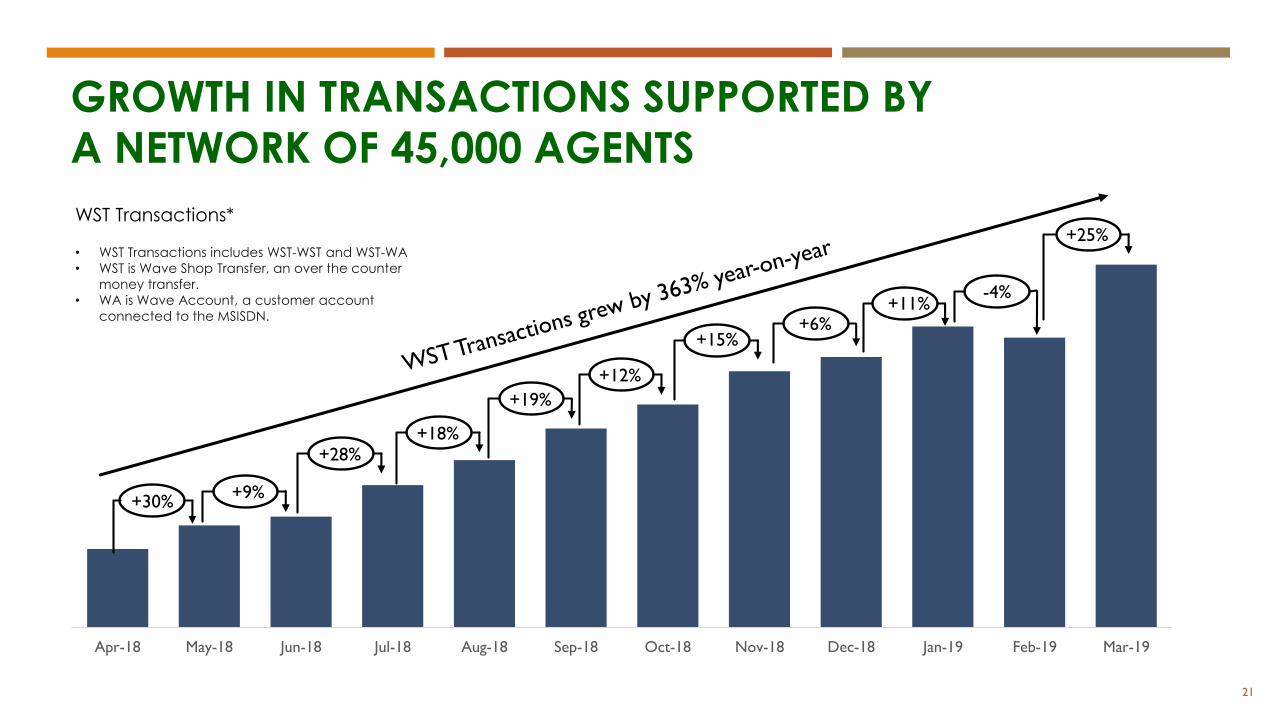
21
WST Transactions*
• WST Transactions includes WST-WST and WST-WA
• WST is Wave Shop Transfer, an over the counter
money transfer.
• WA is Wave Account, a customer account
connected to the MSISDN.
+30%+9%
+28%
+19%
+11%-4%
+25%
GROWTH IN TRANSACTIONS SUPPORTED BY
A NETWORK OF 45,000 AGENTS
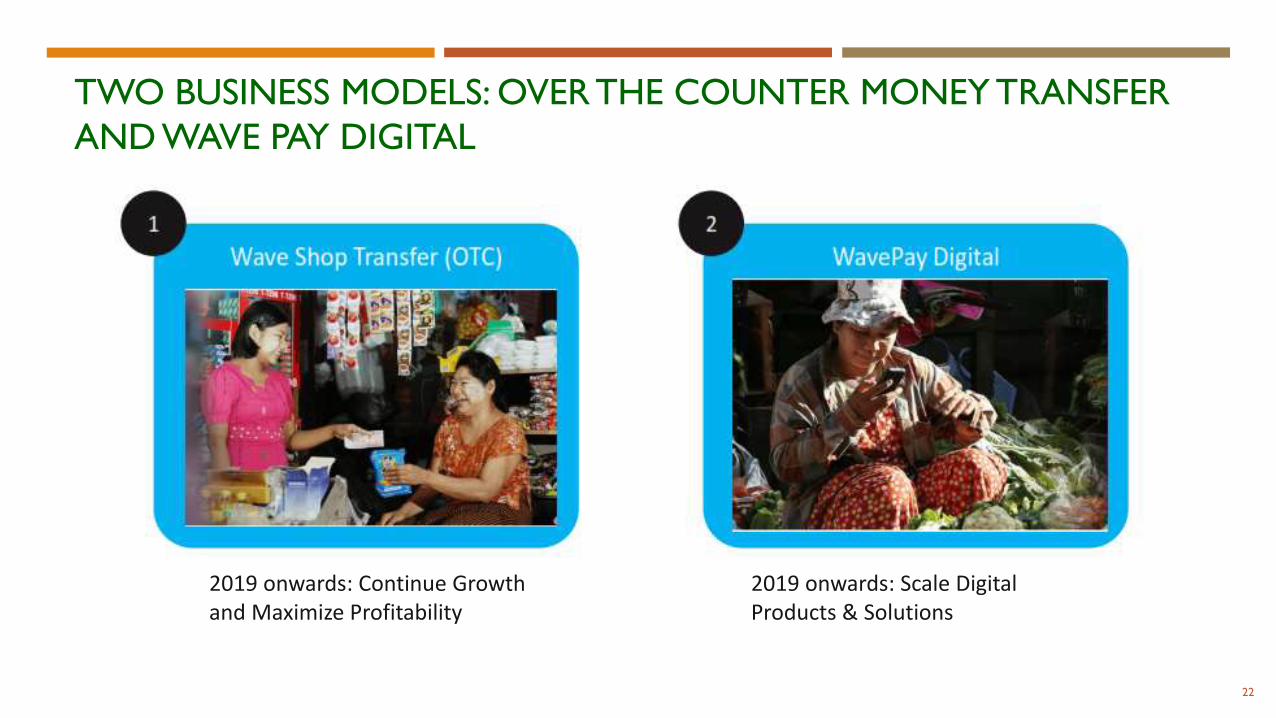
TWO BUSINESS MODELS: OVER THE COUNTER MONEY TRANSFER
AND WAVE PAY DIGITAL
22
2019 onwards: Continue Growth and Maximize Profitability
2019 onwards: Scale DigitalProducts & Solutions
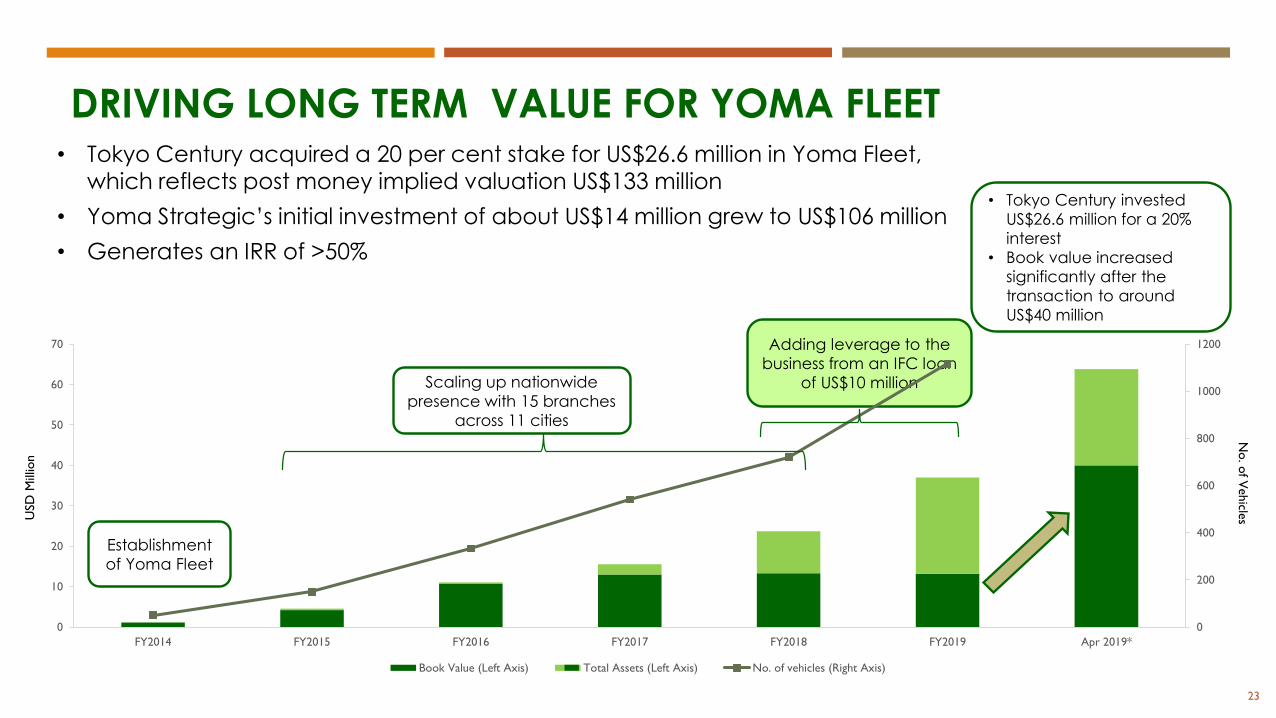
Adding leverage to the
business from an IFC loan
of US$10 million
0
200
400
600
800
1000
1200
0
10
20
30
40
50
60
70
FY2014 FY2015 FY2016 FY2017 FY2018 FY2019 Apr 2019*
Book Value (Left Axis) Total Assets (Left Axis) No. of vehicles (Right Axis)
DRIVING LONG TERM VALUE FOR YOMA FLEET
23
• Tokyo Century acquired a 20 per cent stake for US$26.6 million in Yoma Fleet, which reflects post money implied valuation US$133 million
• Yoma Strategic’s initial investment of about US$14 million grew to US$106 million
• Generates an IRR of >50%
Scaling up nationwide
presence with 15 branches
across 11 cities
Establishment
of Yoma Fleet
• Tokyo Century invested
US$26.6 million for a 20%
interest
• Book value increased
significantly after the
transaction to around
US$40 million
USD
Mill
ion
No. o
f Vehicle
s
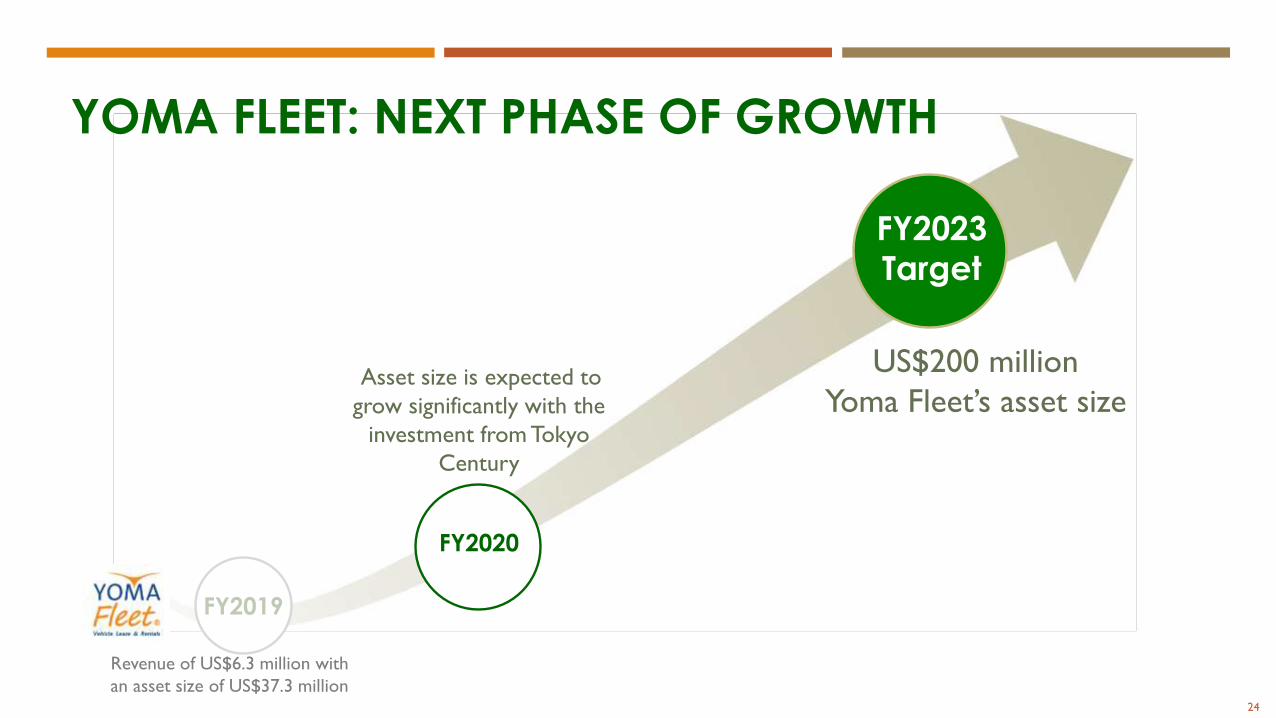
YOMA FLEET: NEXT PHASE OF GROWTH
US$200 million
Yoma Fleet’s asset size
FY2023
Target
FY2019
Revenue of US$6.3 million with
an asset size of US$37.3 million24
FY2020
Asset size is expected to
grow significantly with the
investment from Tokyo
Century
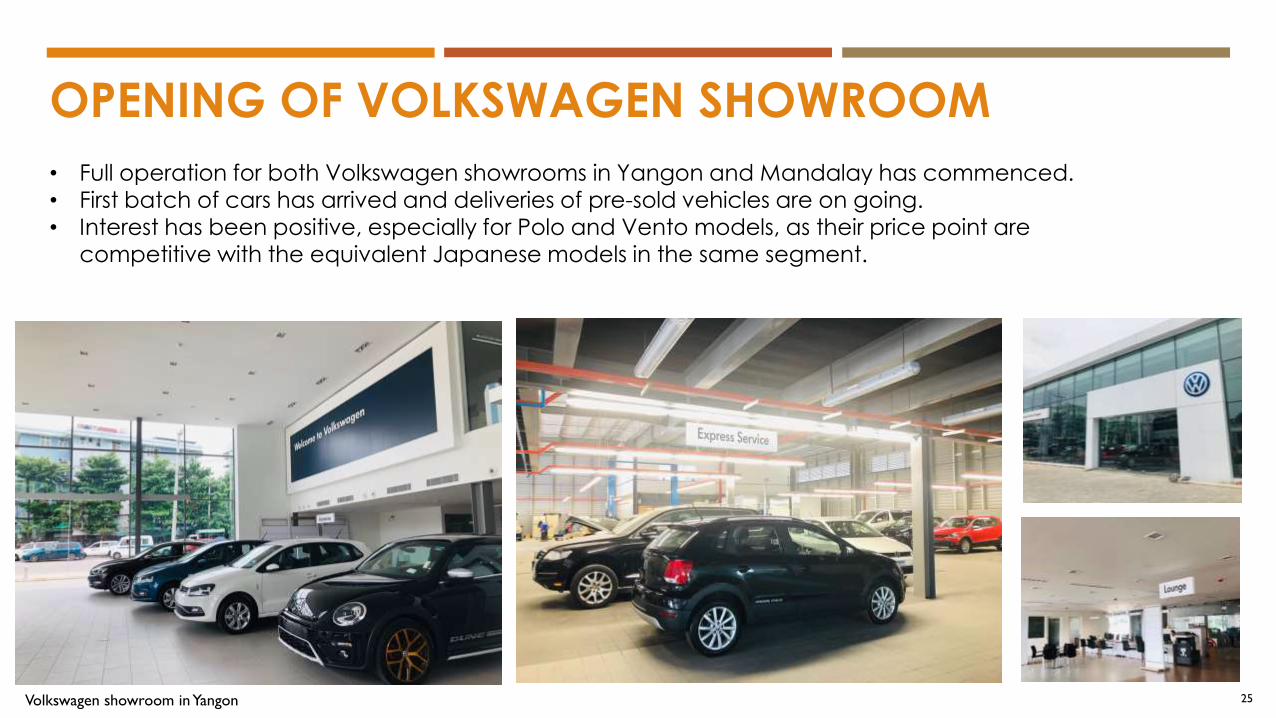
OPENING OF VOLKSWAGEN SHOWROOM
• Full operation for both Volkswagen showrooms in Yangon and Mandalay has commenced.• First batch of cars has arrived and deliveries of pre-sold vehicles are on going. • Interest has been positive, especially for Polo and Vento models, as their price point are
competitive with the equivalent Japanese models in the same segment.
25Volkswagen showroom in Yangon