q2 fy2019 operating results - ir webcasting
TRANSCRIPT
DeNA Co., Ltd.
Q2 FY2019Operating Results
November 6, 2019
1
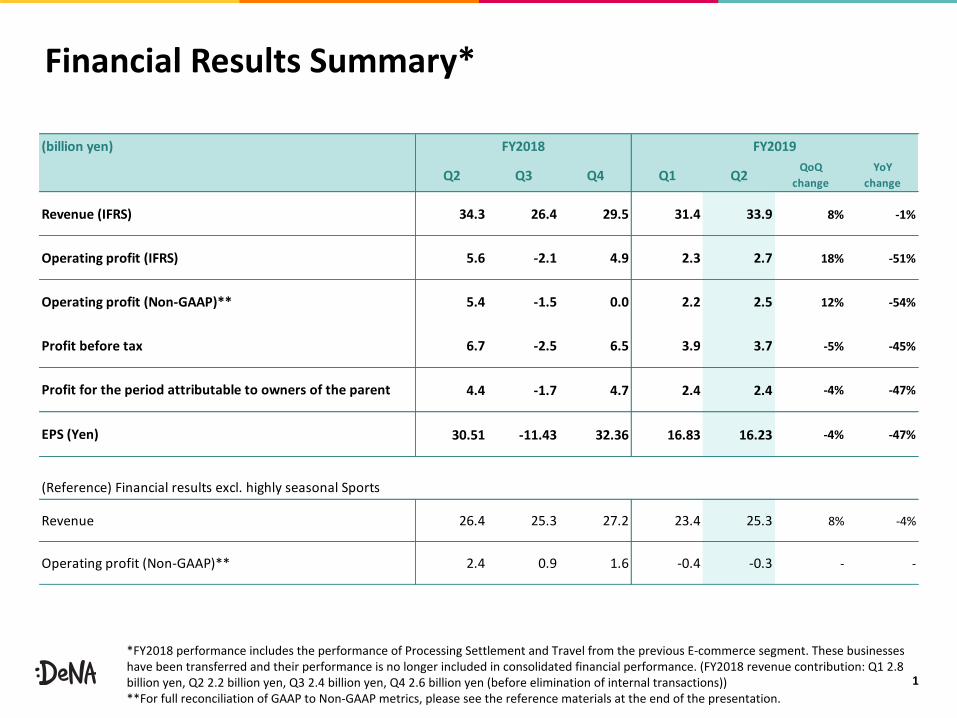
Financial Results Summary*
*FY2018 performance includes the performance of Processing Settlement and Travel from the previous E-commerce segment. These businesses have been transferred and their performance is no longer included in consolidated financial performance. (FY2018 revenue contribution: Q1 2.8 billion yen, Q2 2.2 billion yen, Q3 2.4 billion yen, Q4 2.6 billion yen (before elimination of internal transactions))**For full reconciliation of GAAP to Non-GAAP metrics, please see the reference materials at the end of the presentation.
(billion yen)
Q2 Q3 Q4 Q1 Q2 QoQchange
YoYchange
Revenue (IFRS) 34.3 26.4 29.5 31.4 33.9 8% -1%
Operating profit (IFRS) 5.6 -2.1 4.9 2.3 2.7 18% -51%
Operating profit (Non-GAAP)** 5.4 -1.5 0.0 2.2 2.5 12% -54%
Profit before tax 6.7 -2.5 6.5 3.9 3.7 -5% -45%
4.4 -1.7 4.7 2.4 2.4 -4% -47%
30.51 -11.43 32.36 16.83 16.23 -4% -47%
(Reference) Financial results excl. highly seasonal Sports
26.4 25.3 27.2 23.4 25.3 8% -4%
2.4 0.9 1.6 -0.4 -0.3 - -
FY2018 FY2019
Operating profit (Non-GAAP)**
Profit for the period attributable to owners of the parent
EPS (Yen)
Revenue
2
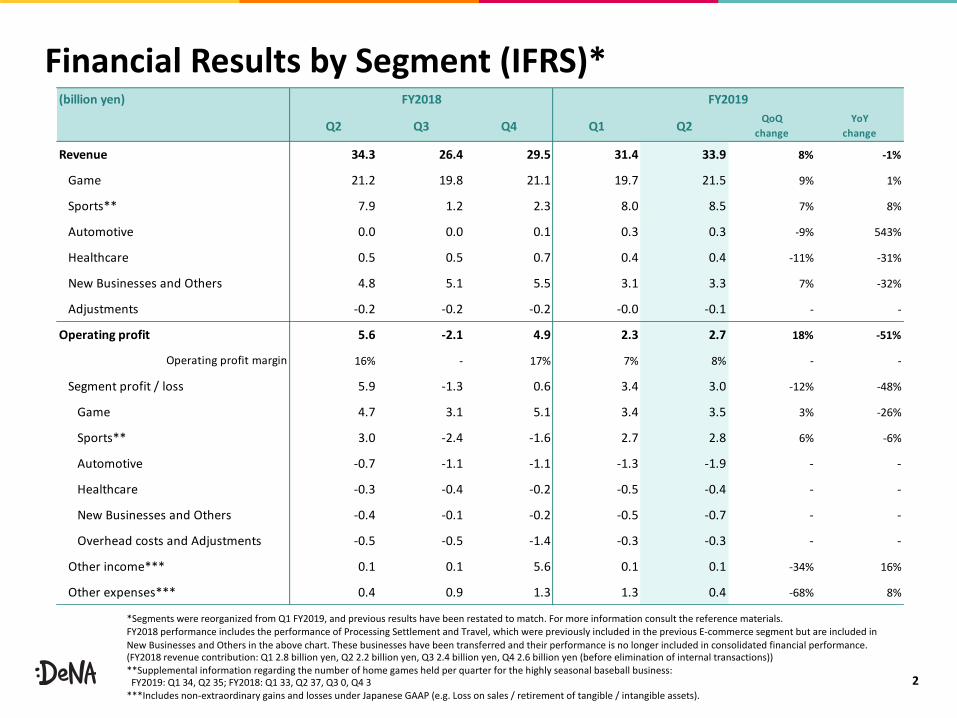
Financial Results by Segment (IFRS)*
*Segments were reorganized from Q1 FY2019, and previous results have been restated to match. For more information consult the reference materials. FY2018 performance includes the performance of Processing Settlement and Travel, which were previously included in the previous E-commerce segment but are included in New Businesses and Others in the above chart. These businesses have been transferred and their performance is no longer included in consolidated financial performance. (FY2018 revenue contribution: Q1 2.8 billion yen, Q2 2.2 billion yen, Q3 2.4 billion yen, Q4 2.6 billion yen (before elimination of internal transactions))**Supplemental information regarding the number of home games held per quarter for the highly seasonal baseball business:FY2019: Q1 34, Q2 35; FY2018: Q1 33, Q2 37, Q3 0, Q4 3
***Includes non-extraordinary gains and losses under Japanese GAAP (e.g. Loss on sales / retirement of tangible / intangible assets).
(billion yen)
Q2 Q3 Q4 Q1 Q2 QoQchange
YoYchange
Revenue 34.3 26.4 29.5 31.4 33.9 8% -1%
Game 21.2 19.8 21.1 19.7 21.5 9% 1%
Sports** 7.9 1.2 2.3 8.0 8.5 7% 8%
Automotive 0.0 0.0 0.1 0.3 0.3 -9% 543%
Healthcare 0.5 0.5 0.7 0.4 0.4 -11% -31%
New Businesses and Others 4.8 5.1 5.5 3.1 3.3 7% -32%
Adjustments -0.2 -0.2 -0.2 -0.0 -0.1 - -
Operating profit 5.6 -2.1 4.9 2.3 2.7 18% -51%
16% - 17% 7% 8% - -
Segment profit / loss 5.9 -1.3 0.6 3.4 3.0 -12% -48%
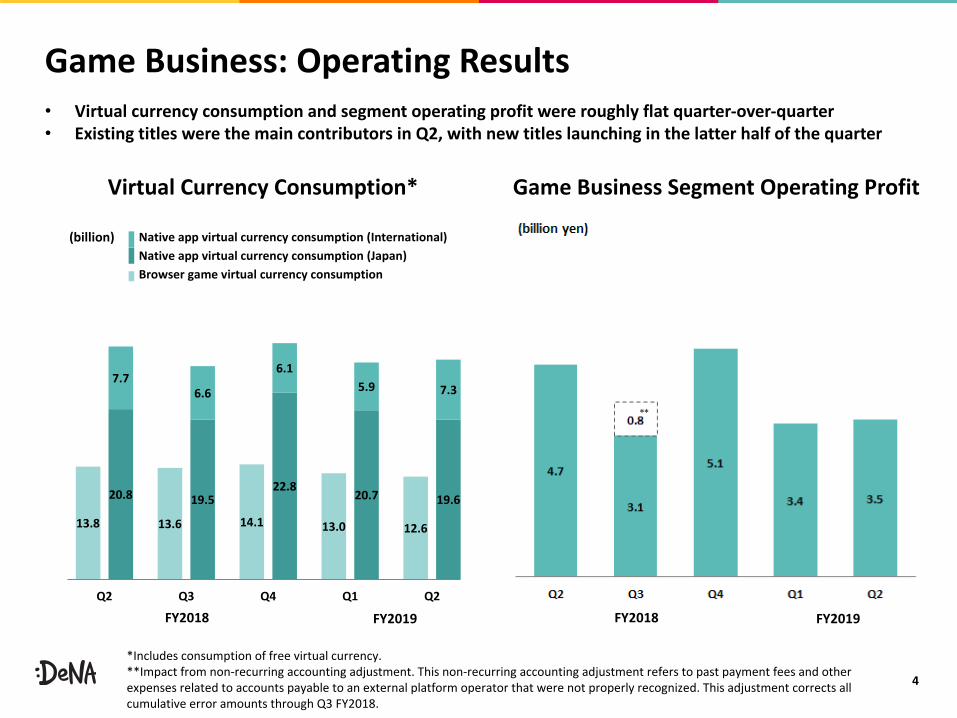
Game 4.7 3.1 5.1 3.4 3.5 3% -26%
Sports** 3.0 -2.4 -1.6 2.7 2.8 6% -6%
Automotive -0.7 -1.1 -1.1 -1.3 -1.9 - -
Healthcare -0.3 -0.4 -0.2 -0.5 -0.4 - -
New Businesses and Others -0.4 -0.1 -0.2 -0.5 -0.7 - -
Overhead costs and Adjustments -0.5 -0.5 -1.4 -0.3 -0.3 - -
Other income*** 0.1 0.1 5.6 0.1 0.1 -34% 16%
Other expenses*** 0.4 0.9 1.3 1.3 0.4 -68% 8%
Operating profit margin
FY2018 FY2019
3
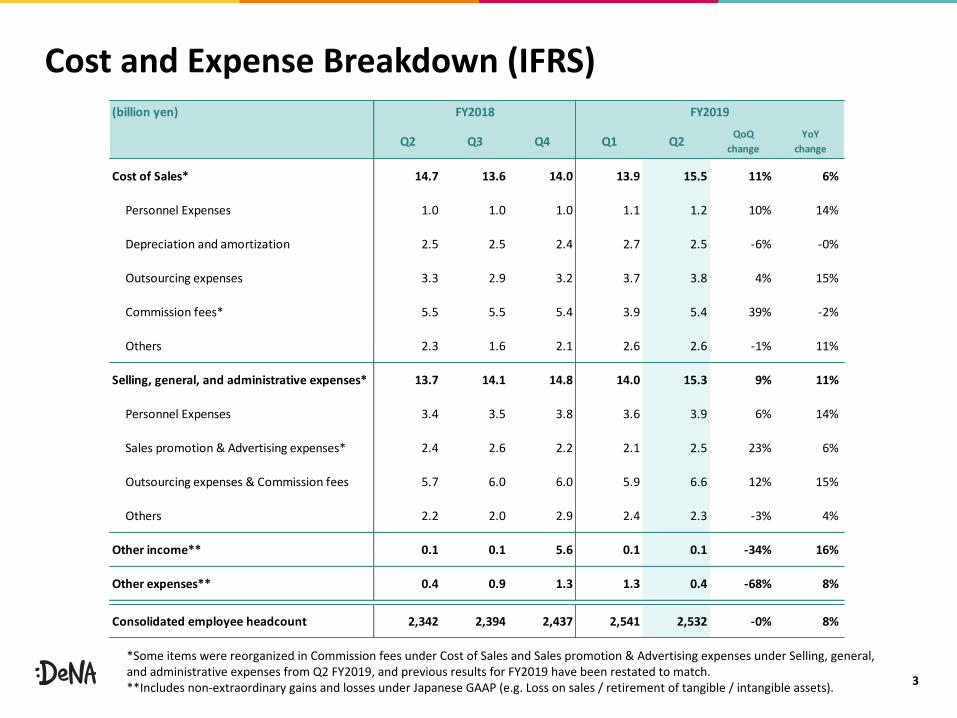
Cost and Expense Breakdown (IFRS)
*Some items were reorganized in Commission fees under Cost of Sales and Sales promotion & Advertising expenses under Selling, general, and administrative expenses from Q2 FY2019, and previous results for FY2019 have been restated to match.**Includes non-extraordinary gains and losses under Japanese GAAP (e.g. Loss on sales / retirement of tangible / intangible assets).
(billion yen)
Q2 Q3 Q4 Q1 Q2QoQ
changeYoY
change
Cost of Sales* 14.7 13.6 14.0 13.9 15.5 11% 6%
Personnel Expenses 1.0 1.0 1.0 1.1 1.2 10% 14%
Depreciation and amortization 2.5 2.5 2.4 2.7 2.5 -6% -0%
Outsourcing expenses 3.3 2.9 3.2 3.7 3.8 4% 15%
Commission fees* 5.5 5.5 5.4 3.9 5.4 39% -2%
Others 2.3 1.6 2.1 2.6 2.6 -1% 11%
Selling, general, and administrative expenses* 13.7 14.1 14.8 14.0 15.3 9% 11%
Personnel Expenses 3.4 3.5 3.8 3.6 3.9 6% 14%
Sales promotion & Advertising expenses* 2.4 2.6 2.2 2.1 2.5 23% 6%
Outsourcing expenses & Commission fees 5.7 6.0 6.0 5.9 6.6 12% 15%
Others 2.2 2.0 2.9 2.4 2.3 -3% 4%
Other income** 0.1 0.1 5.6 0.1 0.1 -34% 16%
Other expenses** 0.4 0.9 1.3 1.3 0.4 -68% 8%
Consolidated employee headcount 2,342 2,394 2,437 2,541 2,532 -0% 8%
FY2018 FY2019
4
13.8 13.6 14.1 13.0 12.6
20.8 19.522.8 20.7 19.6
7.76.6
6.15.9 7.3
Q2 Q3 Q4 Q1 Q2
Native app virtual currency consumption (International)Native app virtual currency consumption (Japan)Browser game virtual currency consumption
(billion)
Game Business: Operating Results• Virtual currency consumption and segment operating profit were roughly flat quarter-over-quarter • Existing titles were the main contributors in Q2, with new titles launching in the latter half of the quarter
*Includes consumption of free virtual currency.**Impact from non-recurring accounting adjustment. This non-recurring accounting adjustment refers to past payment fees and other expenses related to accounts payable to an external platform operator that were not properly recognized. This adjustment corrects all cumulative error amounts through Q3 FY2018.
Game Business Segment Operating ProfitVirtual Currency Consumption*
FY2019FY2018 FY2018 FY2019
**
5
Game Business
*The titles referenced on this slide are published by Nintendo.
© 2019 Nintendo
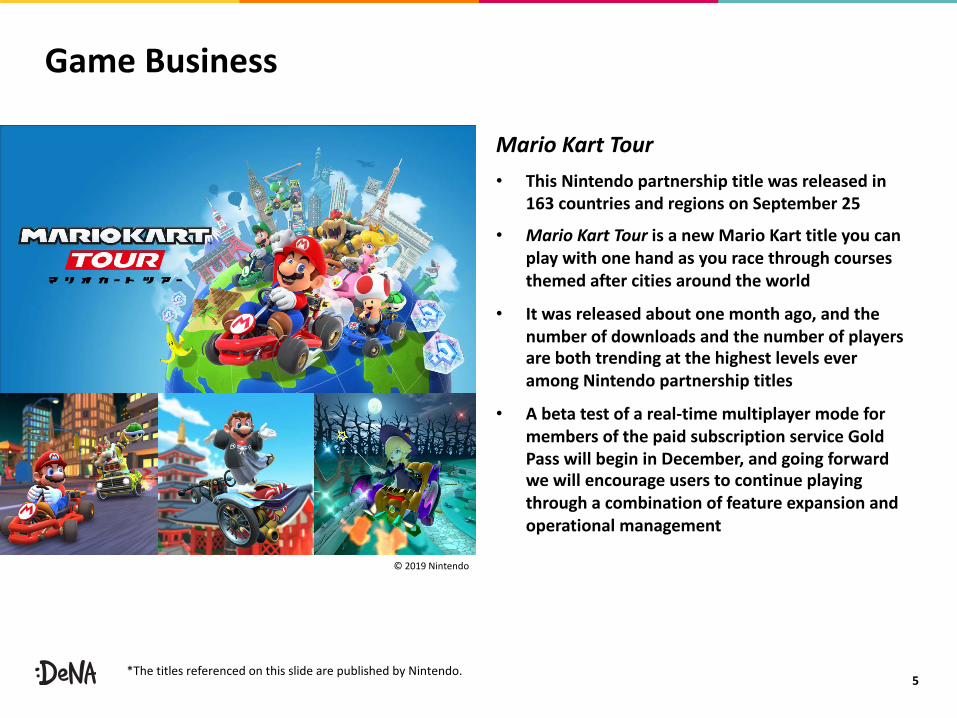
Mario Kart Tour• This Nintendo partnership title was released in
163 countries and regions on September 25
• Mario Kart Tour is a new Mario Kart title you can play with one hand as you race through courses themed after cities around the world
• It was released about one month ago, and the number of downloads and the number of players are both trending at the highest levels ever among Nintendo partnership titles
• A beta test of a real-time multiplayer mode for members of the paid subscription service Gold Pass will begin in December, and going forward we will encourage users to continue playing through a combination of feature expansion and operational management
6
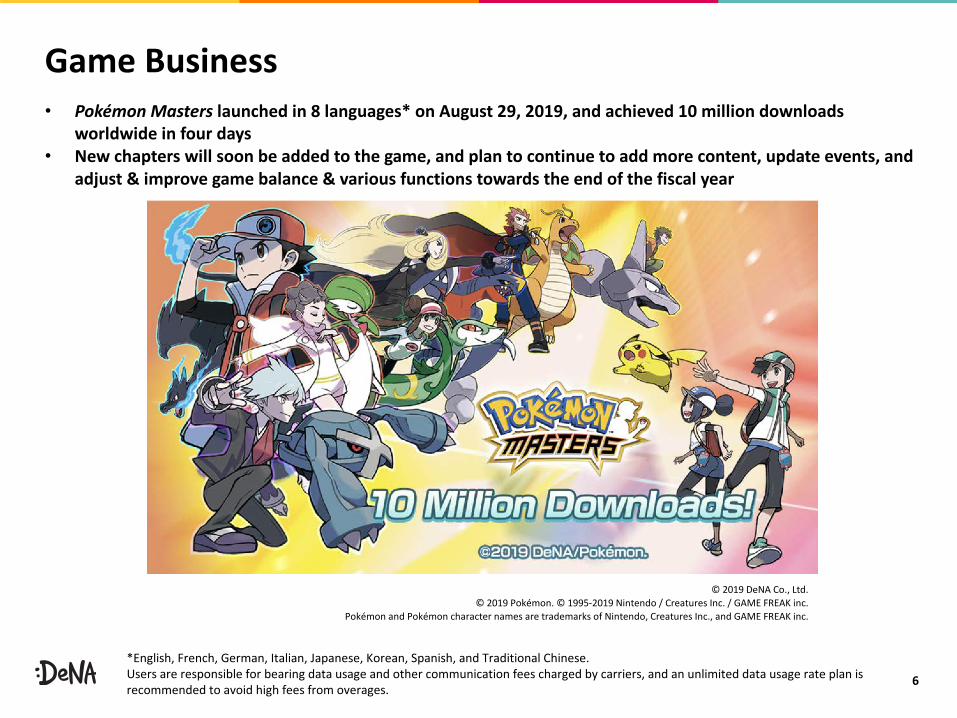
Game Business• Pokémon Masters launched in 8 languages* on August 29, 2019, and achieved 10 million downloads
worldwide in four days• New chapters will soon be added to the game, and plan to continue to add more content, update events, and
adjust & improve game balance & various functions towards the end of the fiscal year
*English, French, German, Italian, Japanese, Korean, Spanish, and Traditional Chinese.Users are responsible for bearing data usage and other communication fees charged by carriers, and an unlimited data usage rate plan is recommended to avoid high fees from overages.
© 2019 DeNA Co., Ltd.© 2019 Pokémon. © 1995-2019 Nintendo / Creatures Inc. / GAME FREAK inc.
Pokémon and Pokémon character names are trademarks of Nintendo, Creatures Inc., and GAME FREAK inc.
Not updated
7
Game Business
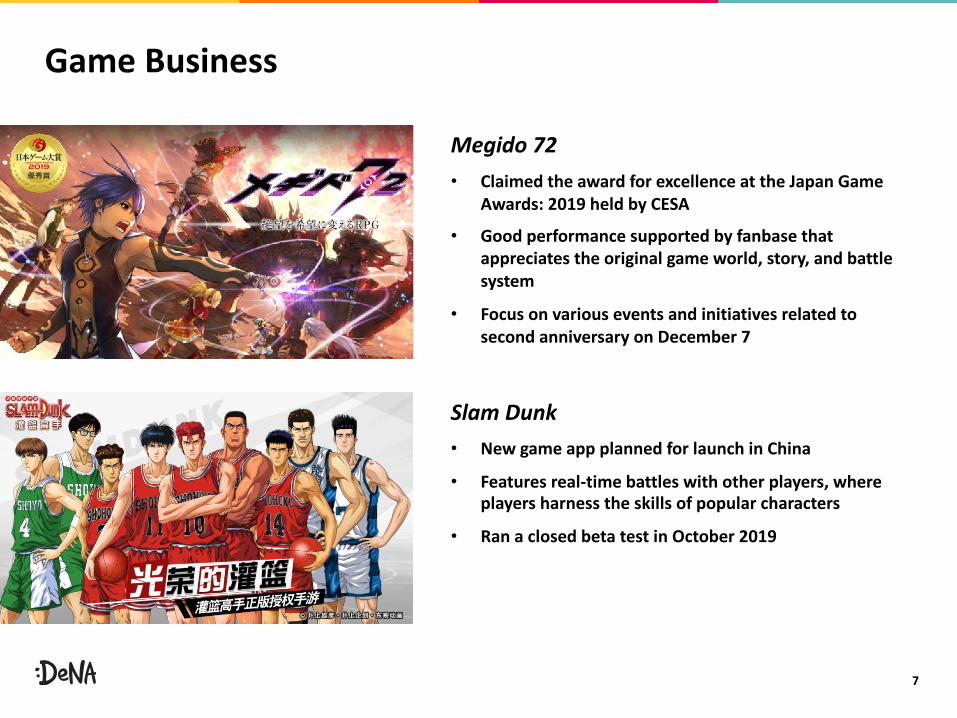
Slam Dunk• New game app planned for launch in China
• Features real-time battles with other players, where players harness the skills of popular characters
• Ran a closed beta test in October 2019
Megido 72• Claimed the award for excellence at the Japan Game
Awards: 2019 held by CESA
• Good performance supported by fanbase that appreciates the original game world, story, and battle system
• Focus on various events and initiatives related to second anniversary on December 7
8
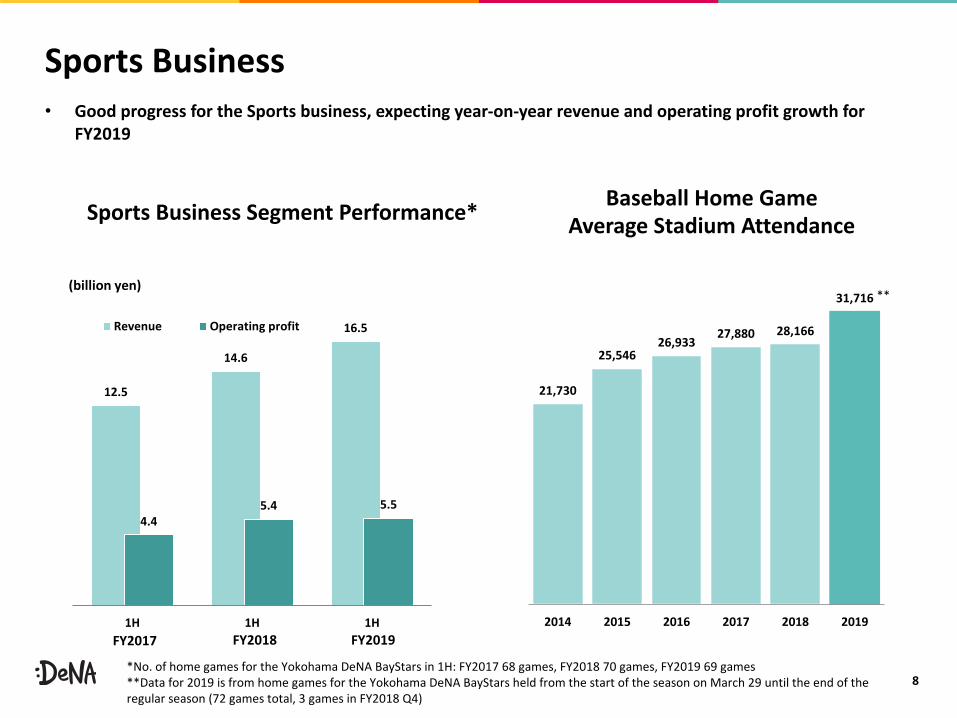
21,730
25,54626,933 27,880 28,166
31,716
2014 2015 2016 2017 2018 2019
Sports Business• Good progress for the Sports business, expecting year-on-year revenue and operating profit growth for
FY2019
Baseball Home Game Average Stadium AttendanceSports Business Segment Performance*
*No. of home games for the Yokohama DeNA BayStars in 1H: FY2017 68 games, FY2018 70 games, FY2019 69 games**Data for 2019 is from home games for the Yokohama DeNA BayStars held from the start of the season on March 29 until the end of the regular season (72 games total, 3 games in FY2018 Q4)
**
FY2017 FY2018 FY2019
12.5
14.6
16.5
4.45.4 5.5
1H 1H 1H
Revenue Operating profit
(billion yen)
9
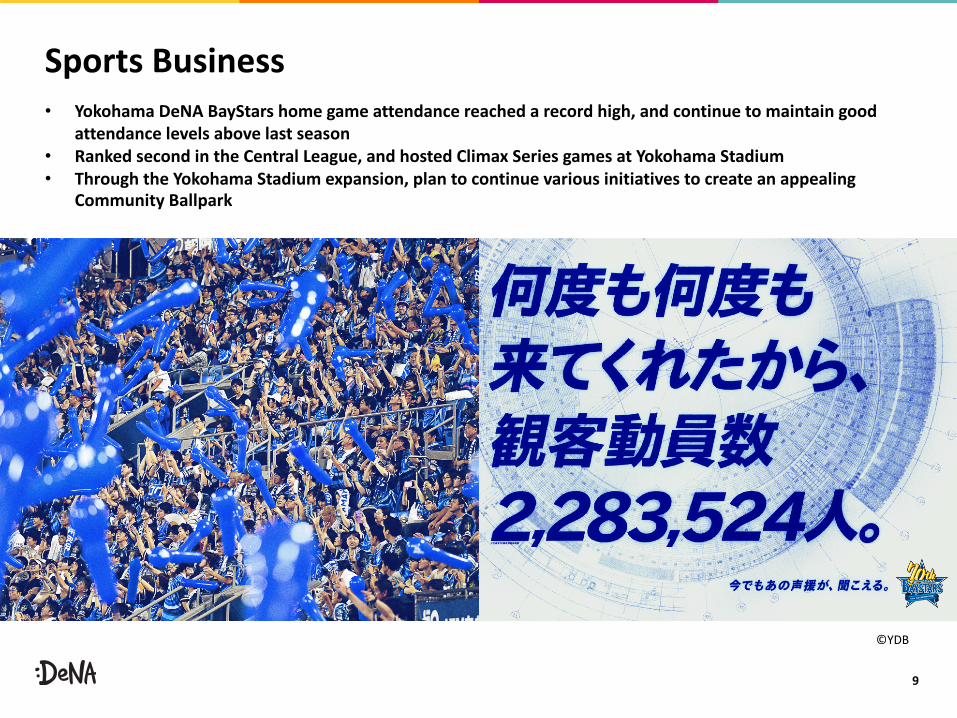
Sports Business
©YDB
• Yokohama DeNA BayStars home game attendance reached a record high, and continue to maintain good attendance levels above last season
• Ranked second in the Central League, and hosted Climax Series games at Yokohama Stadium• Through the Yokohama Stadium expansion, plan to continue various initiatives to create an appealing
Community Ballpark
10
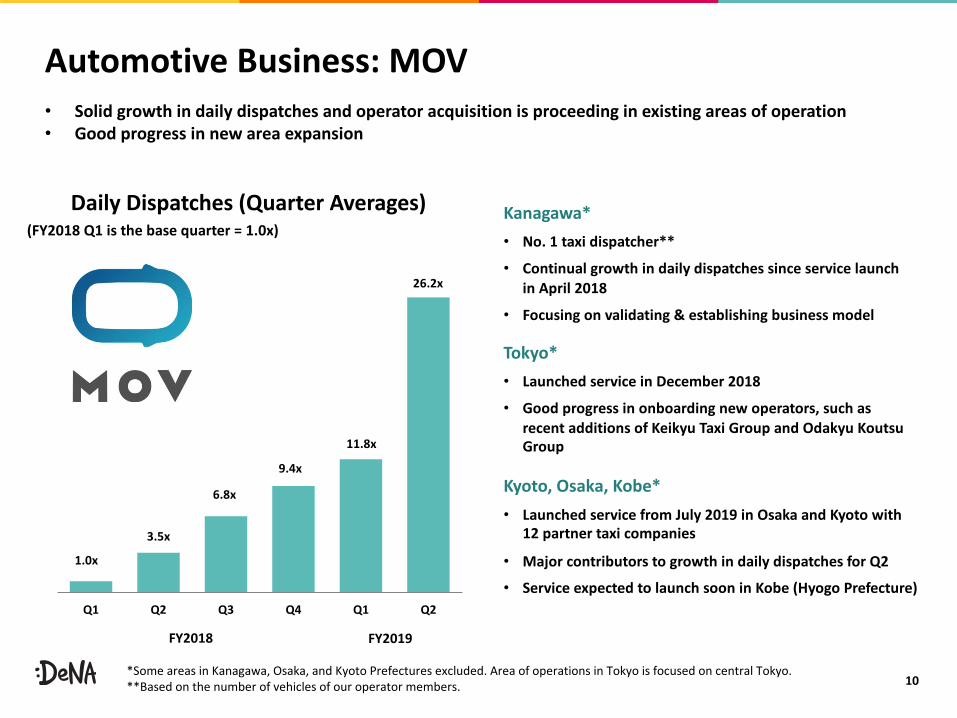
Q1 Q2 Q3 Q4 Q1 Q2
Automotive Business: MOV
FY2018
• Solid growth in daily dispatches and operator acquisition is proceeding in existing areas of operation• Good progress in new area expansion
FY2019
(FY2018 Q1 is the base quarter = 1.0x)Daily Dispatches (Quarter Averages)
*Some areas in Kanagawa, Osaka, and Kyoto Prefectures excluded. Area of operations in Tokyo is focused on central Tokyo.**Based on the number of vehicles of our operator members.
1.0x
3.5x
6.8x
9.4x
11.8x
26.2x
Kanagawa*• No. 1 taxi dispatcher**
• Continual growth in daily dispatches since service launch in April 2018
• Focusing on validating & establishing business model
Tokyo*• Launched service in December 2018
• Good progress in onboarding new operators, such as recent additions of Keikyu Taxi Group and Odakyu KoutsuGroup
Kyoto, Osaka, Kobe*• Launched service from July 2019 in Osaka and Kyoto with
12 partner taxi companies
• Major contributors to growth in daily dispatches for Q2
• Service expected to launch soon in Kobe (Hyogo Prefecture)
11
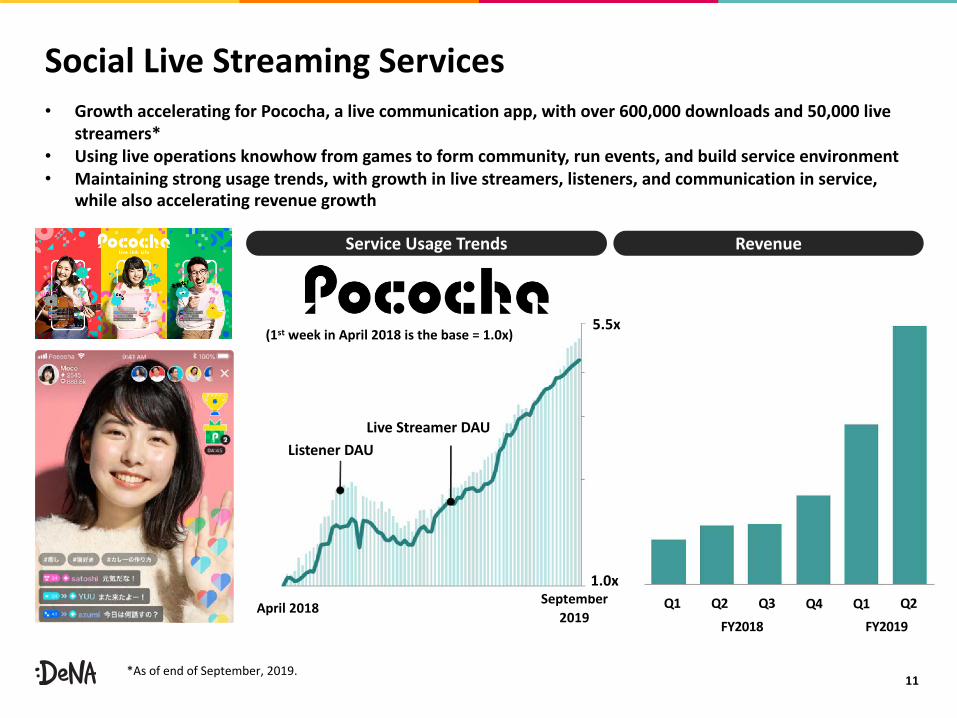
April 2018September
2019
RevenueService Usage Trends
Social Live Streaming Services• Growth accelerating for Pococha, a live communication app, with over 600,000 downloads and 50,000 live
streamers*• Using live operations knowhow from games to form community, run events, and build service environment• Maintaining strong usage trends, with growth in live streamers, listeners, and communication in service,
while also accelerating revenue growth
*As of end of September, 2019.
Live Streamer DAUListener DAU
(1st week in April 2018 is the base = 1.0x)
1.0x
5.5x
FY2018
Q1 Q2 Q3 Q4 Q1 Q2
FY2019
12
Reference Materialsl IFRS to Non-GAAP reconciliation
l Consolidated cash flows
l Consolidated financial position
l Segment breakdown
13
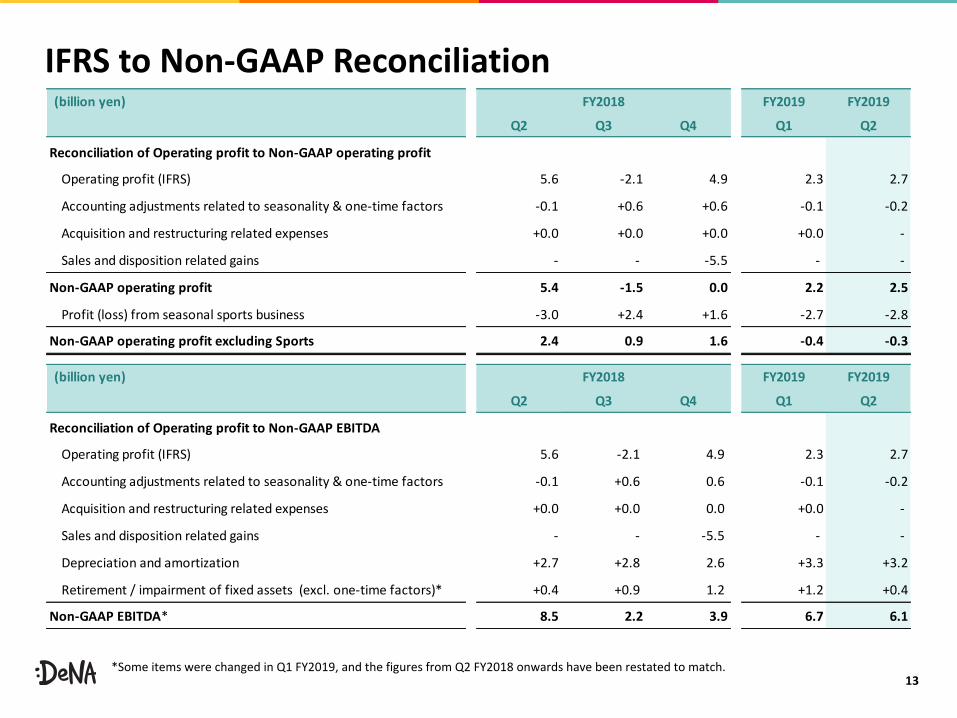
IFRS to Non-GAAP Reconciliation
*Some items were changed in Q1 FY2019, and the figures from Q2 FY2018 onwards have been restated to match.
(billion yen) FY2019 FY2019
Q2 Q3 Q4 Q1 Q2
Reconciliation of Operating profit to Non-GAAP operating profit
Operating profit (IFRS) 5.6 -2.1 4.9 2.3 2.7
Accounting adjustments related to seasonality & one-time factors -0.1 +0.6 +0.6 -0.1 -0.2
Acquisition and restructuring related expenses +0.0 +0.0 +0.0 +0.0 -
Sales and disposition related gains - - -5.5 - -
Non-GAAP operating profit 5.4 -1.5 0.0 2.2 2.5
Profit (loss) from seasonal sports business -3.0 +2.4 +1.6 -2.7 -2.8
Non-GAAP operating profit excluding Sports 2.4 0.9 1.6 -0.4 -0.3
(billion yen) FY2019 FY2019
Q2 Q3 Q4 Q1 Q2
Reconciliation of Operating profit to Non-GAAP EBITDA
Operating profit (IFRS) 5.6 -2.1 4.9 2.3 2.7
Accounting adjustments related to seasonality & one-time factors -0.1 +0.6 0.6 -0.1 -0.2
Acquisition and restructuring related expenses +0.0 +0.0 0.0 +0.0 -
Sales and disposition related gains - - -5.5 - -
Depreciation and amortization +2.7 +2.8 2.6 +3.3 +3.2
Retirement / impairment of fixed assets (excl. one-time factors)* +0.4 +0.9 1.2 +1.2 +0.4
Non-GAAP EBITDA* 8.5 2.2 3.9 6.7 6.1
FY2018
FY2018
14
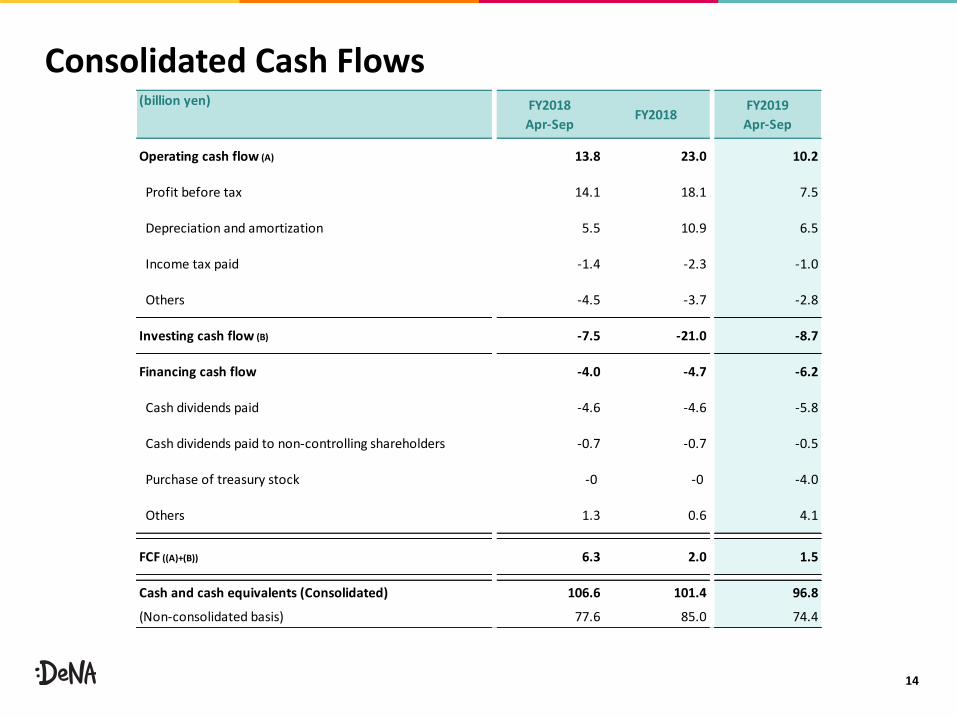
Consolidated Cash Flows(billion yen) FY2018
Apr-SepFY2018
FY2019Apr-Sep
Operating cash flow (A) 13.8 23.0 10.2
Profit before tax 14.1 18.1 7.5
Depreciation and amortization 5.5 10.9 6.5
Income tax paid -1.4 -2.3 -1.0
Others -4.5 -3.7 -2.8
Investing cash flow (B) -7.5 -21.0 -8.7
Financing cash flow -4.0 -4.7 -6.2
Cash dividends paid -4.6 -4.6 -5.8
Cash dividends paid to non-controlling shareholders -0.7 -0.7 -0.5
Purchase of treasury stock -0 -0 -4.0
Others 1.3 0.6 4.1
FCF ((A)+(B)) 6.3 2.0 1.5
Cash and cash equivalents (Consolidated) 106.6 101.4 96.8
(Non-consolidated basis) 77.6 85.0 74.4
15
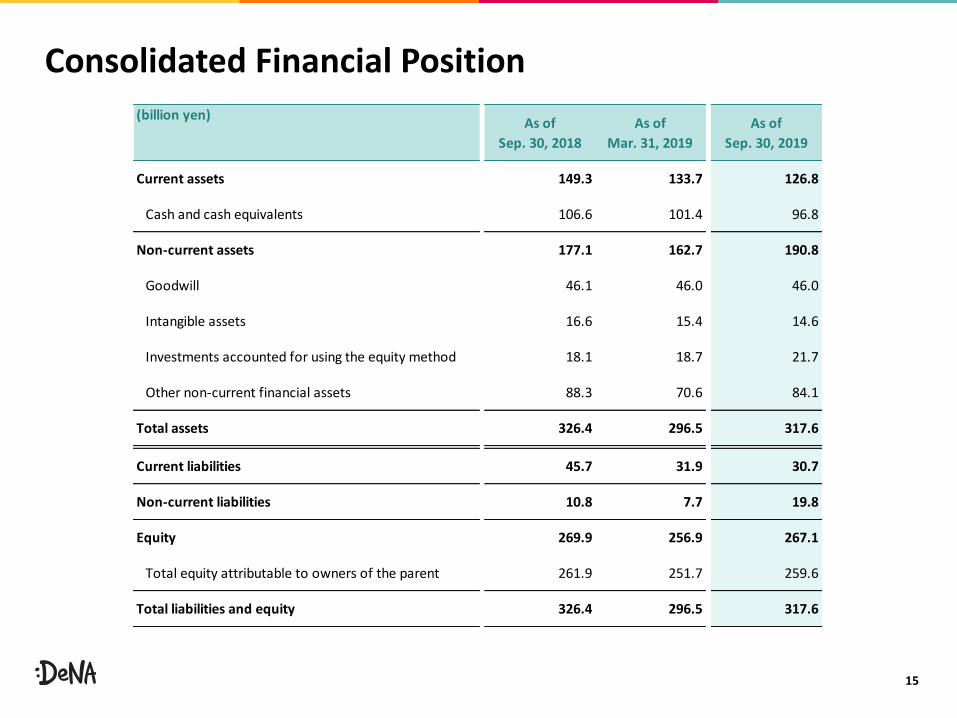
Consolidated Financial Position(billion yen) As of
Sep. 30, 2018As of
Mar. 31, 2019As of
Sep. 30, 2019
Current assets 149.3 133.7 126.8
Cash and cash equivalents 106.6 101.4 96.8
Non-current assets 177.1 162.7 190.8
Goodwill 46.1 46.0 46.0
Intangible assets 16.6 15.4 14.6
Investments accounted for using the equity method 18.1 18.7 21.7
Other non-current financial assets 88.3 70.6 84.1
Total assets 326.4 296.5 317.6
Current liabilities 45.7 31.9 30.7
Non-current liabilities 10.8 7.7 19.8
Equity 269.9 256.9 267.1
Total equity attributable to owners of the parent 261.9 251.7 259.6
Total liabilities and equity 326.4 296.5 317.6
16
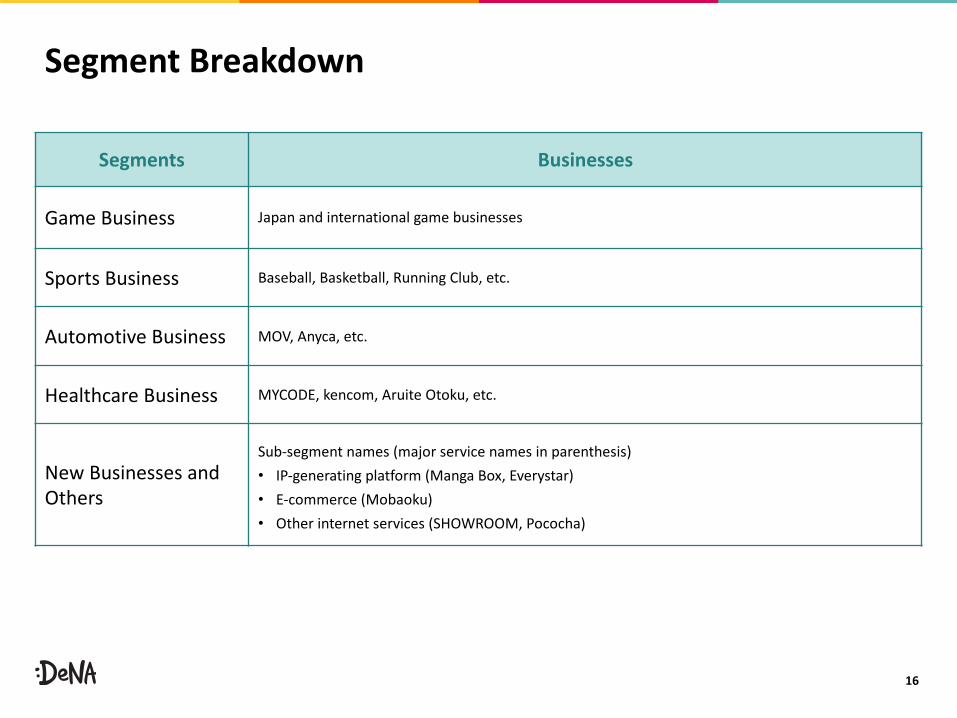
Segment Breakdown
Segments Businesses
Game Business Japan and international game businesses
Sports Business Baseball, Basketball, Running Club, etc.
Automotive Business MOV, Anyca, etc.
Healthcare Business MYCODE, kencom, Aruite Otoku, etc.
New Businesses and
Others
Sub-segment names (major service names in parenthesis)
• IP-generating platform (Manga Box, Everystar)
• E-commerce (Mobaoku)
• Other internet services (SHOWROOM, Pococha)
17
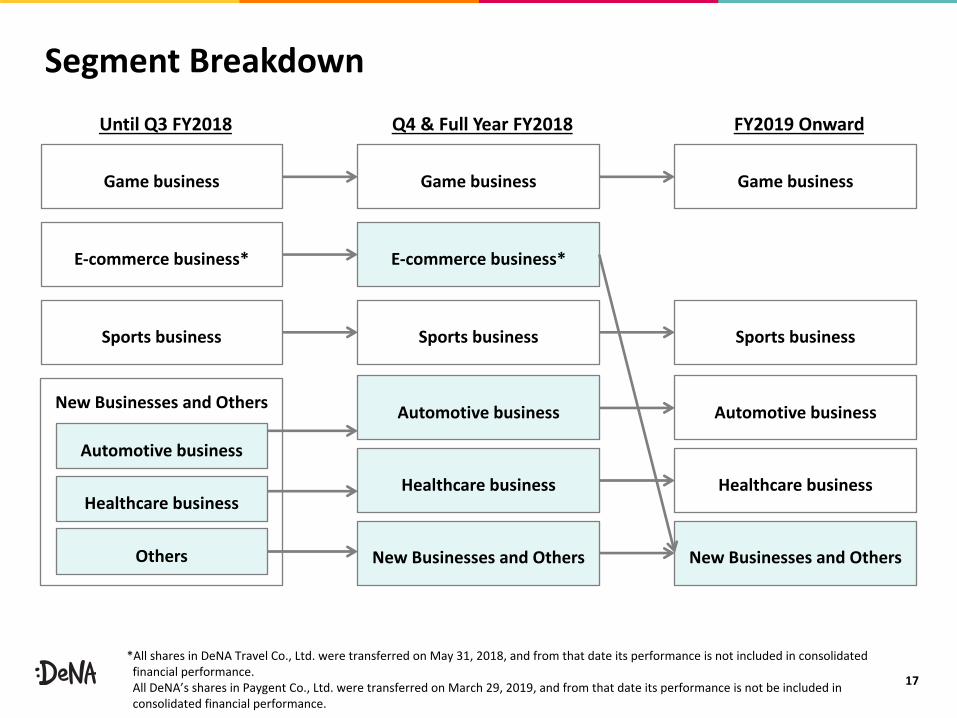
Segment Breakdown
Game business Game businessGame business
Automotive business
Healthcare business
New Businesses and Others
Q4 & Full Year FY2018
Automotive business
Healthcare business
New Businesses and Others
FY2019 Onward
New Businesses and Others
E-commerce business*E-commerce business*
Sports business Sports businessSports business
Until Q3 FY2018
Automotive business
Healthcare business
Others
*All shares in DeNA Travel Co., Ltd. were transferred on May 31, 2018, and from that date its performance is not included in consolidated financial performance. All DeNA’s shares in Paygent Co., Ltd. were transferred on March 29, 2019, and from that date its performance is not be included in consolidated financial performance.
18
The information and data contained within this presentation and these presentationmaterials have been determined based on information available as of November 6, 2019.The company disclaims any obligation to update or revise such information and data,whether as a result of new information, future events or otherwise.In addition, any forward-looking statements contained in this presentation or thesepresentation materials are based on our opinions and information available as ofNovember 6, 2019, and involve uncertainty. Please be aware that the actual performancedata and similar information are subject to influence from diverse factors and may differfrom the forecasts presented herein.
DeNA Co., Ltd.