financial results briefing for q2 of fy2019...financial results briefing for q2 of fy2019...
TRANSCRIPT
Financial results briefing for Q2 of FY2019
Initiatives to Secure Post-2020 Growth and Tackling Near Term Challenges
GMO Payment Gateway, Inc.
May 10, 2019
(Code: 3769; TSE-1st section) h t t p s : / / c o r p . g m o - p g . c o m / e n /
The 57 th IR Meeting
2Copyright (C) 1995 GMO Payment Gateway, Inc. All Rights Reserved.
A cautionary note about the contents of the document
The contents of this document are based on generally recognized economic and social conditions, as well as assumptions judged to be reasonable by GMO Payment Gateway as of May 10, 2019. However, please note that they are subject to change without prior notice in the event of changes in the business environment or other unforeseen occurrences.
3Copyright (C) 1995 GMO Payment Gateway, Inc. All Rights Reserved.
Agenda
1. Summary of financial results for Q2 FY2019
2. Future initiatives and growth strategy
3. Financial highlights
4. Reference materials
4Copyright (C) 1995 GMO Payment Gateway, Inc. All Rights Reserved.
1. Summary of financial results for Q2 of FY2019
5Copyright (C) 1995 GMO Payment Gateway, Inc. All Rights Reserved.
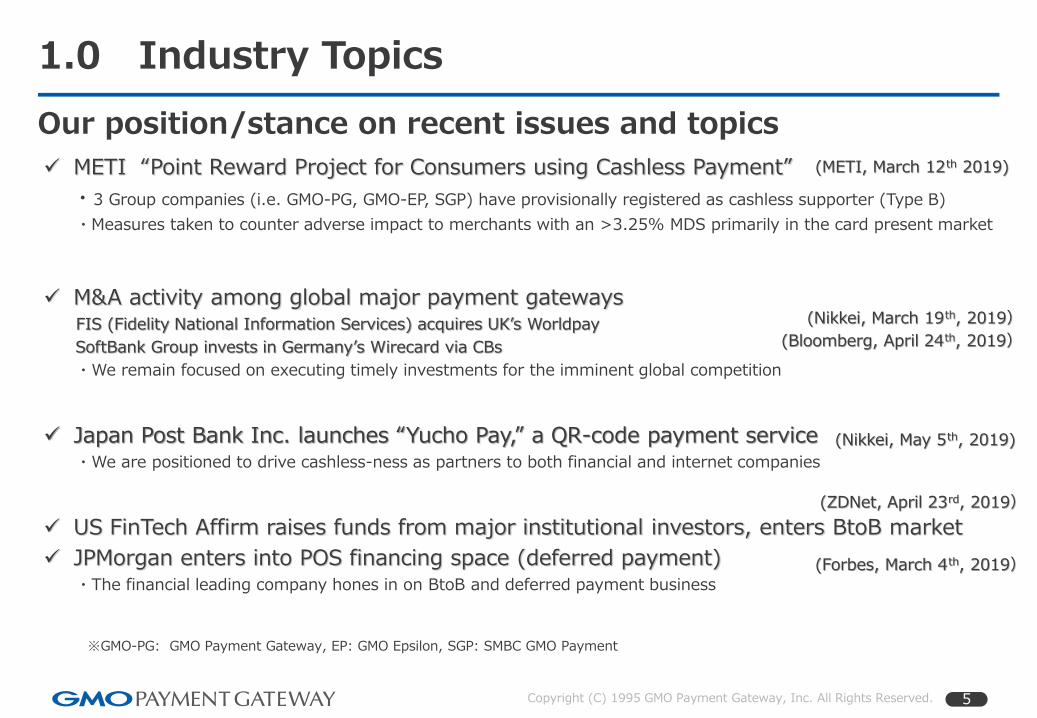
METI “Point Reward Project for Consumers using Cashless Payment”
・3 Group companies (i.e. GMO-PG, GMO-EP, SGP) have provisionally registered as cashless supporter (Type B)
・Measures taken to counter adverse impact to merchants with an >3.25% MDS primarily in the card present market
M&A activity among global major payment gatewaysFIS (Fidelity National Information Services) acquires UK’s Worldpay
SoftBank Group invests in Germany’s Wirecard via CBs
・We remain focused on executing timely investments for the imminent global competition
Japan Post Bank Inc. launches “Yucho Pay,” a QR-code payment service・We are positioned to drive cashless-ness as partners to both financial and internet companies
US FinTech Affirm raises funds from major institutional investors, enters BtoB market
JPMorgan enters into POS financing space (deferred payment)・The financial leading company hones in on BtoB and deferred payment business
1.0 Industry Topics
Our position/stance on recent issues and topics
(METI, March 12th 2019)
(Nikkei, March 19th, 2019)
(Bloomberg, April 24th, 2019)
(Nikkei, May 5th, 2019)
(ZDNet, April 23rd, 2019)
(Forbes, March 4th, 2019)
※GMO-PG: GMO Payment Gateway, EP: GMO Epsilon, SGP: SMBC GMO Payment
6Copyright (C) 1995 GMO Payment Gateway, Inc. All Rights Reserved.
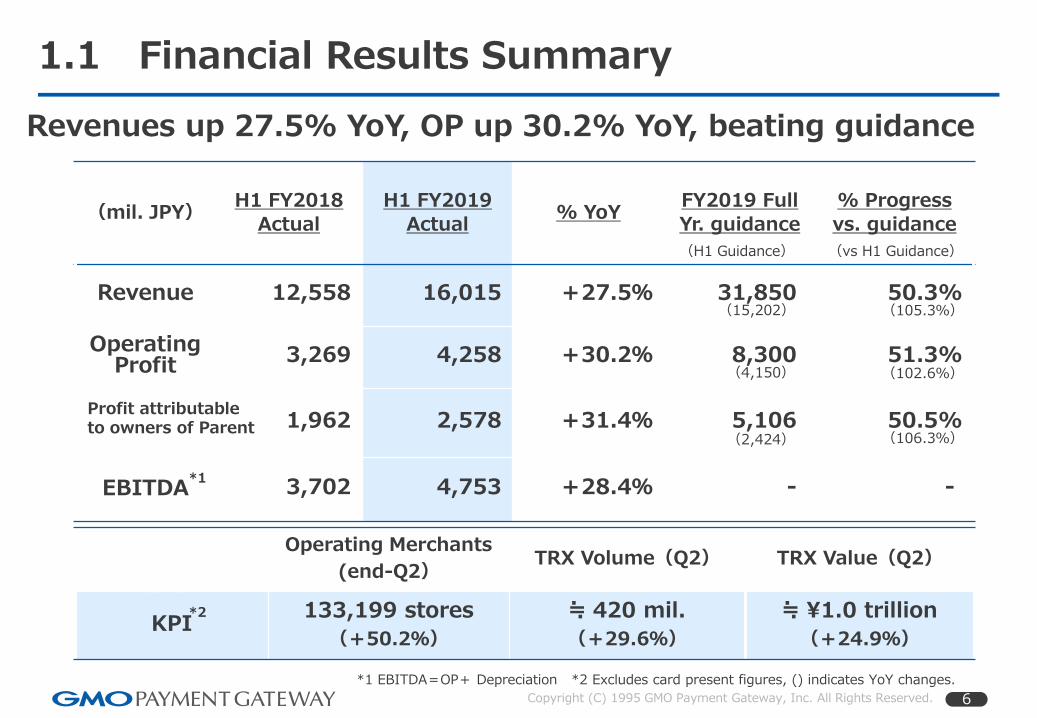
(mil. JPY)H1 FY2018
Actual
H1 FY2019
Actual% YoY
FY2019 Full
Yr. guidance
% Progress
vs. guidance
Revenue 12,558 16,015 +27.5% 31,850 50.3%
Operating Profit 3,269 4,258 +30.2% 8,300 51.3%
1,962 2,578 +31.4% 5,106 50.5%
EBITDA 3,702 4,753 +28.4% - -
1.1 Financial Results Summary
Operating Merchants
(end-Q2)TRX Volume(Q2) TRX Value(Q2)
KPI133,199 stores
(+50.2%)
≒ 420 mil.
(+29.6%)
≒ ¥1.0 trillion
(+24.9%)
*1 EBITDA=OP+ Depreciation *2 Excludes card present figures, () indicates YoY changes.
*2
(H1 Guidance) (vs H1 Guidance)
Revenues up 27.5% YoY, OP up 30.2% YoY, beating guidance
Profit attributableto owners of Parent
*1
(15,202)
(4,150)
(2,424)
(105.3%)
(102.6%)
(106.3%)

7Copyright (C) 1995 GMO Payment Gateway, Inc. All Rights Reserved.
1.2 Regarding Full year guidance and trend of micropayments
On track to achieve Full Year guidance despite various issues
2. TRX Volume (Q2) ≒ 420 million, up by 29.6% YoY
TRX Value (Q2) ≒ ¥1.0 trillion, up by 24.9% YoY
1. On track to achieve full year guidance
Factor 1: Increase in micropayments Smartphone payments and payment for digital contents etc.
Factor 2: Unfavorable comps given last term’s surge in payment relatedto cryptocurrency trading
Even after increasing provisions for bad loans and mainframe upgrade expenses
8Copyright (C) 1995 GMO Payment Gateway, Inc. All Rights Reserved.
0
2,000
4,000
6,000
8,000
10,000
12,000
14,000
16,000
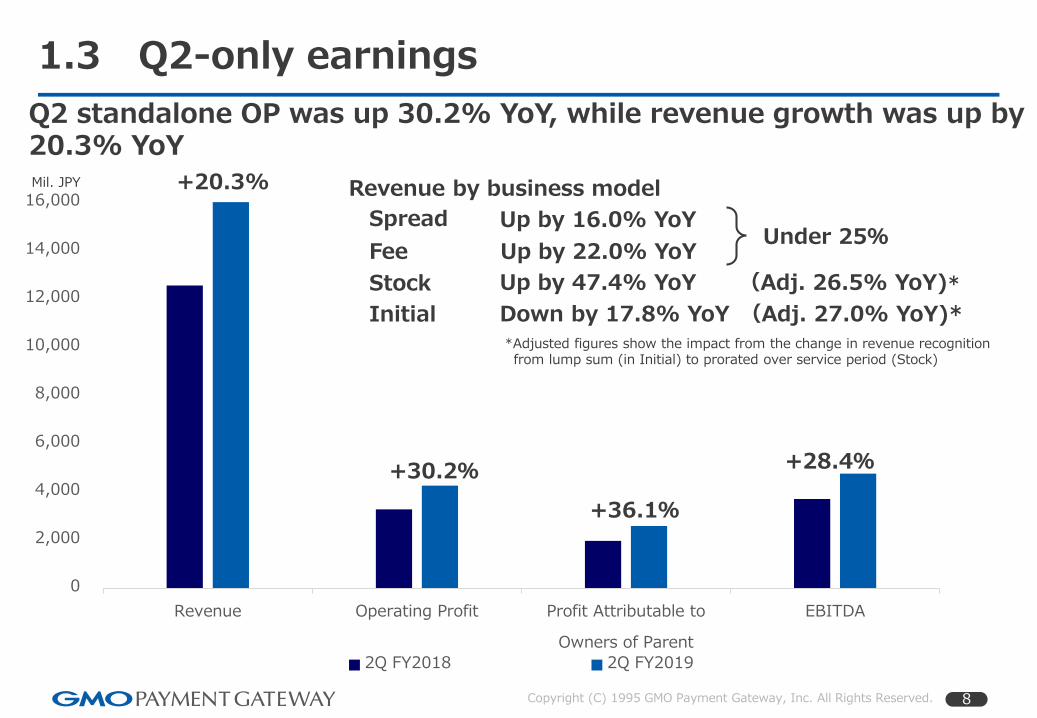
Revenue Operating Profit Profit Attributable to
Owners of Parent
EBITDA
2Q FY2018 2Q FY2019
*Adjusted figures show the impact from the change in revenue recognition from lump sum (in Initial) to prorated over service period (Stock)
1.3 Q2-only earnings
+30.2%
+36.1%
+20.3%
Q2 standalone OP was up 30.2% YoY, while revenue growth was up by 20.3% YoY
+28.4%
Mil. JPY
Spread
Fee
Stock
Initial
Up by 16.0% YoY
Up by 22.0% YoY
Up by 47.4% YoY (Adj. 26.5% YoY)*
Down by 17.8% YoY (Adj. 27.0% YoY)*
Under 25%
Revenue by business model
9Copyright (C) 1995 GMO Payment Gateway, Inc. All Rights Reserved.
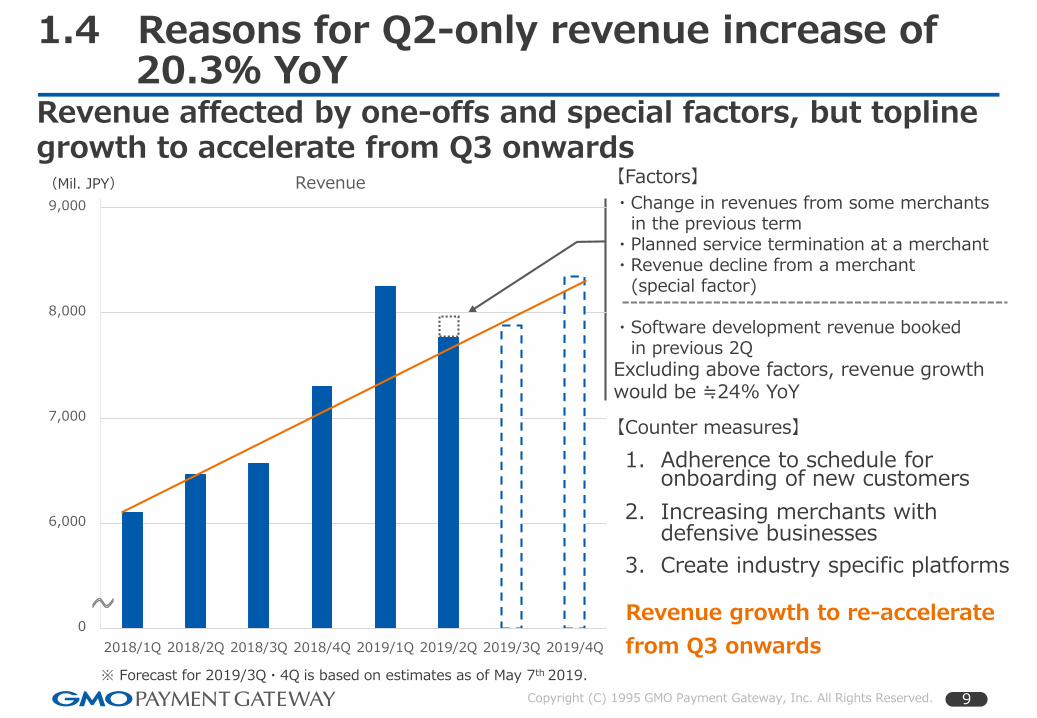
1.4 Reasons for Q2-only revenue increase of 20.3% YoY
Revenue affected by one-offs and special factors, but topline growth to accelerate from Q3 onwards
※ Forecast for 2019/3Q・4Q is based on estimates as of May 7th 2019.
(Mil. JPY)
・Change in revenues from some merchants in the previous term
・Planned service termination at a merchant・Revenue decline from a merchant
(special factor)
・Software development revenue bookedin previous 2Q
Excluding above factors, revenue growth would be ≒24% YoY
1. Adherence to schedule for onboarding of new customers
2. Increasing merchants with defensive businesses
3. Create industry specific platforms
【Factors】
【Counter measures】
Revenue growth to re-accelerate
from Q3 onwards5,000
6,000
7,000
8,000
9,000
2018/1Q 2018/2Q 2018/3Q 2018/4Q 2019/1Q 2019/2Q 2019/3Q 2019/4Q
Revenue
10Copyright (C) 1995 GMO Payment Gateway, Inc. All Rights Reserved.
2. Future Initiatives and Growth Strategy
11Copyright (C) 1995 GMO Payment Gateway, Inc. All Rights Reserved.
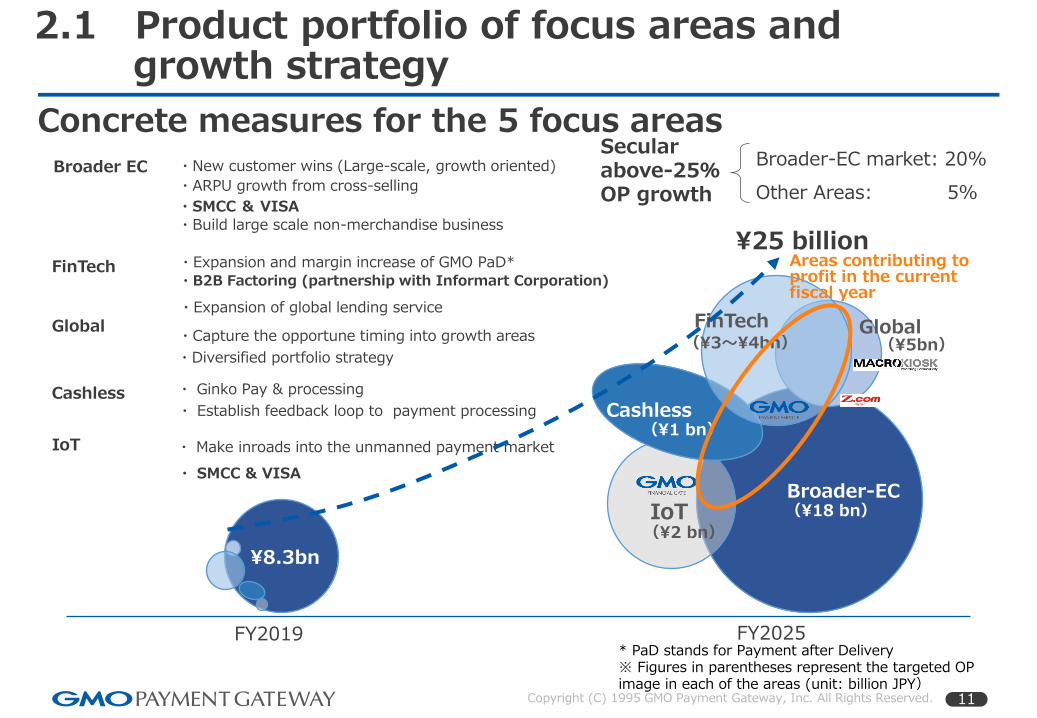
2.1 Product portfolio of focus areas andgrowth strategy
EC(180)
Areas contributing to profit in the current fiscal year
Broader-EC
Cashless
FinTech
IoT
Global
(¥2 bn)
(¥18 bn)
(¥5bn)
(¥1 bn)
(¥3~¥4bn)
Concrete measures for the 5 focus areas
Broader EC
Cashless
FinTech
IoT
Global
FY2019 FY2025
・New customer wins (Large-scale, growth oriented)
・ARPU growth from cross-selling
・SMCC & VISA・Build large scale non-merchandise business
* PaD stands for Payment after Delivery※ Figures in parentheses represent the targeted OP image in each of the areas (unit: billion JPY)
・Expansion and margin increase of GMO PaD* ・B2B Factoring (partnership with Informart Corporation)
・Expansion of global lending service
・Capture the opportune timing into growth areas
・Diversified portfolio strategy
・ Ginko Pay & processing
・ Establish feedback loop to payment processing
・ Make inroads into the unmanned payment market
・ SMCC & VISA
¥8.3bn
¥25 billion
Broader-EC market: 20%
Other Areas: 5%
Secular above-25%OP growth
12Copyright (C) 1995 GMO Payment Gateway, Inc. All Rights Reserved.
ECBroader EC(¥18 bn)
(10)
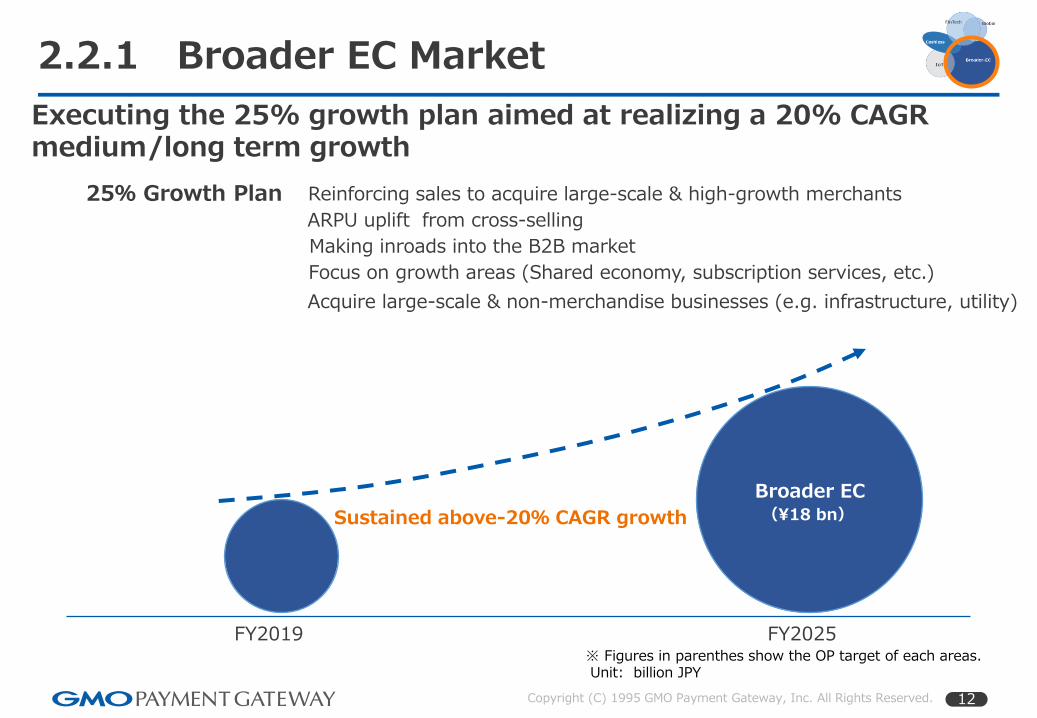
Executing the 25% growth plan aimed at realizing a 20% CAGR medium/long term growth
FY2019 FY2025※ Figures in parenthes show the OP target of each areas.Unit: billion JPY
Sustained above-20% CAGR growth
2.2.1 Broader EC Market
Reinforcing sales to acquire large-scale & high-growth merchants
ARPU uplift from cross-selling
Making inroads into the B2B market
Focus on growth areas (Shared economy, subscription services, etc.)
25% Growth Plan
Acquire large-scale & non-merchandise businesses (e.g. infrastructure, utility)
13Copyright (C) 1995 GMO Payment Gateway, Inc. All Rights Reserved.
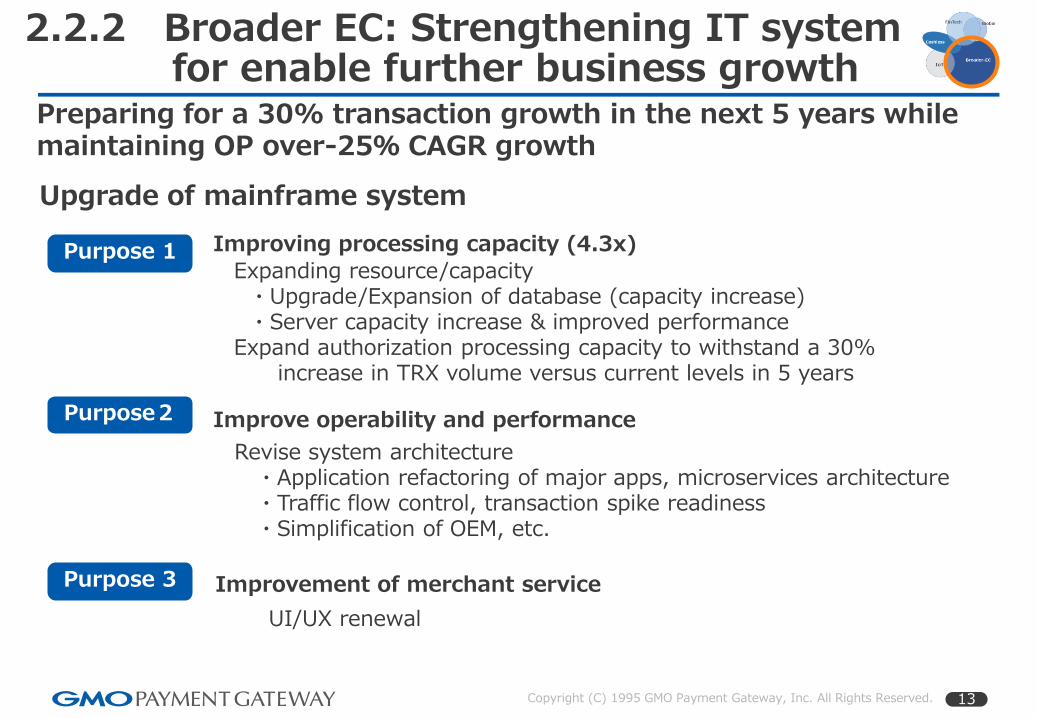
2.2.2 Broader EC: Strengthening IT systemfor enable further business growth
Preparing for a 30% transaction growth in the next 5 years while maintaining OP over-25% CAGR growth
Upgrade of mainframe system
Improving processing capacity (4.3x)
Expanding resource/capacity・Upgrade/Expansion of database (capacity increase)・Server capacity increase & improved performance
Expand authorization processing capacity to withstand a 30%increase in TRX volume versus current levels in 5 years
Revise system architecture・Application refactoring of major apps, microservices architecture ・Traffic flow control, transaction spike readiness・Simplification of OEM, etc.
Improve operability and performance
Improvement of merchant service
UI/UX renewal
Purpose2
Purpose 3
Purpose 1
14Copyright (C) 1995 GMO Payment Gateway, Inc. All Rights Reserved.
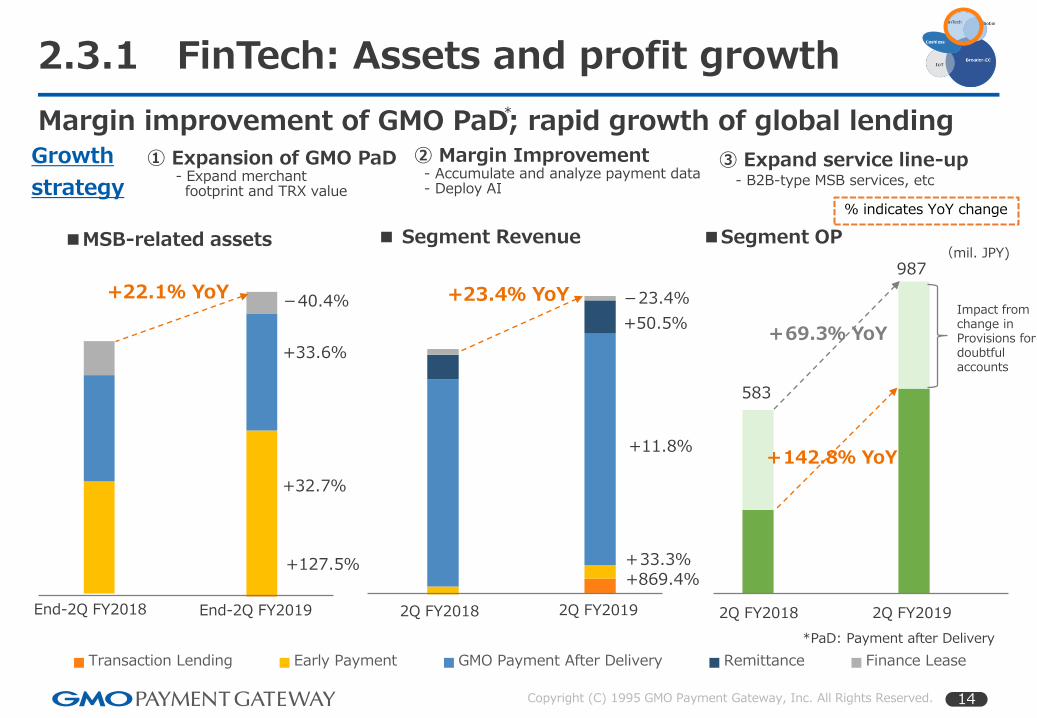
583
Transaction Lending Early Payment GMO Payment After Delivery Remittance Finance Lease
2Q FY2018 2Q FY2019
2.3.1 FinTech: Assets and profit growth
Margin improvement of GMO PaD; rapid growth of global lending
■MSB-related assets ■ Segment Revenue
+22.1% YoY +23.4% YoY
+869.4%
+11.8%
+50.5%
+33.3%
-23.4%
+127.5%
+32.7%
+33.6%
-40.4%
+142.8% YoY
■Segment OP
987(mil. JPY)
Impact from change in Provisions for doubtful accounts
End-2Q FY2018 End-2Q FY2019 2Q FY2018 2Q FY2019
*PaD: Payment after Delivery
Growth
strategy
① Expansion of GMO PaD- Expand merchantfootprint and TRX value
② Margin Improvement- Accumulate and analyze payment data- Deploy AI
③ Expand service line-up- B2B-type MSB services, etc
% indicates YoY change
+69.3% YoY
*
15Copyright (C) 1995 GMO Payment Gateway, Inc. All Rights Reserved.
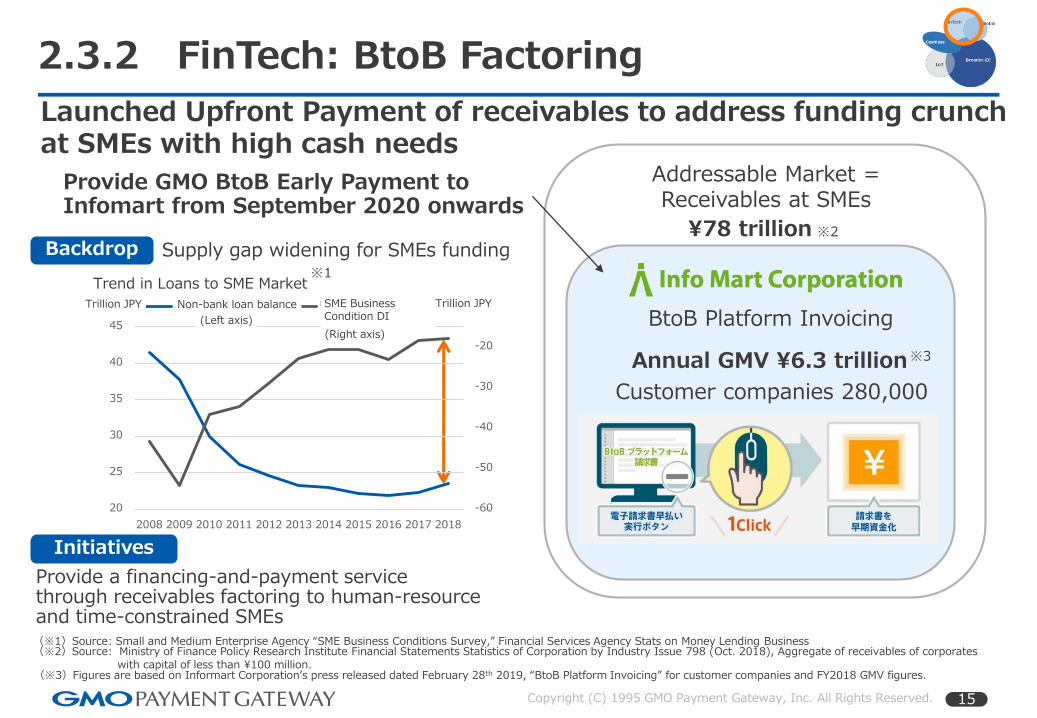
2.3.2 FinTech: BtoB Factoring
Launched Upfront Payment of receivables to address funding crunch at SMEs with high cash needs
Addressable Market = Receivables at SMEs
¥78 trillion ※2
BtoB Platform Invoicing
Customer companies 280,000
Annual GMV ¥6.3 trillion
Provide GMO BtoB Early Payment to Infomart from September 2020 onwards
(兆円)
Backdrop: Supply gap widening for SMEs funding
Provide a financing-and-payment service through receivables factoring to human-resource and time-constrained SMEs
(左軸) (右軸)
(※3)Figures are based on Informart Corporation’s press released dated February 28th 2019, “BtoB Platform Invoicing” for customer companies and FY2018 GMV figures.
(※2)Source: Ministry of Finance Policy Research Institute Financial Statements Statistics of Corporation by Industry Issue 798 (Oct. 2018), Aggregate of receivables of corporateswith capital of less than ¥100 million.
(※1)Source: Small and Medium Enterprise Agency “SME Business Conditions Survey,” Financial Services Agency Stats on Money Lending Business
※1Trend in Loans to SME Market
(兆円)
-60
-50
-40
-30
-20
20
25
30
35
40
45
2008 2009 2010 2011 2012 2013 2014 2015 2016 2017 2018
ノンバンク貸出残高 中小企業業況判断DINon-bank loan balance
(Left axis)
(Right axis)
SME Business Condition DI
Trillion JPY Trillion JPY
Backdrop
Initiatives
※3
16Copyright (C) 1995 GMO Payment Gateway, Inc. All Rights Reserved.
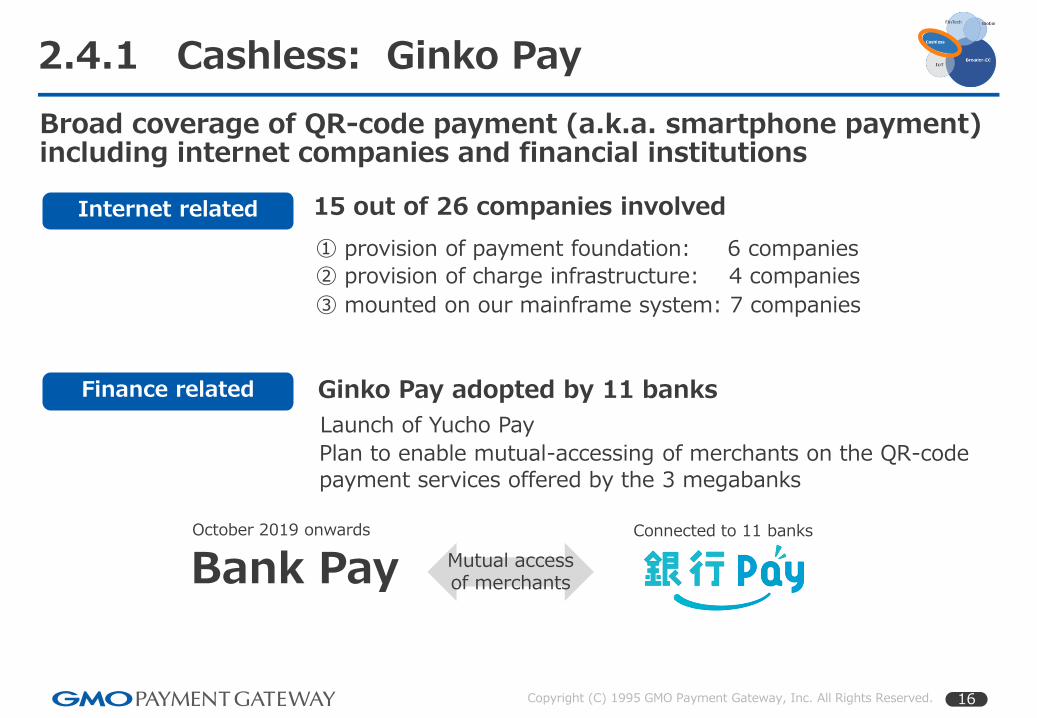
2.4.1 Cashless: Ginko Pay
Broad coverage of QR-code payment (a.k.a. smartphone payment) including internet companies and financial institutions
15 out of 26 companies involved
① provision of payment foundation: 6 companies
② provision of charge infrastructure: 4 companies
③ mounted on our mainframe system: 7 companies
Ginko Pay adopted by 11 banks
Bank Pay Mutual access of merchants
October 2019 onwards Connected to 11 banks
Plan to enable mutual-accessing of merchants on the QR-code payment services offered by the 3 megabanks
Launch of Yucho Pay
Internet related
Finance related
17Copyright (C) 1995 GMO Payment Gateway, Inc. All Rights Reserved.
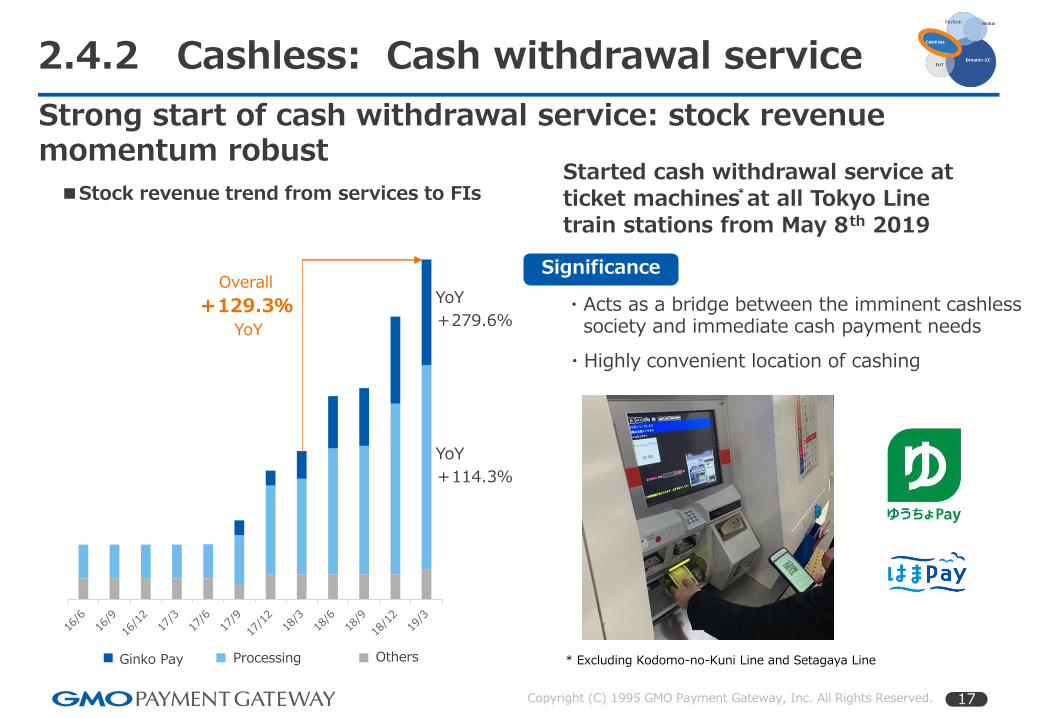
2.4.2 Cashless: Cash withdrawal service
Strong start of cash withdrawal service: stock revenue momentum robust
・Highly convenient location of cashing
Started cash withdrawal service at ticket machines at all Tokyo Line
train stations from May 8th 2019
* Excluding Kodomo-no-Kuni Line and Setagaya Line
*
銀行Pay プロセシング その他
Overall
+129.3%YoY
■Stock revenue trend from services to FIs
YoY
+279.6%
YoY
+114.3%
Ginko Pay Processing Others
Significance
・Acts as a bridge between the imminent cashless society and immediate cash payment needs
18Copyright (C) 1995 GMO Payment Gateway, Inc. All Rights Reserved.
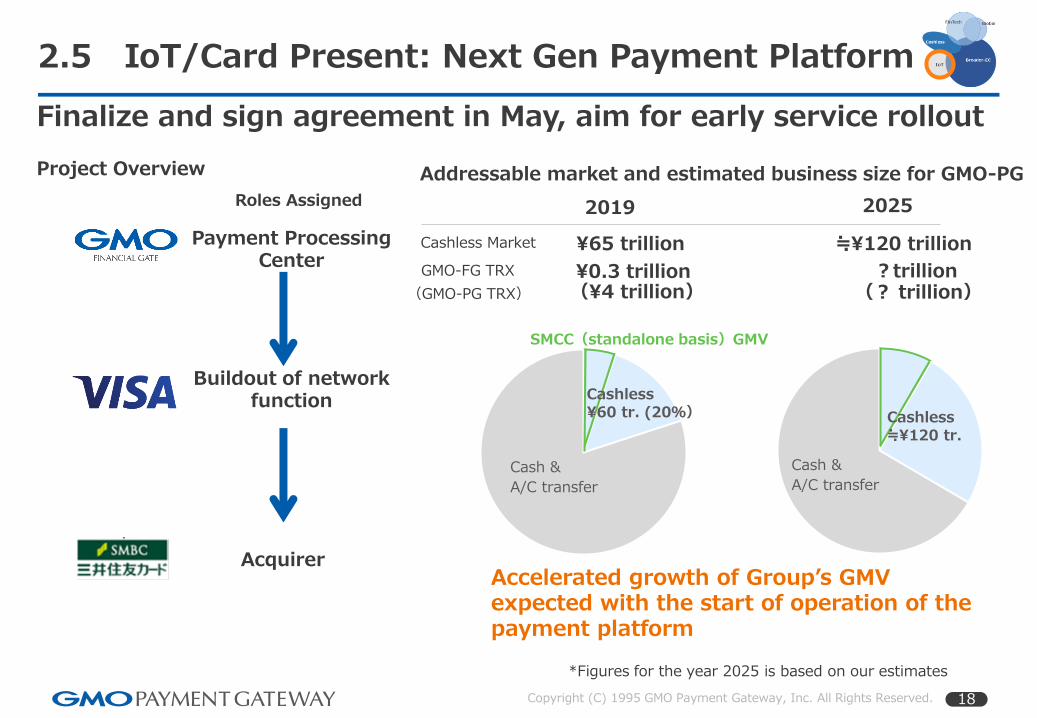
2.5 IoT/Card Present: Next Gen Payment Platform
Finalize and sign agreement in May, aim for early service rollout
Payment Processing Center
Buildout of networkfunction
Acquirer
Roles Assigned
¥65 trillion ≒¥120 trillion
2019 2025
Project Overview Addressable market and estimated business size for GMO-PG
¥0.3 trillion ?trillion
Cashless Market
GMO-FG TRX
Cashless¥60 tr. (20%)
SMCC(standalone basis)GMV
Cashless≒¥120 tr.
Cash &
A/C transfer
*Figures for the year 2025 is based on our estimates
(¥4 trillion) (? trillion)(GMO-PG TRX)
Accelerated growth of Group’s GMV expected with the start of operation of the payment platform
Cash &
A/C transfer
19Copyright (C) 1995 GMO Payment Gateway, Inc. All Rights Reserved.
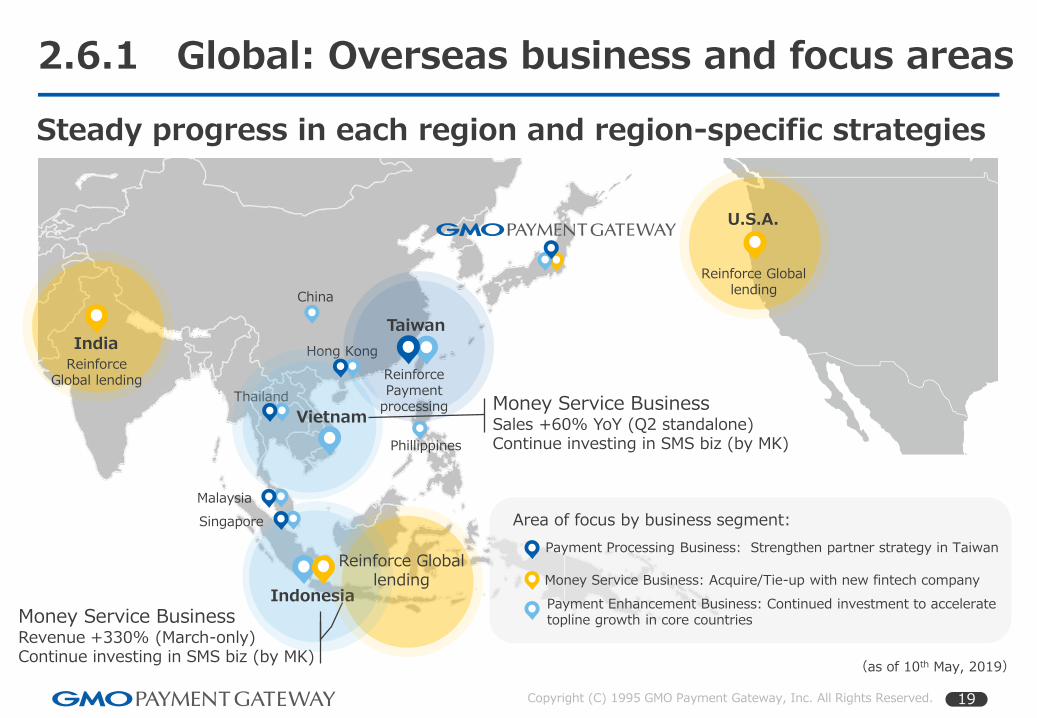
Money Service BusinessRevenue +330% (March-only)Continue investing in SMS biz (by MK)
2.6.1 Global: Overseas business and focus areas
Steady progress in each region and region-specific strategies
(as of 10th May, 2019)
China
Hong Kong
Phillippines
Thailand
Malaysia
Singapore
Payment Processing Business: Strengthen partner strategy in Taiwan
Payment Enhancement Business: Continued investment to accelerate topline growth in core countries
Money Service Business: Acquire/Tie-up with new fintech company
India
Indonesia
U.S.A.
Taiwan
Vietnam
Reinforce Payment
processing
Reinforce Global lending
Reinforce Global lending
Area of focus by business segment:
Money Service Business Sales +60% YoY (Q2 standalone)Continue investing in SMS biz (by MK)
Reinforce Global lending
20Copyright (C) 1995 GMO Payment Gateway, Inc. All Rights Reserved.
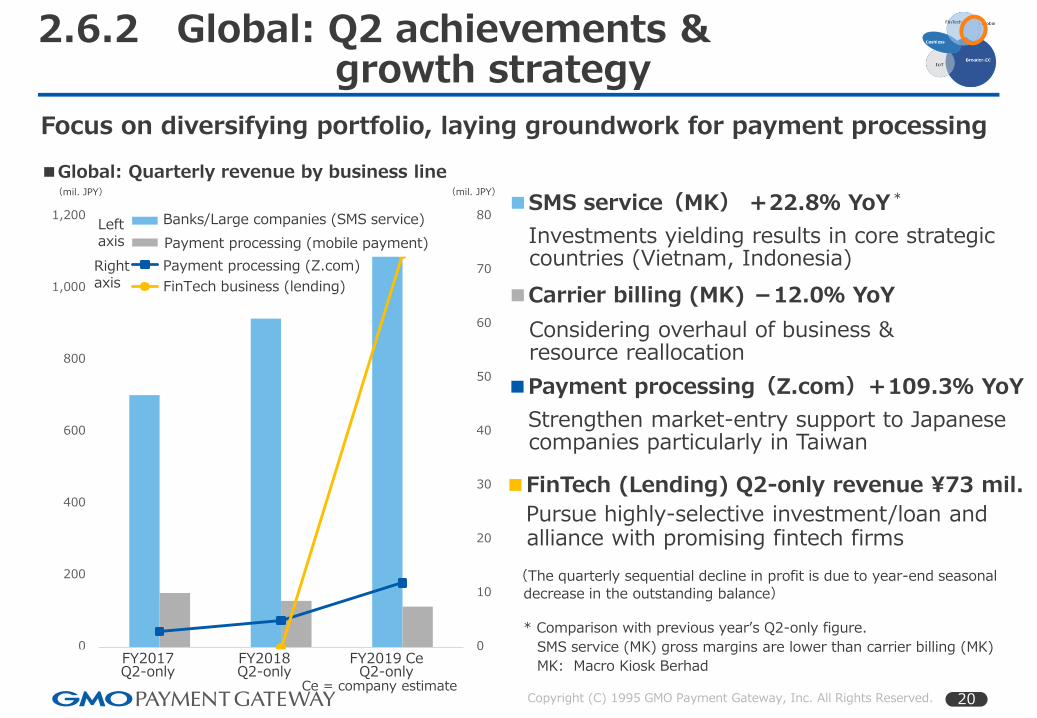
■FinTech (Lending) Q2-only revenue ¥73 mil.
Pursue highly-selective investment/loan andalliance with promising fintech firms
2.6.2 Global: Q2 achievements & growth strategy
Focus on diversifying portfolio, laying groundwork for payment processing
(mil. JPY)
■Global: Quarterly revenue by business line(mil. JPY)
■SMS service(MK) +22.8% YoY
Investments yielding results in core strategiccountries (Vietnam, Indonesia)
■Payment processing(Z.com)+109.3% YoY
Strengthen market-entry support to Japanesecompanies particularly in Taiwan
■Carrier billing (MK) -12.0% YoY
Considering overhaul of business & resource reallocation
* Comparison with previous year’s Q2-only figure.
SMS service (MK) gross margins are lower than carrier billing (MK)
MK: Macro Kiosk Berhad
Left axis
Right axis
0
10
20
30
40
50
60
70
80
0
200
400
600
800
1,000
1,200
17/3 18/3 19/3
銀行/大企業ビジネス(SMSサービス)
決済代行ビジネス(モバイル決済)
決済代行ビジネス(Z.com)
FinTechビジネス(レンディング)
FY2017 Q2-only
FY2019 Ce Q2-only
FY2018 Q2-only
Banks/Large companies (SMS service)
Payment processing (Z.com)
Payment processing (mobile payment)
FinTech business (lending)
Ce = company estimate
(The quarterly sequential decline in profit is due to year-end seasonal
decrease in the outstanding balance)
*
21Copyright (C) 1995 GMO Payment Gateway, Inc. All Rights Reserved.
3. Financial Highlights
22Copyright (C) 1995 GMO Payment Gateway, Inc. All Rights Reserved.
127 182
108 147 105 142 127 150 142 161 151 185
343
457
237327
251388
298
563
393319
464 483 501 499 516 528 565 594 663 728 748
786 875 906 929 980
795832
893 923
1,184 1,226
468 496 501 512 532 601 612 630
667 724 749 794
1,026
1,8091,895
2,004
2,3602,436
2,705
2,861
3,072
2,971
584 680 713 733
804
931 959
1,227 1,259
1,383 1,441
1,527
2,101
2,471
2,6532,773 2,691
2,801
2,666
2,946
3,595
3,250
0
500
1,000
1,500
2,000
2,500
3,000
3,500
14/1Q 14/2Q 14/3Q 14/4Q 15/1Q 15/2Q 15/3Q 15/4Q 16/1Q 16/2Q 16/3Q 16/4Q 17/1Q 17/2Q 17/3Q 17/4Q 18/1Q 18/2Q 18/3Q 18/4Q 19/1Q 19/2Q
Initial Stock Fee Spread
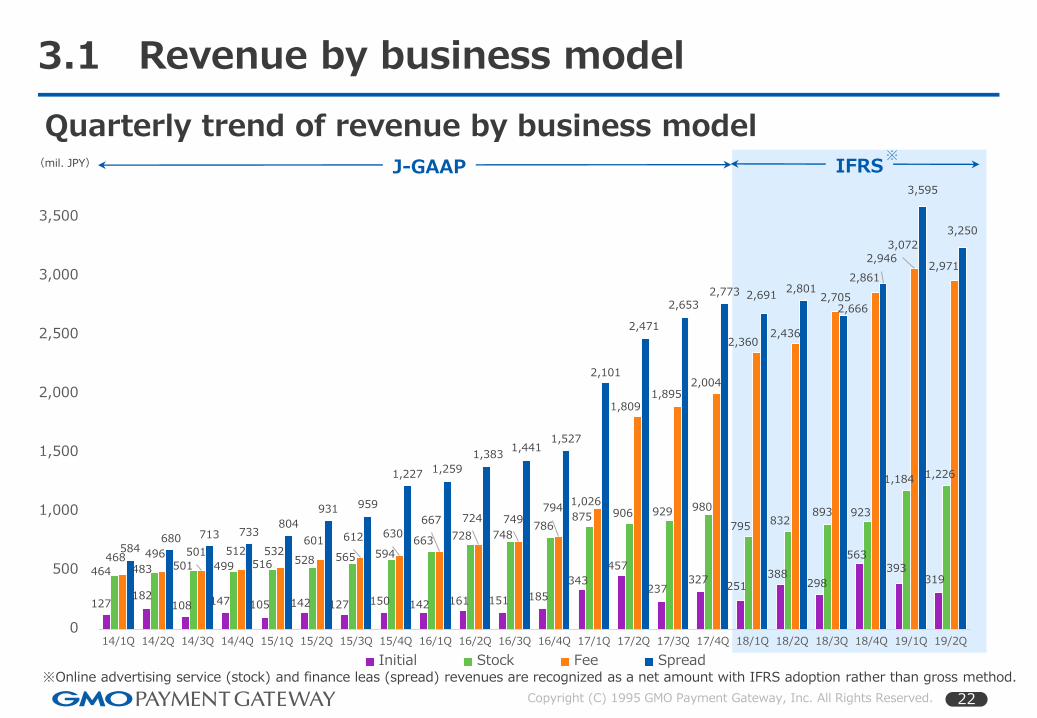
3.1 Revenue by business model
Quarterly trend of revenue by business model(mil. JPY)
※Online advertising service (stock) and finance leas (spread) revenues are recognized as a net amount with IFRS adoption rather than gross method.
J-GAAP IFRS※
23Copyright (C) 1995 GMO Payment Gateway, Inc. All Rights Reserved.
Net Asset
63,569
MSB-relatedOther
(o.w., Provision for doubtful accounts-2,113)
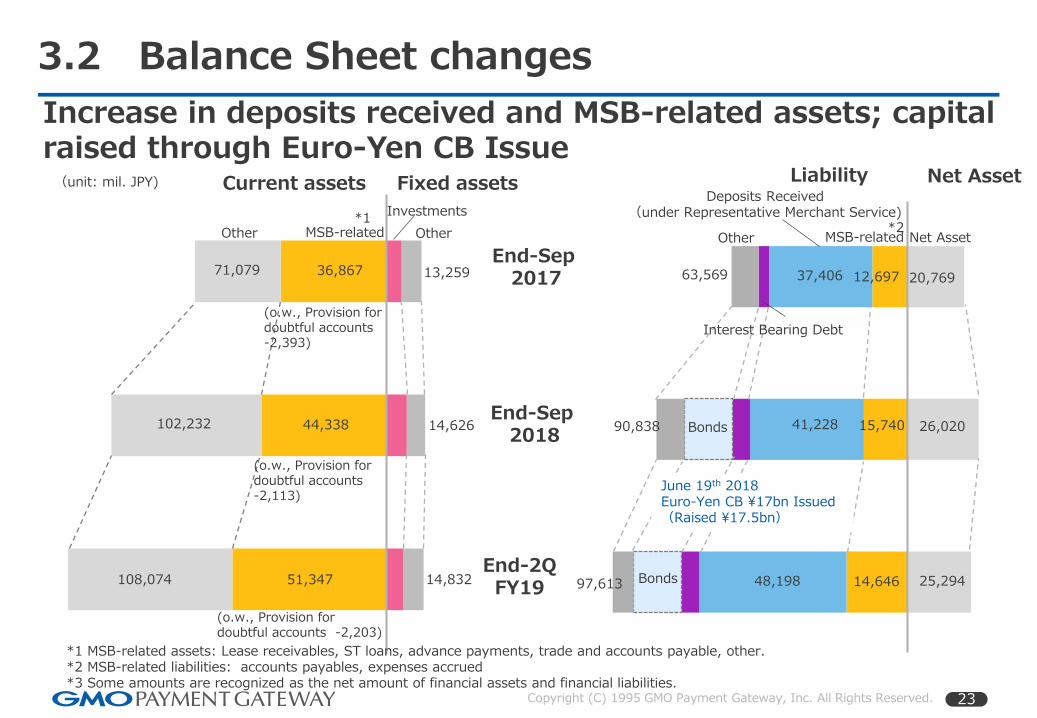
Increase in deposits received and MSB-related assets; capital raised through Euro-Yen CB Issue
3.2 Balance Sheet changes
End-2Q FY19
End-Sep 2017
Liability Net Asset
InvestmentsDeposits Received
(under Representative Merchant Service)
MSB-related
71,079
102,232
13,259
14,626 90,838
20,769
26,020
*1 MSB-related assets: Lease receivables, ST loans, advance payments, trade and accounts payable, other.*2 MSB-related liabilities: accounts payables, expenses accrued*3 Some amounts are recognized as the net amount of financial assets and financial liabilities.
(o.w., Provision for doubtful accounts-2,393)
Other Other
36,867
51,347
(unit: mil. JPY)
37,406
41,228
12,697
15,740
*2*1
Bonds
108,074 14,832
44,338
(o.w., Provision fordoubtful accounts -2,203)
97,613 25,29448,198 14,646
June 19th 2018Euro-Yen CB ¥17bn Issued(Raised ¥17.5bn)
Interest Bearing Debt
Current assets Fixed assets
End-Sep 2018
Bonds
24Copyright (C) 1995 GMO Payment Gateway, Inc. All Rights Reserved.
0
5,000
10,000
15,000
20,000
25,000
30,000
35,000
40,000
0
20,000
40,000
60,000
80,000
100,000
120,000
12/12 13/3 13/6 13/9 13/12 14/3 14/6 14/9 14/12 15/3 15/6 15/9 15/12 16/3 16/6 16/9 16/12 17/3 17/6 17/9 17/12 18/3 18/6 18/9 18/12 19/3
Recurring Billing Online TRX Volume Operating Merchants
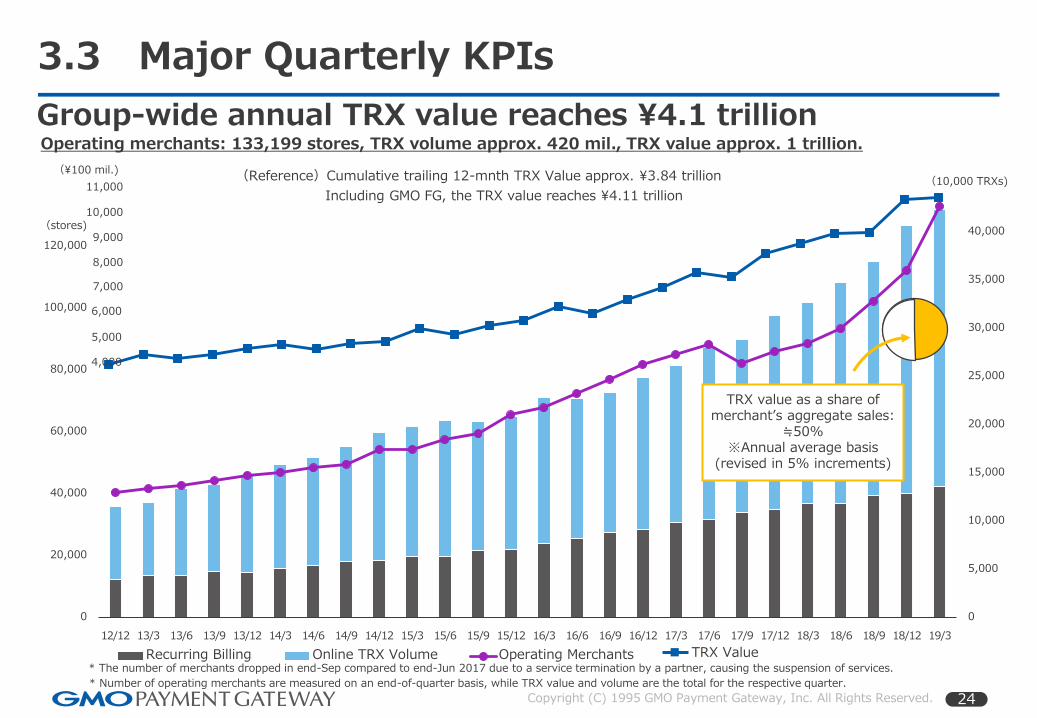
Operating merchants: 133,199 stores, TRX volume approx. 420 mil., TRX value approx. 1 trillion.
3.3 Major Quarterly KPIs
Group-wide annual TRX value reaches ¥4.1 trillion
TRX Value
(Reference)Cumulative trailing 12-mnth TRX Value approx. ¥3.84 trillion
Including GMO FG, the TRX value reaches ¥4.11 trillion(10,000 TRXs)
(stores)
* The number of merchants dropped in end-Sep compared to end-Jun 2017 due to a service termination by a partner, causing the suspension of services.
* Number of operating merchants are measured on an end-of-quarter basis, while TRX value and volume are the total for the respective quarter.
TRX value as a share of merchant’s aggregate sales:
≒50%※Annual average basis
(revised in 5% increments)
(¥100 mil.)
8,000
5,000
4,000
10,000
9,000
7,000
6,000
11,000
25Copyright (C) 1995 GMO Payment Gateway, Inc. All Rights Reserved.
4. Reference materials
26Copyright (C) 1995 GMO Payment Gateway, Inc. All Rights Reserved.
0
2,000
4,000
6,000
8,000
10,000
12,000
14,000
16,000
Revenue Operating Profit Profit Attributable to
Owners of Parent
EBITDA
2Q FY2018 2Q FY2019
4.1 Factors affecting earnings for cumulative 2Q period
+30.2%
+31.4%
+27.5%
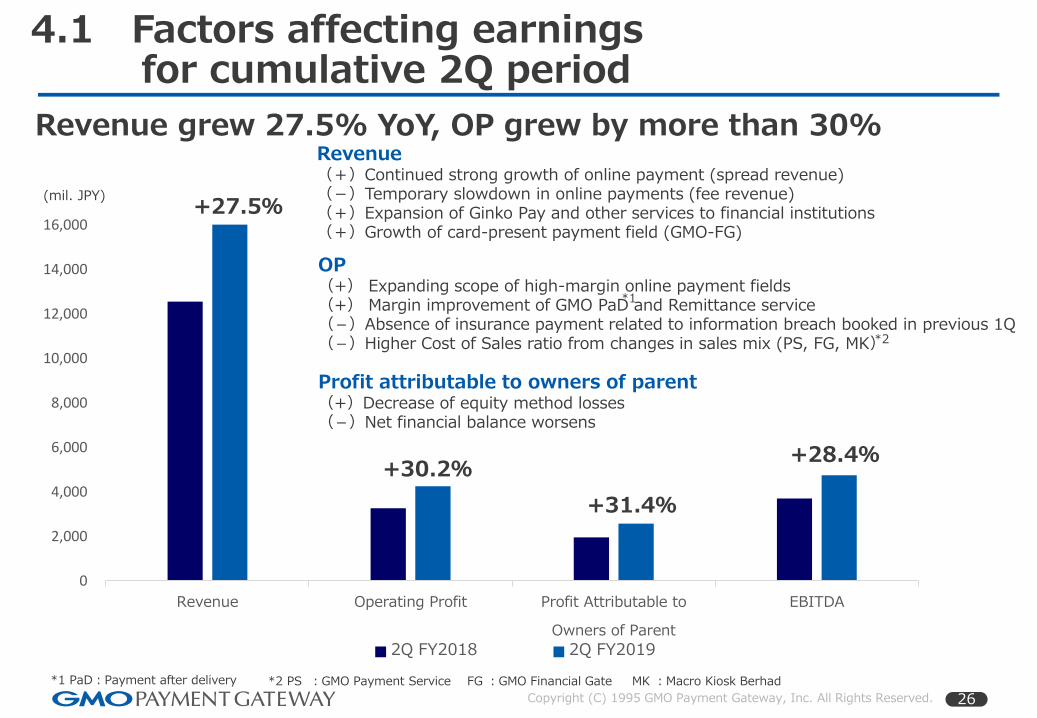
Revenue grew 27.5% YoY, OP grew by more than 30%
+28.4%
Revenue(+)Continued strong growth of online payment (spread revenue)(-)Temporary slowdown in online payments (fee revenue)(+)Expansion of Ginko Pay and other services to financial institutions(+)Growth of card-present payment field (GMO-FG)
OP(+) Expanding scope of high-margin online payment fields (+) Margin improvement of GMO PaD and Remittance service(-)Absence of insurance payment related to information breach booked in previous 1Q(-)Higher Cost of Sales ratio from changes in sales mix (PS, FG, MK)
*1
*2
Profit attributable to owners of parent (+)Decrease of equity method losses(-)Net financial balance worsens
*2 PS :GMO Payment Service FG :GMO Financial Gate MK :Macro Kiosk Berhad*1 PaD:Payment after delivery
(mil. JPY)
27Copyright (C) 1995 GMO Payment Gateway, Inc. All Rights Reserved.
3,855
4,724583
987
22
-31
(100)
900
1,900
2,900
3,900
4,900
5,900
(mil. JPY)
Payment Enhancement Business Money Service Business (MSB)
Payment Processing Business
6,960
9,2723,106
3,8332,491
2,909
0
2,000
4,000
6,000
8,000
10,000
12,000
14,000
16,000
18,000(mil. JPY)
Payment Enhancement Business Money Service Business (MSB)
Payment Processing Business
・Secular growth of online payment
・Profit expansion of Ginko Pay・Contribution of bulk sales of
terminals
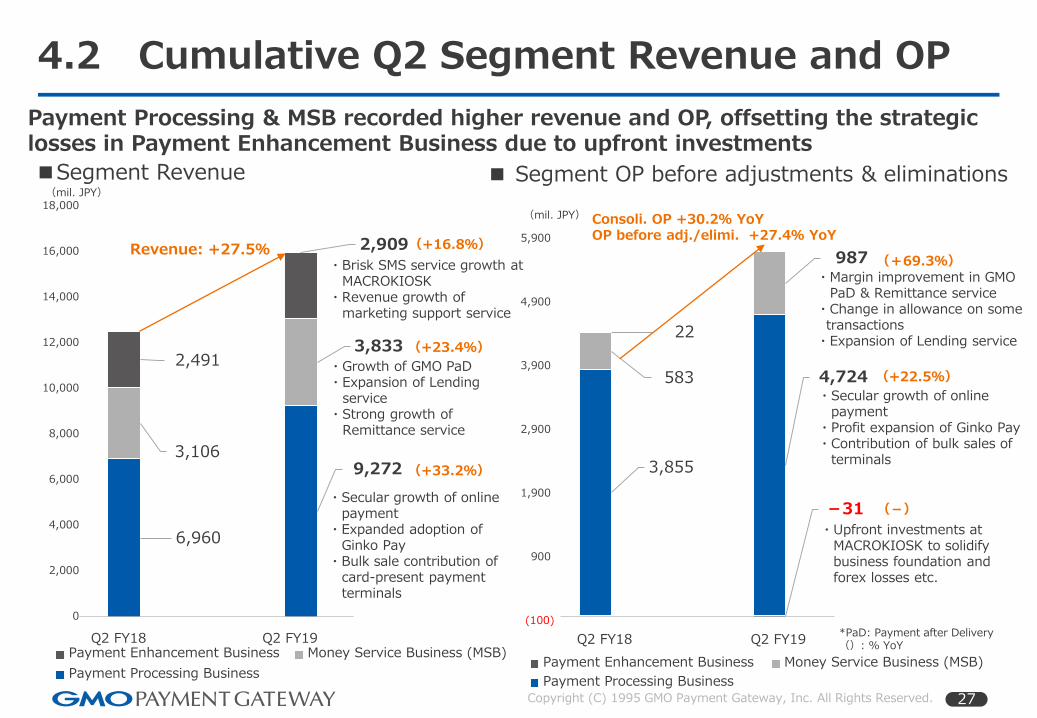
4.2 Cumulative Q2 Segment Revenue and OP
*PaD: Payment after Delivery(): % YoY
■ Segment OP before adjustments & eliminations■Segment Revenue
(+33.2%)
(+23.4%)
(+16.8%)
(+69.3%)
(-)
(+22.5%)
・Margin improvement in GMO PaD & Remittance service
・Change in allowance on some transactions
・Expansion of Lending service
Revenue: +27.5%
Consoli. OP +30.2% YoYOP before adj./elimi. +27.4% YoY
Q2 FY18 Q2 FY19 Q2 FY18 Q2 FY19
・Upfront investments at MACROKIOSK to solidify business foundation and forex losses etc.
Payment Processing & MSB recorded higher revenue and OP, offsetting the strategic losses in Payment Enhancement Business due to upfront investments
・Growth of GMO PaD・Expansion of Lending
service・Strong growth of
Remittance service
・Brisk SMS service growth at MACROKIOSK
・Revenue growth of marketing support service
・Secular growth of online payment
・Expanded adoption of Ginko Pay
・Bulk sale contribution of card-present payment terminals
28Copyright (C) 1995 GMO Payment Gateway, Inc. All Rights Reserved.
639 713
1,628
2,411
4,797
6,044
5,492
6,846
0
2,000
4,000
6,000
8,000
10,000
12,000
14,000
16,000
(mil. JPY)
Initial Stock Fee Spread
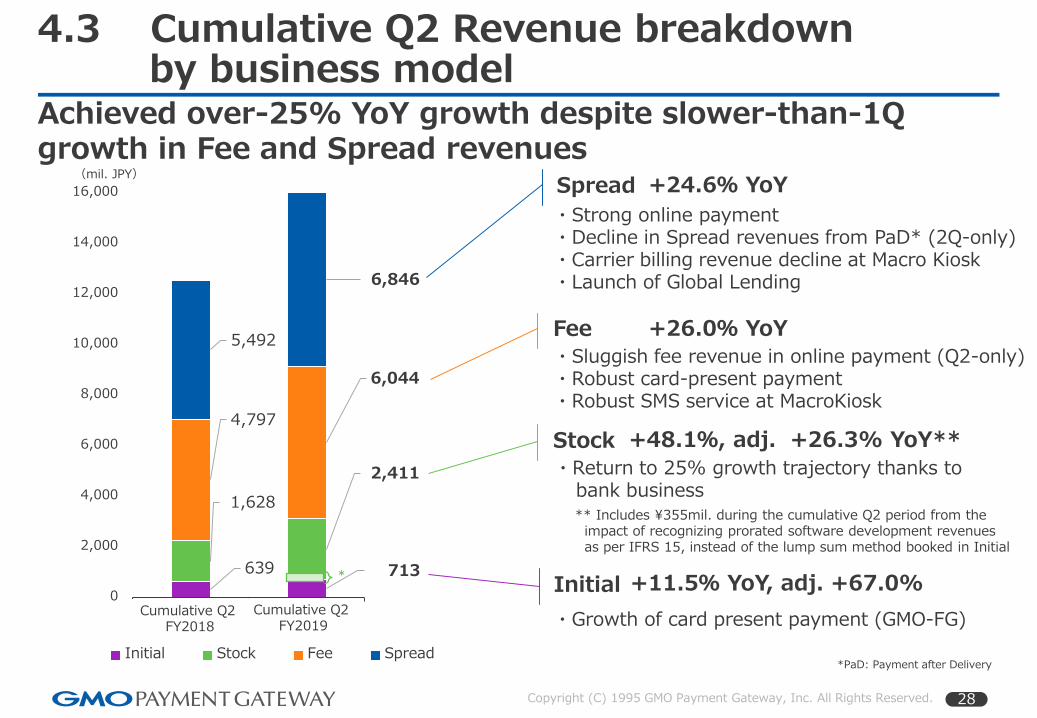
4.3 Cumulative Q2 Revenue breakdownby business model
Achieved over-25% YoY growth despite slower-than-1Q growth in Fee and Spread revenues
Spread
Fee
Stock
Initial
・Strong online payment・Decline in Spread revenues from PaD* (2Q-only)・Carrier billing revenue decline at Macro Kiosk ・Launch of Global Lending
・Return to 25% growth trajectory thanks tobank business
・Growth of card present payment (GMO-FG)
+24.6% YoY
+26.0% YoY
+48.1%, adj. +26.3% YoY**
+11.5% YoY, adj. +67.0%
・Sluggish fee revenue in online payment (Q2-only)・Robust card-present payment・Robust SMS service at MacroKiosk
Cumulative Q2FY2018
Cumulative Q2 FY2019
*
** Includes ¥355mil. during the cumulative Q2 period from the impact of recognizing prorated software development revenues as per IFRS 15, instead of the lump sum method booked in Initial
*PaD: Payment after Delivery
29Copyright (C) 1995 GMO Payment Gateway, Inc. All Rights Reserved.
0
2,000
4,000
6,000
8,000
10,000
12,000
14,000
16,000
18,000
20,000
22,000
24,000
26,000
28,000
30,000
32,000
2004/9 2005/9 2006/9 2007/9 2008/9 2009/9 2010/9 2011/9 2012/9 2013/9 2014/9 2015/9 2016/9 2017/9 2018/9 2019/9E
TSE Listing
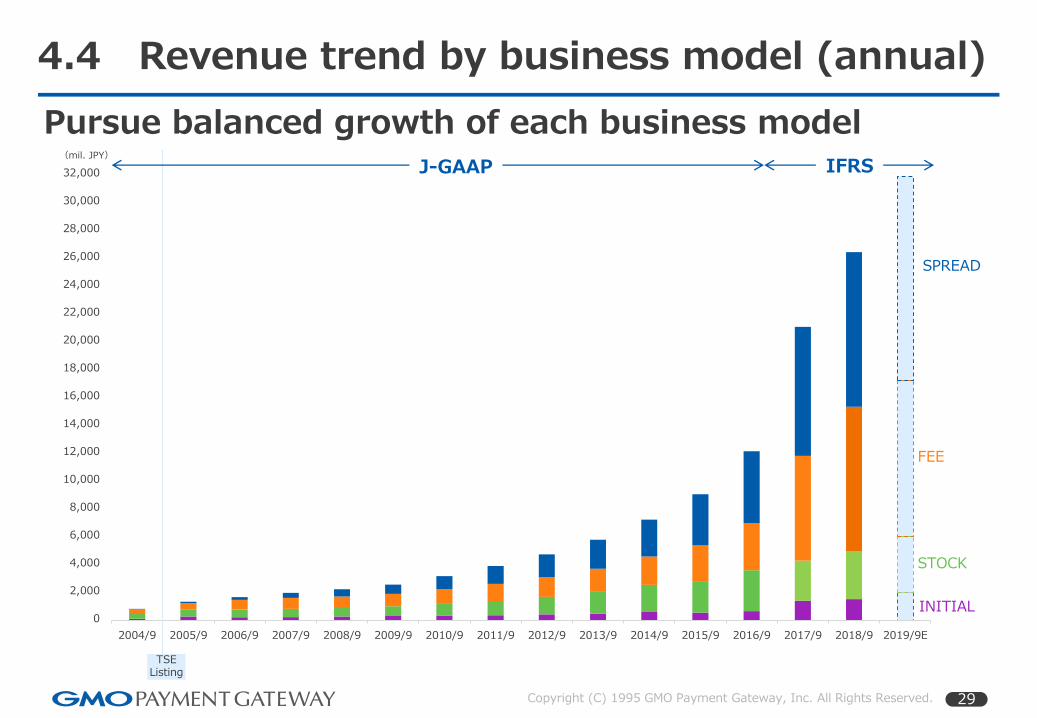
4.4 Revenue trend by business model (annual)
Pursue balanced growth of each business model
INITIAL
STOCK
FEE
SPREAD
J-GAAP IFRS(mil. JPY)
30Copyright (C) 1995 GMO Payment Gateway, Inc. All Rights Reserved.
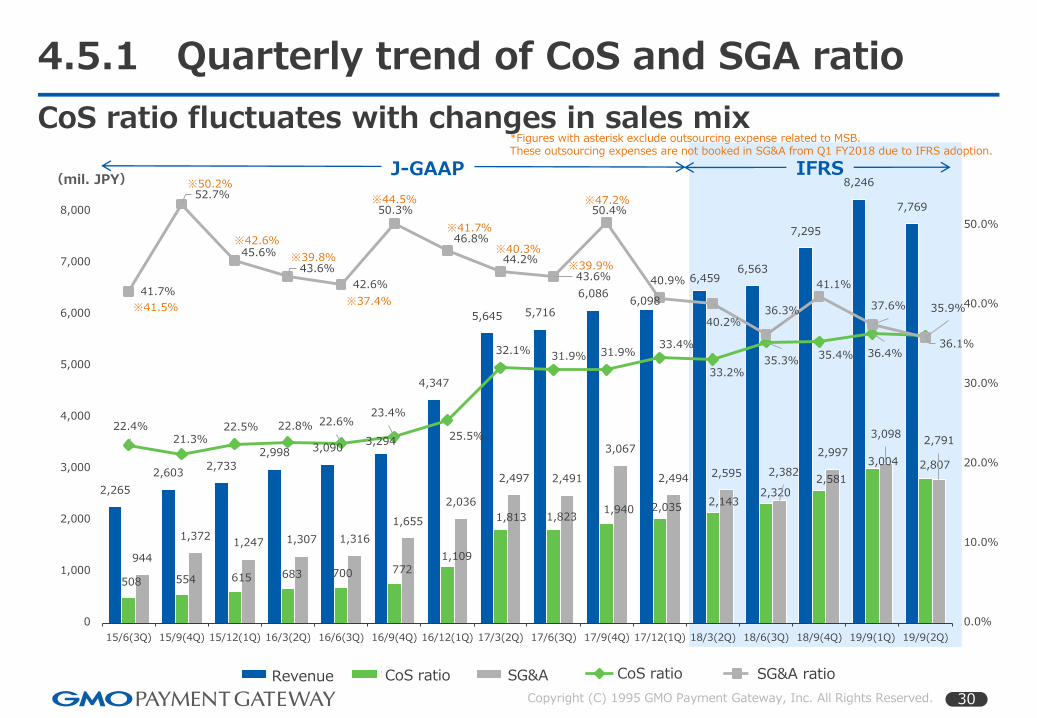
4.5.1 Quarterly trend of CoS and SGA ratio
CoS ratio fluctuates with changes in sales mix
(mil. JPY)J-GAAP IFRS
*Figures with asterisk exclude outsourcing expense related to MSB.These outsourcing expenses are not booked in SG&A from Q1 FY2018 due to IFRS adoption.
2,265
2,6032,733
2,998 3,0903,294
4,347
5,645 5,716
6,0866,098
6,4596,563
7,295
8,246
7,769
508 554 615 683 700 7721,109
1,813 1,8231,940 2,035
2,1432,320
2,581
3,004 2,807
944
1,3721,247 1,307 1,316
1,655
2,036
2,497 2,491
3,067
2,494 2,595 2,382
2,997
3,0982,791
22.4%21.3%
22.5% 22.8% 22.6%23.4%
25.5%
32.1%31.9% 31.9%
33.4%
33.2%35.3%
35.4% 36.4%36.1%
41.7%
52.7%
45.6%
43.6%
42.6%
50.3%
46.8%
44.2%
43.6%
50.4%
40.9%
40.2%36.3%
41.1%
37.6% 35.9%
0.0%
10.0%
20.0%
30.0%
40.0%
50.0%
0
1,000
2,000
3,000
4,000
5,000
6,000
7,000
8,000
15/6(3Q) 15/9(4Q) 15/12(1Q) 16/3(2Q) 16/6(3Q) 16/9(4Q) 16/12(1Q) 17/3(2Q) 17/6(3Q) 17/9(4Q) 17/12(1Q) 18/3(2Q) 18/6(3Q) 18/9(4Q) 19/9(1Q) 19/9(2Q)
売上高 売上原価 販管費 売上原価率 売上販管費率
※50.2%
※42.6%
※41.5%
※39.8%
※37.4%
※44.5%
※41.7%
※40.3%
※39.9%
※47.2%
Revenue CoS ratio SG&A CoS ratio SG&A ratio
31Copyright (C) 1995 GMO Payment Gateway, Inc. All Rights Reserved.
2,154
2,478 2,5702,827 2,899
3,092
3,3973,653
3,4693,712
3,937
4,297 4,384
4,663
5,0324,840
451 490 543 599 611 677767 778 770 822
928 1,039 1,0671,071 1,043 1,016869
1,2831,151 1,203 1,197
1,509 1,525
1,225 1,180
1,8901,785
1,577 1,611
2,212 2,253
1,783
20.9%19.8%
21.1% 21.2%21.1% 21.9%
22.6%21.3%
22.2% 22.1%23.6% 24.2% 24.3%
23.0%
20.7% 21.0%
40.4%
51.8%
44.8%
42.5% 41.3%
48.8%
44.9%
33.5%34.0%
50.9%
45.3%
36.7% 36.7%
47.4%
44.8%
36.8%
0.0%
10.0%
20.0%
30.0%
40.0%
50.0%
0
1,000
2,000
3,000
4,000
5,000
6,000
7,000
8,000
15/6(3Q) 15/9(4Q) 15/12(1Q) 16/3(2Q) 16/6(3Q) 16/9(4Q) 16/12(1Q) 17/3(2Q) 17/6(3Q) 17/9(4Q) 17/12(1Q) 18/3(2Q) 18/6(3Q) 18/9(4Q) 19/9(1Q) 19/9(2Q)
売上高 売上原価 販管費 売上原価率 売上販管費率
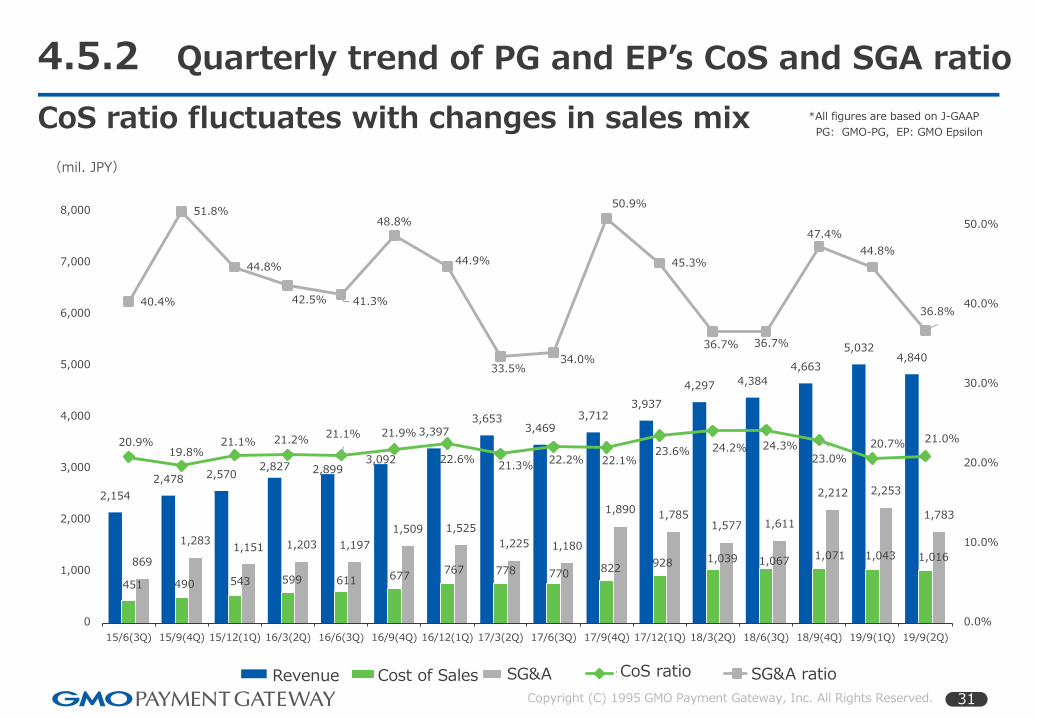
4.5.2 Quarterly trend of PG and EP’s CoS and SGA ratio
(mil. JPY)
*All figures are based on J-GAAP
PG: GMO-PG, EP: GMO EpsilonCoS ratio fluctuates with changes in sales mix
Revenue Cost of Sales SG&A CoS ratio SG&A ratio
32Copyright (C) 1995 GMO Payment Gateway, Inc. All Rights Reserved.
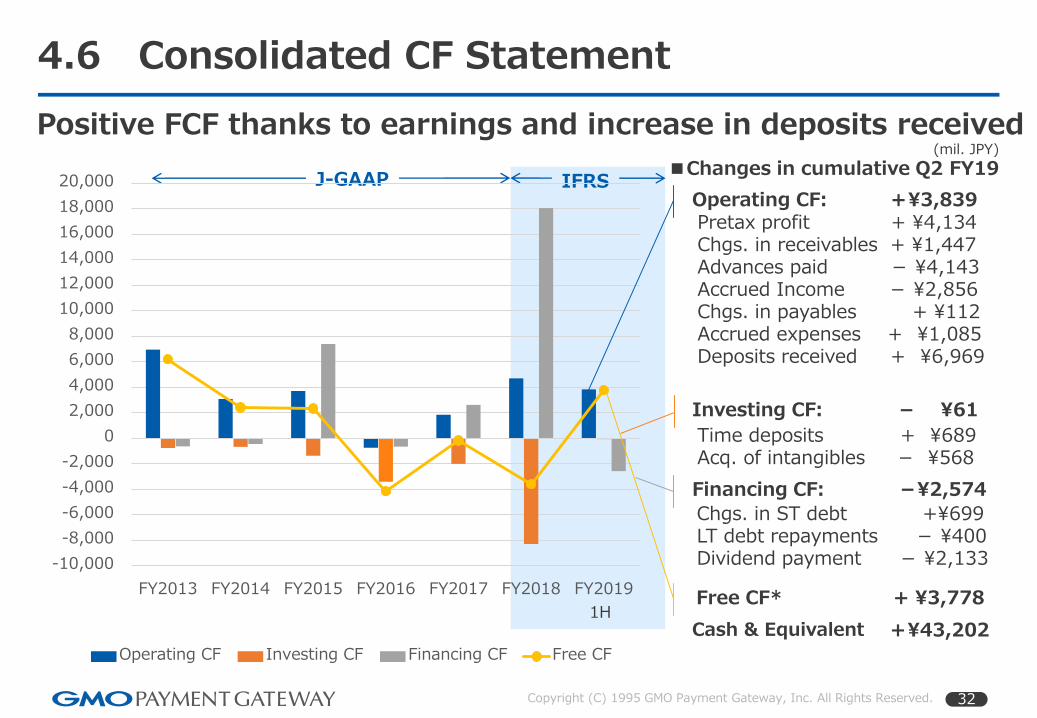
Positive FCF thanks to earnings and increase in deposits received
4.6 Consolidated CF Statement
Financing CF: -¥2,574
(mil. JPY)
■Changes in cumulative Q2 FY19J-GAAP IFRS
-10,000
-8,000
-6,000
-4,000
-2,000
0
2,000
4,000
6,000
8,000
10,000
12,000
14,000
16,000
18,000
20,000
FY2013 FY2014 FY2015 FY2016 FY2017 FY2018 FY2019
1H
Operating CF Investing CF Financing CF Free CF
Operating CF: +¥3,839Pretax profit + ¥4,134Chgs. in receivables + ¥1,447Advances paid - ¥4,143Accrued Income - ¥2,856Chgs. in payables + ¥112Accrued expenses + ¥1,085Deposits received + ¥6,969
Investing CF: - ¥61
Time deposits + ¥689Acq. of intangibles - ¥568
Chgs. in ST debt +¥699LT debt repayments - ¥400Dividend payment - ¥2,133
Free CF* + ¥3,778
+¥43,202Cash & Equivalent1H
Thank You Very Much
GMO Payment Gateway, Inc. (3769; Tokyo Stock Exchange, Section 1)
For inquiries please contact our IR team at the telephone number below:
URL: https://corp.gmo-pg.com/en/ir/
Corporate Value Creation Strategy Division (IR Department) TEL: +81-3-3464-0182