fy2019 investor briefing - smk
TRANSCRIPT
1/22
FY2019 Investor Briefing
May 29, 2020

2/22
FY2019 Outline of Financial Statement
Executive Vice President and CFO
KOHEI OHGAKI

3/22
57,386 54,161
-1,834 -244 -707 -185 -834
-2,651 -3,000
0
3,000
6,000
9,000
12,000
15,000
-15,000
0
15,000
30,000
45,000
60,000
75,000
Net Sales Operating Profit Ordinary Profit Net Profit
5.6% DOWN
FY2019 FY2018 Unit: Million yen
<Consolidated> Financial Results
Net Sales Profit

4/22
55,000 54,161
150
-244
450
-185
200
-2,651 -3,000
0
3,000
6,000
9,000
12,000
15,000
-15,000
0
15,000
30,000
45,000
60,000
75,000
Net Sales Operating Profit Ordinary Profit Net Profit
<Impact of COVID-19 in 4Q> Net Sales -920 Operating Profit -640
1.5% DOWN
FY2019 FY2019 Forecast published on Jan. 28, 2020
Unit: Million yen
<Consolidated> Financial Results
Net Sales Profit
5/22
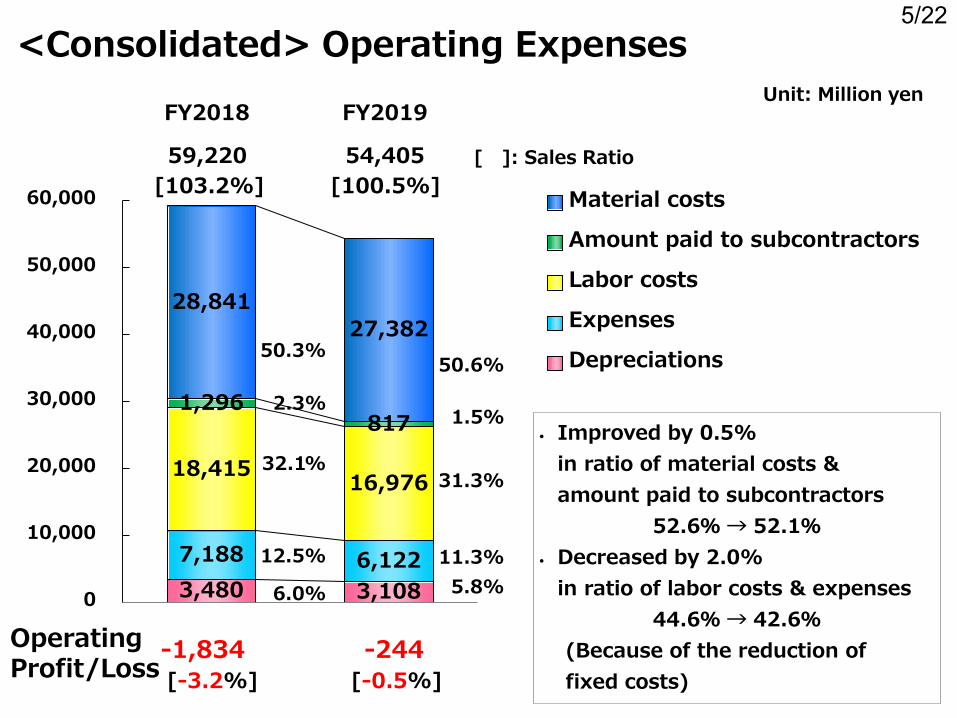
3,480 3,108 7,188 6,122
18,415 16,976
1,296 817
28,841 27,382
0
10,000
20,000
30,000
40,000
50,000
60,000 Material costs
Amount paid to subcontractors
Labor costs
Expenses
Depreciations
-1,834 -244 [-3.2%] [-0.5%]
50.6%
1.5%
31.3%
11.3% 5.8%
50.3%
2.3%
32.1%
12.5%
6.0%
FY2018 FY2019
59,220 54,405 [103.2%] [100.5%]
• Improved by 0.5% in ratio of material costs & amount paid to subcontractors
52.6% → 52.1% • Decreased by 2.0%
in ratio of labor costs & expenses 44.6% → 42.6%
(Because of the reduction of fixed costs)
Unit: Million yen
<Consolidated> Operating Expenses
[ ]: Sales Ratio
Operating Profit/Loss
6/22
-2,500
-2,000
-1,500
-1,000
-500
0
500
1,000
1,500
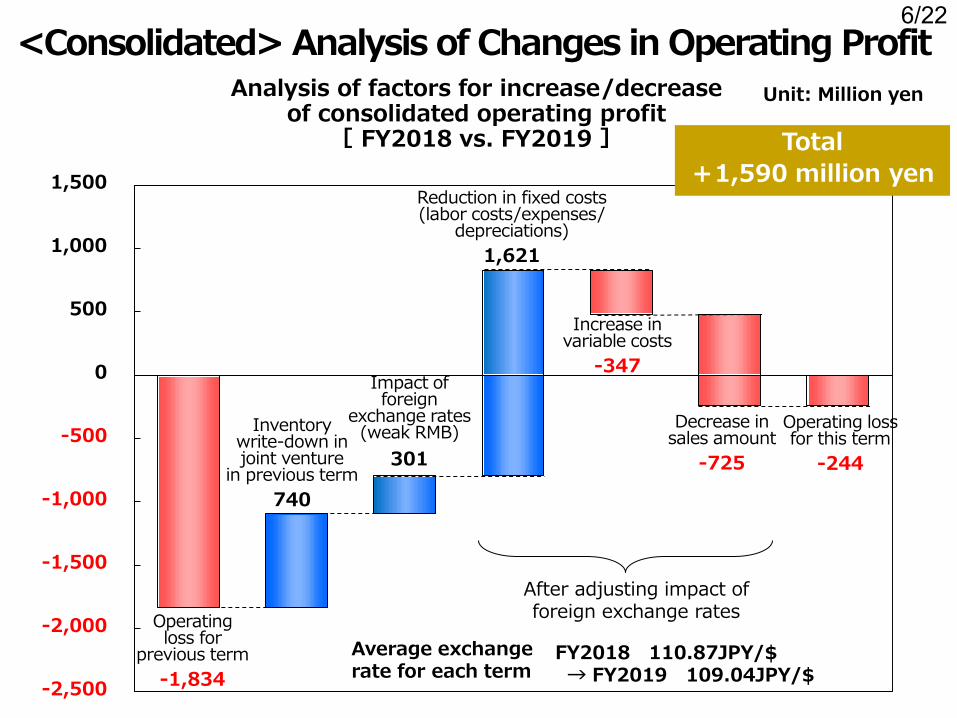
Total +1,590 million yen
FY2018 110.87JPY/$ → FY2019 109.04JPY/$
Unit: Million yen
<Consolidated> Analysis of Changes in Operating Profit Analysis of factors for increase/decrease
of consolidated operating profit [ FY2018 vs. FY2019 ]
After adjusting impact of foreign exchange rates
Average exchange rate for each term
Operating loss for
previous term -1,834
Impact of foreign
exchange rates (weak RMB)
301
Reduction in fixed costs (labor costs/expenses/
depreciations) 1,621
Increase in variable costs
-347
Operating loss for this term
-244
Inventory write-down in joint venture
in previous term 740
Decrease in sales amount
-725

7/22
279 264
-22 -4
520 491
350
-692
-1,000
-800
-600
-400
-200
0
200
400
600
800
1,000
1,200 Foreign exchange profit/loss
Revenue from and expenditure to real estates
Financial account balance
Others
FY2018 FY2019
1,127 59 [0.2%]
-707 -185
[2.0%]
[-1.2%] [-0.3%]
Unit: Million yen
<Consolidated> Non-operating Profit and Loss
Ordinary Profit/Loss
[ ]: Sales Ratio
Foreign exchange gain 350 million yen → loss -692 million yen 1. FY2018 Exchange rates at the beginning vs. at the end of the term
Yen weakened by 4.75 yen 2. FY2019 Exchange rates at the beginning vs. at the end of the term
Yen strengthened by 2.16 yen
8/22
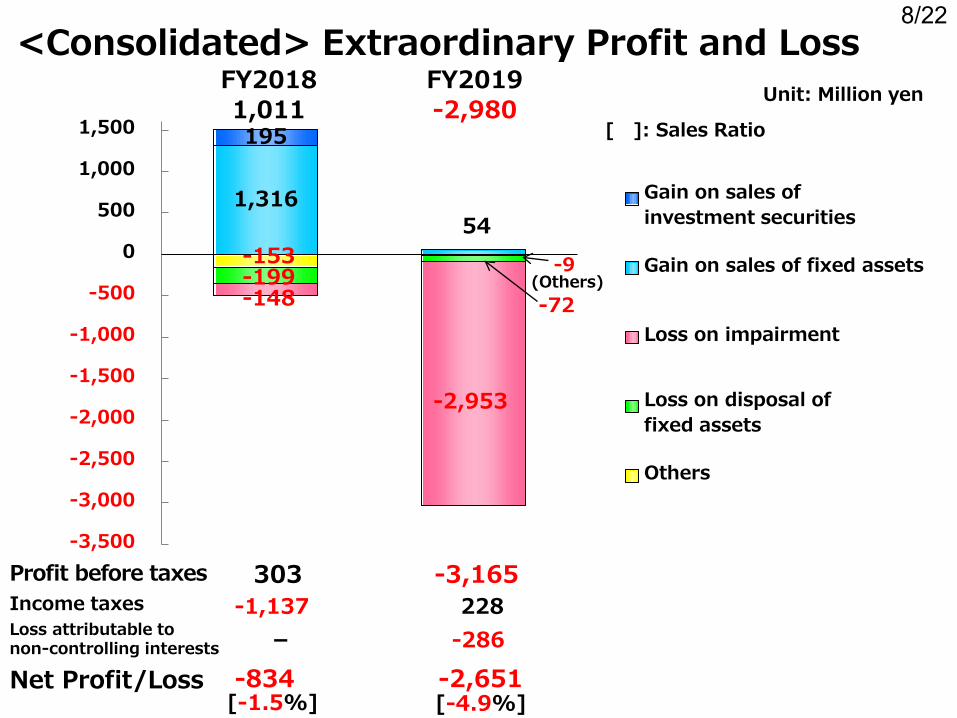
-153 -9 -199 -72 -148
-2,953
1,316 54
195
-3,500
-3,000
-2,500
-2,000
-1,500
-1,000
-500
0
500
1,000
1,500
Gain on sales of investment securities
Gain on sales of fixed assets
Loss on impairment
Loss on disposal of fixed assets
Others
-3,165 303 -1,137 228
-834 -2,651 [-1.5%] [-4.9%]
FY2018 FY2019 1,011 -2,980
- -286
(Others)
Unit: Million yen
<Consolidated> Extraordinary Profit and Loss
[ ]: Sales Ratio
Profit before taxes Income taxes
Net Profit/Loss
Loss attributable to non-controlling interests

9/22
FY2019
FY2018 Reporting Segment
Others* TOTAL CS Division
SCI Division
R&D Center Total
Net Sales 21,712 35,180 471 57,365 21 57,386
Operating Profit (Loss) 258 (862) (316) (919) (914) (1,834)
Reporting Segment Others* TOTAL CS
Division SCI
Division R&D
Center Total
Net Sales 18,670 35,137 281 54,088 73 54,161
Operating Profit (Loss) 141 10 (279) (127) (117) (244)
Unit: Million yen
<Consolidated> Segment Information
*Others: Other components business, lease, real-estate rental, and worker dispatching undertaking
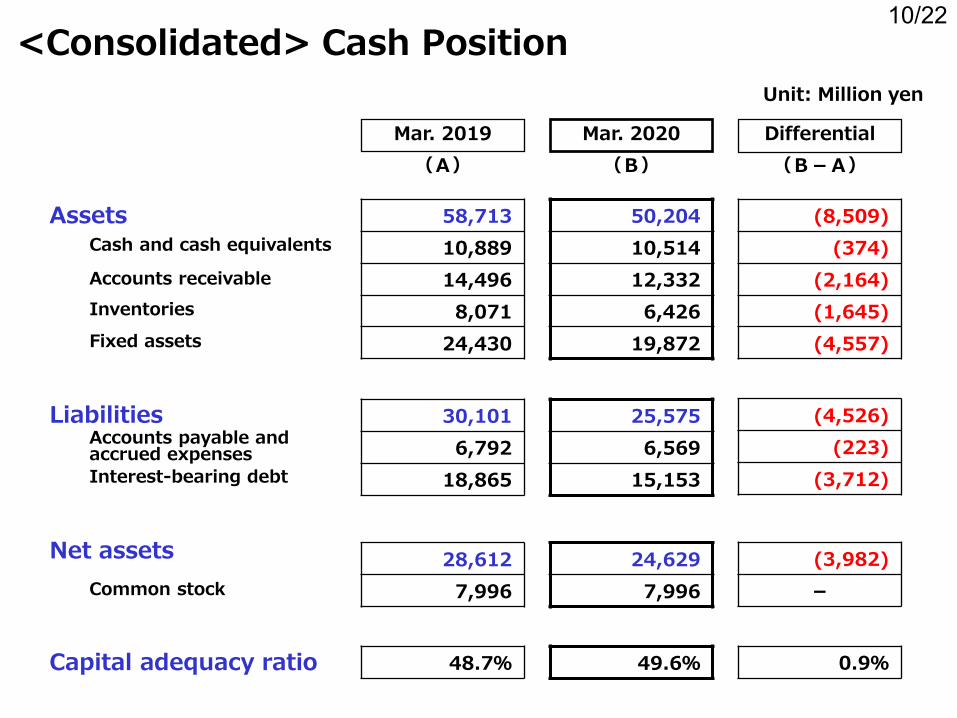
10/22
Mar. 2020
50,204 10,514 12,332
6,426 19,872
25,575 6,569
15,153
24,629 7,996
49.6%
Differential
(8,509) (374)
(2,164) (1,645) (4,557)
(4,526) (223)
(3,712)
(3,982) -
0.9%
(B) (B-A) Mar. 2019
58,713 10,889 14,496
8,071 24,430
30,101 6,792
18,865
(A)
28,612 7,996
48.7%
Unit: Million yen
<Consolidated> Cash Position
Assets Cash and cash equivalents
Accounts receivable Inventories
Fixed assets
Liabilities
Net assets
Accounts payable and accrued expenses Interest-bearing debt
Common stock
Capital adequacy ratio
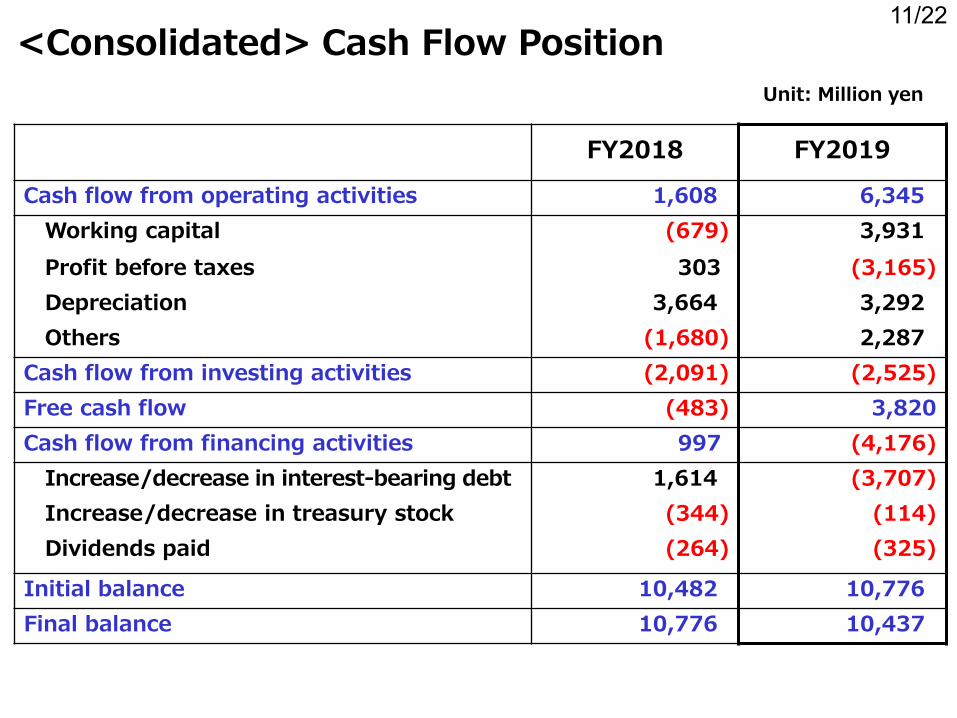
11/22
FY2018 FY2019
Cash flow from operating activities 1,608 6,345 Working capital (679) 3,931 Profit before taxes 303 (3,165) Depreciation 3,664 3,292 Others (1,680) 2,287 Cash flow from investing activities (2,091) (2,525) Free cash flow (483) 3,820 Cash flow from financing activities 997 (4,176) Increase/decrease in interest-bearing debt 1,614 (3,707) Increase/decrease in treasury stock (344) (114) Dividends paid (264) (325)
Initial balance 10,482 10,776 Final balance 10,776 10,437
Unit: Million yen
<Consolidated> Cash Flow Position

12/22
At second quarter end At fiscal year end Annual
FY2019 0.00 yen 40.00 yen 40.00 yen
FY2020 Forecast TBD TBD TBD
(2) Annual Dividend
(1) Forecast of Consolidated Financial Results
Net Sales Operating Profit (Loss)
Ordinary Profit (Loss)
Net Profit (Loss)
FY2019 Million yen % Million yen % Million yen % Million yen %
54,161 (5.6) (244) - (185) - (2,651) -
FY2020 Forecast 47,000 (13.2) 200
-
700
-
300 -
Financial Forecast and Annual Dividend %: Increase (decrease) ratio to previous term

13/22
President, CEO and COO
YASUMITSU IKEDA
FY2019 Result and FY2020 Prospect

14/22
21,712 18,670 18,536
35,180 35,137
28,024
471 281
410
21 73
30
0
20,000
40,000
60,000
80,000
FY2018 Result FY2019/Jan Revised Forecast
FY2019 Result FY2020 Forecast
CS SCI R&D Others
146%
99%
87% 94%
60%
55,000 57,386 54,161 47,000
80%
86%
100%
98%
Net Sales by Product Div. (FY2018-FY2020) Unit: Million yen %: Compared to
previous term
1H: 108.93JPY 2H: 108.00JPY 108.00JPY 109.04JPY 1USD=110.87JPY Exchange
rate

15/22
258 141 604
-861
10 -101
-316
-279 -281
-914
-117 -21
-2,500
-2,000
-1,500
-1,000
-500
0
500
1,000
FY2018 Result FY2019/Jan Revised Forecast
FY2019 Result FY2020 Forecast
CS SCI R&D Others
150 -244 200 -1,834 0.4%
1H: 108.93JPY 2H: 108.00JPY 108.00JPY 109.04JPY 1USD=110.87JPY Exchange
rate
Unit: Million yen Profitability (%)=Profit/Sales
Operating Profit by Product Div. (FY2018-FY2020)
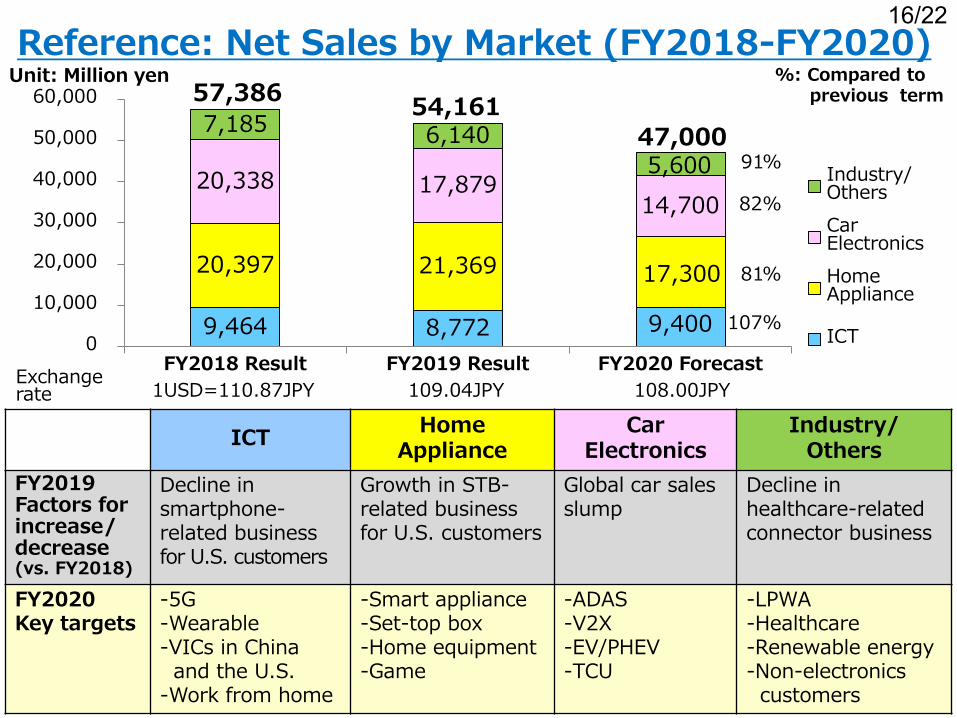
16/22
9,464 8,772 9,400
20,397 21,369 17,300
20,338 17,879 14,700
7,185 6,140 5,600
0
10,000
20,000
30,000
40,000
50,000
60,000
FY2018 Result FY2019 Result FY2020 Forecast
Industry/ Others Car Electronics Home Appliance
ICT
81%
107%
82%
91%
54,161 57,386
47,000
Reference: Net Sales by Market (FY2018-FY2020) Unit: Million yen %: Compared to
previous term
109.04JPY 108.00JPY 1USD=110.87JPY Exchange rate
ICT Home Appliance
Car Electronics
Industry/ Others
FY2019 Factors for increase/ decrease (vs. FY2018)
Decline in smartphone-related business for U.S. customers
Growth in STB-related business for U.S. customers
Global car sales slump
Decline in healthcare-related connector business
FY2020 Key targets
-5G -Wearable -VICs in China and the U.S. -Work from home
-Smart appliance -Set-top box -Home equipment -Game
-ADAS -V2X -EV/PHEV -TCU
-LPWA -Healthcare -Renewable energy -Non-electronics customers

17/22
1. Conduct business operation in response to the COVID-19 crisis
2. Restore profitability by reducing break-even point
3. Expand business and strengthen the corporate structure with an eye toward post COVID-19
FY2020 Priority Matters

18/22 SMK Group Operating Status (as of May 25)
Base Resumed from Attendance
Works
Japan Toyama
Not affected Hitachi
China
Shenzhen March 11 100% Dongguan March 10 100%
ASEAN
Malaysia May 4 90% Philippines April 13 (partially) 40%
North America Mexico May 4 (partially) 75%
Country/Region Working style Customer visit
Sales Offices
Japan Mainly work from home NOT allowed China Business as usual Allowed (partially not) Taiwan Business as usual Allowed (partially not) Korea Business as usual Allowed USA In principle, work from home NOT allowed Europe In principle, work from home NOT allowed Singapore, Thailand In principle, work from home NOT allowed Malaysia Business as usual NOT allowed

19/22
9,464 8,772 9,400
0
5,000
10,000
FY2018 Result FY2019 Result FY2020 Forecast
107%
Target Applications Key Promotion Products 5G Smartphone, tablet PC,
base station (including local 5G base station)
RF connector, board to board connector, Coaxial connector
Wearable Watch, earphone Board to board connector, board to wire connector, switch, battery connector
Smart wear Textile connector, RF module <COVID-19> Work from home
PC, tablet PC, Wi-Fi® router
Interface connector, board to wire connector, RF module
Unit: Million yen %: Compared to previous term
Approach to ICT Market

20/22
LPWA+System R&D Center’s Approach to Smart Street Light business
NEC commenced the demonstration experiment of the smart street lighting employing SMK’s wireless module in Suginami Ward, Tokyo.
LoRaWAN® module (SMK)
Illuminance sensor
■Differentiated features
■Potential of smart street light (worldwide) FY2013: 3M ⇒ FY2020: 17M units ■Other applications
Location detection
Traffic survey
Disaster monitoring
Tilt sensing Strength evaluation
Highly versatile Connection reliability Waterproof, small Low cost
100
400 470
FY2019 FY2020 FY2021
■Sales target (LPWA+System) (FY2019 sales amount is taken as 100)
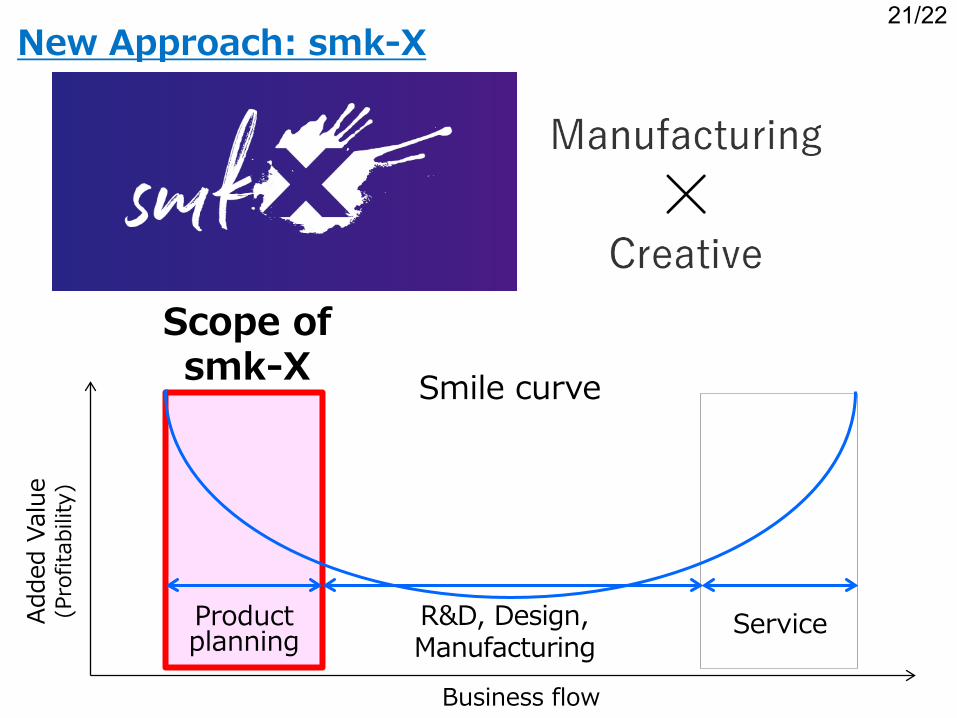
21/22 New Approach: smk-X
Scope of smk-X Smile curve
Adde
d Va
lue
(Pro
fitab
ility
)
Product planning
R&D, Design, Manufacturing
Service
Business flow

22/22
All information in this material concerning the forecast of business achievements, projections of general business conditions and our business strategies is dependent on our conclusion made to a normally foreseeable extent applying information reasonably accessible to us at the time of preparation of this material. However, the reality is that it contains risks and uncertainties which may cause result to materially differ from business projections, stated or implied, due to situations which are unforeseeable under normal conditions, or of results which are beyond a reasonably foreseeable outcome at that time. Despite our active efforts to disclose information which is considered to be important to investors of our company, total dependence on the business projections in this material, stated or implied, must be refrained from when decisions of any kind are made regarding our company.
Notice
Notes on Trademark
* LoRaWAN® read mark is registered trademark owned by LoRa Alliance™ and any use of mark by SMK Corporation is under license. * Wi-Fi is a registered trademark or trademark of Wi-Fi Alliance. * Other products and company names listed in this material are the registered trademarks or trademarks of their respective holders.