fy2019 treasurer’s report to council - nashville.gov · 2010b bab series 2010d refunding series...
TRANSCRIPT

Ta l i a L o m a x - O ’d n e a l To m E d d l e m o nF i n a n c e D i r e c t o r T r e a s u r e r
W a y n e P l a c i d e H e i d i G o u l dF i n a n c i a l A d v i s o r D e b t A d m i n i s t r a t o r
H i l l t o p S e c u r i t i e s
FY2019 TREASURER’SREPORT TO COUNCIL
Metropolitan Government of Nashville and Davidson CountyDepartment of FinanceMayor David Briley

2Metropolitan Government of Nashville and Davidson CountyMayor David Briley
DEBT PRESENTATION
• Annual Debt Report
• Rating Agencies
• Debt Management Policy
• Capital Spending and Debt Capacity
2

3Metropolitan Government of Nashville and Davidson CountyMayor David Briley
DEBT PRESENTATION
Annual Debt Report
3
4Metropolitan Government of Nashville and Davidson CountyMayor David Briley
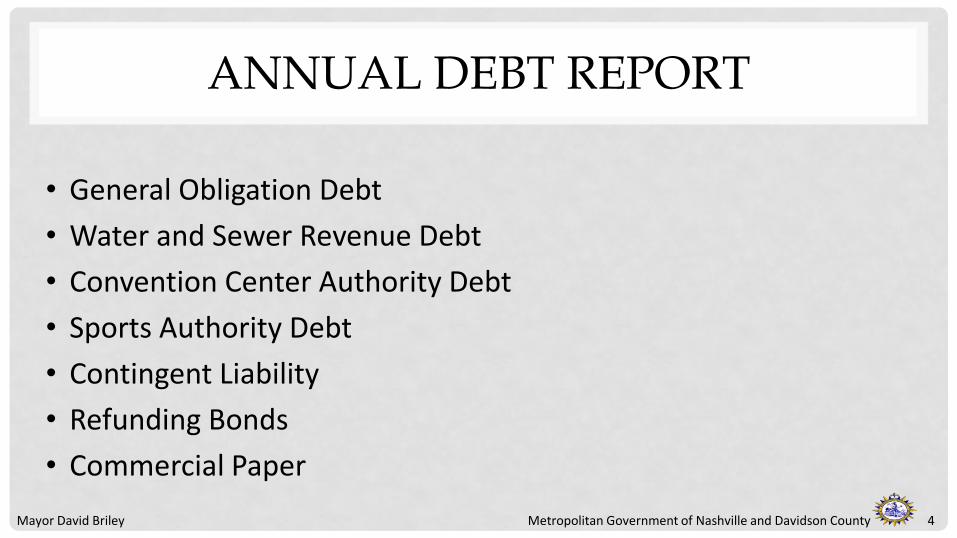
ANNUAL DEBT REPORT
• General Obligation Debt
• Water and Sewer Revenue Debt
• Convention Center Authority Debt
• Sports Authority Debt
• Contingent Liability
• Refunding Bonds
• Commercial Paper

5Metropolitan Government of Nashville and Davidson CountyMayor David Briley
OUTSTANDING GENERAL OBLIGATION DEBT
Principal Interest Total
Bonded Debt $2,550,045,000 $949,349,215 $3,499,394,215
State Loans for Schools 32,435,224 18,269,524 50,704,748
Commercial Paper (1) (2) 600,000,000 600,000,000
Total GO Debt $3,182,480,224 $967,618,739 $4,150,098,963
(1) Commercial paper interest is variable
(2) Commercial paper outstanding as of 05/18/18
Source: Treasury Debt Schedules
6Metropolitan Government of Nashville and Davidson CountyMayor David Briley
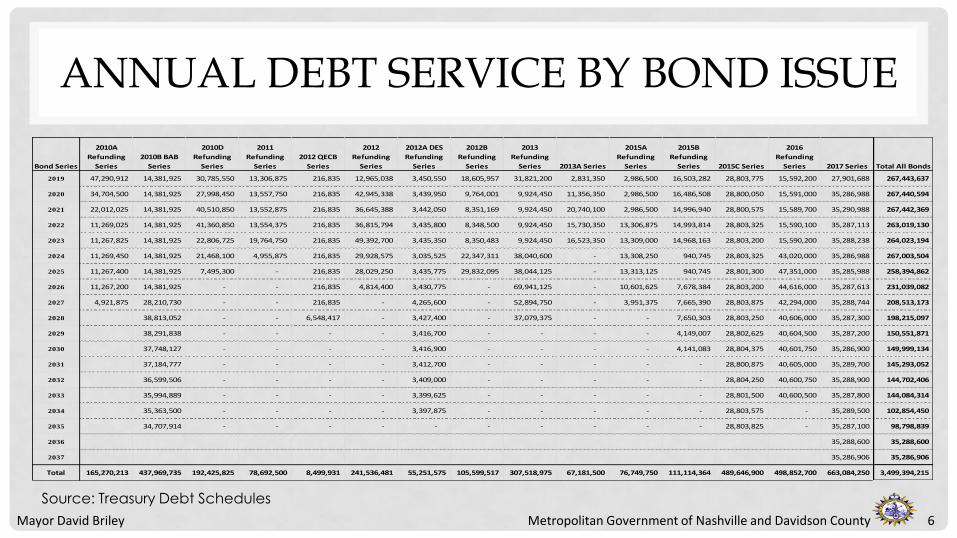
ANNUAL DEBT SERVICE BY BOND ISSUE
6
Bond Series
2010A
Refunding
Series
2010B BAB
Series
2010D
Refunding
Series
2011
Refunding
Series
2012 QECB
Series
2012
Refunding
Series
2012A DES
Refunding
Series
2012B
Refunding
Series
2013
Refunding
Series 2013A Series
2015A
Refunding
Series
2015B
Refunding
Series 2015C Series
2016
Refunding
Series 2017 Series Total All Bonds
2019 47,290,912 14,381,925 30,785,550 13,306,875 216,835 12,965,038 3,450,550 18,605,957 31,821,200 2,831,350 2,986,500 16,503,282 28,803,775 15,592,200 27,901,688 267,443,637
2020 34,704,500 14,381,925 27,998,450 13,557,750 216,835 42,945,338 3,439,950 9,764,001 9,924,450 11,356,350 2,986,500 16,486,508 28,800,050 15,591,000 35,286,988 267,440,594
2021 22,012,025 14,381,925 40,510,850 13,552,875 216,835 36,645,388 3,442,050 8,351,169 9,924,450 20,740,100 2,986,500 14,996,940 28,800,575 15,589,700 35,290,988 267,442,369
2022 11,269,025 14,381,925 41,360,850 13,554,375 216,835 36,815,794 3,435,800 8,348,500 9,924,450 15,730,350 13,306,875 14,993,814 28,803,325 15,590,100 35,287,113 263,019,130
2023 11,267,825 14,381,925 22,806,725 19,764,750 216,835 49,392,700 3,435,350 8,350,483 9,924,450 16,523,350 13,309,000 14,968,163 28,803,200 15,590,200 35,288,238 264,023,194
2024 11,269,450 14,381,925 21,468,100 4,955,875 216,835 29,928,575 3,035,525 22,347,311 38,040,600 - 13,308,250 940,745 28,803,325 43,020,000 35,286,988 267,003,504
2025 11,267,400 14,381,925 7,495,300 - 216,835 28,029,250 3,435,775 29,832,095 38,044,125 - 13,313,125 940,745 28,801,300 47,351,000 35,285,988 258,394,862
2026 11,267,200 14,381,925 - - 216,835 4,814,400 3,430,775 - 69,941,125 - 10,601,625 7,678,384 28,803,200 44,616,000 35,287,613 231,039,082
2027 4,921,875 28,210,730 - - 216,835 - 4,265,600 - 52,894,750 - 3,951,375 7,665,390 28,803,875 42,294,000 35,288,744 208,513,173
2028 38,813,052 - - 6,548,417 - 3,427,400 - 37,079,375 - - 7,650,303 28,803,250 40,606,000 35,287,300 198,215,097
2029 38,291,838 - - - - 3,416,700 - - - - 4,149,007 28,802,625 40,604,500 35,287,200 150,551,871
2030 37,748,127 - - - - 3,416,900 - - - - 4,141,083 28,804,375 40,601,750 35,286,900 149,999,134
2031 37,184,777 - - - - 3,412,700 - - - - - 28,800,875 40,605,000 35,289,700 145,293,052
2032 36,599,506 - - - - 3,409,000 - - - - - 28,804,250 40,600,750 35,288,900 144,702,406
2033 35,994,889 - - - - 3,399,625 - - - - - 28,801,500 40,600,500 35,287,800 144,084,314
2034 35,363,500 - - - - 3,397,875 - - - - - 28,803,575 - 35,289,500 102,854,450
2035 34,707,914 - - - - - - - - - - 28,803,825 - 35,287,100 98,798,839
2036 35,288,600 35,288,600
2037 35,286,906 35,286,906
Total 165,270,213 437,969,735 192,425,825 78,692,500 8,499,931 241,536,481 55,251,575 105,599,517 307,518,975 67,181,500 76,749,750 111,114,364 489,646,900 498,852,700 663,084,250 3,499,394,215
Source: Treasury Debt Schedules

7Metropolitan Government of Nashville and Davidson CountyMayor David Briley
ANNUAL DEBT SERVICE BY BOND ISSUE
7
-
50,000,000.00
100,000,000.00
150,000,000.00
200,000,000.00
250,000,000.00
300,000,000.00
2019 2020 2021 2022 2023 2024 2025 2026 2027 2028 2029 2030 2031 2032 2033 2034 2035 2036 2037
2017 Series
2016 Refunding Series
2015C Series
2015B Refunding Series
2015A Refunding Series
2013A Series
2013 Refunding Series
2012B Refunding Series
2012A DES Refunding Series
2012 Refunding Series
2012 QECB Series
2011 Refunding Series
2010D Refunding Series
2010B BAB Series
2010A Refunding Series
Source: Treasury Debt Schedules
8Metropolitan Government of Nashville and Davidson CountyMayor David Briley
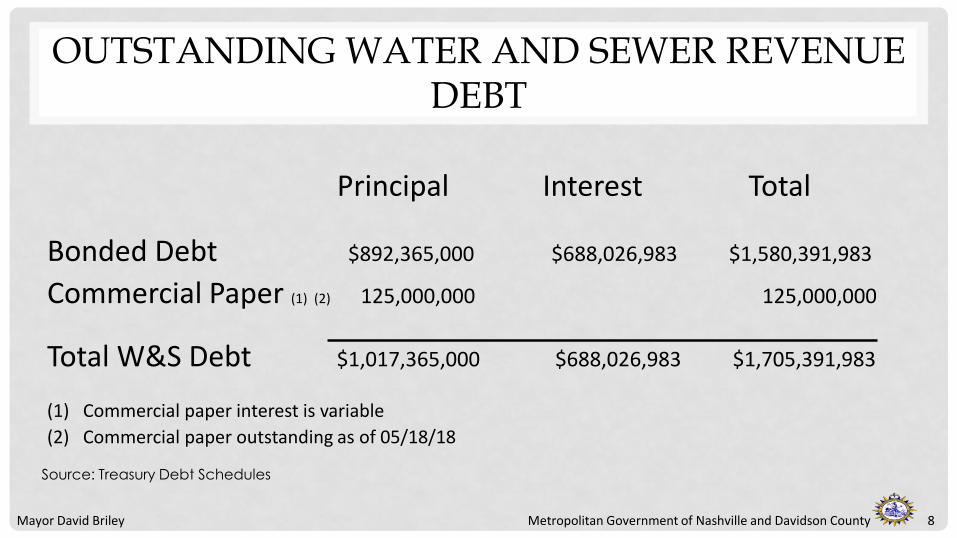
OUTSTANDING WATER AND SEWER REVENUE DEBT
Principal Interest Total
Bonded Debt $892,365,000 $688,026,983 $1,580,391,983
Commercial Paper (1) (2) 125,000,000 125,000,000
Total W&S Debt $1,017,365,000 $688,026,983 $1,705,391,983
(1) Commercial paper interest is variable
(2) Commercial paper outstanding as of 05/18/18
Source: Treasury Debt Schedules
9Metropolitan Government of Nashville and Davidson CountyMayor David Briley
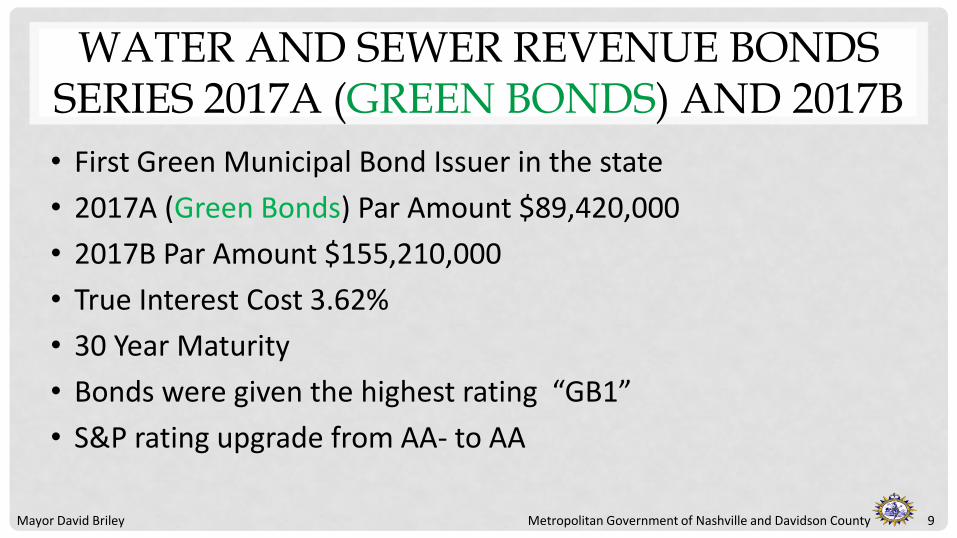
WATER AND SEWER REVENUE BONDS SERIES 2017A (GREEN BONDS) AND 2017B
• First Green Municipal Bond Issuer in the state
• 2017A (Green Bonds) Par Amount $89,420,000
• 2017B Par Amount $155,210,000
• True Interest Cost 3.62%
• 30 Year Maturity
• Bonds were given the highest rating “GB1”
• S&P rating upgrade from AA- to AA
9
10Metropolitan Government of Nashville and Davidson CountyMayor David Briley
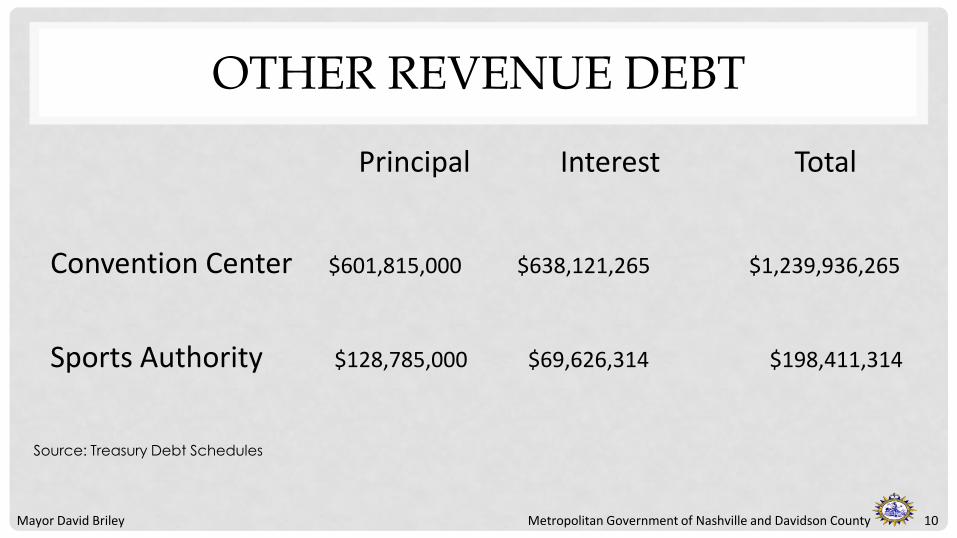
OTHER REVENUE DEBT
Principal Interest Total
Convention Center $601,815,000 $638,121,265 $1,239,936,265
Sports Authority $128,785,000 $69,626,314 $198,411,314
Source: Treasury Debt Schedules

11Metropolitan Government of Nashville and Davidson CountyMayor David Briley
CONTINGENT LIABILITYMETRO’S BACKING OF CERTAIN DEBT OBLIGATIONS WITH NON-TAX REVENUE
Metro has pledged to back certain obligations if pledged revenues were not sufficient to meet annual debt service payments(1)(2)
• GSD Non-Tax revenues are pledged against a total of $1,113,329,606 outstanding principal and interest with FY18 debt service of $56,174,709
GSD non-tax revenue projected for FY18 is $178,161,600
• USD Non-Tax revenues are pledged against a total of $186,462,675 outstanding principal and interest with FY18 debt service of $7,157,547
USD non-tax revenue projected for FY18 is $20,476,400
(1) An example of contingent liability is the Convention Center Tourism Tax Revenue bonds backed by GSD Non-Tax Revenue
(2) No draw against non-tax revenue has been required

12Metropolitan Government of Nashville and Davidson CountyMayor David Briley
COMMERCIAL PAPER
• Commercial paper is a form of bond anticipation notes
• Notes are issued as needed not to exceed authorized limits
• Funds can only be spent on projects previously approved in capital spending plans
• Provides lower cost interim financing until long-term bonds are issued
• Only a financing method – not additional spending authority
12
13Metropolitan Government of Nashville and Davidson CountyMayor David Briley
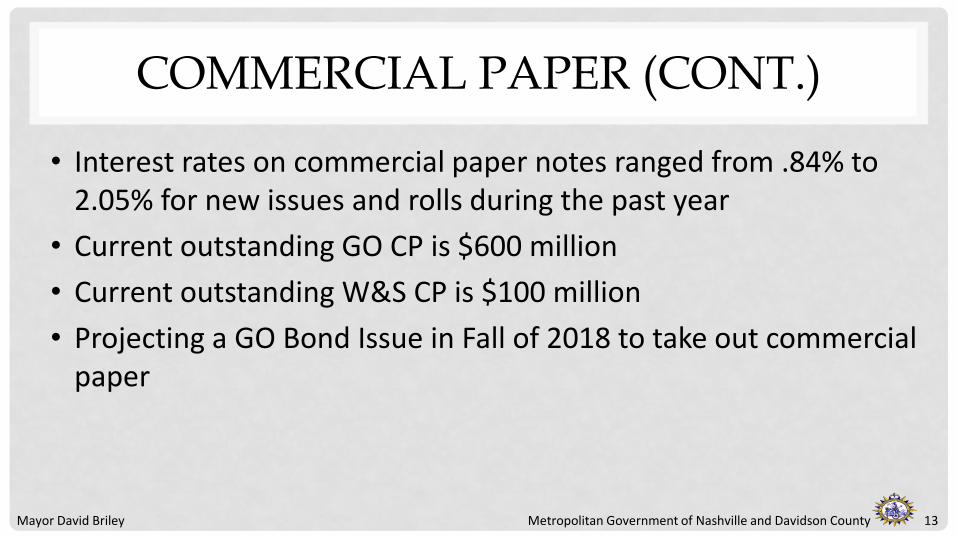
COMMERCIAL PAPER (CONT.)
• Interest rates on commercial paper notes ranged from .84% to 2.05% for new issues and rolls during the past year
• Current outstanding GO CP is $600 million
• Current outstanding W&S CP is $100 million
• Projecting a GO Bond Issue in Fall of 2018 to take out commercial paper
13

14Metropolitan Government of Nashville and Davidson CountyMayor David Briley
DEBT PRESENTATION
Rating Agencies
14

15Metropolitan Government of Nashville and Davidson CountyMayor David Briley
RATING AGENCIES
• Current ratings
• Strengths & weaknesses from latest reports
• Agency’s municipal rating criteria
• Comparative Ratings
16Metropolitan Government of Nashville and Davidson CountyMayor David Briley
AAA
AA+
AA
AA-
A+
A
A-
BBB+
BBB
BBB-
BB+
BB
BB-
AAA
AA+
AA
AA-
A+
A
A-
BBB+
BBB
BBB-
BB+
BB
BB-
Long-Term
Hig
he
r q
ua
lity
cre
dit
Low
er q
ua
lity c
red
itMoody’s
AAA
Aa1
Aa2
Aa3
A1
A2
A3
Baa1
Baa2
Baa3
Ba1
Ba2
Ba3
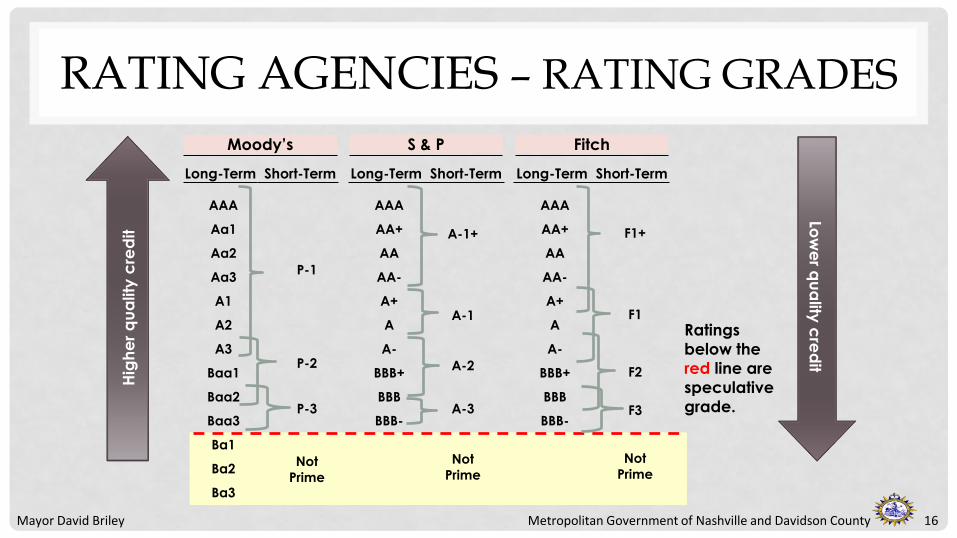
Ratings
below the
red line are
speculative
grade.
Short-Term Long-Term
S & P
Short-Term Long-Term
Fitch
Short-Term
P-1
P-2
P-3
Not
Prime
A-1+
A-1
A-2
A-3
Not
Prime
F1+
F1
F2
F3
Not
Prime
RATING AGENCIES – RATING GRADES
17Metropolitan Government of Nashville and Davidson CountyMayor David Briley
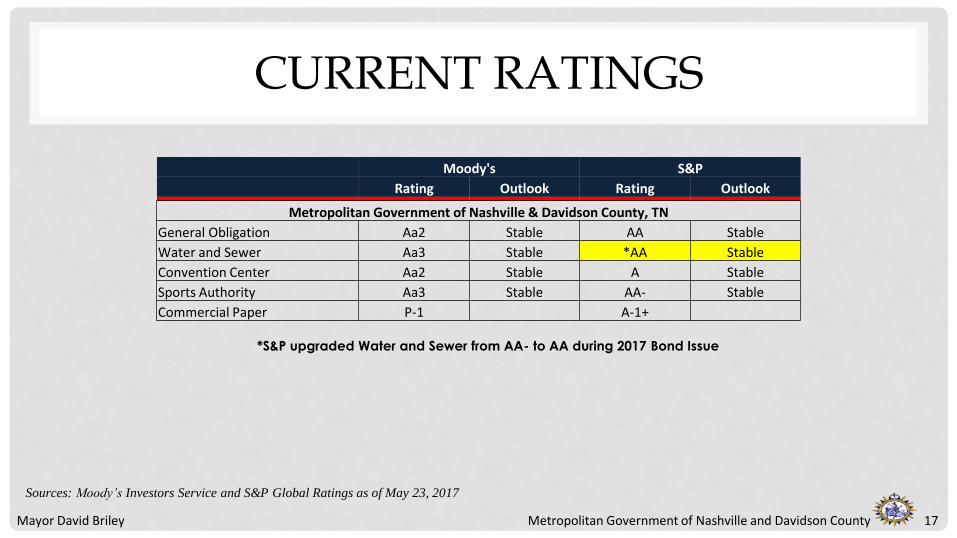
CURRENT RATINGS
17
Moody's S&P
Rating Outlook Rating Outlook
Metropolitan Government of Nashville & Davidson County, TN
General Obligation Aa2 Stable AA Stable
Water and Sewer Aa3 Stable *AA Stable
Convention Center Aa2 Stable A Stable
Sports Authority Aa3 Stable AA- Stable
Commercial Paper P-1 A-1+
Sources: Moody’s Investors Service and S&P Global Ratings as of May 23, 2017
*S&P upgraded Water and Sewer from AA- to AA during 2017 Bond Issue
18Metropolitan Government of Nashville and Davidson CountyMayor David Briley
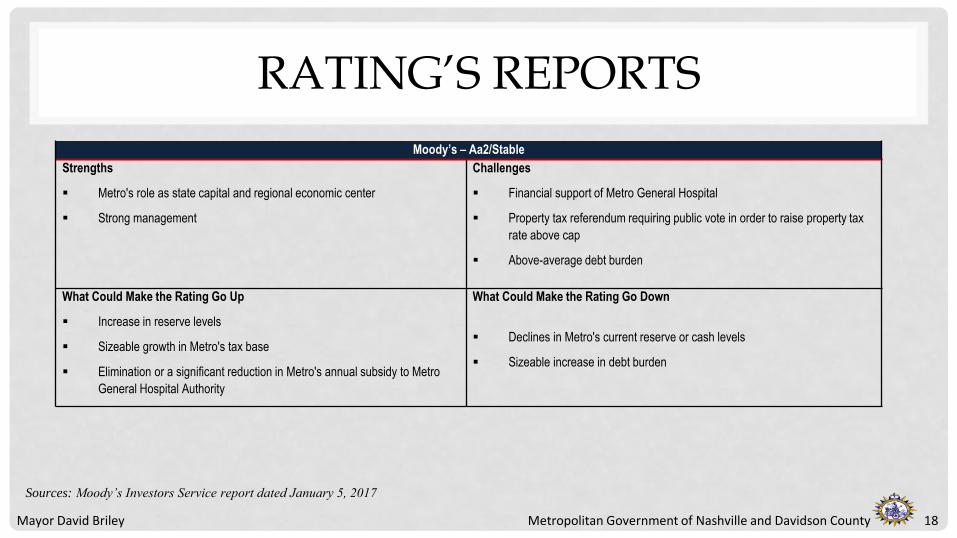
RATING’S REPORTS
18
Moody’s – Aa2/Stable
Strengths
Metro's role as state capital and regional economic center
Strong management
Challenges
Financial support of Metro General Hospital
Property tax referendum requiring public vote in order to raise property tax
rate above cap
Above-average debt burden
What Could Make the Rating Go Up
Increase in reserve levels
Sizeable growth in Metro's tax base
Elimination or a significant reduction in Metro's annual subsidy to Metro
General Hospital Authority
What Could Make the Rating Go Down
Declines in Metro's current reserve or cash levels
Sizeable increase in debt burden
Sources: Moody’s Investors Service report dated January 5, 2017

19Metropolitan Government of Nashville and Davidson CountyMayor David Briley
RATING’S REPORTS
19
S&P – AA/Stable
Rating Factors
Strong economy, with access to a broad and diverse metropolitan statistical
area (MSA)
Strong management, with "good" financial policies and practices under our
financial management assessment (FMA) methodology
Strong budgetary performance, with a slight operating surplus in the general
fund and an operating surplus at the total governmental fund level in fiscal
2016
Very strong liquidity, with total government available cash at 29.4% of total
governmental fund expenditures and 3.0x governmental debt service, and
access to external liquidity we consider exceptional
Weak debt and contingent liability position, with debt service carrying
charges at 9.9% of expenditures and net direct debt that is 167.7% of total
governmental fund revenue
Very strong institutional framework score
Upside Scenario
Improvement in Metro's economic metrics, a sustained trend of very strong
flexibility, and strong budgetary performance characteristics while the consolidated
government effectively manages its capital needs could lead to a higher rating in
the medium-to-long term.
Downside Scenario
We could lower the rating if Metro's growing budget were to result in significant
deterioration in budgetary flexibility and performance.
Sources: S&P Global Ratings report dated January 5, 2017
20Metropolitan Government of Nashville and Davidson CountyMayor David Briley
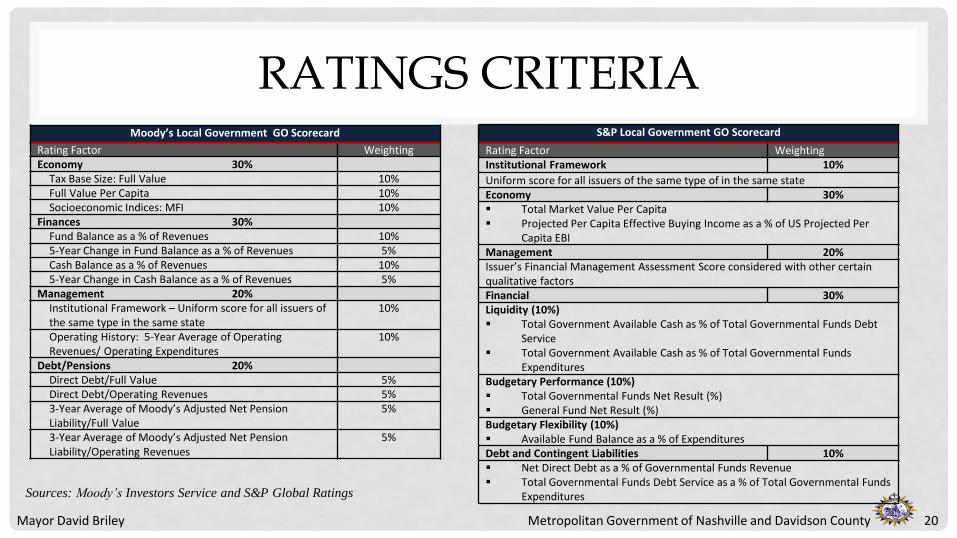
RATINGS CRITERIA
20
Moody’s Local Government GO Scorecard
Rating Factor WeightingEconomy 30%
Tax Base Size: Full Value 10%Full Value Per Capita 10%Socioeconomic Indices: MFI 10%
Finances 30%Fund Balance as a % of Revenues 10%5-Year Change in Fund Balance as a % of Revenues 5%Cash Balance as a % of Revenues 10%5-Year Change in Cash Balance as a % of Revenues 5%
Management 20%Institutional Framework – Uniform score for all issuers of the same type in the same state
10%
Operating History: 5-Year Average of Operating Revenues/ Operating Expenditures
10%
Debt/Pensions 20%Direct Debt/Full Value 5%Direct Debt/Operating Revenues 5%3-Year Average of Moody’s Adjusted Net Pension Liability/Full Value
5%
3-Year Average of Moody’s Adjusted Net Pension Liability/Operating Revenues
5%
S&P Local Government GO Scorecard
Rating Factor WeightingInstitutional Framework 10%
Uniform score for all issuers of the same type of in the same stateEconomy 30% Total Market Value Per Capita Projected Per Capita Effective Buying Income as a % of US Projected Per
Capita EBIManagement 20%Issuer’s Financial Management Assessment Score considered with other certain qualitative factorsFinancial 30%Liquidity (10%) Total Government Available Cash as % of Total Governmental Funds Debt
Service Total Government Available Cash as % of Total Governmental Funds
ExpendituresBudgetary Performance (10%) Total Governmental Funds Net Result (%) General Fund Net Result (%)Budgetary Flexibility (10%) Available Fund Balance as a % of ExpendituresDebt and Contingent Liabilities 10% Net Direct Debt as a % of Governmental Funds Revenue Total Governmental Funds Debt Service as a % of Total Governmental Funds
ExpendituresSources: Moody’s Investors Service and S&P Global Ratings

21Metropolitan Government of Nashville and Davidson CountyMayor David Briley
RATINGS COMPARISON
21
Moody's S&P
Rating Outlook Rating Outlook
Metropolitan Government of Nashville & Davidson County, TN Aa2 Stable AA Stable
City of Austin, TX Aaa Stable AAA Stable
City of Charlotte, NC Aaa Stable AAA Stable
City & County of Denver, CO Aaa Stable AAA Stable
Louisville & Jefferson County Metropolitan Government, KY Aa1 Stable AA+ Stable
City of Portland, OR Aaa Stable NR -NR – Not Rated
Sources: Moody’s Investors Service and S&P Global Ratings as of May 8, 2018
These are cities council member requested and not necessarily Metro’s Peers

22Metropolitan Government of Nashville and Davidson CountyMayor David Briley
COMPARISON OF DEBT SERVICE AS % OF OPERATING EXPENDITURES WITH OTHER CITIES
22
Criteria: 'Aa2' Rated Cities with a population between 500,000 and 1,400,000.
Source: Moodys MFRA as of May 8, 2018 & Metro Nashville FYE 2017 CAFR
Principal and Interest Only
0.0
5.0
10.0
15.0
20.0
25.0
Per
cen
t (%
)
Albuquerque, NM Baltimore, MD Fort Worth, TX Jacksonville, FLLas Vegas, NV Memphis, TN Nashville-Davidson, TN San Diego, CA

23Metropolitan Government of Nashville and Davidson CountyMayor David Briley
TOP 50 LARGEST U.S. CITIES RANKED BY POPULATION
23
Sources: Moody’s Investors Service MFRA and S&P Global Ratings as of May 8, 2018
Rank by
Actual
Population City
Actual/Estimated
Population, Annual
Value
Direct Net Debt
Outstanding ($000)
Direct Net Debt as
% of Full Value
Direct Net Debt
Per Capita ($)
Debt Burden (Overall
Net Debt as % Full
Value)
Moody's
Rating
S&P's
Rating
Payout, 10 Years,
General Obligation
Debt (%), Current
Value
1 New York City, NY 8,491,079 72,620,832 6.8 8,582 7.2 Aa2 AA 59.3
2 Los Angeles, CA 4,041,707 2,553,944 0.5 632 2.9 Aa2 AA 87.5
3 Chicago, IL 2,695,598 11,466,220 4.2 4,225 8.6 Ba1 BBB+ 34.9
4 Houston, TX 2,303,482 2,917,159 1.3 1,266 5.1 Aa3 AA 52.4
5 Phoenix, AZ 1,579,253 2,133,974 1.5 1,351 2.5 Aa1 AA+ 83.5
6 Philadelphia City, PA 1,567,872 3,651,600 2.7 2,329 4.9 A2 A 62.7
7 San Antonio, TX 1,469,824 2,430,657 2.4 1,654 8.6 Aaa AAA 61.7
8 San Diego, CA 1,406,318 744,515 0.3 529 3.4 Aa2 AA- N/A
9 Dallas, TX 1,257,730 1,916,500 1.7 1,509 5.2 A1 AA- 81.1
10 San Jose, CA 1,046,000 1,006,488 0.6 962 3.1 Aa1 AA+ 60.1
11 Honolulu City and County, HI 992,605 2,821,693 1.4 2,843 N/A Aa1 NR N/A
12 Austin, TX 946,080 1,419,238 1.1 1,500 3.3 Aaa AAA 68.1
13 Jacksonville, FL 923,647 2,100,050 2.6 2,452 3.1 Aa2 AA N/A
14 San Francisco, CA 879,862 2,836,248 1.3 3,224 2.0 Aaa AA+ 65.1
15 Columbus, OH 861,141 2,383,597 5.8 2,706 8.0 Aaa AAA 58.8
16 Indianapolis, IN 855,164 1,224,194 1.9 1,432 2.7 Aaa AA 100.0
17 Fort Worth, TX 833,319 1,209,105 2.4 1,383 7.2 Aa3 AA+ N/A
18 Charlotte, NC 827,097 1,377,007 1.5 1,665 2.5 Aaa AAA 87.9
19 Hempstead Town, NY 770,367 338,011 0.4 440 3.1 Aa3 A+ 93.6
20 Louisville-Jefferson Co. Metro Gvmt, KY 765,352 681,814 1.0 891 1.6 Aa1 AA+ 67.8
21 Detroit, MI 713,777 1,833,414 13.2 2,569 26.6 B1 NR 50.1
22 Denver, CO 693,060 1,522,908 1.5 2,197 5.6 Aaa AAA N/A
23 Seattle, WA 686,800 1,108,920 0.6 1,658 0.8 Aaa AAA 63.5
24 Nashville-Davidson, TN 684,410 3,061,410 3.9 4,473 3.9 Aa2 AA 66.3
25 El Paso, TX 683,080 1,310,940 3.9 1,919 10.1 N/A AA 46
24Metropolitan Government of Nashville and Davidson CountyMayor David Briley
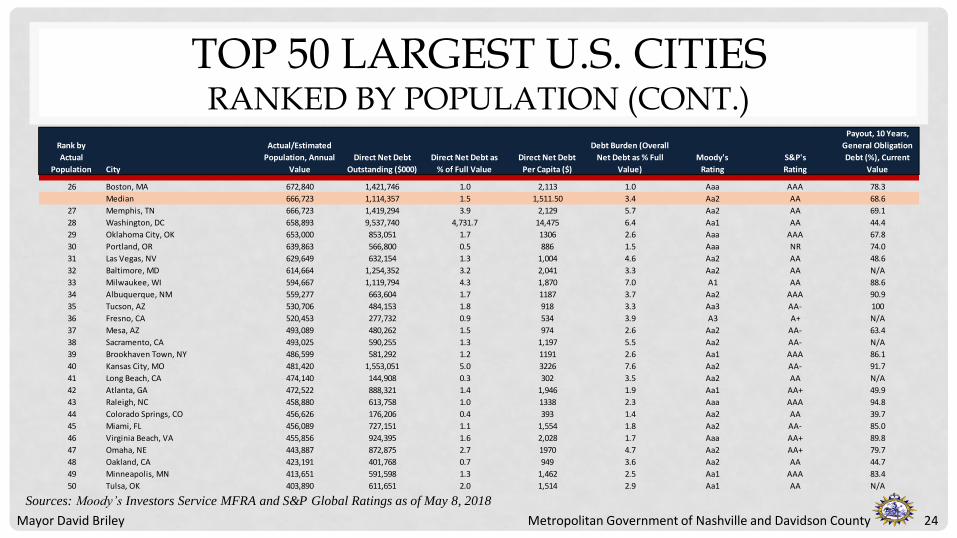
TOP 50 LARGEST U.S. CITIES RANKED BY POPULATION (CONT.)
24Sources: Moody’s Investors Service MFRA and S&P Global Ratings as of May 8, 2018
Rank by
Actual
Population City
Actual/Estimated
Population, Annual
Value
Direct Net Debt
Outstanding ($000)
Direct Net Debt as
% of Full Value
Direct Net Debt
Per Capita ($)
Debt Burden (Overall
Net Debt as % Full
Value)
Moody's
Rating
S&P's
Rating
Payout, 10 Years,
General Obligation
Debt (%), Current
Value
26 Boston, MA 672,840 1,421,746 1.0 2,113 1.0 Aaa AAA 78.3
Median 666,723 1,114,357 1.5 1,511.50 3.4 Aa2 AA 68.6
27 Memphis, TN 666,723 1,419,294 3.9 2,129 5.7 Aa2 AA 69.1
28 Washington, DC 658,893 9,537,740 4,731.7 14,475 6.4 Aa1 AA 44.4
29 Oklahoma City, OK 653,000 853,051 1.7 1306 2.6 Aaa AAA 67.8
30 Portland, OR 639,863 566,800 0.5 886 1.5 Aaa NR 74.0
31 Las Vegas, NV 629,649 632,154 1.3 1,004 4.6 Aa2 AA 48.6
32 Baltimore, MD 614,664 1,254,352 3.2 2,041 3.3 Aa2 AA N/A
33 Milwaukee, WI 594,667 1,119,794 4.3 1,870 7.0 A1 AA 88.6
34 Albuquerque, NM 559,277 663,604 1.7 1187 3.7 Aa2 AAA 90.9
35 Tucson, AZ 530,706 484,153 1.8 918 3.3 Aa3 AA- 100
36 Fresno, CA 520,453 277,732 0.9 534 3.9 A3 A+ N/A
37 Mesa, AZ 493,089 480,262 1.5 974 2.6 Aa2 AA- 63.4
38 Sacramento, CA 493,025 590,255 1.3 1,197 5.5 Aa2 AA- N/A
39 Brookhaven Town, NY 486,599 581,292 1.2 1191 2.6 Aa1 AAA 86.1
40 Kansas City, MO 481,420 1,553,051 5.0 3226 7.6 Aa2 AA- 91.7
41 Long Beach, CA 474,140 144,908 0.3 302 3.5 Aa2 AA N/A
42 Atlanta, GA 472,522 888,321 1.4 1,946 1.9 Aa1 AA+ 49.9
43 Raleigh, NC 458,880 613,758 1.0 1338 2.3 Aaa AAA 94.8
44 Colorado Springs, CO 456,626 176,206 0.4 393 1.4 Aa2 AA 39.7
45 Miami, FL 456,089 727,151 1.1 1,554 1.8 Aa2 AA- 85.0
46 Virginia Beach, VA 455,856 924,395 1.6 2,028 1.7 Aaa AA+ 89.8
47 Omaha, NE 443,887 872,875 2.7 1970 4.7 Aa2 AA+ 79.7
48 Oakland, CA 423,191 401,768 0.7 949 3.6 Aa2 AA 44.7
49 Minneapolis, MN 413,651 591,598 1.3 1,462 2.5 Aa1 AAA 83.4
50 Tulsa, OK 403,890 611,651 2.0 1,514 2.9 Aa1 AA N/A

25Metropolitan Government of Nashville and Davidson CountyMayor David Briley
DEBT PRESENTATION
Debt Management Policy
25
26Metropolitan Government of Nashville and Davidson CountyMayor David Briley
DEBT MANAGEMENT POLICY
• State Requirements
• Metro’s Policy
• Policy Highlights
26
27Metropolitan Government of Nashville and Davidson CountyMayor David Briley
STATE REQUIREMENTS
The State Funding Board adopted a statement on debt management that reflects four principles for strong financial management in the public sector:
• Understand the transaction
• Explain to citizens what is being considered
• Avoid conflicts of interest
• Disclose costs and risks
27
28Metropolitan Government of Nashville and Davidson CountyMayor David Briley
STATE REQUIREMENTS (CONT.)
The State also requires:
• Local governments adopt a policy
• The policy include the minimum requirements provided in the State’s model debt policy
• The policy be filed with the State Comptroller
• For each debt issuance local governments report to the State that the debt complies with the policy and is clearly authorized by the policy.
28
29Metropolitan Government of Nashville and Davidson CountyMayor David Briley
METRO’S DEBT MANAGEMENT POLICY
• Metro Council updated Debt Management Policy requirements in BL2017-949
• The revised Debt Management Policy was adopted by Metro Council on December 6, 2017
• Every Report on Debt Obligation to the State since 2012 includes a statement of compliance with written debt management policy
Each report is provided to Council prior to submission to the State
29
30Metropolitan Government of Nashville and Davidson CountyMayor David Briley
POLICY GOALS
In managing its debt, it is the Metropolitan Government’s policy to:• To document responsibility for the oversight and management of debt related
transactions;
• To define the criteria for the issuance of debt
• To define the types of debt approved for use within constraints established by applicable State law and the Charter of the Metropolitan Government (the “Charter”);
• To define the appropriate uses of debt
• To define the criteria for evaluating refunding candidates or alternative debt structures; and
• To minimize the cost of debt
30

31Metropolitan Government of Nashville and Davidson CountyMayor David Briley
POLICY HIGHLIGHTS
• All debt issuance will conform to requirements of Metro Charter, Tennessee Code Annotated and Federal Tax Code
• Competitive sale is preferred method of debt issuance
• Debt financing term will not exceed the average useful life of assets, generally 20 year bonds
• Long term debt will not be used to finance current operations or normal maintenance
• Refunding for savings is considered when in the best interest and minimum savings are generated (generally 3.5%)
31

32Metropolitan Government of Nashville and Davidson CountyMayor David Briley
POLICY HIGHLIGHTS (CONT.)
• Periodically review basic measures of debt affordability in conjunction with capital spending plan Debt service as percentage of annual general expenses
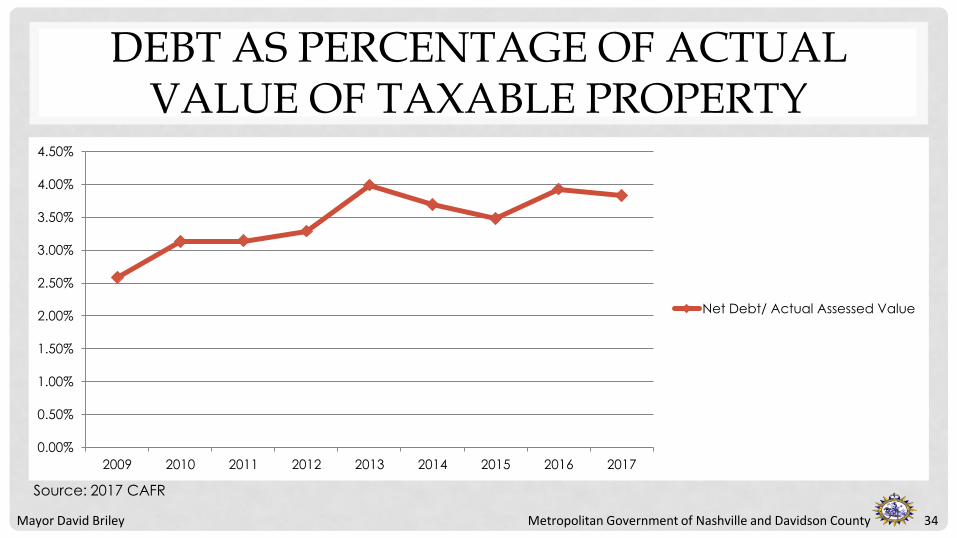
Debt as percentage of actual value of taxable property
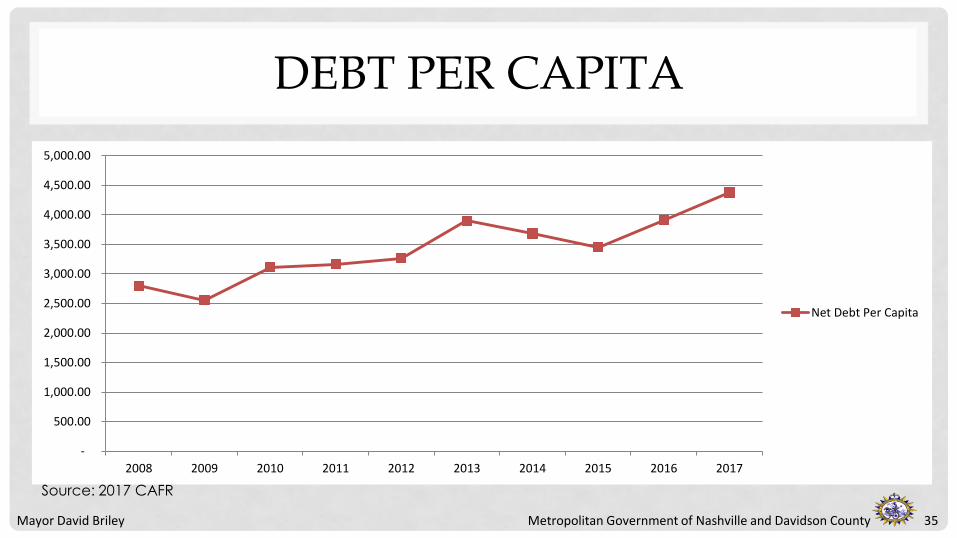
Debt per capita
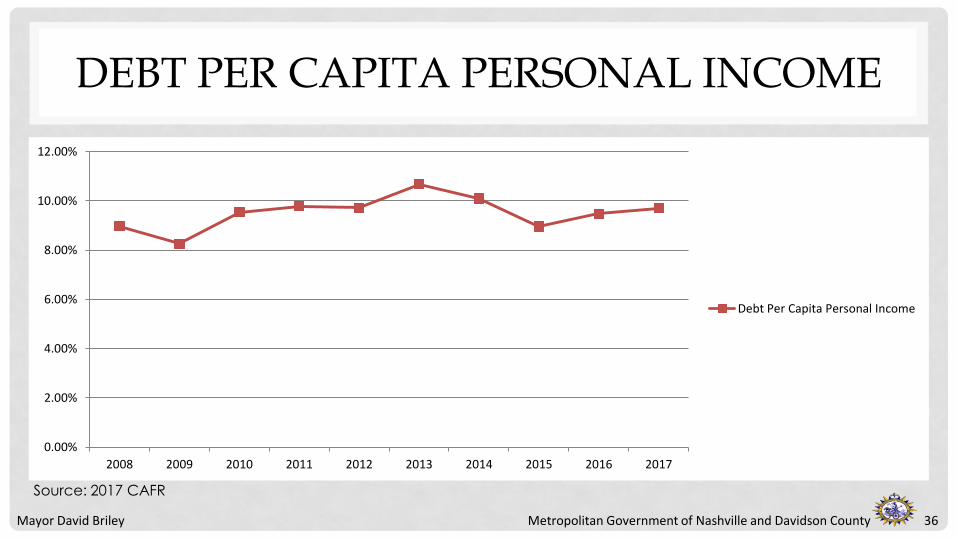
Debt per capita personal income
Annual comparison of general fund balance
Annual comparison of revenues
Annual comparison of expenses
Review of pension funded status and OPEB obligations
32

33Metropolitan Government of Nashville and Davidson CountyMayor David Briley
DEBT SERVICE AS PERCENTAGE OF ANNUAL GENERAL EXPENSES
33
0.00%
2.00%
4.00%
6.00%
8.00%
10.00%
12.00%
2008 2009 2010 2011 2012 2013 2014 2015 2016 2017
Debt Service to Total General Expenditures
Source: 2017 CAFR
34Metropolitan Government of Nashville and Davidson CountyMayor David Briley
DEBT AS PERCENTAGE OF ACTUAL VALUE OF TAXABLE PROPERTY
34
0.00%
0.50%
1.00%
1.50%
2.00%
2.50%
3.00%
3.50%
4.00%
4.50%
2009 2010 2011 2012 2013 2014 2015 2016 2017
Net Debt/ Actual Assessed Value
Source: 2017 CAFR
35Metropolitan Government of Nashville and Davidson CountyMayor David Briley
DEBT PER CAPITA
35
-
500.00
1,000.00
1,500.00
2,000.00
2,500.00
3,000.00
3,500.00
4,000.00
4,500.00
5,000.00
2008 2009 2010 2011 2012 2013 2014 2015 2016 2017
Net Debt Per Capita
Source: 2017 CAFR
36Metropolitan Government of Nashville and Davidson CountyMayor David Briley
DEBT PER CAPITA PERSONAL INCOME
36
0.00%
2.00%
4.00%
6.00%
8.00%
10.00%
12.00%
2008 2009 2010 2011 2012 2013 2014 2015 2016 2017
Debt Per Capita Personal Income
Source: 2017 CAFR
37Metropolitan Government of Nashville and Davidson CountyMayor David Briley
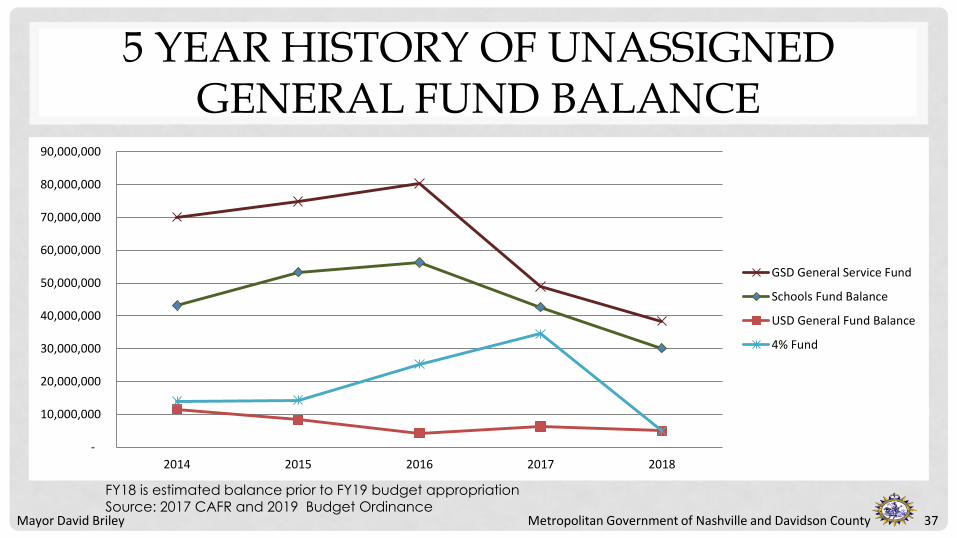
5 YEAR HISTORY OF UNASSIGNED GENERAL FUND BALANCE
37
-
10,000,000
20,000,000
30,000,000
40,000,000
50,000,000
60,000,000
70,000,000
80,000,000
90,000,000
2014 2015 2016 2017 2018
GSD General Service Fund
Schools Fund Balance
USD General Fund Balance
4% Fund
FY18 is estimated balance prior to FY19 budget appropriation Source: 2017 CAFR and 2019 Budget Ordinance

38Metropolitan Government of Nashville and Davidson CountyMayor David Briley
5 YEAR HISTORY OF GENERAL FUND REVENUES
38
800,000,000.00
820,000,000.00
840,000,000.00
860,000,000.00
880,000,000.00
900,000,000.00
920,000,000.00
940,000,000.00
960,000,000.00
980,000,000.00
1,000,000,000.00
1,020,000,000.00
2013 2014 2015 2016 2017
General Fund Revenues
Source: 2017 CAFR
39Metropolitan Government of Nashville and Davidson CountyMayor David Briley
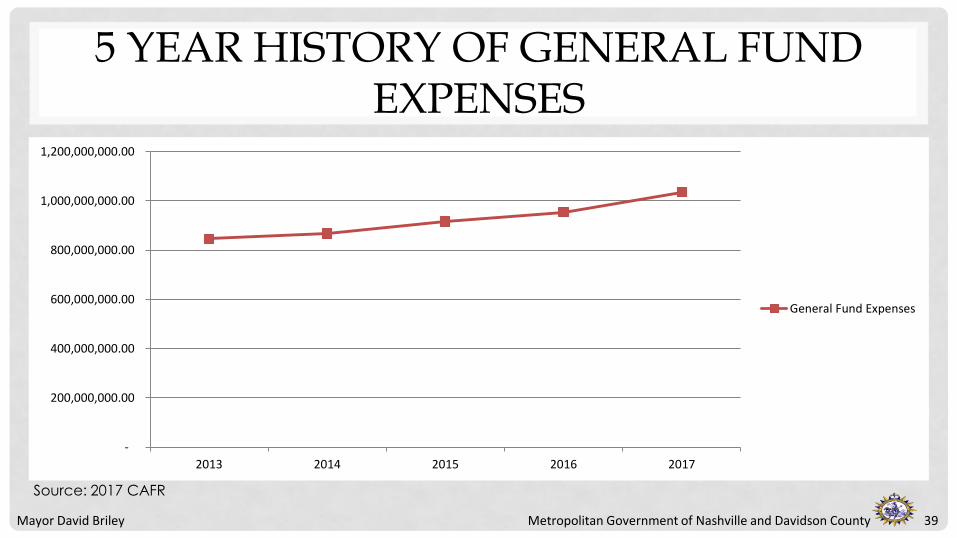
5 YEAR HISTORY OF GENERAL FUND EXPENSES
39
-
200,000,000.00
400,000,000.00
600,000,000.00
800,000,000.00
1,000,000,000.00
1,200,000,000.00
2013 2014 2015 2016 2017
General Fund Expenses
Source: 2017 CAFR
40Metropolitan Government of Nashville and Davidson CountyMayor David Briley40
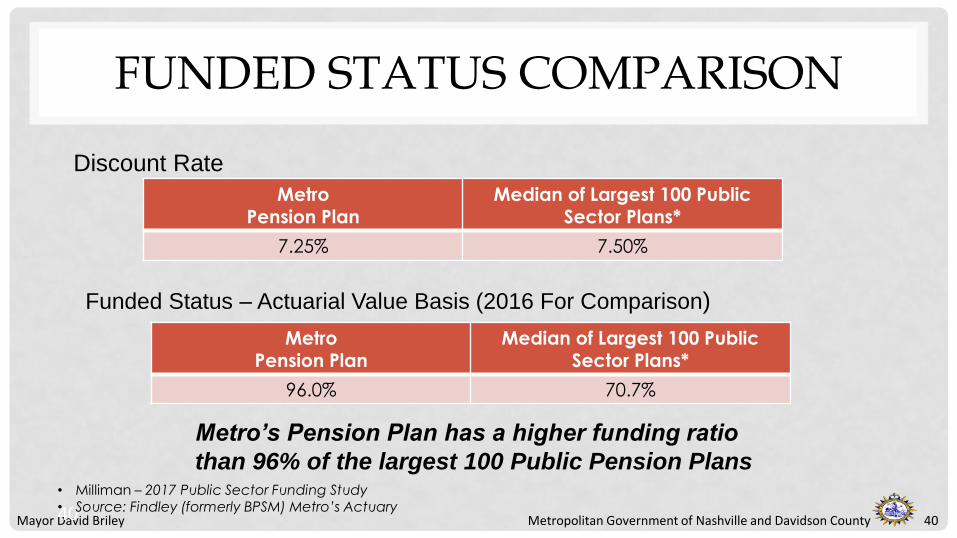
FUNDED STATUS COMPARISON
Metro
Pension Plan
Median of Largest 100 Public
Sector Plans*
7.25% 7.50%
Discount Rate
Funded Status – Actuarial Value Basis (2016 For Comparison)
Metro Pension Plan
Median of Largest 100 Public Sector Plans*
96.0% 70.7%
• Milliman – 2017 Public Sector Funding Study• Source: Findley (formerly BPSM) Metro’s Actuary
Metro’s Pension Plan has a higher funding ratio
than 96% of the largest 100 Public Pension Plans

41Metropolitan Government of Nashville and Davidson CountyMayor David Briley
PENSION FUNDED STATUS
41
Source - BPS&M, LLC report to Metro Employee Benefit Board, February 20, 2018
0.00%
20.00%
40.00%
60.00%
80.00%
100.00%
120.00%
1991 1993 1995 1997 1999 2001 2003 2005 2007 2009 2011 2013 2015 2017
(Assets as a Percentage of Accrued Liability)
Funded Ratio (Actuarial Value) Funded Ratio (Market Value)
Current Funded Ratio (Market Value) 96.1%
Current Funded Ratio (Actuarial Value) 95.5%
Net unfunded pension liability at 06/30/17 is $40.8 millionSource: Findley (formerly BPSM) Metro’s Actuary
42Metropolitan Government of Nashville and Davidson CountyMayor David Briley
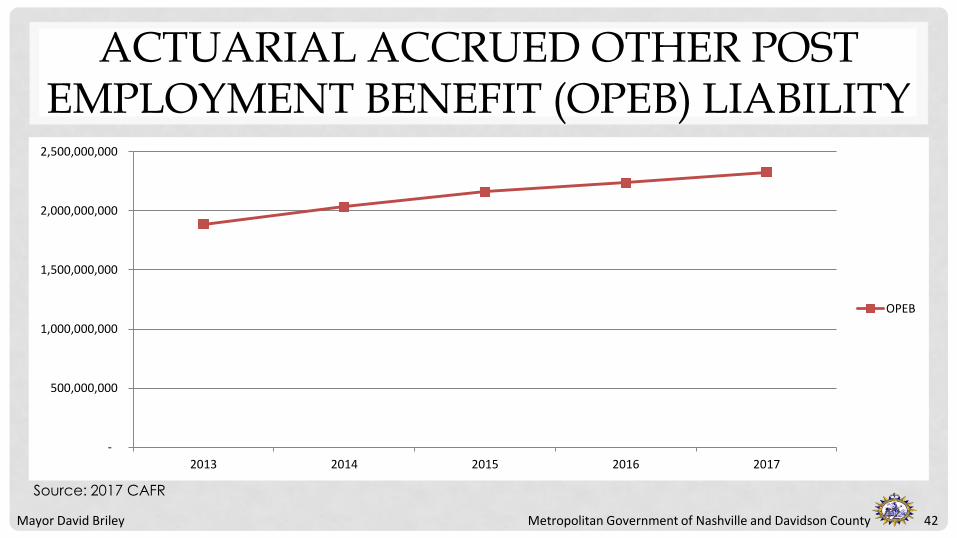
ACTUARIAL ACCRUED OTHER POST EMPLOYMENT BENEFIT (OPEB) LIABILITY
42
-
500,000,000
1,000,000,000
1,500,000,000
2,000,000,000
2,500,000,000
2013 2014 2015 2016 2017
OPEB
Source: 2017 CAFR

43Metropolitan Government of Nashville and Davidson CountyMayor David Briley
OTHER ECONOMIC FACTORS
• Population change
• Unemployment
• Personal Income Change
• New business creation and relocations
• Volume and amount of building permits
43
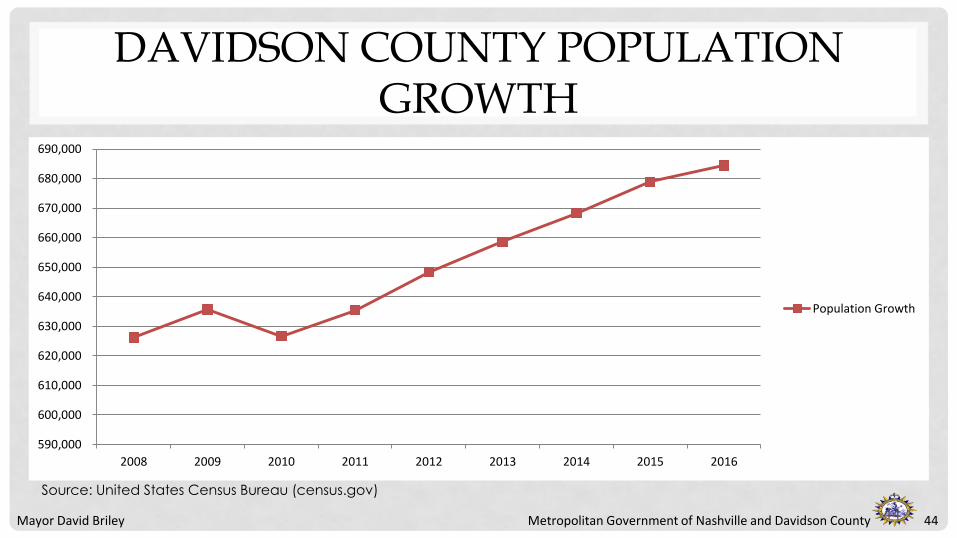
44Metropolitan Government of Nashville and Davidson CountyMayor David Briley
DAVIDSON COUNTY POPULATION GROWTH
44
590,000
600,000
610,000
620,000
630,000
640,000
650,000
660,000
670,000
680,000
690,000
2008 2009 2010 2011 2012 2013 2014 2015 2016
Population Growth
Source: United States Census Bureau (census.gov)

45Metropolitan Government of Nashville and Davidson CountyMayor David Briley
DAVIDSON COUNTY UNEMPLOYMENT
45
0.0%
1.0%
2.0%
3.0%
4.0%
5.0%
6.0%
7.0%
8.0%
9.0%
10.0%
2010 2011 2012 2013 2014 2015 2016 2017 2018
Unemployment
2017 is preliminary – 2.8%Source – Bureau of Labor Statistics (bls.gov)
46Metropolitan Government of Nashville and Davidson CountyMayor David Briley
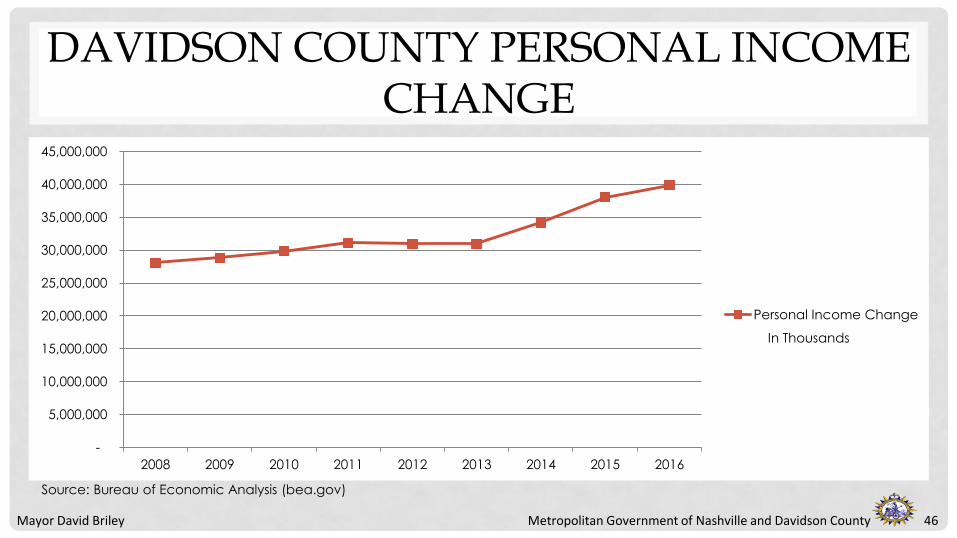
DAVIDSON COUNTY PERSONAL INCOME CHANGE
46
-
5,000,000
10,000,000
15,000,000
20,000,000
25,000,000
30,000,000
35,000,000
40,000,000
45,000,000
2008 2009 2010 2011 2012 2013 2014 2015 2016
Personal Income Change
In Thousands
Source: Bureau of Economic Analysis (bea.gov)

47Metropolitan Government of Nashville and Davidson CountyMayor David Briley
NEW BUSINESS AND RELOCATIONS
Nashville MSA Region Numbers:
Since July 1, 2017 the Nashville Area Chamber of Commerce announced business relocations or expansions into the Nashville MSA, corresponding to 4,167 new jobs.
Davidson County Numbers:
Since July 1, 2017 the Nashville Area Chamber of Commerce announced 24 business relocations or expansion into Davidson County collectively bringing 2,890 new jobs into Metro Davidson County.
47

48Metropolitan Government of Nashville and Davidson CountyMayor David Briley
BUILDING PERMIT TRENDS
48
-
500,000,000.00
1,000,000,000.00
1,500,000,000.00
2,000,000,000.00
2,500,000,000.00
3,000,000,000.00
3,500,000,000.00
4,000,000,000.00
4,500,000,000.00
2007 2008 2009 2010 2011 2012 2013 2014 2015 2016 2017
Building Permit Trends
11
,64
1 P
ermits
9,3
05
Perm
its
7,2
87
Perm
its
10
,98
0 P
ermits
7,6
13
Perm
its
10
,28
8 P
ermits
9,7
08
Perm
its
11
,04
1 P
ermits
12
,38
6 P
ermits
12
,42
5 P
ermits
11
,71
7 P
ermits
Source: Codes Administration

49Metropolitan Government of Nashville and Davidson CountyMayor David Briley
DEBT PRESENTATION
Debt Service History
49

50Metropolitan Government of Nashville and Davidson CountyMayor David Briley
TOTAL DEBT SERVICE AS A PERCENTAGE OF OPERATING BUDGET
50
0.00%
2.00%
4.00%
6.00%
8.00%
10.00%
12.00%
14.00%
2010 2011 2012 2013 2014 2015 2016 2017 2018 2019
% of Operating Budget
Source: Treasury Debt Schedules
51Metropolitan Government of Nashville and Davidson CountyMayor David Briley
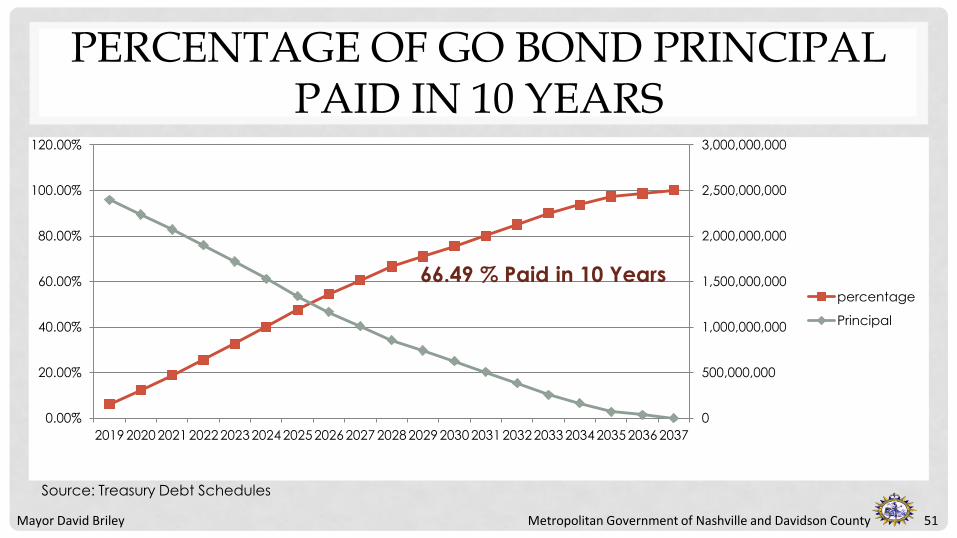
PERCENTAGE OF GO BOND PRINCIPAL PAID IN 10 YEARS
51
0
500,000,000
1,000,000,000
1,500,000,000
2,000,000,000
2,500,000,000
3,000,000,000
0.00%
20.00%
40.00%
60.00%
80.00%
100.00%
120.00%
20192020 2021202220232024 202520262027 202820292030 203120322033 203420352036 2037
percentage
Principal
66.49 % Paid in 10 Years
Source: Treasury Debt Schedules
52Metropolitan Government of Nashville and Davidson CountyMayor David Briley
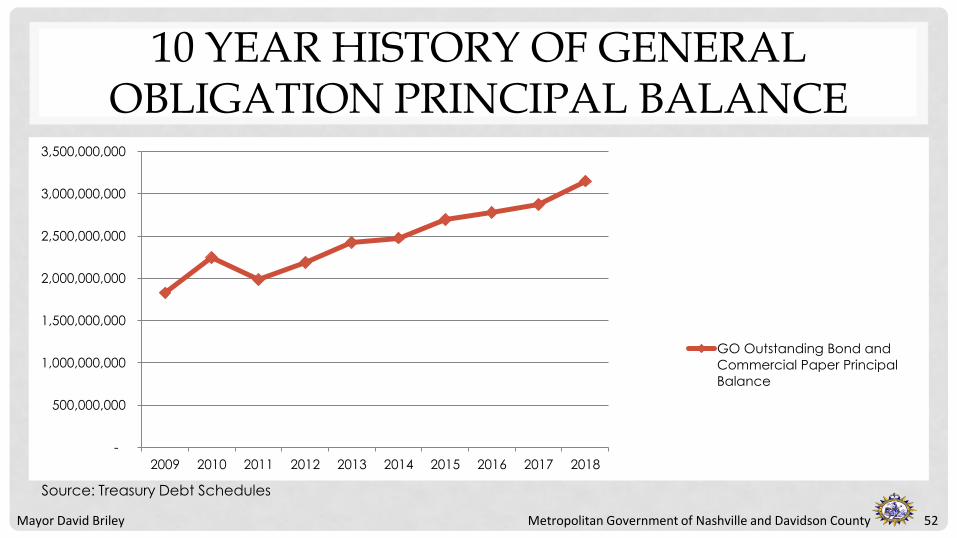
10 YEAR HISTORY OF GENERAL OBLIGATION PRINCIPAL BALANCE
52
-
500,000,000
1,000,000,000
1,500,000,000
2,000,000,000
2,500,000,000
3,000,000,000
3,500,000,000
2009 2010 2011 2012 2013 2014 2015 2016 2017 2018
GO Outstanding Bond and
Commercial Paper Principal
Balance
Source: Treasury Debt Schedules

53Metropolitan Government of Nashville and Davidson CountyMayor David Briley
10 YEAR HISTORY OF WATER AND SEWER PRINCIPAL BALANCE
53
-
200,000,000
400,000,000
600,000,000
800,000,000
1,000,000,000
1,200,000,000
2009 2010 2011 2012 2013 2014 2015 2016 2017 2018
Water and Sewer Outstanding Bond andCommercial Paper Principal
Source: Treasury Debt Schedules
54Metropolitan Government of Nashville and Davidson CountyMayor David Briley
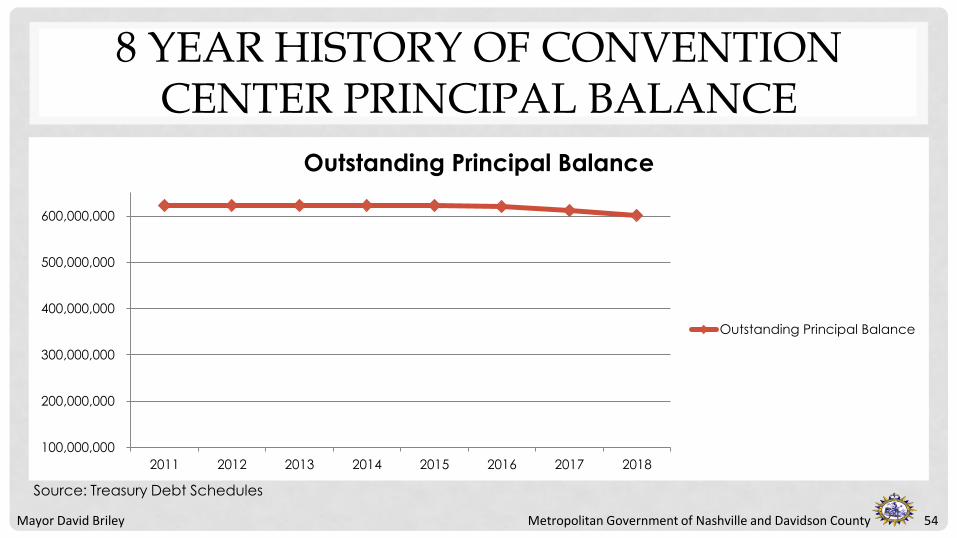
8 YEAR HISTORY OF CONVENTION CENTER PRINCIPAL BALANCE
54
100,000,000
200,000,000
300,000,000
400,000,000
500,000,000
600,000,000
2011 2012 2013 2014 2015 2016 2017 2018
Outstanding Principal Balance
Outstanding Principal Balance
Source: Treasury Debt Schedules

55Metropolitan Government of Nashville and Davidson CountyMayor David Briley
10 YEAR HISTORY OF SPORTS AUTHORITY PRINCIPAL BALANCE
55
-
20,000,000
40,000,000
60,000,000
80,000,000
100,000,000
120,000,000
140,000,000
160,000,000
180,000,000
2009 2010 2011 2012 2013 2014 2015 2016 2017 2018
Sports Authority Principal Balance
Source: Treasury Debt Schedules

56Metropolitan Government of Nashville and Davidson CountyMayor David Briley
5 YEAR HISTORY OF UNASSIGNED DEBT SERVICE FUND BALANCE
56
-
2,000,000
4,000,000
6,000,000
8,000,000
10,000,000
12,000,000
14,000,000
2014 2015 2016 2017 2018
GSD Debt Service
Schools Debt Service
USD Debt Service
Source: 2017 CAFR and 2019 Budget Ordinance

57Metropolitan Government of Nashville and Davidson CountyMayor David Briley
DEBT PRESENTATION
Capital Spending & Debt Capacity
57

58Metropolitan Government of Nashville and Davidson CountyMayor David Briley
CAPITAL SPENDING & CAPACITY
Capital spending plans are authorized by Council resolution becoming the “Initial resolution determining to issue general obligation bonds” that is required by State law
• Prior Council approved capital spending plans $3,316,178,000
• Bonds issued to finance approved capital spending $1,641,110,000
• Authorized capital spending less bonded $1,675,068,000
This amount represents currently authorized spending, and bonding, from previous Council resolutions
58
59Metropolitan Government of Nashville and Davidson CountyMayor David Briley
CAPITAL SPENDING & CAPACITY (CONT.)
• Commercial paper is used to finance capital spending expenses until bonds are issued
• In FY18, capital spending is averaging $39.4 million per month
• Based on this spending level we expect to issue bonds of $775 million in the Fall of 2018, $650 million in 2020 and $250 million in 2023 to fund the current level of authorized bonds
• Future capital spending plans or change in spending patterns could change these projections
59

60Metropolitan Government of Nashville and Davidson CountyMayor David Briley
FUTURE DEBT SERVICE TO FUND EXISTING AUTHORIZATIONS
PeriodEnding
Existing Debt Service
ProposedSeries 2018
ProposedSeries 2020
Proposed Series 2023
AggregateDebt Service
Change in Annual Debt Service from Prior Year
6/30/2019 $ 267,443,637 $ 11,734,250 $ - $ - $ 279,177,887 $ 24,369,786
6/30/2020 267,440,594 55,677,750 - - 323,118,344 43,940,457
6/30/2021 267,442,369 55,685,625 19,840,365 - 342,968,359 19,850,014
6/30/2022 263,019,130 55,683,125 48,075,375 - 366,777,630 23,809,271
6/30/2023 264,023,194 55,682,625 48,075,375 - 367,781,194 1,003,564
6/30/2024 267,003,504 55,686,000 48,077,625 7,632,441 378,399,570 10,618,376
6/30/2025 258,394,862 55,685,125 48,074,750 18,492,875 380,647,612 2,248,042
6/30/2026 231,039,082 55,681,875 48,074,250 18,495,125 353,290,332 (27,357,280)
6/30/2027 208,513,173 55,682,750 48,078,250 18,494,000 330,768,173 (22,522,159)
6/30/2028 198,215,097 55,684,000 48,074,000 18,493,625 320,466,722 (10,301,451)
6/30/2029 150,551,871 55,681,875 48,078,500 18,493,000 272,805,246 (47,661,477)
6/30/2030 149,999,134 55,682,375 48,078,500 18,496,000 272,256,009 (549,236)
6/30/2031 145,293,052 55,686,125 48,075,875 18,496,500 267,551,552 (4,704,457)
6/30/2032 144,702,406 55,683,750 48,077,125 18,493,500 266,956,781 (594,771)
6/30/2033 144,084,314 55,685,625 48,078,500 18,495,750 266,344,189 (612,592)
6/30/2034 102,854,450 55,681,875 48,076,250 18,496,875 225,109,450 (41,234,739)
6/30/2035 98,798,839 55,682,375 48,076,375 18,495,625 221,053,214 (4,056,236)
6/30/2036 35,288,600 55,681,625 48,074,625 18,495,625 157,540,475 (63,512,739)
6/30/2037 35,286,900 55,683,875 48,076,500 18,495,375 157,542,650 2,175
6/30/2038 - 55,683,125 48,077,250 18,493,375 122,253,750 (35,288,900)
6/30/2039 - 55,683,125 48,077,000 18,493,000 122,253,125 (625)
6/30/2040 - - 48,075,625 18,492,500 66,568,125 (55,685,000)
6/30/2041 - - 48,077,625 18,495,000 66,572,625 4,500
6/30/2042 - - - 18,493,625 18,493,625 (48,079,000)
6/30/2043 - - - 18,496,375 18,496,375 2,750
6/30/2044 - - - 18,496,125 18,496,125 (250)
$ 3,499,394,209 $ 1,125,398,875 $ 981,369,740 $ 377,526,316 $ 5,983,689,140 $ (236,311,976)
60Source: Hilltop Securities
61Metropolitan Government of Nashville and Davidson CountyMayor David Briley
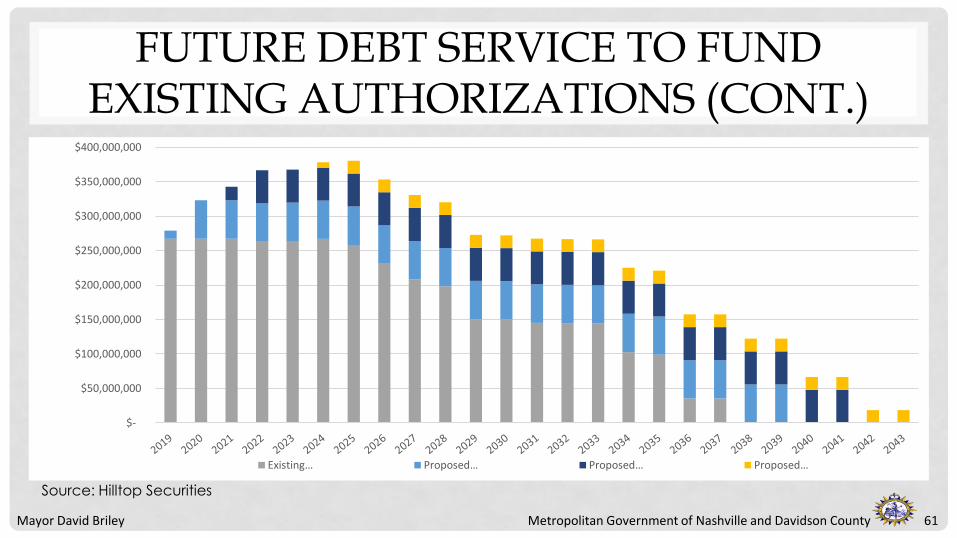
FUTURE DEBT SERVICE TO FUND EXISTING AUTHORIZATIONS (CONT.)
61
$-
$50,000,000
$100,000,000
$150,000,000
$200,000,000
$250,000,000
$300,000,000
$350,000,000
$400,000,000
Existing… Proposed… Proposed… Proposed…
Source: Hilltop Securities
62Metropolitan Government of Nashville and Davidson CountyMayor David Briley
CAPITAL SPENDING & CAPACITY (CONT.)
• Debt capacity is the ability to fund future principal and interest (debt service) of debt
• Any new initial bond authorization is a commitment to fund the resulting debt service
• Bonds and commercial paper (bond anticipation notes) issued from prior initial bond authorizations are legal obligations that must be paid
62

63Metropolitan Government of Nashville and Davidson CountyMayor David Briley
CAPITAL SPENDING & CAPACITY (CONT.)
• Future revenue growth does not increase debt capacity
• Annual budgets must, by State law, fund the government’s debt obligations
• Metro’s obligation to bondholders as summarized from bond documents The Metropolitan Government of Nashville and Davidson County promises
to pay the principal amount on the maturity date and interest on the principal amount until maturity or redemption date
63

64Metropolitan Government of Nashville and Davidson CountyMayor David Briley
QUESTIONS?
?64